
Understanding Nonlinear Pulse Propagation in Liquid Strand-Based Photonic Bandgap Fibers

 ,
,  , , and
Abstract
:1. Introduction
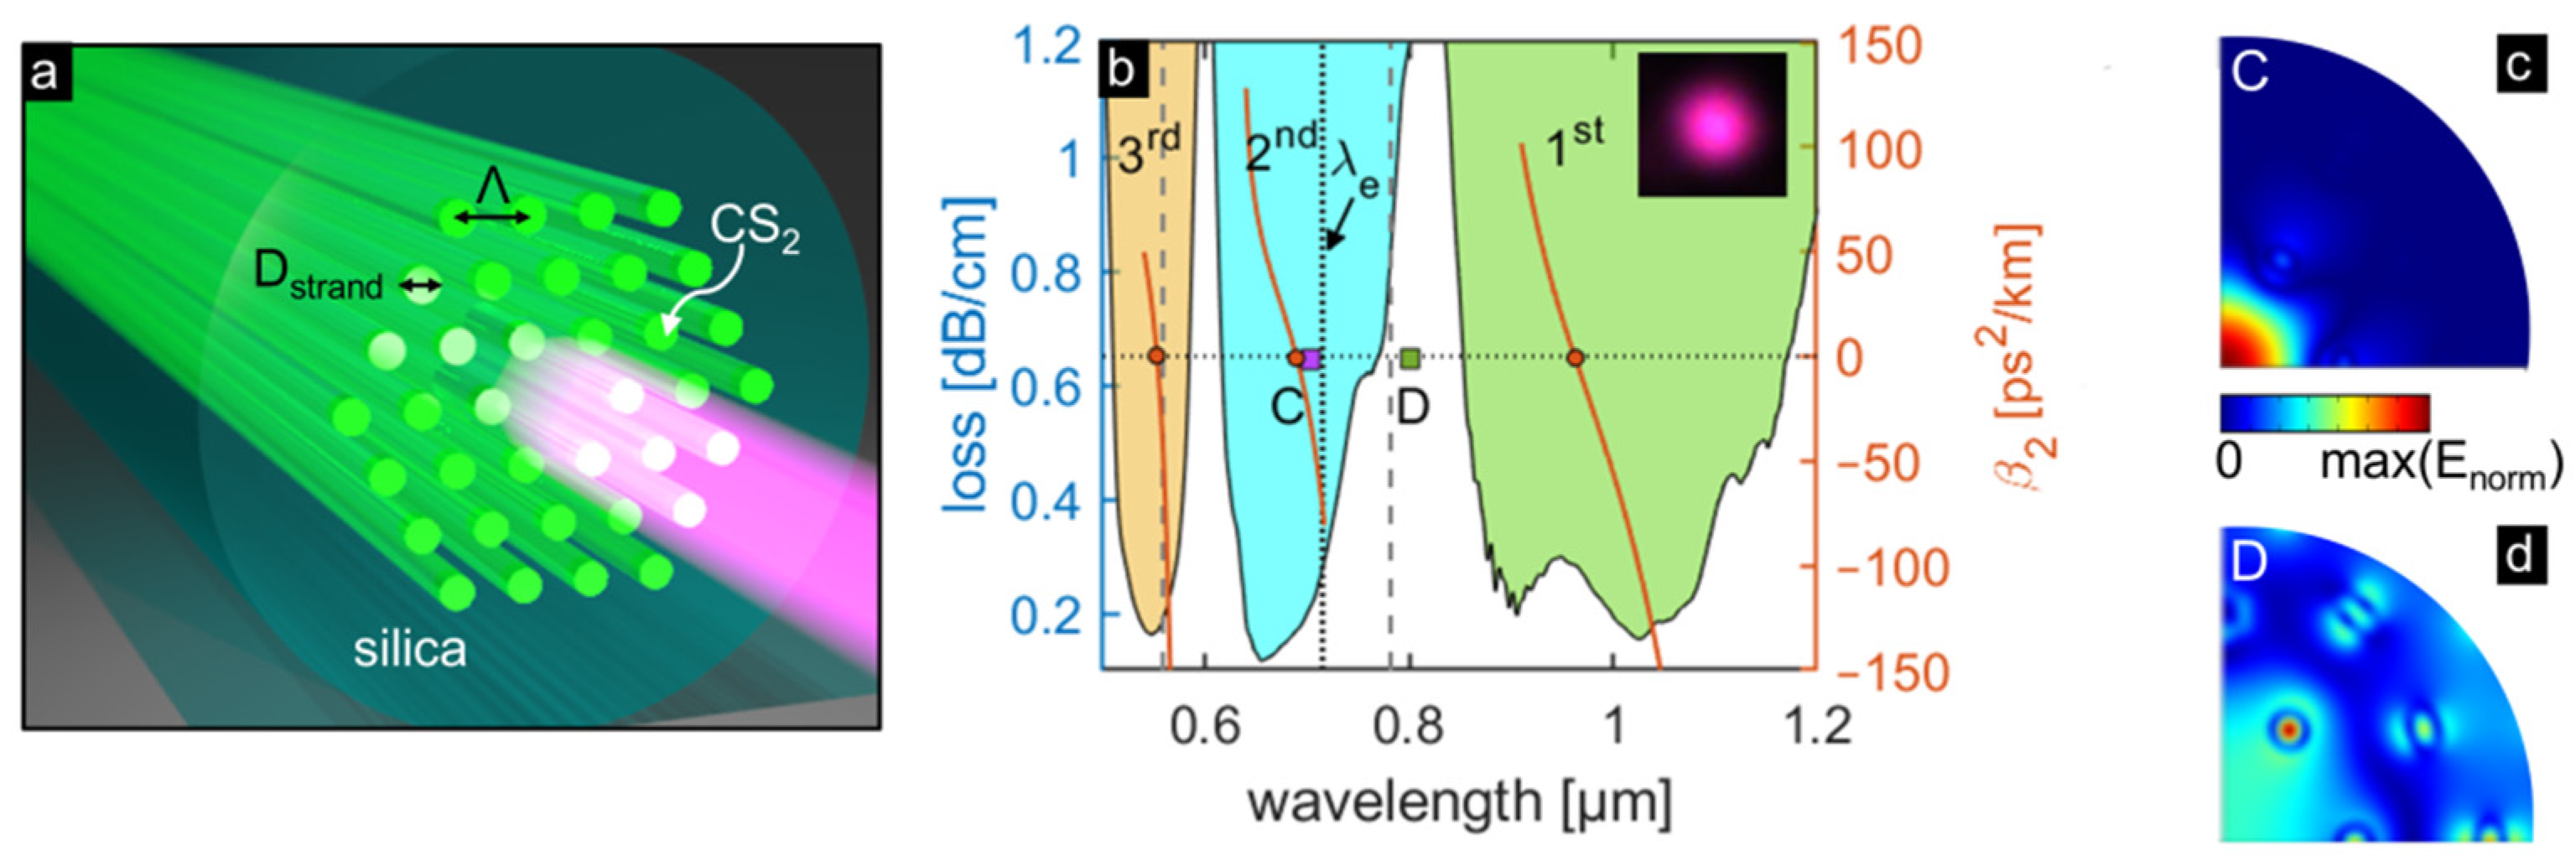
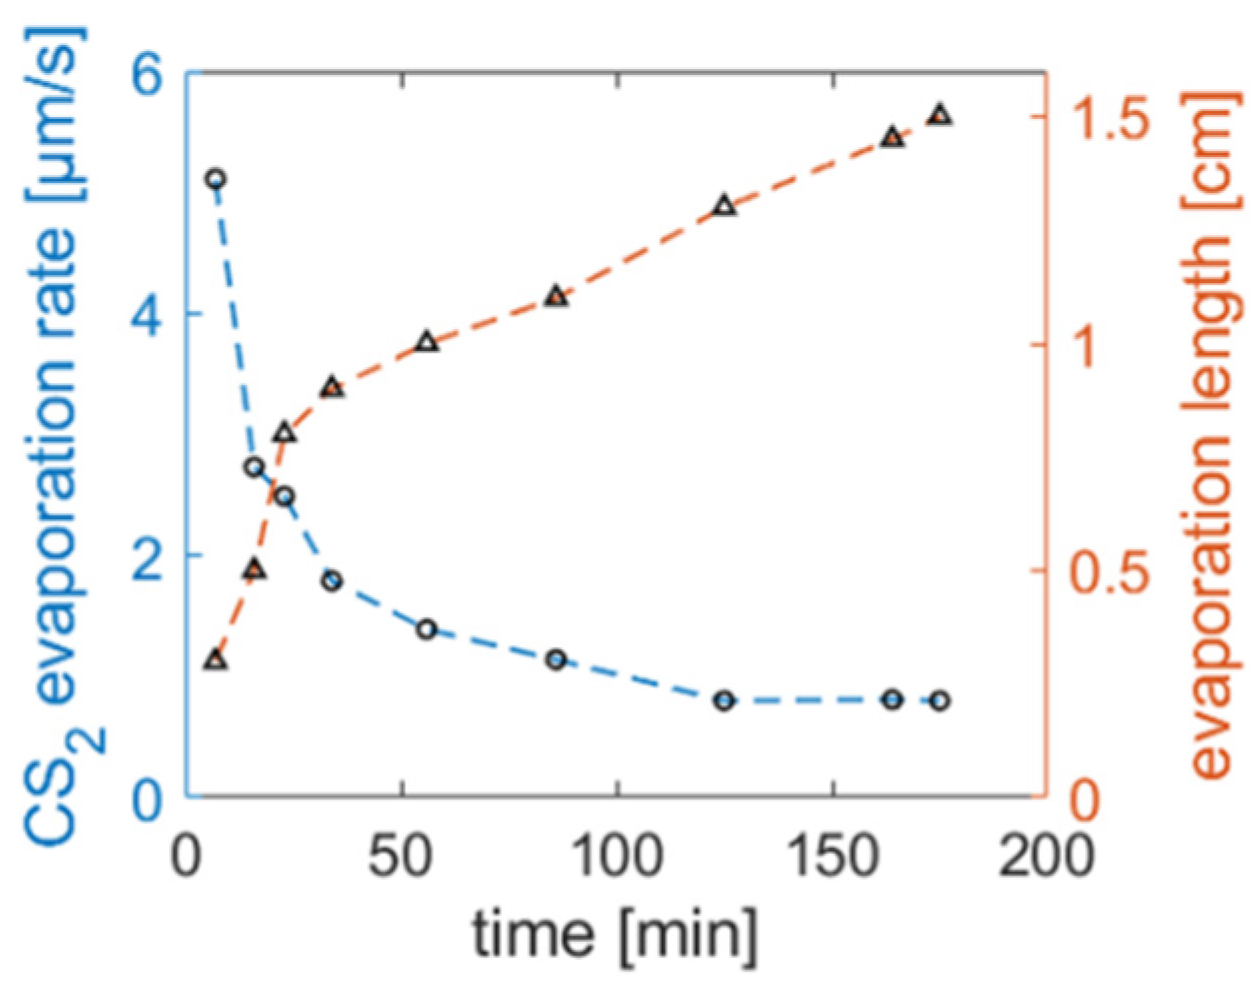
2. Optical Properties of Liquid Strand Bandgap Fiber
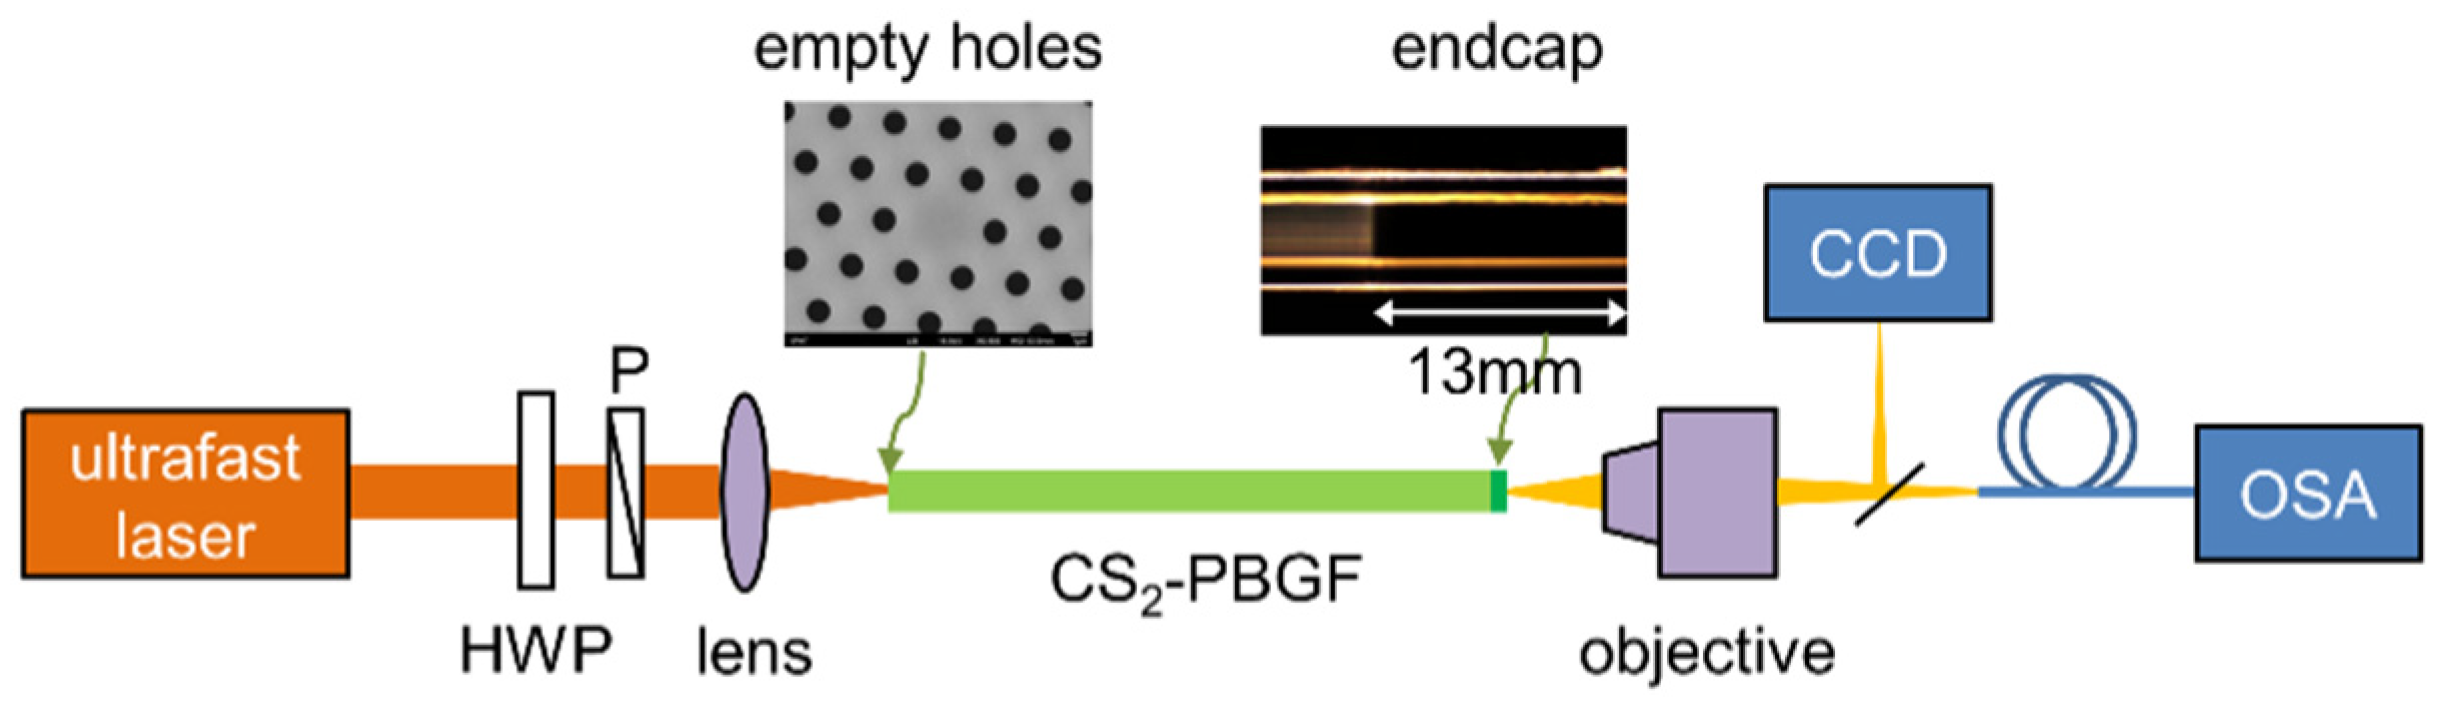
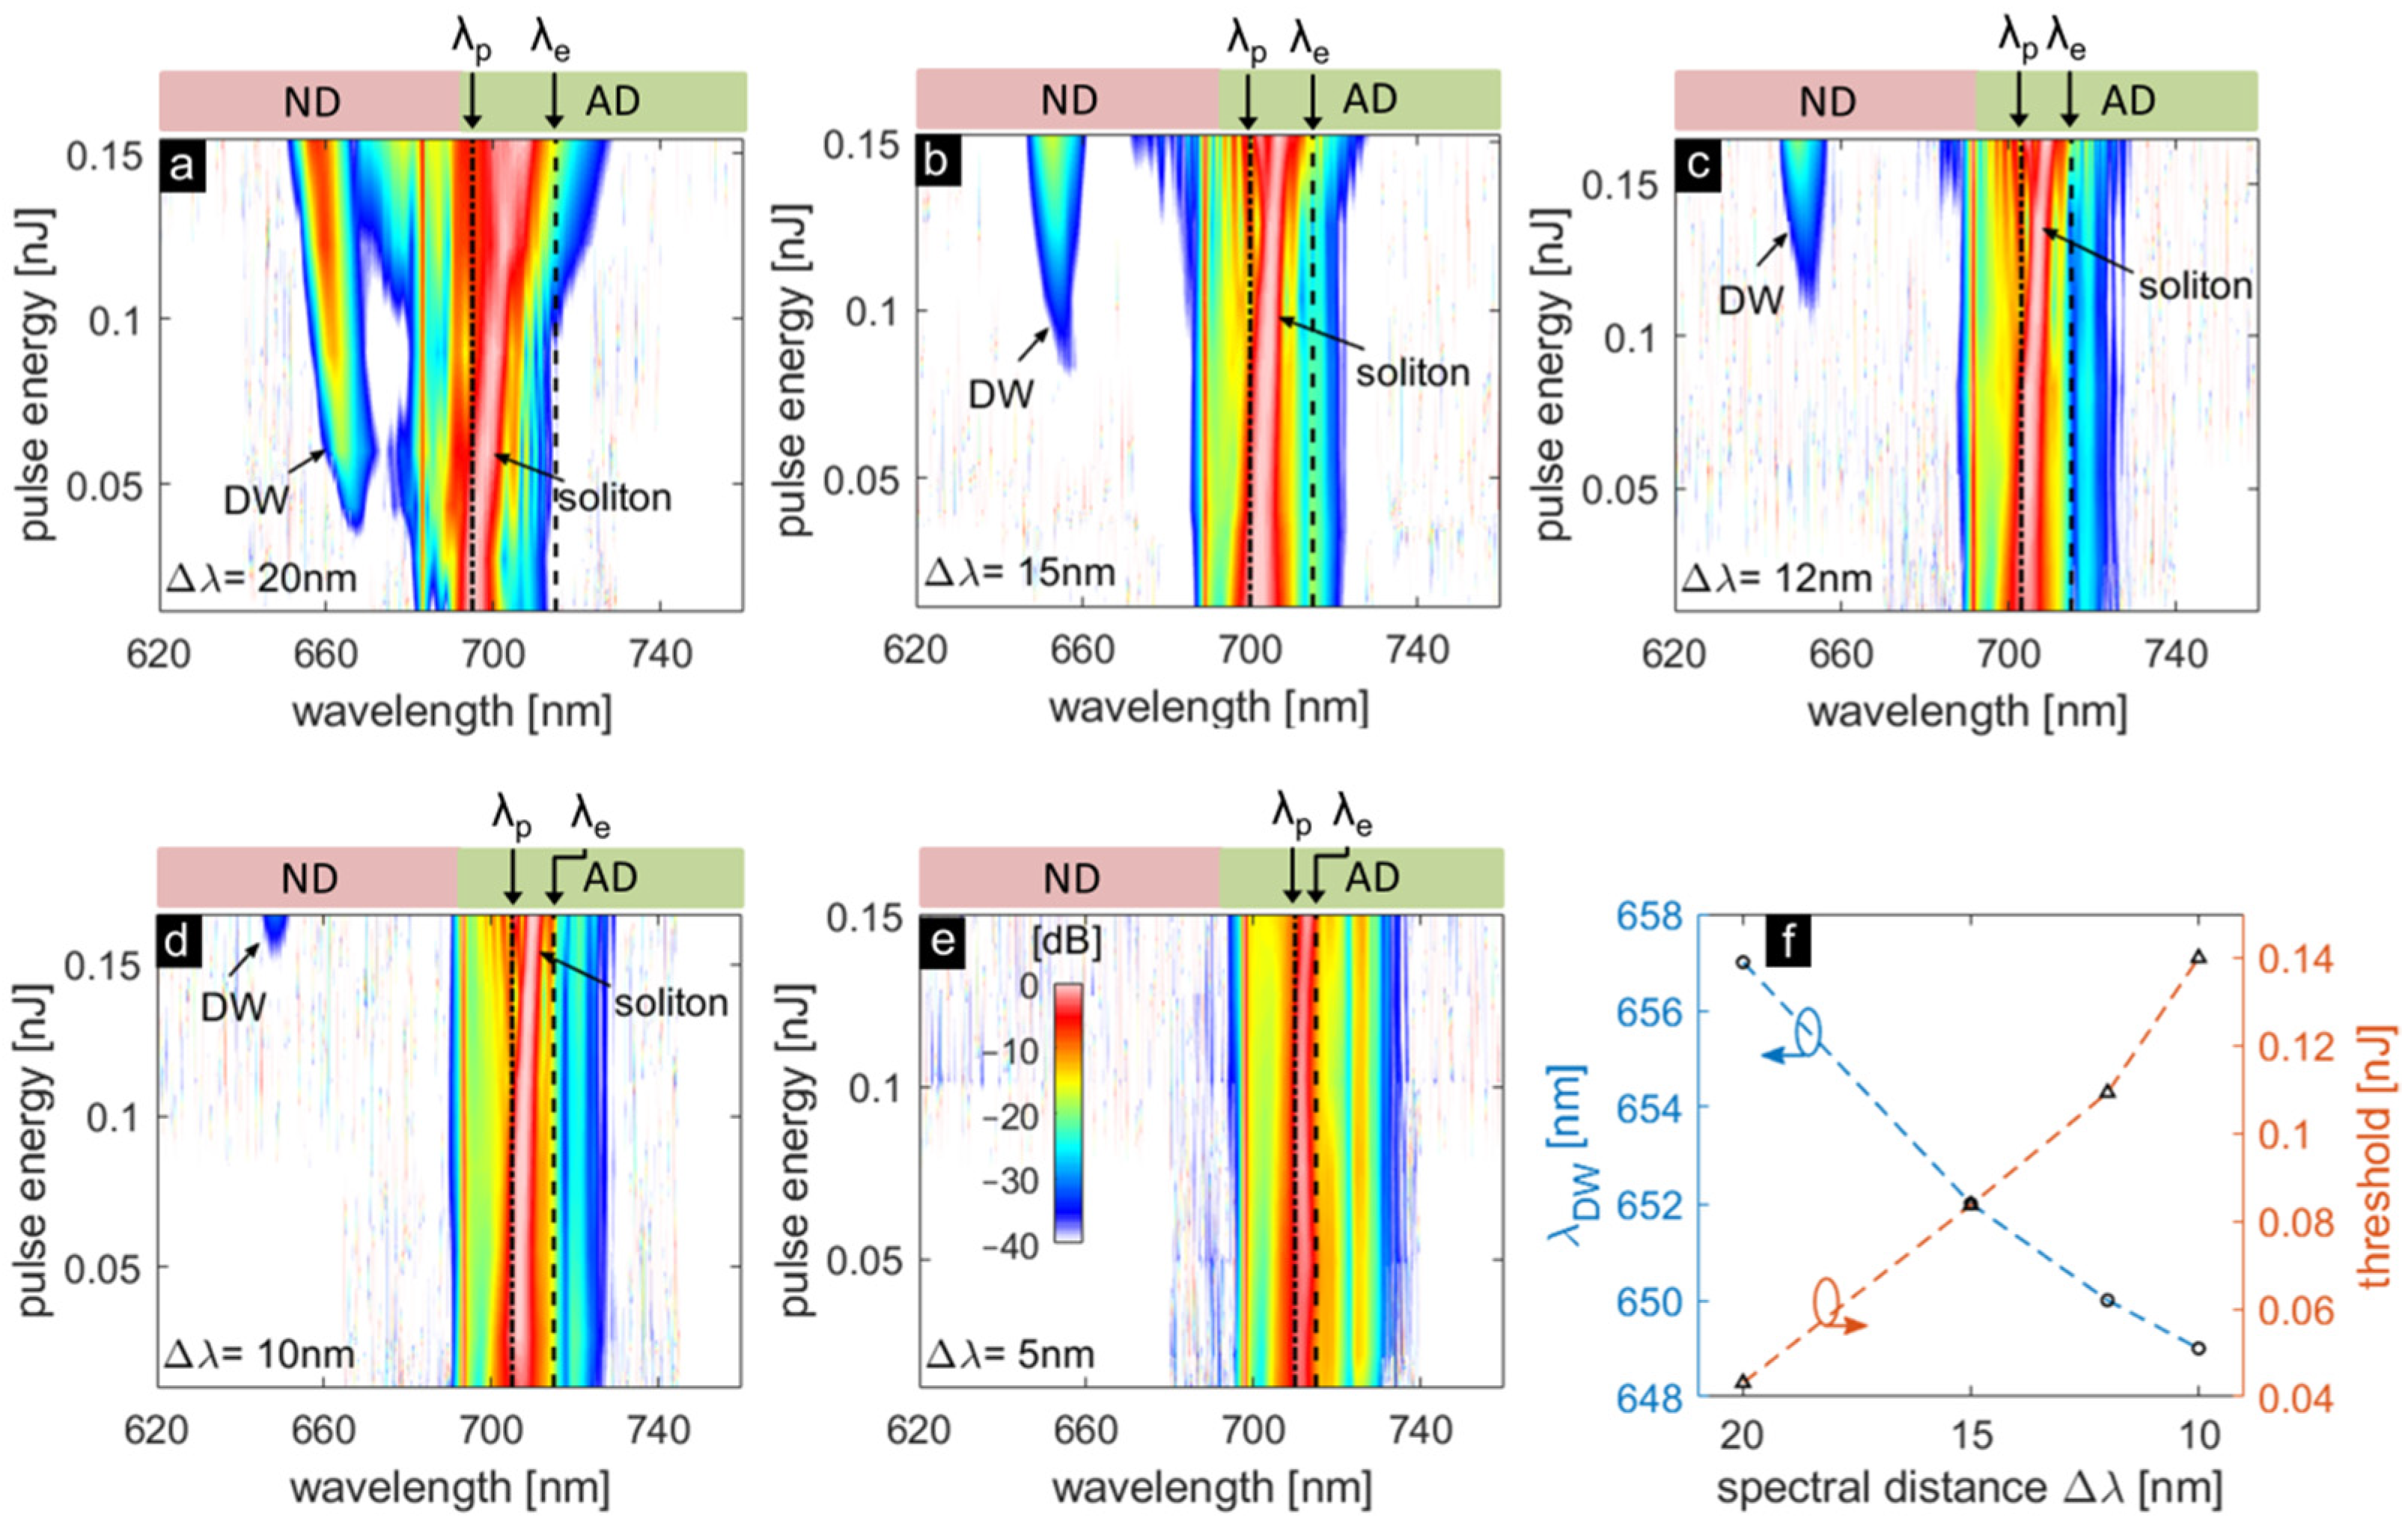
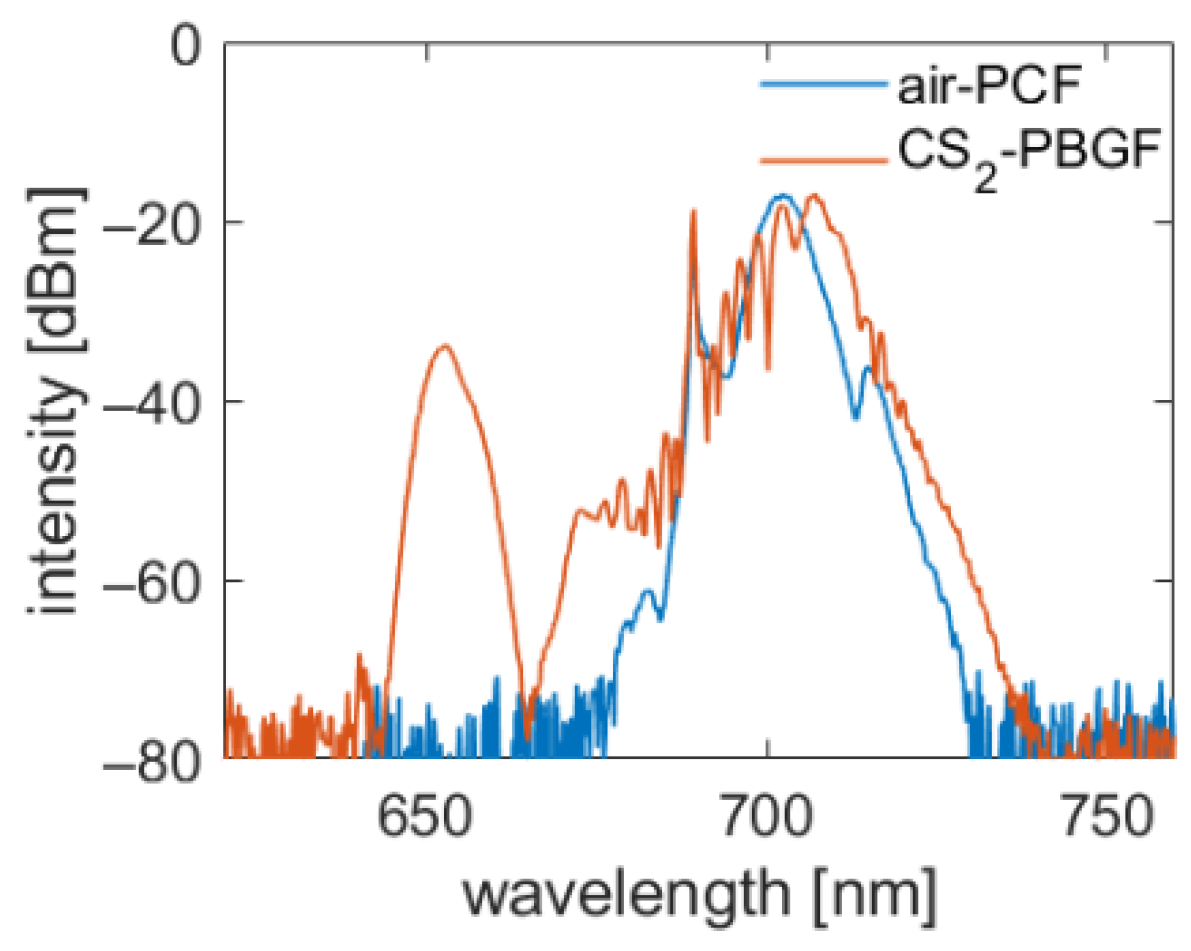
3. Nonlinear Experiments—DW Generation
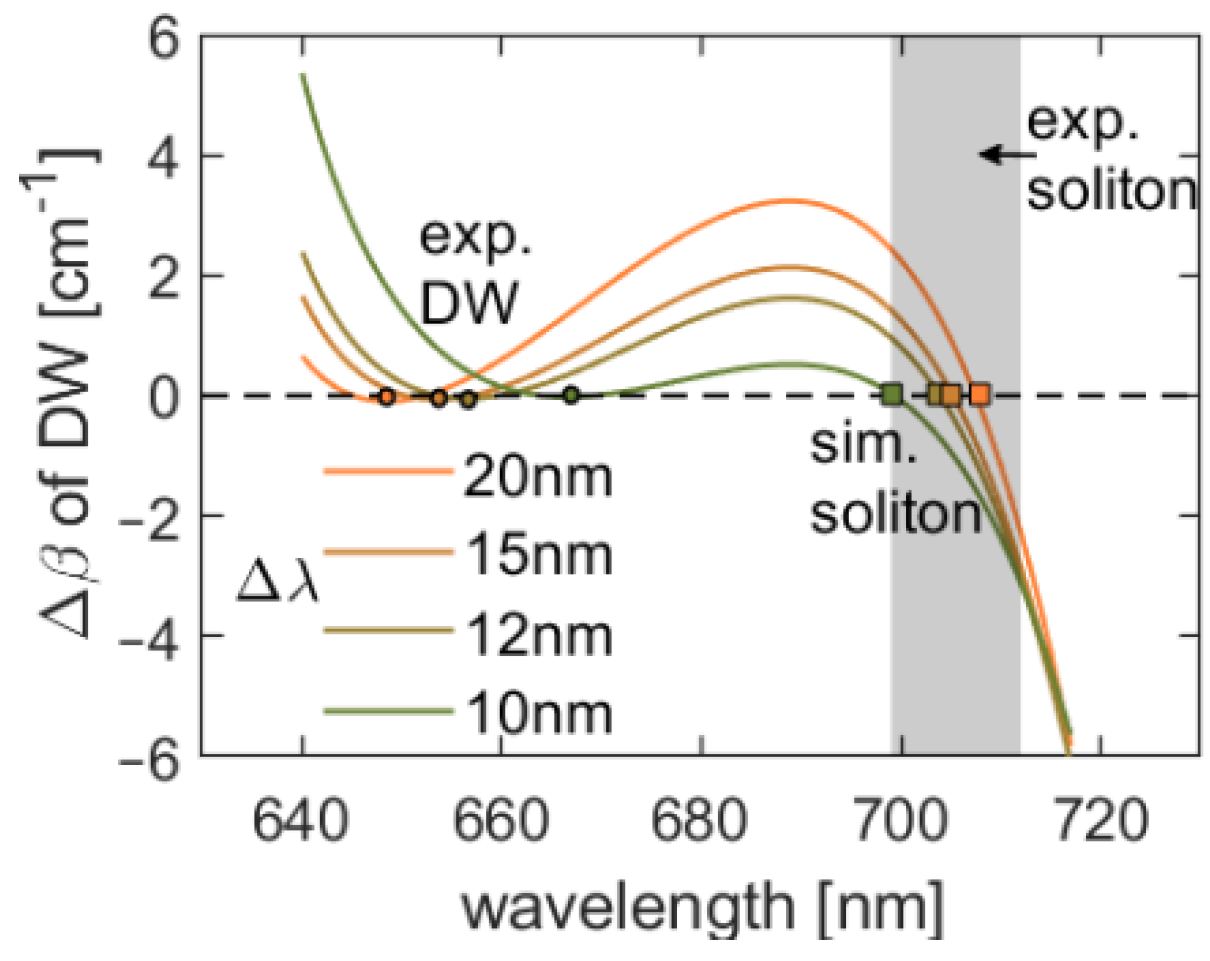
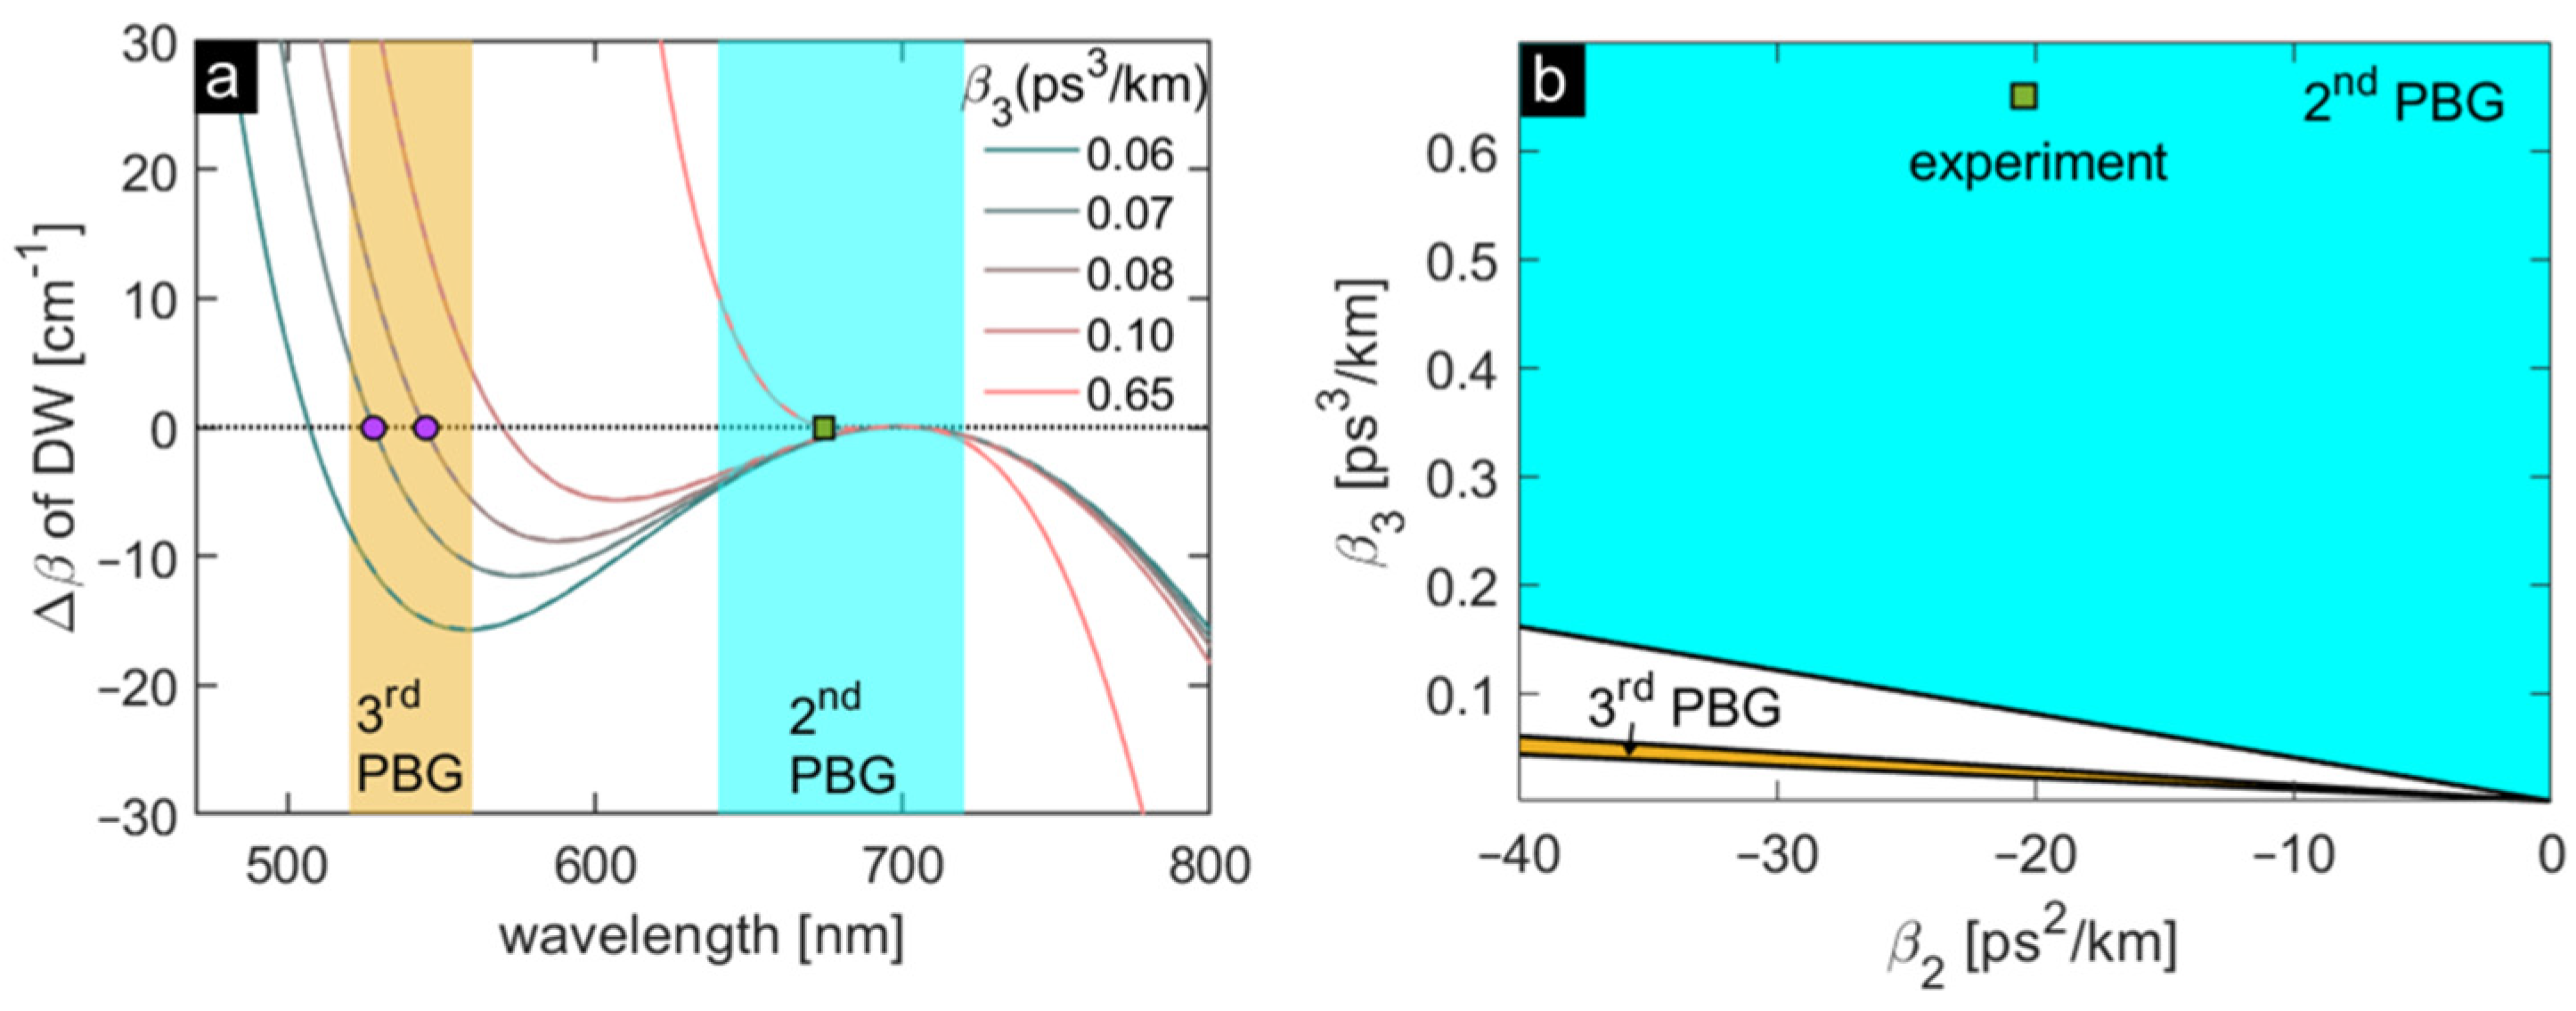
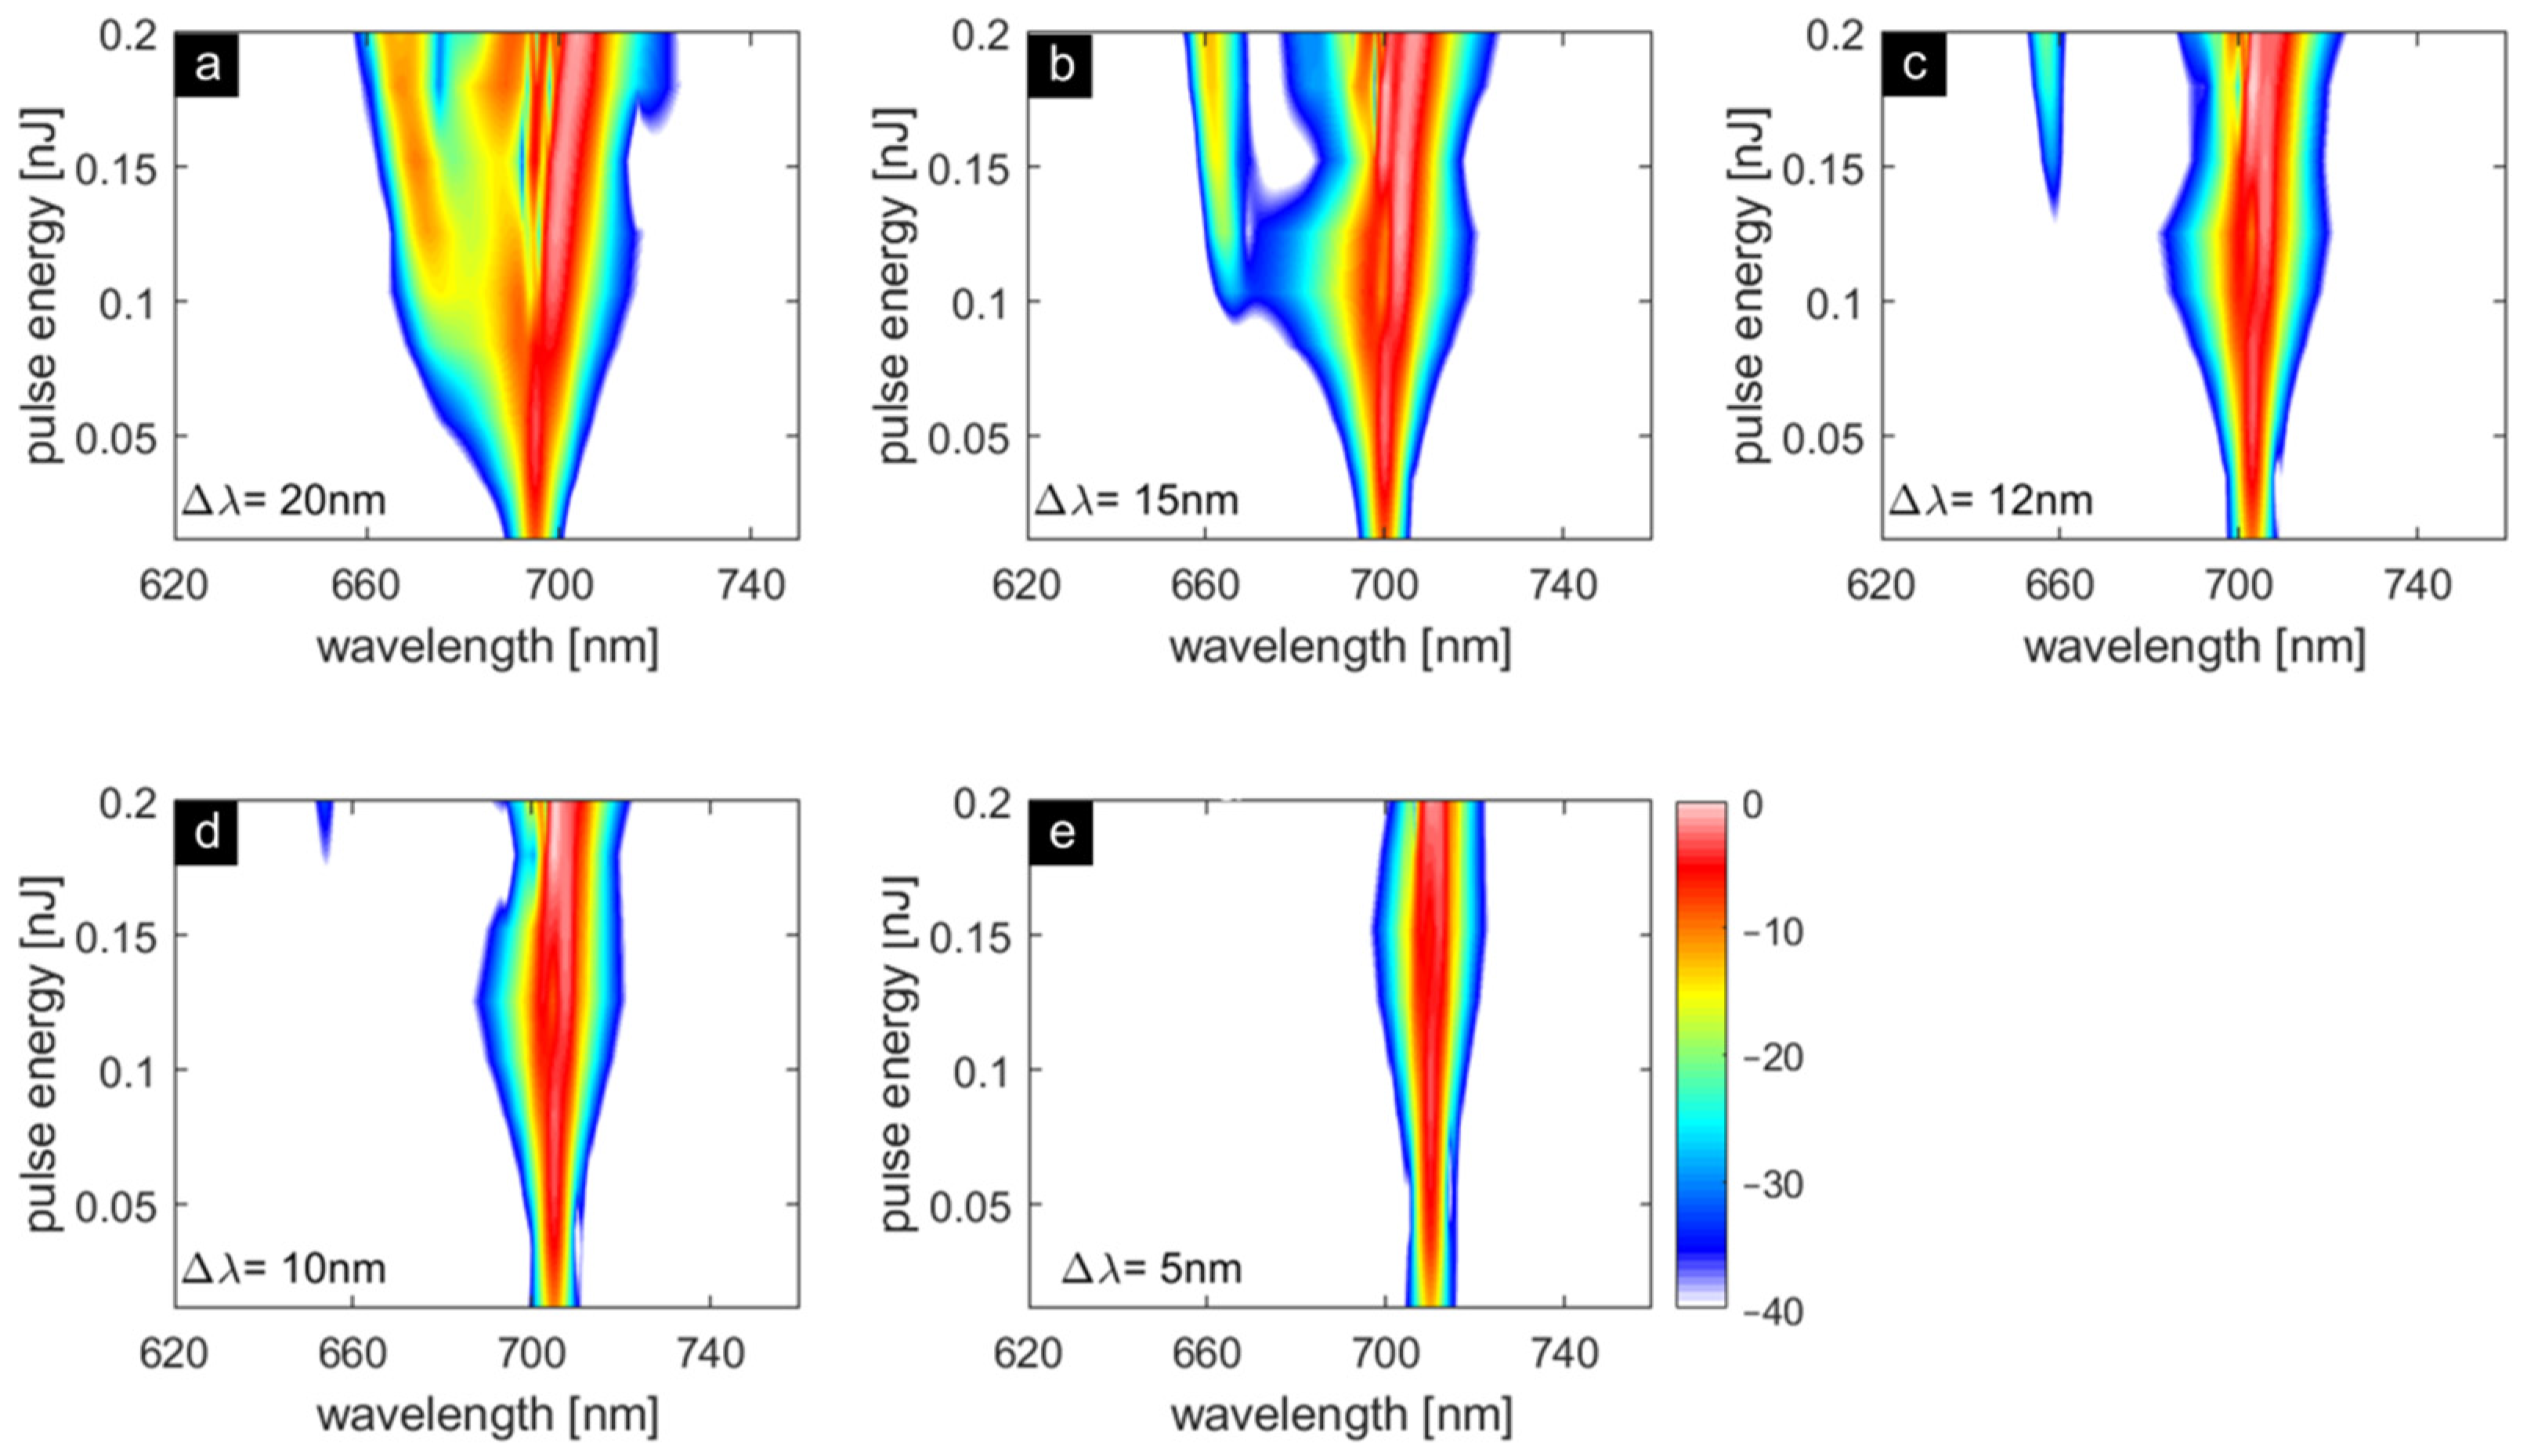
4. Discussion
5. Conclusions
Author Contributions
Funding
Institutional Review Board Statement
Informed Consent Statement
Data Availability Statement
Acknowledgments
Conflicts of Interest
Appendix A


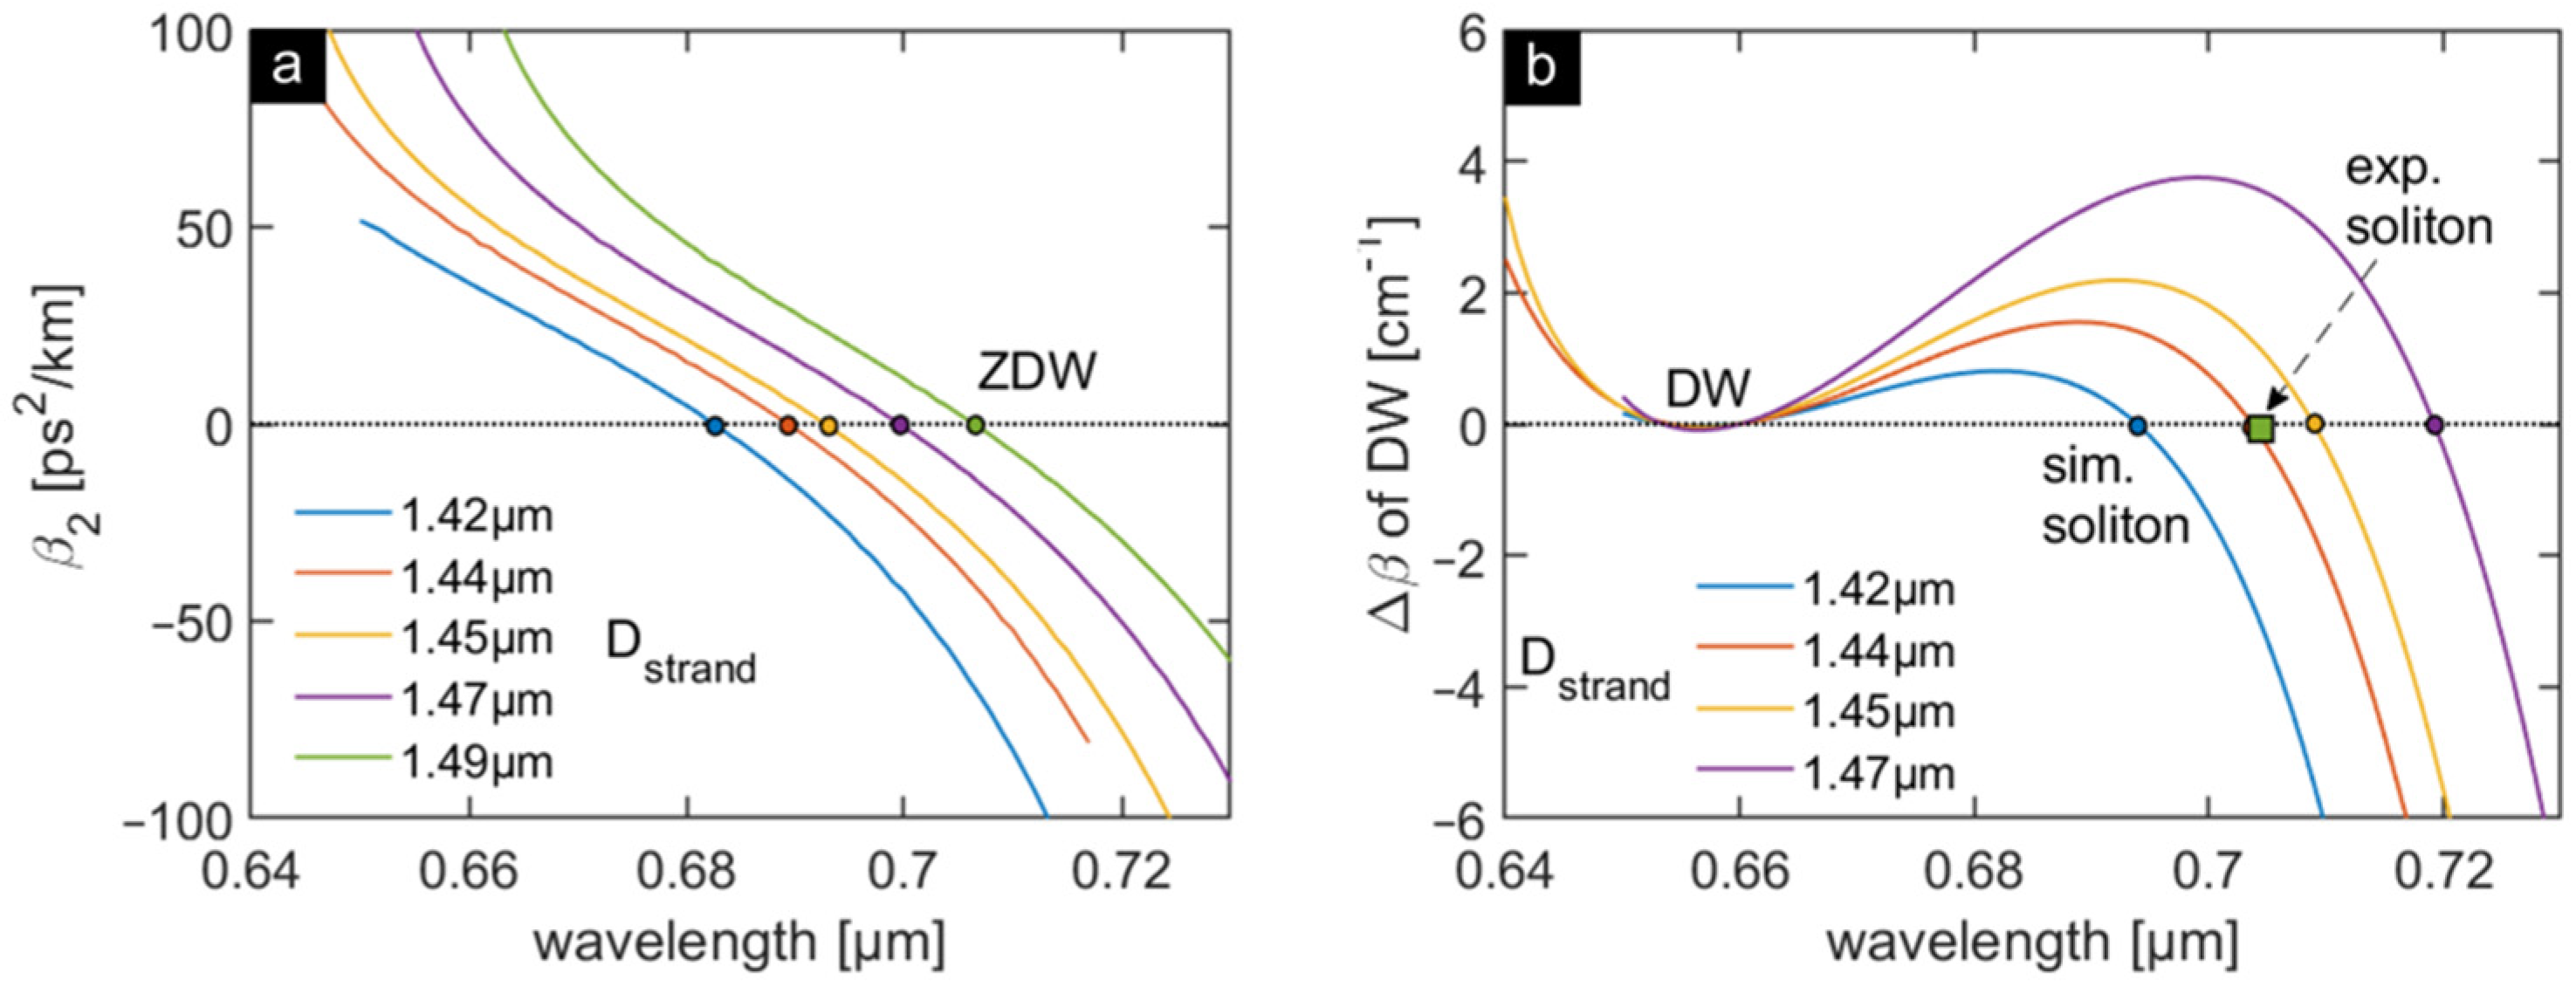
| Dstrand (µm) | 1.42 | 1.44 | 1.45 | 1.47 | 1.49 |
|---|---|---|---|---|---|
| Deviation from 1.44 µm | −1.4% | 0% | +0.7% | +2.1% | +3.5% |
| ZDW (nm) | 683 | 689 | 693 | 700 | 706 |
| Calculated λsol with Equation (2) (nm) | 694 | 704 | 709 | 719 | - |
References
- Russell, P. Photonic Crystal Fibers. Science 2003, 299, 358–362. [Google Scholar] [CrossRef]
- Birks, T.A.; Knight, J.C.; Russell, P.S.J. Endlessly single-mode photonic crystal fiber. Opt. Lett. 1997, 22, 961–963. [Google Scholar] [CrossRef]
- Husakou, A.V.; Herrmann, J. Supercontinuum Generation of Higher-Order Solitons by Fission in Photonic Crystal Fibers. Phys. Rev. Lett. 2001, 87, 203901. [Google Scholar] [CrossRef] [PubMed] [Green Version]
- Dudley, J.M.; Genty, G.; Coen, S. Supercontinuum Generation in Photonic Crystal Fibre. Rev. Mod. Phys. 2006, 78, 1135–1184. [Google Scholar] [CrossRef]
- Qi, X.; Chen, S.; Li, Z.; Liu, T.; Ou, Y.; Wang, N.; Hou, J. High-power visible-enhanced all-fiber supercontinuum generation in a seven-core photonic crystal fiber pumped at 1016 nm. Opt. Lett. 2018, 43, 1019. [Google Scholar] [CrossRef] [PubMed]
- Steinvurzel, P.; Eggleton, B.J.; de Sterke, C.M.; Steel, M.J. Continuously tunable bandpass filtering using high-index inclusion microstructured optical fibre. Electron. Lett. 2005, 41, 463. [Google Scholar] [CrossRef]
- Bise, R.T.; Windeler, R.; Kranz, K.S.; Kerbage, C.; Eggleton, B.J.; Trevor, D.J. Tunable photonic band gap fiber. In Proceedings of the Optical Fiber Communications Conference, Anaheim, CA, USA, 17–22 March 2002. [Google Scholar] [CrossRef]
- Schmidt, M.A.; Granzow, N.; Da, N.; Peng, M.; Wondraczek, L.; Russell, P.S.J. All-solid bandgap guiding in tellurite-filled silica photonic crystal fibers. Opt. Lett. 2009, 34, 1946. [Google Scholar] [CrossRef]
- Granzow, N.; Schmidt, M.A.; Tverjanovich, A.S.; Wondraczek, L.; Russell, P.S.J. Band-gap guidance in chalcogenide-silica photonic crystal fibers. Opt. Lett. 2011, 36, 2432–2434. [Google Scholar] [CrossRef]
- Litchinitser, N.M.; Dunn, S.C.; Steinvurzel, P.E.; Eggleton, B.J.; White, T.P.; McPhedran, R.C.; Martijn de Sterke, C. Application of an ARROW model for designing tunable photonic devices. Opt. Express 2004, 12, 1540. [Google Scholar] [CrossRef] [PubMed] [Green Version]
- Cheng, L.; Wu, J.J.; Hu, X.W.; Peng, J.G.; Yang, L.Y.; Dai, N.L.; Li, J.Y. Ultrahigh Temperature Sensitivity Using Photonic Bandgap Effect in Liquid-Filled Photonic Crystal Fibers. IEEE Photonics J. 2017, 9, 1–7. [Google Scholar] [CrossRef]
- Lin, C.; Wang, Y.; Huang, Y.; Liao, C.; Bai, Z.; Hou, M.; Li, Z.; Wang, A.Y. Liquid modified photonic crystal fiber for simultaneous temperature and strain measurement. Photonics Res. 2017, 5, 129–133. [Google Scholar] [CrossRef]
- Lühder, T.A.K.; Schaarschmidt, K.; Goerke, S.; Schartner, E.P.; Ebendorff-Heidepriem, H.; Schmidt, M.A. Resonance-Induced Dispersion Tuning for Tailoring Nonsolitonic Radiation via Nanofilms in Exposed Core Fibers. Laser Photonics Rev. 2020, 1900418. [Google Scholar] [CrossRef]
- Zeisberger, M.; Schmidt, M.A. Analytic model for the complex effective index of the leaky modes of tube-type anti-resonant hollow core fibers. Sci. Rep. 2017, 7, 1–14. [Google Scholar] [CrossRef] [PubMed] [Green Version]
- Zeisberger, M.; Hartung, A.; Schmidt, M. Understanding Dispersion of Revolver-Type Anti-Resonant Hollow Core Fibers. Fibers 2018, 6, 68. [Google Scholar] [CrossRef] [Green Version]
- Bétourné, A.; Kudlinski, A.; Bouwmans, G.; Vanvincq, O.; Mussot, A.; Quiquempois, Y. Control of supercontinuum generation and soliton self-frequency shift in solid-core photonic bandgap fibers. Opt. Lett. 2009, 34, 3083. [Google Scholar] [CrossRef] [PubMed]
- Vanvincq, O.; Kudlinski, A.; Bétourné, A.; Mussot, A.; Quiquempois, Y.; Bouwmans, G. Manipulating the Propagation of Solitons with Solid-Core Photonic Bandgap Fibers. Int. J. Opt. 2012, 2012, 1–12. [Google Scholar] [CrossRef]
- Sollapur, R.; Kartashov, D.; Zürch, M.; Hoffmann, A.; Grigorova, T.; Sauer, G.; Hartung, A.; Schwuchow, A.; Bierlich, J.; Kobelke, J.; et al. Resonance-enhanced multi-octave supercontinuum generation in antiresonant hollow-core fibers. Light Sci. Appl. 2017, 6, e17124. [Google Scholar] [CrossRef] [Green Version]
- Fuerbach, A.; Steinvurzel, P.; Bolger, J.A.; Nulsen, A.; Eggleton, B.J. Nonlinear propagation effects in antiresonant high-index inclusion photonic crystal fibers. Opt. Lett. 2005, 30, 830. [Google Scholar] [CrossRef]
- Fuerbach, A.; Steinvurzel, P.; Bolger, J.A.; Eggleton, B.J. Nonlinear pulse propagation at zero dispersion wavelength in anti-resonant photonic crystal fibers. Opt. Express 2005, 13, 2977–2987. [Google Scholar] [CrossRef] [Green Version]
- Kibler, B.; Martynkien, T.; Szpulak, M.; Finot, C.; Fatome, J.; Wojcik, J.; Urbanczyk, W.; Wabnitz, S. Nonlinear femtosecond pulse propagation in an all-solid photonic bandgap fiber. Opt. Express 2009, 17, 10393. [Google Scholar] [CrossRef] [Green Version]
- Arismar Cerqueira, S., Jr.; Cordeiro, C.M.B.; Biancalana, F.; Roberts, P.J.; Hernandez-Figueroa, H.E.; Cruz, C.H.B. Nonlinear interaction between two different photonic bandgaps of a hybrid photonic crystal fiber. Opt. Lett. 2008, 33, 2080. [Google Scholar] [CrossRef] [Green Version]
- Arismar Cerqueira, S.; do Nascimento, A.R.; Bonomini, I.A.M.; Franco, M.A.R.; Serrão, V.A.; Cordeiro, C.M.B. Strong power transfer between photonic bandgaps of hybrid photonic crystal fibers. Opt. Fiber Technol. 2015, 22, 36–41. [Google Scholar] [CrossRef]
- Pureur, V.; Dudley, J.M. Nonlinear spectral broadening of femtosecond pulses in solid-core photonic bandgap fibers. Opt. Lett. 2010, 35, 2813. [Google Scholar] [CrossRef]
- Laesecke, A.; Muzny, C.D. Reference Correlation for the Viscosity of Carbon Dioxide. J. Phys. Chem. Ref. Data 2017, 46, 013107. [Google Scholar] [CrossRef] [PubMed] [Green Version]
- Washburn, E.W. The Dynamics of Capillary Flow. Phys. Rev. 1921, 17, 273–283. [Google Scholar] [CrossRef]
- Chemnitz, M.; Scheibinger, R.; Gaida, C.; Gebhardt, M.; Stutzki, F.; Pumpe, S.; Kobelke, J.; Tünnermann, A.; Limpert, J.; Schmidt, M.A. Thermodynamic control of soliton dynamics in liquid-core fibers. Optica 2018, 5, 695. [Google Scholar] [CrossRef]
- Grigorova, T.; Sollapur, R.; Hoffmann, A.; Hartung, A.; Schwuchow, A.; Bierlich, J.; Kobelke, J.; Schmidt, M.A.; Spielmann, C. Measurement of the Dispersion of an Antiresonant Hollow Core Fiber. IEEE Photonics J. 2018, 10. [Google Scholar] [CrossRef]
- Chemnitz, M.; Gaida, C.; Gebhardt, M.; Stutzki, F.; Kobelke, J.; Tünnermann, A.; Limpert, J.; Schmidt, M.A. Carbon chloride-core fibers for soliton mediated supercontinuum generation. Opt. Express 2018, 26, 3221. [Google Scholar] [CrossRef] [PubMed]
- Qi, X.; Schaarschmidt, K.; Chemnitz, M.; Schmidt, M.A. Essentials of resonance-enhanced soliton-based supercontinuum generation. Opt. Express 2020, 28, 2557. [Google Scholar] [CrossRef]
- Agrawal, G.P. Nonlinear Fiber Optics, 5th ed.; Elsevier: Burlington, MA, USA, 2007; ISBN 9780123970237. [Google Scholar]
- Dudley, J.M.; Taylor, R. Supercontinuum Generation in Optical Fibers; Cambridge University Press: Cambridge, UK, 2010; ISBN 9780521514804. [Google Scholar]


| Δλ | 20 nm | 15 nm | 12 nm | 10 nm | 5 nm |
|---|---|---|---|---|---|
| λsol (nm) | 699 | 704 | 708 | 710 | 712 |
| β2 (ps2/km) | −20.4 | −33.6 | −45.8 | −52.3 | −59.9 |
| β3 (ps3/km) | 0.65 | 0.76 | 1.00 | 1.13 | 1.15 |
Publisher’s Note: MDPI stays neutral with regard to jurisdictional claims in published maps and institutional affiliations. |
© 2021 by the authors. Licensee MDPI, Basel, Switzerland. This article is an open access article distributed under the terms and conditions of the Creative Commons Attribution (CC BY) license (http://creativecommons.org/licenses/by/4.0/).
Share and Cite
Qi, X.; Schaarschmidt, K.; Li, G.; Junaid, S.; Scheibinger, R.; Lühder, T.; Schmidt, M.A. Understanding Nonlinear Pulse Propagation in Liquid Strand-Based Photonic Bandgap Fibers. Crystals 2021, 11, 305. https://doi.org/10.3390/cryst11030305
Qi X, Schaarschmidt K, Li G, Junaid S, Scheibinger R, Lühder T, Schmidt MA. Understanding Nonlinear Pulse Propagation in Liquid Strand-Based Photonic Bandgap Fibers. Crystals. 2021; 11(3):305. https://doi.org/10.3390/cryst11030305
Chicago/Turabian StyleQi, Xue, Kay Schaarschmidt, Guangrui Li, Saher Junaid, Ramona Scheibinger, Tilman Lühder, and Markus A. Schmidt. 2021. "Understanding Nonlinear Pulse Propagation in Liquid Strand-Based Photonic Bandgap Fibers" Crystals 11, no. 3: 305. https://doi.org/10.3390/cryst11030305