
Effect of Ni, N Co-Doped on Properties of AgSnO2 Contact Materials

1
State Key Laboratory of Reliability and Intelligence of Electrical Equipment, Hebei University of Technology, Tianjin 300130, China
2
Shanghai Liangxin Electrical Co., Ltd, Shanghai 200120, China
3
Suzhou Electrical Apparatus Research Institute Co., Ltd, Suzhou 215104, China
4
Wenzhou Juxing Technology Co., Ltd, Wenzhou 325062, China
*
Author to whom correspondence should be addressed.
Crystals 2021, 11(6), 707; https://doi.org/10.3390/cryst11060707
Submission received: 14 May 2021
/
Revised: 8 June 2021
/
Accepted: 18 June 2021
/
Published: 20 June 2021
Abstract
:The first-principles method based on density functional theory was used to analyze the impurity formation energies, energy bands, density of states, electron overlap population and elastic modulus of SnO2, SnO2–Ni, SnO2–N and SnO2–Ni–N. SnO2 powders with different additives were prepared by the sol-gel method, and then X-ray diffraction experiments and wettability experiments were carried out. The powder metallurgy method was used to prepare AgSnO2 contacts with different additives. The simulation experiments on hardness, electrical conductivity and electrical contact were carried out. The simulation results show that the conductivity of Ni–N co-doped SnO2 is best, and more impurity levels are introduced into the forbidden band, thereby increasing the carrier concentration, reducing the band gap, and improving the conductivity. The experimental results show that Ni, N doping does not change the structure of SnO2, so doped SnO2 still belongs to the tetragonal system. Ni–N co-doping can better improve the wettability between SnO2 and Ag, reduce the accumulation of SnO2 on the contact surface and reduce the contact resistance. Ni–N co-doped SnO2 has the smallest hardness, improving ductility, molding and service life of the AgSnO2 contact material.
1. Introduction
With the excellent arc erosion resistance, abrasion resistance, switch operation characteristics and good resistance to welding, AgSnO2 has become a promising material to replace AgCdO electrical contact materials [1]. However, AgSnO2 contact material has many shortcomings such as large contact resistance, high temperature rise, and processing difficulties, which limit its use. SnO2 is a wide-bandgap semiconductor material, so it increases the resistance and temperature rise of contacts and has a great impact on the thermal conductivity of contacts [2]. What is more, SnO2 has a high hardness, leading to the poor plasticity and ductility of AgSnO2 contact materials and the difficulties of contact modeling [3].
Improving the performance of AgSnO2 contact materials by doping has always been an important research direction. Reference [4] used powder metallurgy to prepare Bi-doped AgSnO2 contact materials and analyzed the influence of Bi-doping on electrical properties. Reference [5] used the internal oxidation method to prepare different concentrations of NiO doped AgSnO2 contact materials, and analyzed the influence of different concentrations of doping on the mechanical properties. The experimental results of references [4,5] show that doping can improve the electrical and mechanical properties of AgSnO2 contact materials. However, in the use of experimental methods to improve the electrical and mechanical properties of AgSnO2 contact materials, the types and proportions of doping elements rely on "trial and error" methods, which will cause a lot of waste of financial and material resources. Therefore, the current research on doping to improve the electrical and mechanical properties of AgSnO2 contact materials urgently needs effective theoretical support. SnO2, as the reinforcing phase in the AgSnO2 contact material, directly affects the performance of the AgSnO2 contact material. Therefore, the performance of the AgSnO2 contact material can be improved by improving the performance of SnO2. Doping non-metallic element N can reduce the band gap of SnO2 and increase the conductivity of SnO2. Moreover, since the ionic radii of N and O are the closest, it is easier for N atoms to replace O atoms than other non-metallic elements [6]. According to the co-doping theory proposed by Yamamoto and Katayama, the co-doping of two or more elements can further improve the material properties [7]. In this study, the conductivity and toughness of SnO2 are improved by doping, and the wettability between SnO2 and Ag is also improved, which can prevent SnO2 from precipitating out of the Ag liquid to form an enriched area, and reduce the contact resistance of AgSnO2. Compared with the traditional powder metallurgy process, the SnO2 particles prepared by the sol-gel method are smaller and can be evenly distributed in the Ag matrix, which can improve the processing performance of the AgSnO2 contact material. In this paper, the first principles based on density functional theory are used to calculate the band structure, density of states, layout elastic modulus and thermodynamic parameters of pure SnO2, single doped elements Ni, N, and co-doped Ni and N. To analyze the influence of conductivity and mechanical properties before and after doping, the sol-gel method was used to prepare SnO2 powder with different additives, and the influence of different additives on the wetting angle of Ag and SnO2 was measured. Then, the powder metallurgy method was used to prepare the AgSnO2 contact material. Hardness, electrical conductivity and contact resistance are tested to analyze their performance, providing a reference for the further development of AgSnO2 contact materials.
2. Calculation Method
2.1. Model
SnO2 is a tetragonal rutile structure, and each SnO2 unit cell contains 2 Sn atoms and 4 O atoms. In this paper, a 2 × 2 × 1 supercell model is constructed, which contains 8 Sn atoms and 16 O atoms, as shown in Figure 1. The SnO2 doping model was established by means of atom replacement. Replace 1 Sn atom with Ni atom and 2 O atoms with N atoms to ensure the same doping ratio.
The CASTEP (Cambridge Serial Total Energy Package, MS2017, Dassow, France) module in the Material Studio software is used to calculate the properties of models. This simulation is widely used in the research of ceramics, semiconductors and other materials [8,9]. The generalized gradient Approximation (GGA) solves the problem of the exchange function change when the electron density changes greatly, and the structure optimization and the experimental results are in good agreement. The Local Density Approximation (LDA) is to approximate the exchange correlation energy to the charge density correlation quantity at a certain point. The value of the exchange correlation energy is equal to the exchange correlation energy of a uniform field with the same charge density. It has achieved good results in the calculation of elastic constants [10]. The electrical performance optimization calculation is carried out by using the PBE (Perdew Burke Ernzerhof) method of the Generalized Gradient Approximation (GGA) and the plane wave super soft pseudopotential, and calculation of mechanical properties was obtained by the CA-PZ method of the Local Density Approximation (LDA), used for the correction, and the plane wave super soft pseudopotential. For accuracy and efficiency, the super unit cell model is tested for convergence first, and the plane wave cut-off energy of the reciprocal space is selected to be 400 eV, and the K point of the Buri abyss is 5 × 5 × 5. When optimized, a more stable structure was obtained. Then the band structure, density of states, formation energy and effective mass of electrons of the optimized models were calculated. The unit electron energy change is not more than 1 × 10⁻⁶ eV/atom, the force on each atom is not more than 0.3 eV/nm, the internal stress of the unit cell is less than 0.02 GPa, and the tolerance deviation is stabilized below 5 × 10⁻⁵ nm. On the basis of convergence conditions, the elastic constants are calculated. The valence electron configurations considered for each atom are: Sn–5s25p2, O–2s22p4, N–2s22p3, Ni–3d84s2.
2.2. Lattice Constant and Doping Formation Energy
SnO2 lattice constant and doping formation energy before and after doping are shown in Table 1. Compared with SnO2, the lattice constant and volume of SnO2 doped with different additives are slightly larger. The doping formation energy is used to analyze the difficulty of doping; the smaller the value is, the easier the doping model forms, and the more stable the doping structure is. The calculation formula of single doping and co-doping doping formation energy are as follow [11]:
Among them, is the total energy of the optimized doping system; is the total energy of SnO2; , , , is the ground state energy of each atom; a, b, n, m represent the number of Sn atoms replaced, the number of Ni doped atoms, the number of O atoms replaced and the number of N atoms replaced. Through calculation, the doping formation energies of single doping and co-doping are obtained, as shown in Table 1. The smaller the formation energy of doping, the more stable the structure. The results show that the formation energy of Ni single doping is the smallest and its structure is the most stable. The structure after Ni–N co-doping is more stable than that of N single doping.
2.3. Band Structure
The band structure before and after doping is shown in Figure 2. A 0 eV is chosen as the Fermi level. Considering that the study of deep levels is of little significance, only the band structure near the Fermi level is given. Intrinsic SnO2 is a wide band gap semiconductor material with a band gap value of 3.6 eV. The band gap value of SnO2 calculated in this paper is 1.059 eV, which is smaller than the experimental value. It is similar to the band gap value calculated by this method in [12], which is 1.12 eV. This is because the Generalized Gradient Approximation (GGA) used in the calculation underestimates the energy of the excited electrons in the conduction band, which does not affect the trend of the band gap before and after doping. It can be seen from the figure that both before and after doping are direct bandgap semiconductors. Compared with the intrinsic SnO2, the energy band becomes denser, which enhances locality and electron concentration. Figure 2b shows the band structure of single-doped Ni. It can be seen that the conduction band decreases, the valence band rises and the band gap decreases to 0.3 eV, which increases the carrier concentration and improves the conductivity. Figure 2c shows the energy band structure when single-doped N. The band gap is reduced to 0.047 eV, and the Fermi level passes through the top of the valence band, indicating that N doping is p-type doping. Figure 2d is the energy band structure diagram of N and Ni co-doped SnO2. The impurity energy level is introduced into the band gap, which is mainly caused by the 2p and 3d orbitals of Ni. The carrier concentration increases and the energy of the band transition to the conduction band reduces. Therefore, the band gap is further reduced to 0.026 eV.
2.4. Density of States
The density of states can reflect the interaction of dopant atoms with other atoms and the formation of chemical bonds. Taking the Fermi level as the reference zero point, the density of states of SnO2 with different doping forms is shown in Figure 3. Figure 3b is the density of states of SnO2–Ni. The peak at −5 eV is formed by the hybridization of Ni–5d orbital and O–2p orbital, Sn–5p orbital and O–2p orbital. The contribution of Ni–5d orbital near 0 eV makes the Fermi level cross the valence band top, so that the band gap value is reduced. Figure 3c is the density of states of SnO2–N. The impurity peaks formed in −10~–15 eV are formed by the s-p hybridization of N–2s orbitals and Sn–5s and Sn–5p orbitals. At −5~0 eV, due to the introduction of N–2p orbital and Sn–5p orbital hybridization, the overlapping area is larger than that of O–2p orbital and Sn–5p orbital hybridization, indicating that hybridization after N atom doping becomes stronger. Figure 3d is the density of states of SnO2–Ni–N. The impurity peaks formed by O–2p, Sn–5p and Ni–3d, N–2p hybridization at −1~−5eV are wider compared with single doping. The electronic state increases, indicating that the hybridization becomes stronger when co-doped. At 0~−1eV, the impurity peaks formed by the hybridization of Ni–5d and N–2p provide more conductive holes and make the band gap smaller. At 0–2 eV, the impurity peaks are mainly formed by the hybridization of Ni–5d and N–2p, and a very narrow deep main energy level is formed near the Fermi level, which increases the number of holes and enhances locality [13]. On 2–5 eV, N–2p and Sn–5s, Sn–5p have the same peak position, and the impurity peak width formed is larger, indicating that N atoms and Sn atoms have a strong hybridization effect.
2.5. Charge Density Map and Electron Overlap Population
The charge density map shows charge distribution in the unit cell. It can be seen from Figure 4b that compared with the undoped SnO2, the charge density after doping increases, and the charge density around Ni atoms is much larger than that around Sn and O atoms. The overlap of electron clouds between Ni atoms and O atoms is greater than the overlap between Sn atoms and O atoms, which indicates that the interaction between Ni atoms and O atoms is stronger. In Figure 4c, the electron cloud between N and Sn is more overlapped than that between O and Sn, improving covalentness and conductivity. It can be seen in Figure 4d that the charge density of Ni atoms, O atoms and N atoms is greater than the charge density of Sn atoms, O atoms and N atoms. The degree of electron sharing increases, indicating that doping makes electrons transfer. Compared with single-doped N, the electron cloud gathers in the direction of the impurity atoms, further improving conductivity. The number of electron overlap population is the number of electron overlap between atoms. The larger the value is, the stronger the bonding effect of atoms is. Table 2 shows the electronic overlap population values of SnO2 and doped SnO2 under different conditions. The numbers in the table are average values. It can be seen that, compared with the electron overlap population value between Sn and N, the value between Sn and N is larger, electron transfer is intensified and conductivity is increased. With Ni and N co-doped, the electron overlap population value between Sn and N and between Ni and O is larger, indicating that the overlap between atoms increases after co-doping, the electron transfer between atoms is intensified and the conductivity is further enhanced, which is consistent with the analysis result of the charge density map.
2.6. Elastic Modulus
The elastic constants can be used to judge whether the mechanical structure is stable, and to determine the mechanical stability standard of the tetragonal phase crystal system [14]:
According to the data in Table 3, the structure of the three doping forms meets the standard of mechanical stability.
According to the Voigt approximation algorithm [15], the formulas of shear modulus (GV) and body elastic modulus (BV) are as follows:
According to the Reuss approximation algorithm [16], the formulas of shear modulus (GR) and body elastic modulus (BR) are as follows:
Hill believes that the Voigt and Reuss models can calculate the maximum and minimum values of the bulk elastic modulus and the shear modulus, respectively, which proves that the average value of the two is closer to the experimental results [17]; the formula is as follows:
The formulas of Young's modulus (E) and Poisson's ratio (δ) are as follows:
By fitting the dataset, a correction formula without intercept term is given, which eliminates the negative hardness that is inconsistent with the reality. The formula of Vickers hardness (HV) [18] is as follows:
According to the results in Table 4, mechanical properties such as hardness, brittleness and toughness of Ni and N single-doped and co-doped SnO2 were further theoretically calculated. Young's modulus is the ratio of stress and strain to the uniaxial of the material. The larger the ratio, the stronger the ability of the material to resist deformation. It can be seen from Table 4 that Young's modulus of N single-doped and Ni–N co-doped SnO2 both decreased, and Young's modulus of SnO2–N decreased the most. Poisson's ratio characterizes the compressibility of a material. The smaller the value, the greater the volume change of the material. It can be seen from Table 4 that the N-doped and Ni–N co-doped SnO2 Poisson is relatively small, indicating that the volume change of the material is larger when the material is deformed, and the material with a smaller Poisson's ratio has higher stability, so Ni–N stability, when co-doped, is better.
According to the Pugh method criterion [19], the BH/GH ratio can be used to judge the brittleness and toughness of the material. Brittleness is defined when the ratio is less than 1.75, and toughness is defined when the ratio is greater than 1.75. The brittle toughness of doped SnO2 was improved to a certain extent. The universal elastic anisotropy index is a decisive factor for cracks. The smaller the value, the less likely it is to form cracks.
2.7. Debye Temperature
Debye temperature is an important parameter for analyzing the mechanical properties and thermodynamic properties of materials. The higher the Debye temperature is, the stronger the bonding force between atoms, the higher the melting point, and the higher the hardness will be. The formula of Debye temperature is as follows [20]:
where, is the Debye temperature, is the Boltzmann constant, is the Planck constant, is the Avogadro constant, is the number of atoms in the unit cell, is the molecular mass, is the unit cell density and is the average wave velocity.
where, is the shear wave velocity, is the longitudinal wave velocity, is the bulk modulus, and is the shear modulus.
It can be seen from Table 5 that single-doped N and co-doped Ni–N reduce the hardness and melting point of the SnO2 unit cell. Compared with single-doped SnO2, Ni and N co-doped SnO2 have the least hardness, which can effectively improve the ductility of the material. Co-doping of Ni and N reduces the hardness of the material and improves the forming and service life of the AgSnO2 contact material.
3. Experiment
3.1. X-ray Diffraction
X-ray diffraction (XRD) is a diffraction pattern formed when X-rays pass through the crystal structure, which can analyze the microstructure before and after doping. XRD is used to determine whether doping atoms are doped into the SnO2 lattice. Using a Bruker D8 DISCOVERX X-ray diffraction instrument, place the powder on the Cu target Kα ray diffractometer for scanning. The power is 1.6 kW, the wavelength is 0.15405 nm, the voltage is 40 kV, the current is 40 mA, the scanning range is 10–90°and the speed is 6°/min. The XRD patterns of single-doped and co-doped SnO2 powders are shown in Figure 5. It can be seen that, compared with the XRD pattern of the intrinsic SnO2 powder, the diffraction peak position shift in the XRD pattern of the doped SnO2 powder is smaller, and there is no other phase peak. It shows that the increase in lattice constant caused by doping atoms causes the shift of the diffraction peak position, and there is no diffraction peak related to Ni and N atoms, so the doped SnO2 powder still maintains the tetragonal rutile structure. It shows that the doping elements achieve substitutional solid solution in sol-gel preparation process, which corresponds to the model established by simulation.
Calculate the average grain size of the doped powder according to the XRD diffraction pattern, using the Scherrer formula [21]:
In the formula, k is a constant, with a value of 0.89, λ is the X-ray diffraction wavelength, β is the half-height width of the strongest diffraction peak, cubic crystal particles need to be converted to the radian system and θ is the half-diffraction angle.
The calculated average grain sizes of SnO2–Ni, SnO2–N and SnO2–Ni–N are: 3.67 nm, 7.85 nm and 32.31 nm, respectively. It can be seen that the size of the powder prepared by the sol-gel method reaches the nanometer level, which is beneficial to powder doping. In addition, the intensity of the diffraction peak of SnO2 after doping decreases, indicating that doping can reduce the crystallinity of the material, and the decrease in crystallinity can cause the hardness and brittleness of the material to decrease, and the toughness of the material can increase.
3.2. Wettability Experiment
The material wetting angle (θ) is an important parameter for judging the wettability between two phases. When θ = 0°, it indicates that the two phases have been completely wetted. When 0° < θ < 90°, the wettability of the two phases is good; when 90° ≤ θ < 180°, the wettability of the two phases is poor. Therefore, the smaller the wetting angle, the better the wettability between the two phases. During the experiment, the sessile drop method was used to measure the wetting angle between Ag and SnO2 under different additives.
The masses of SnO2, SnO2–Ni, SnO2–N and SnO2–Ni–N are all 3 g, and the mass of Ag powder is 0.3 g. The experimental temperature is higher than the melting point of Ag (962 °C) so the temperature is set to rise to 1050 °C and is held for 0.5 h. During the experiment, when the temperature rose to 100 °C, the silver oxide began to decompose into silver and oxygen. When the temperature reaches 300 °C, the silver oxide is completely decomposed. Therefore, the influence of silver oxide on the wetting ability can be ignored in this test. After waiting for the sample to cool, use a contact angle measuring instrument to measure the wetting angle of each doped SnO2. The wetting angle test chart is shown in Figure 6, and the wetting angle test values are shown in Table 6.
It can be seen from Table 6 that the wetting angle of SnO2 is 93.20° and wettability is poor, which results in a larger contact resistance of AgSnO2. The wetting angle of SnO2–N is 89.10°, which has some improvement in wettability. The wetting angle of SnO2–Ni is reduced to 83.05°, which improves wettability. The wetting angle of SnO2–Ni–N is 16.05°, indicating that SnO2 co-doped with Ni and N further improves the wettability of Ag. Therefore, it is difficult for Ni and N co-doped SnO2 to precipitate in the Ag liquid to form an enriched area, so that contact resistance can be reduced and conductivity can be enhanced.
3.3. Hardness, Conductivity and Contact Resistance
The hardness, conductivity and contact resistance of the prepared AgSnO2, AgSnO2–N, AgSnO2–Ni and AgSnO2–Ni–N contact materials were tested. The measurement is used to further verify the improvement effect of Ni and N co-doped AgSnO2. The HXD1000TMdigital microhardness tester was used to measure the hardness of the sample, and the Sigmascope SMP10 metal conductivity tester was used to measure the conductivity of the sample. Each sample was measured six times, and the average of the final results was obtained. The contact resistance of the contacts is measured by using the JFO4C electrical contact material test system. Each type of sample was processed into a contact with a diameter of 4.5 mm and a thickness of 3 mm. We conducted 25,000 electrical contact simulation experiments on each sample to test the improvement of the contact resistance of AgSnO2 by Ni and N doping. During the experiment, a pure resistance load was used for testing, the action protection voltage was ±40 V, the voltage was set to DC20V, the current was set to DC10A and the contact pressure was set to 86 cN. The experimental results of hardness, electrical conductivity and contact resistance are shown in Table 7.
It can be seen from Table 7 that the hardness and contact resistance of the contacts decrease after doping, and the conductivity increases, which indicates that doping can increase the conductivity and ductility of the AgSnO2 contact material and improve the molding and service life of AgSnO2 contact material. The conductivity and hardness of AgSnO2–Ni–N are the smallest, which improves ductility more effectively. The conductivity of AgSnO2–Ni, AgSnO2–N and AgSnO2–Ni–N contacts is greater than that of AgSnO2 contact materials, which is consistent with the theoretical analysis results.
In practice, the smaller and more stable the contact resistance of the contact material, the better the contact. According to Figure 7, we can judge the stability and value of the contact resistance of AgSnO2 contact materials with different additives. According to Figure 7a, the contact resistance of AgSnO2 contact is relatively large and the stability is poor. In Figure 7c, the contact resistance of the AgSnO2–Ni electrical contact is relatively stable and small in the first part of the electrical contact simulation experiment, but the stability is poor in the later period, and its variation range and contact resistance are increased. In Figure 7d, the AgSnO2–Ni–N electrical contact has the smallest contact resistance and better stability. Therefore, the AgSnO2–Ni–N electrical contact not only has good conductivity and ductility, but also has low and stable contact resistance.
4. Conclusions
The first-principles method based on density functional theory was used to analyze the crystal structure, electrical conductivity and mechanical properties of SnO2, SnO2–Ni, SnO2–N and SnO2–Ni–N. SnO2 powders with different additives were prepared by the sol-gel method. The powder metallurgy method was used to prepare AgSnO2 contacts with different additives, and a series of experiments were carried out. The result shows:
1. The doping of Ni and N increases the lattice constant and volume of SnO2, but does not change its structure. Therefore, the doped SnO2 still belongs to the tetragonal rutile structure.
2. Through the measurement of energy band structure, state density, charge population and electrical conductivity, it can be obtained that the conductivity performance of Ni–N co-doped AgSnO2 is the best.
3. The wetting angle between SnO2–Ni–N and Ag liquid is the smallest, indicating that Ni–N co-doping can further improve wettability between SnO2 and Ag liquid, reduce the contact resistance of the contacts and improve the conductivity performance.
4. Through the elastic modulus and hardness test, the Ni–N co-doped AgSnO2 has the best mechanical properties, improving ductility as well as improving molding and service life of the AgSnO2 contact material.
Author Contributions
J.W. designed the experiments and provided the materials and equipment needed for the experiment; J.Y. and Y.Z. carried out the experiments; G.Z., D.H. and G.H. assisted with the experiments; J.W. and J.Y. analyzed simulation results and experimental results; and J.Y. wrote the manuscript. All authors have read and agreed to the published version of the manuscript.
Funding
This research was funded by the National Natural Science Foundation of China, grant number 51777057.
Institutional Review Board Statement
Not applicable.
Informed Consent Statement
Not applicable.
Data Availability Statement
No new data were created or analyzed in this study. Data sharing is not applicable to this article.
Acknowledgments
This study was supports by the National Natural Science Foundation of China (51777057).
Conflicts of Interest
No conflict of interest exits in the submission of this manuscript, and the manuscript is approved by all authors for publication. The funders had no role in the design of the study; in the collection, analyses or interpretation of data; in the writing of the manuscript, or in the decision to publish the results.
References
- Qiao, X.Q.; Shen, Q.H.; Chen, L.S.; He, Q.; Fan, X.; Yang, H. Research progress of AgSnO2 electrical contact materials. Mater. Rev. 2013, 27, 1–6. [Google Scholar]
- Chen, L.; Wang, J.; Liu, Z.; Yu, S.; Zhu, Y. First-principles study on the thermal properties of La-doped AgSnO2 contact materials. Rare Met. 2020, 44, 934–940. [Google Scholar]
- Liu, Z. Calculation and Research of Nano-Doped AgSnO2 Electrical Contact Materials. Master’s Thesis, Tianjin University, Tianjin, China, 2007. [Google Scholar]
- Wang, H.T.; Wang, J.Q.; Zhu, Y.C. Influence of Bi to AgSnO2 material’s contact resistance. Trans. China Electrotech. Soc. 2011, 26, 29–33. [Google Scholar]
- Zhou, X.; Chen, L.; Liu, M.; Yu, J.; Xiong, D.; Zheng, Z.; Wang, L. Effects of NiO content on the microstructure and mechanical properties of AgSnO2NiO composites. Sci. Eng. Compos. Mater. 2019, 26, 221–229. [Google Scholar] [CrossRef]
- Li, Z.; Li, J.; Lei, J.; Xiong, M.; Wang, N.; Zhang, S. First-principles study of structure, electrical and optical properties of Al and Mo co-doped ZnO. Vacuum 2021, 186, 110062. [Google Scholar] [CrossRef]
- Yamamoto, T.; Katayama, Y.H. Solution using a codoping method to unipolarity for the fabrication of p-Type ZnO. Jpn. J.Appl. Phys. 1999, 38, 166. [Google Scholar] [CrossRef]
- Tang, J.; Zhang, G.Y.; Bao, J.S.; Liu, C. First-principles study on the influence of impurity S on Fe/Al2O3 interface bonding. Acta Physica Sinica 2014, 63, 405–410. [Google Scholar]
- Wang, W.; Yang, C.; Bai, L.; Li, M.; Li, W. First-principles study on the structural and electronic properties of monolayer mos2 with s-vacancy under uniaxial tensile strain. Nanomaterials 2018, 8, 74. [Google Scholar] [CrossRef] [PubMed] [Green Version]
- Segall, M.D.; Lindan, P.J.D.; Probert, M.; Pickard, C.J.; Hasnip, P.; Clark, S.J.; Payne, M.C. First-principles simulation: Ideas, illustrations and the CASTEP code. J. Phys. Condens. Matter 2002, 14, 2717–2744. [Google Scholar] [CrossRef]
- Cui, X.; Medvedeva, J.E.; Delley, B.; Freeman, A.J.; Newman, N.; Stampfl, C. Role of embedded clustering in dilute magnetic semiconductors: Cr Doped GaN. Phys. Rev. Lett. 2005, 95, 256404. [Google Scholar] [CrossRef] [PubMed] [Green Version]
- Xue, J.; Ma, S.; Bi, Q.; Zhang, X.; Guan, W.; Gao, Y. Revealing the modification mechanism of La-doped Ti/SnO2 electrodes related to the microelectronic structure by first-principles calculations. J. Alloy. Compd. 2018, 747, 423–430. [Google Scholar] [CrossRef]
- Chen, L.; Li, W.; Dai, J.; Wang, Q. First-principles calculation of Mn-N co-doped p-type ZnO. Acta Phys. Sin. 2014, 63, 256–262. [Google Scholar]
- Wu, Z.-J.; Zhao, E.-J.; Xiang, H.-P.; Hao, X.-F.; Liu, X.-J.; Meng, J. Crystal structures and elastic properties of superhardIrN2andIrN3from first principles. Phys. Rev. B 2007, 76, 3–5. [Google Scholar] [CrossRef]
- Voight, W. Lehrbuch der Kristallphysik; Springer: New York, NY, USA, 1908. [Google Scholar]
- Reuss, A. Calculation of the flow limits of mixed crystals on the basis of the plasticity of monocrystals. Zamm Z Angew. Math. Me. 1929, 9, 49–58. [Google Scholar] [CrossRef]
- Hill, R. The elastic behaviour of a crystalline aggregate. P Roy Soc. Edinb. A 1952, 65, 349–354. [Google Scholar] [CrossRef]
- Tian, Y.; Xu, B.; Zhao, Z. Microscopic theory of hardness and de-sign of novel superhard crystals. Int. J. Refract. Met. H 2012, 33, 93–106. [Google Scholar] [CrossRef]
- Pugh, S.F., XCII. Relations between the elastic moduli and the plastic properties of polycrystalline pure metals. Philos. Mag. 2009, 45, 823–843. [Google Scholar] [CrossRef]
- Anderson, O.L. A simplified method for calculating the debye temperature from elastic constants. J. Phys. Chem. Solids. 1963, 24, 909–917. [Google Scholar] [CrossRef]
- Holzwarth, U.; Gibson, N. The Scherrer equation versus the Debye-Scherrer equation. Nat. Nanotechnol. 2011, 6, 534. [Google Scholar] [CrossRef] [PubMed]
Figure 1.
Doping models: (a). SnO2–Ni; (b). SnO2–N; (c). SnO2–Ni–N.

Figure 2.
Band structure: (a). SnO2; (b). SnO2–Ni; (c). SnO2–N; (d). SnO2–Ni–N.
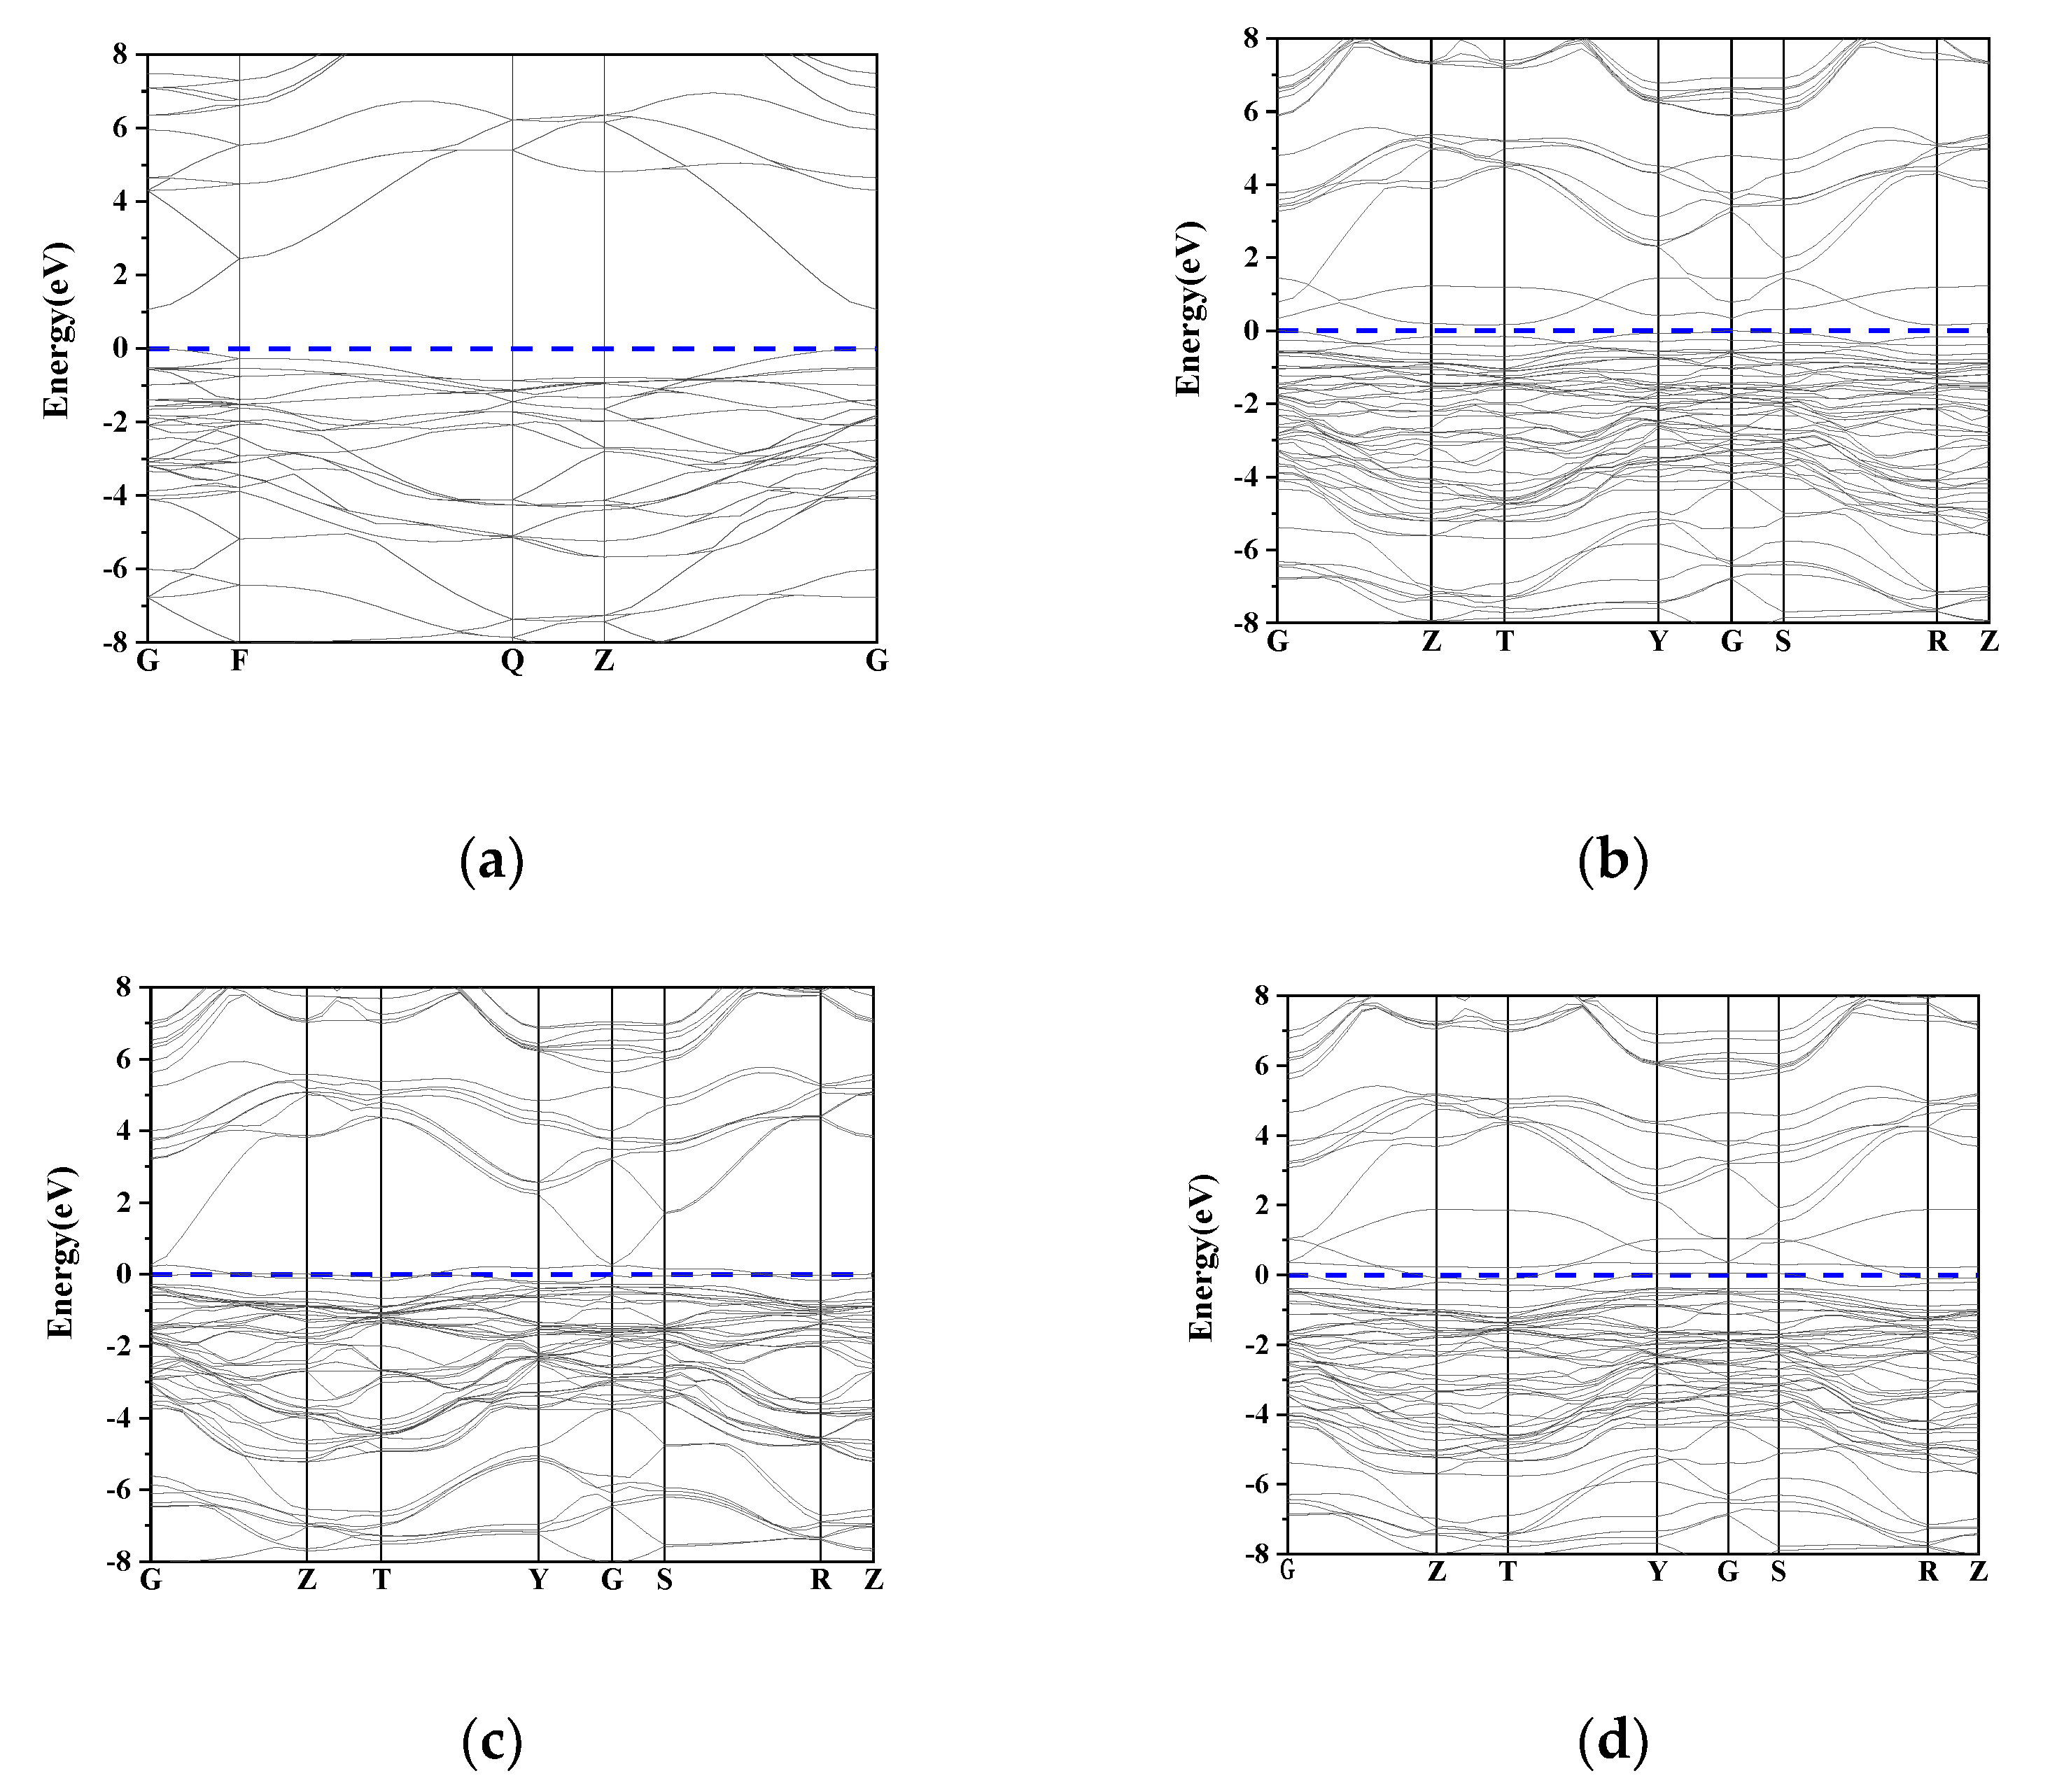
Figure 3.
Density of states: (a). SnO2; (b). SnO2–Ni; (c). SnO2–N; (d). SnO2–Ni–N.
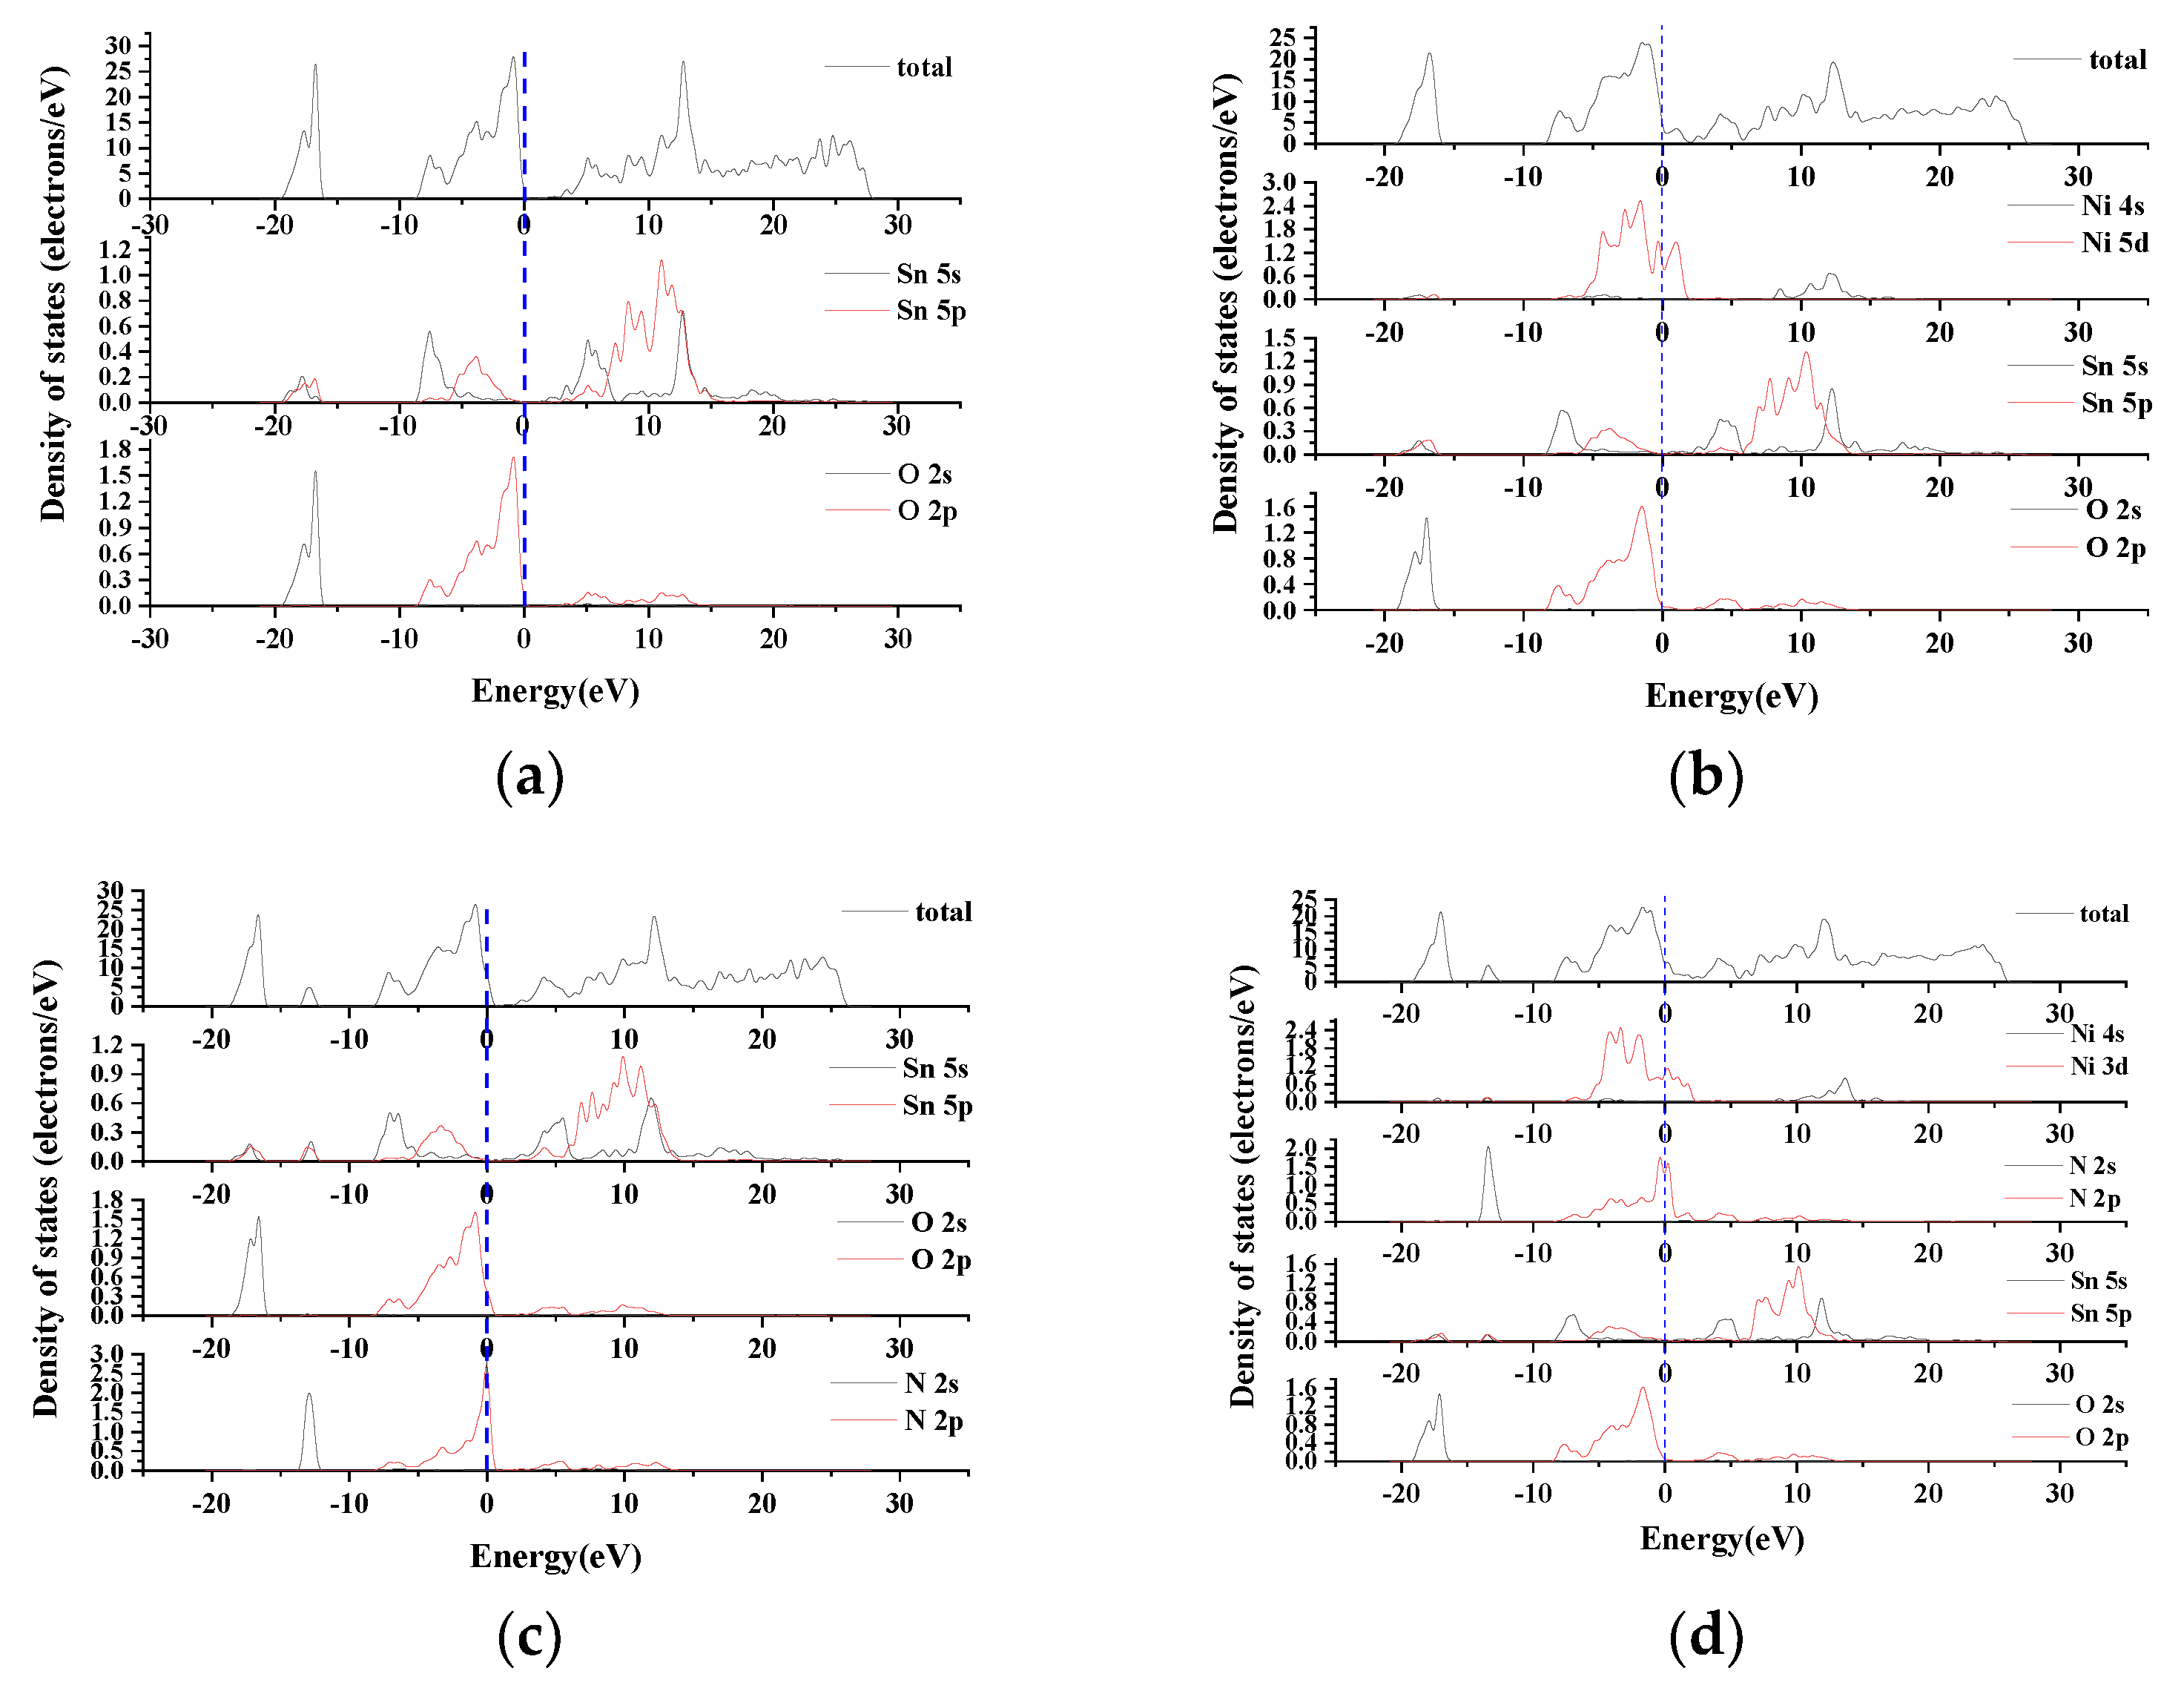
Figure 4.
Charge density map: (a). SnO2; (b). SnO2–Ni; (c). SnO2–N; (d). SnO2–Ni–N.

Figure 5.
XRD patterns: (a). SnO2; (b). SnO2–Ni; (c). SnO2–N; (d). SnO2–Ni–N.
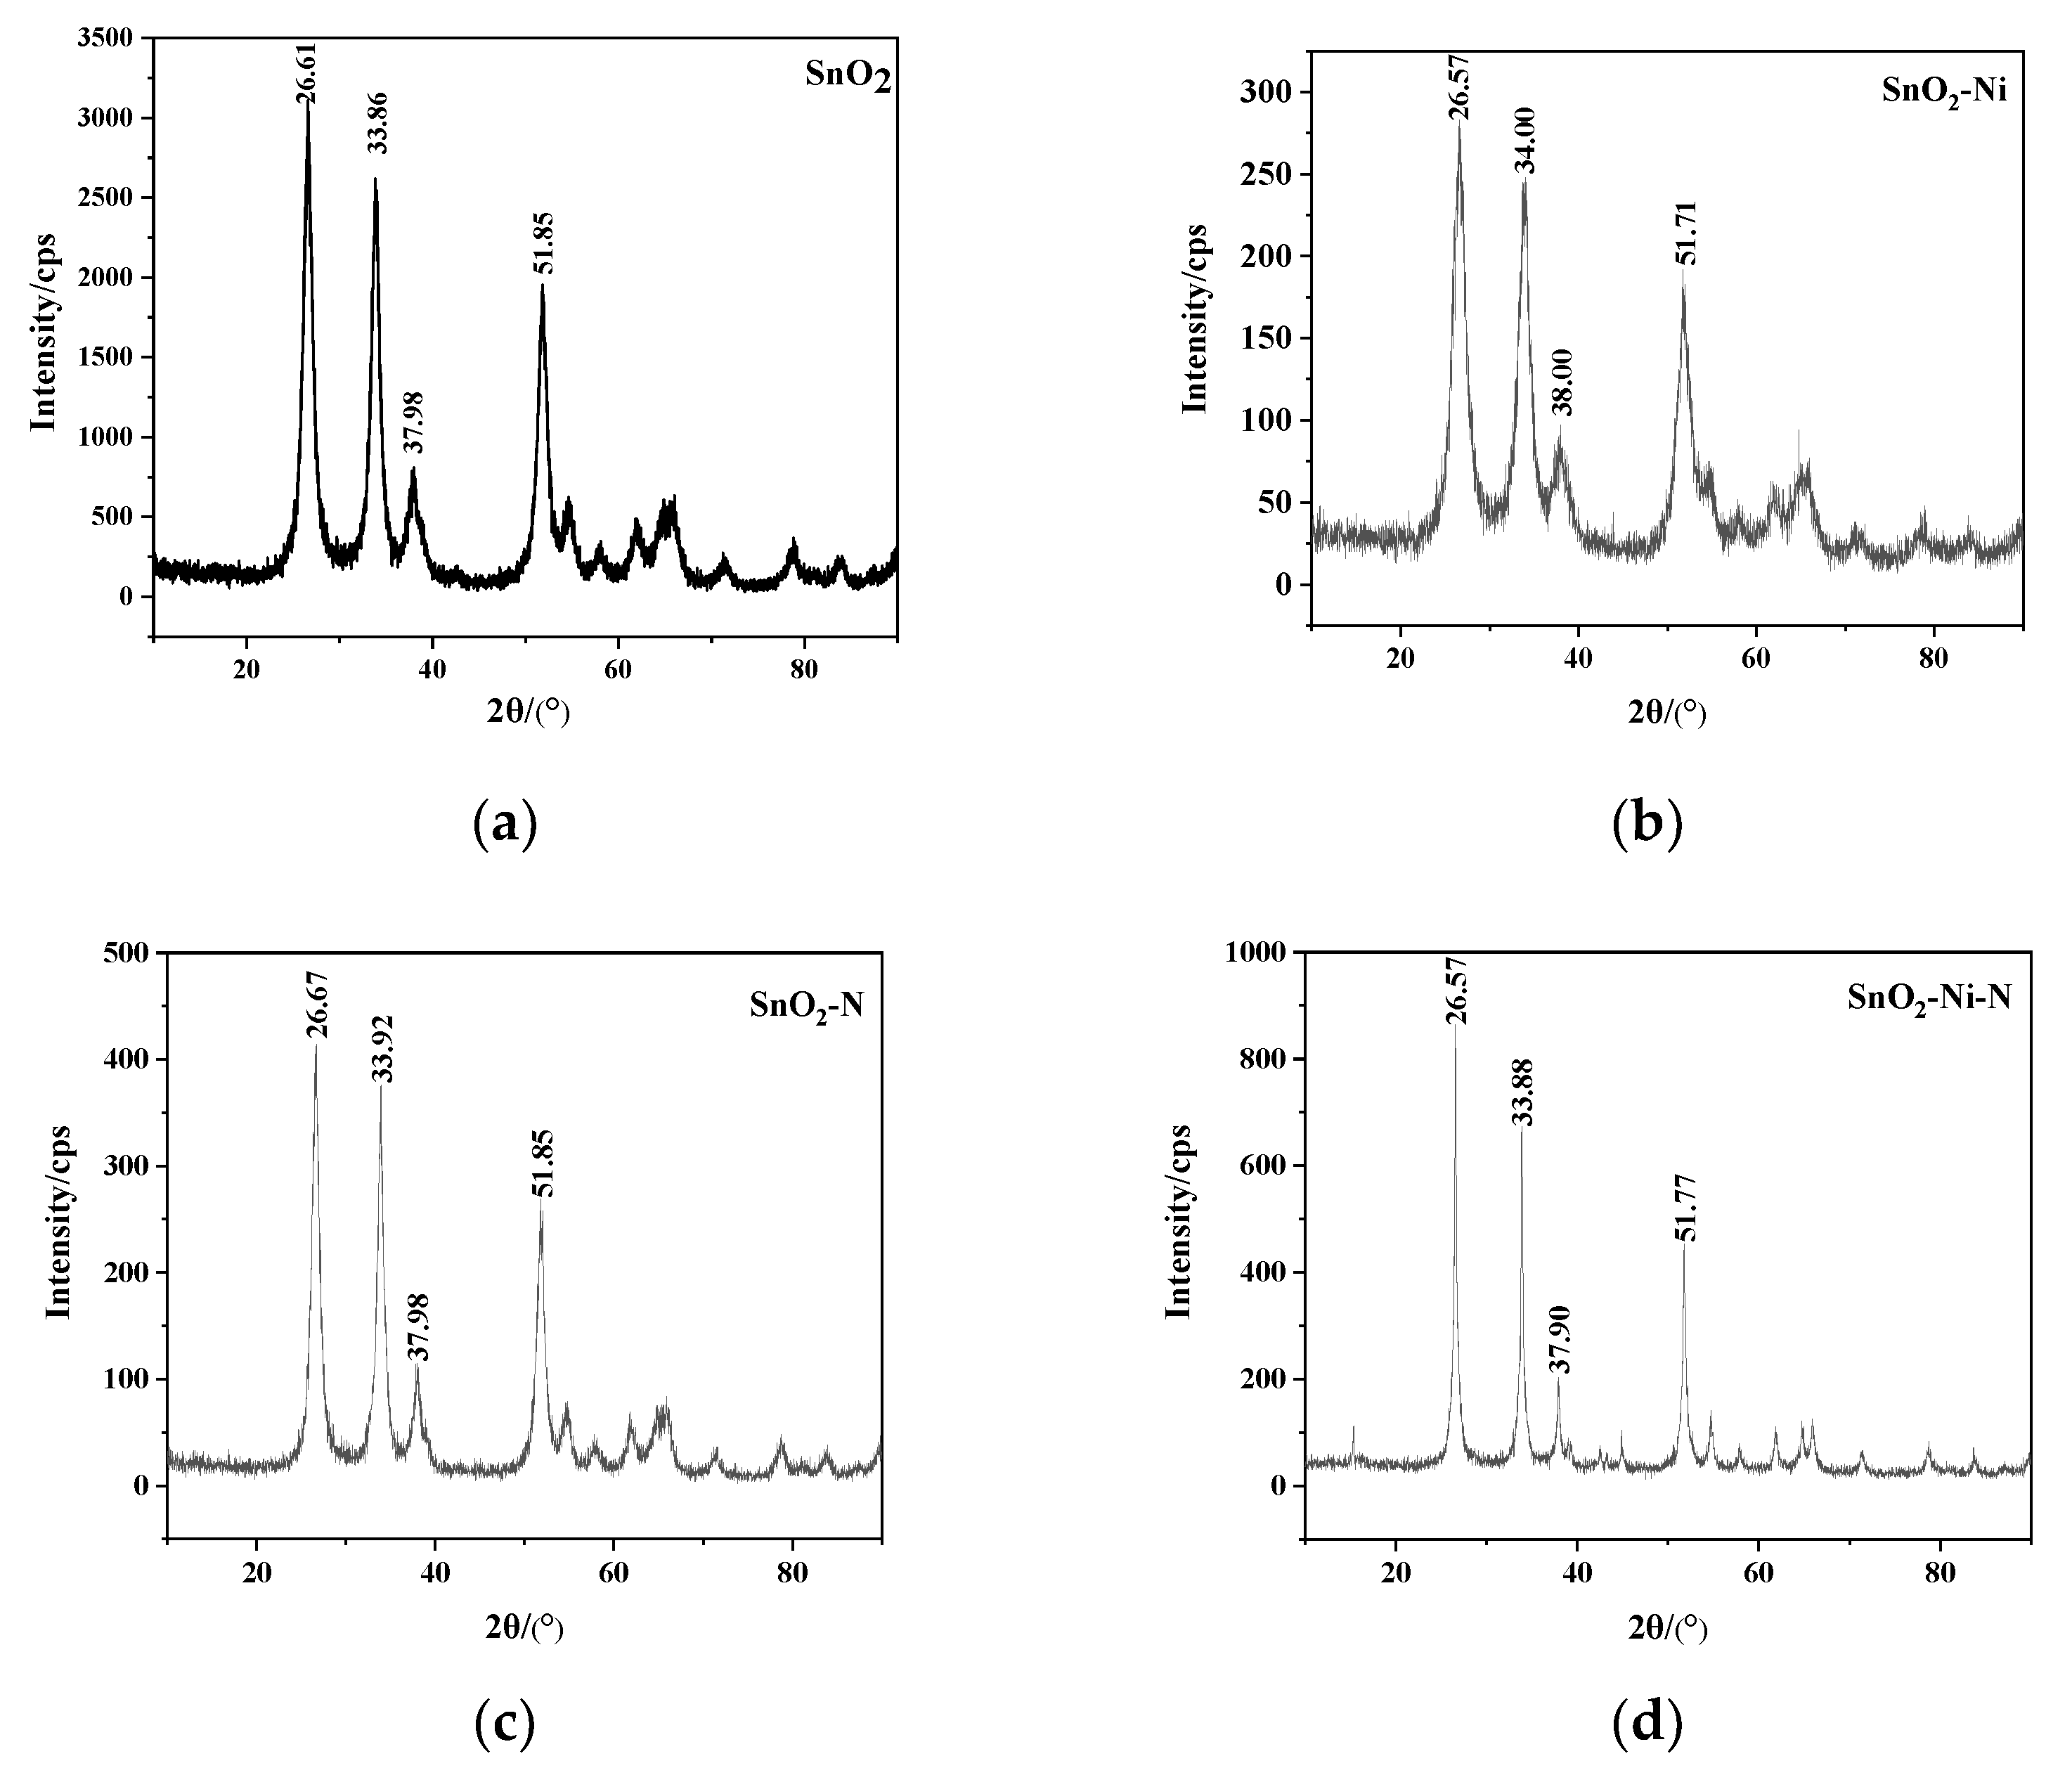
Figure 6.
Wetting angles’ test diagrams: (a) SnO2; (b) SnO2–N; (c). SnO2–Ni; (d). SnO2–Ni–N.

Figure 7.
Contact resistance: (a) SnO2; (b) SnO2–N; (c). SnO2–Ni; (d). SnO2–Ni–N.


Table 1.
Lattice constants and doping formation energy.
| Model | a/nm | b/nm | c/nm | V/ nm3 | Ef/eV |
|---|---|---|---|---|---|
| SnO2 | 0.474 | 0.474 | 0.319 | 0.288 | — |
| SnO2–Ni | 0.483 | 0.4831 | 0.326 | 0.303 | −1.158 |
| SnO2–N | 0.492 | 0.492 | 0.330 | 0.320 | 1.45 |
| SnO2–Ni–N | 0.484 | 0.484 | 0.328 | 0.307 | 0.3504 |
Table 2.
Atom population and electronic overlapping populations.
| Model | Atom Population | Bond Population | ||||||
|---|---|---|---|---|---|---|---|---|
| Ni | N | Sn | O | Ni–N | Ni–O | Sn–N | Sn–O | |
| SnO2 | 1.90 | −0.95 | 0.54 | |||||
| SnO2–Ni | 0.85 | 1.85 | −0.86 | 0.45 | 0.48 | |||
| SnO2–N | −0.87 | 1.80 | −0.90 | 0.70 | 0.50 | |||
| SnO2–Ni–N | 0.82 | 0–0.67 | 1.82 | −0.83 | 0.41 | 0.56 | 0.85 | 0.49 |
Table 3.
Elastic constants.
| Model | C11/GPa | C12/GPa | C13/GPa | C22/GPa | C33/GPa | C44/GPa | C55/GPa | C66/GPa |
|---|---|---|---|---|---|---|---|---|
| SnO2 | 152.0 | 55.01 | 64.59 | 152.0 | 298.5 | 90.01 | 90.01 | 145.5 |
| SnO2–Ni | 248.91 | −29.85 | 63.19 | 257.40 | 316.5 | 86.23 | 88.48 | 45.22 |
| SnO2–N | 242.44 | −30.49 | 57.50 | 225.90 | 287.95 | 73.06 | 71.54 | 40.11 |
| SnO2–Ni–N | 269.97 | −24.88 | 70.24 | 248.38 | 300.49 | 73.19 | 88.31 | 44.19 |
Table 4.
Bulk modulus (BH), shear modulus (GH), Young's modulus(E), Poisson's ratio(δ), Hardness (HV), Bulk modulus to shear modulus ratio (BH/GH) and Universal elastic anisotropy Index (AU).
Table 4.
Bulk modulus (BH), shear modulus (GH), Young's modulus(E), Poisson's ratio(δ), Hardness (HV), Bulk modulus to shear modulus ratio (BH/GH) and Universal elastic anisotropy Index (AU).
| Model | BH (GPa) | GH (GPa) | E (GPa) | δ | BH/GH | HV | AU |
|---|---|---|---|---|---|---|---|
| SnO2 | 102.92 | 86.94 | 203.52 | 0.17 | 1.18 | 17.93 | 1.37289 |
| SnO2–Ni | 108.68 | 86.01 | 203.98 | 0.19 | 1.26 | 16.60 | 0.89761 |
| SnO2–N | 99.46 | 75.32 | 180.42 | 0.20 | 1.32 | 14.30 | 0.97578 |
| SnO2–Ni–N | 111.61 | 82.16 | 197.92 | 0.20 | 1.36 | 14.73 | 0.89756 |
Table 5.
Density ρ/(g/cm3), transverse wave velocity Vt/(m/s), longitudinal wave velocity Vl/(m/s), average wave velocity Vm/(m/s) and Debye temperature ΘD/k.
Table 5.
Density ρ/(g/cm3), transverse wave velocity Vt/(m/s), longitudinal wave velocity Vl/(m/s), average wave velocity Vm/(m/s) and Debye temperature ΘD/k.
| Model | ρ/(g/cm3) | Vt/(m/s) | Vl/(m/s) | Vm/(m/s) | ΘD/k |
|---|---|---|---|---|---|
| SnO2 | 6.998 | 3524.7 | 5592.1 | 3879.2 | 505.8 |
| SnO2–Ni | 6.268 | 3704.3 | 5969.5 | 4083.8 | 522.1 |
| SnO2–N | 6.252 | 3524.7 | 5778.8 | 3892.8 | 489.4 |
| SnO2–Ni–N | 6.176 | 3647.3 | 5984.1 | 2432.9 | 309.9 |
Table 6.
The wetting angle of Ag and SnO2 under different conditions.
| Model | SnO2 | SnO2–Ni | SnO2–N | SnO2–Ni–N |
|---|---|---|---|---|
| Wetting angle(θ/°) | 93.20 | 89.10 | 83.05 | 16.05 |
Table 7.
Experimental results of hardness, conductivity and contact resistance.
| Model | Hardness (Hv) | Conductivity (%IACS) | Contact Resistance (mΩ) |
|---|---|---|---|
| SnO2 | 127.73 | 40.66 | 1.191 |
| SnO2–Ni | 117.65 | 42.08 | 0.994 |
| SnO2–N | 124.31 | 42.28 | 0.867 |
| SnO2–Ni–N | 101.04 | 58.15 | 0.856 |
Publisher’s Note: MDPI stays neutral with regard to jurisdictional claims in published maps and institutional affiliations. |
© 2021 by the authors. Licensee MDPI, Basel, Switzerland. This article is an open access article distributed under the terms and conditions of the Creative Commons Attribution (CC BY) license (https://creativecommons.org/licenses/by/4.0/).
Share and Cite
MDPI and ACS Style
Wang, J.; Yang, J.; Zhu, Y.; Zhang, G.; Hu, D.; Huang, G. Effect of Ni, N Co-Doped on Properties of AgSnO2 Contact Materials. Crystals 2021, 11, 707. https://doi.org/10.3390/cryst11060707
AMA Style
Wang J, Yang J, Zhu Y, Zhang G, Hu D, Huang G. Effect of Ni, N Co-Doped on Properties of AgSnO2 Contact Materials. Crystals. 2021; 11(6):707. https://doi.org/10.3390/cryst11060707
Chicago/Turabian StyleWang, Jingqin, Jianyu Yang, Yancai Zhu, Guangzhi Zhang, Delin Hu, and Guanglin Huang. 2021. "Effect of Ni, N Co-Doped on Properties of AgSnO2 Contact Materials" Crystals 11, no. 6: 707. https://doi.org/10.3390/cryst11060707
Note that from the first issue of 2016, this journal uses article numbers instead of page numbers. See further details here.