Article

The Relationship between Compressive Strength and Pore Structure of the High Water Grouting Material

1
Jiangsu Key Laboratory of Environmental Impact and Structural Safety in Engineering, School of Mechanics and Civil Engineering, China University of Mining and Technology, Xuzhou 221116, China
2
School of Architecture and Civil Engineering, Anhui Polytechnic University, Wuhu 241000, China
3
Jiangsu Collaborative Innovation Center for Building Energy Saving and Construction Technology, Xuzhou 221116, China
4
Department of Disaster Mitigation for Structures, College of Civil Engineering, Tongji University, Shanghai 200092, China
5
School of Civil Engineering and Architecture, Jiangsu University of Science and Technology, Zhenjiang 212100, China
*
Authors to whom correspondence should be addressed.
Crystals 2021, 11(8), 865; https://doi.org/10.3390/cryst11080865
Submission received: 21 June 2021 / Revised: 19 July 2021 / Accepted: 23 July 2021 / Published: 26 July 2021

Abstract

:
To elucidate the relationship between compressive strength and pore structure of the high water grouting material with different water-binder ratios and CaO contents, the compressive strength was tested while pore structure including pore characteristic parameters and pore diameter distribution were investigated by BET, MIP, and 3D-XRM. Moreover, the evolution of hydration products was observed by TGA and SEM, illustrating the reactive mechanism of the material. Furthermore, the grey correlation coefficients between compressive strength and pore structure parameters were illustrated according to the grey correlation theory. The results show that CaO content in lime is proportional to the compressive strength with the water-binder ratio of 1.0 or 1.5, while the inverse trend appears with the water-binder ratio of 2.0. The high water grouting material belongs to the macropore material with the pores mainly within 100 nm to 2 μm. Its hydration products contain ettringite crystals, aluminum gels, and C-S-H gels. The productions of the hydration products are positively correlated with its compressive strength. In addition, the compressive strength of the high water grouting material is closely related to the pore characteristic parameters and the pore size distribution, especially the porosity, the most probable pore diameter, and the pore volumes within 100~500 nm and 10~100 nm.

1. Introduction

With the rapid development of the economy and urbanization, underground space utilization is increasing and the construction of underground structure engineering is expanding, inseparable from the grouting materials. The grouting materials commonly used are micro-fine cement grouting material, cement-water glass grouting material, cement-fly ash grouting material, and so on [1,2,3,4,5,6,7]. However, for complex strata, some grouting materials cannot meet the requirements of underground construction, such as fast hardening and good fluidity. Therefore, excellent grouting material is particularly important. Based on the research of high water material [6,8,9], the high water grouting material is modified and developed, consisting of main material A (sulphoaluminate cement) and subsidiary AA as well as main material B (gypsum and lime) and subsidiary BB, with advantages of early strength, strong liquidity, and better expansibility. AA consists of suspension agent, dispersant and retarder. BB is composed of suspension agent, dispersant and accelerator.
The mechanical property of the high water grouting material can be affected by many factors [10,11], especially the components of the material. The influence of different water-binder (w/b) ratios on setting time and compressive strength of sulphoaluminate cement was studied by Tang [12]. It is reported that the optimal addition ratio of gypsum to lime is 4:1 according to different mixture analysis [8].
In addition, the pore structure and micromorphology are closely related to the macro mechanical property [13]. Lü [14] found that compressive strength of concrete incorporating silica fume shows no appealing correlations with total porosity, but decreases as the median pore size increases. Scanning Electron Microscope (SEM) observations confirmed that the high solubility of gypsum led to the formation of poorly crystallized hydrated phases, with a consequent more dense matrix and higher strength, studied by Allevi [15]. Zarnaghi [16] pointed that compressive strength of lightweight self-compacting concrete with different amounts of silica fume and water-to-cement ratios increases with the increase of pore fractal dimension and has a good correlation with fractal dimensions. However, when it comes to the high water grouting material, the correlation between strength and pore structure is deficient.
This study focused on the relationship between mechanical property and pore structure of the high water grouting material. The compressive strength with disparate mixtures was determined by strength test and the pore structure of different pore features was investigated by Mercury Intrusion Porosimetry (MIP), the high-resolution 3D X-Ray Microscopic imaging system (3D-XRM), Thermogravimetry (TG), and SEM methods, analyzing the influence of CaO content in lime, w/b ratio and curing age on the mechanical property and pore structure of the high water grouting material. Furthermore, the grey correlation coefficients between the compressive strength and the pore structure parameters were illustrated based on the grey correlation theory, providing a theoretical basis for its future application in the field of underground grouting engineering.

2. Materials and Methods

2.1. Raw Materials

The high water grouting material in this study consists of main material (A and B) as well as subsidiary material (AA and BB) [8,17]. Sulphoaluminate cement is used as material A, with a specific surface area of 380 m 2 / k g . Material B comprises gypsum and lime: the common gypsum and three kinds of limes (noted as L1, L2, and L3) with different CaO content were chosen in this study. The chemical composition of sulphoaluminate cement, gypsum, and three kinds of lime (L1, L2, and L3), determined by X-ray fluorescence, are presented in Table 1.
Materials AA and BB, independently developed by Xuzhou Boxia Mining Technology Company, were referred to as retarding dispersant and accelerator, respectively.
Clean tap water was adopted for mixing water.

2.2. Mix Formulation

Through trial research, the appropriate ratio of materials A:AA:B:BB is 1:0.1:1:0.1, and the optimum ratio of gypsum to lime in material B is 0.8:0.2 according to the research [8]. The choice of w/b ratio is very crucial for the grouting material, so three w/b ratios were selected as 1.0, 1.5, and 2.0 in the test, regarded as W1, W2, and W3, respectively. Besides, the CaO contents in different limes (L1, L2, and L3) and curing ages (5 h, 1 d, 3 d, 7 d, 14 d, and 28 d) were considered as variables. The details of the mixture proportions are summarized in Table 2.

2.3. Sample Preparation

For each group mentioned above, eighteen prismatic specimens were prepared for different curing ages. The grouting material consists of slurry A and slurry B. The diagram of sample preparation was shown in Figure 1. Firstly, material A and AA were stirred in the mixer for 60 s, and then the corresponding water was added to the mixer, mixing for another 240 s and obtaining slurry A. Meanwhile, slurry B was achieved similarly. After that, slurry A and slurry B were mixed for 120 s to complete the mixing sequence. Finally, the freshly blended paste was cast into the prism molds with the size of 40 mm × 40 mm × 160 mm, sealed with plastic foil, and then placed in a standard curing chamber with the ambient temperature of 20 ± 2 °C and relative humidity of 95 ± 5%. The specimens were demoulded after 5 h of casting and cured until the design age.

2.4. Analytical Methods

2.4.1. Compressive Strength Test

According to the Chinese standard GB/T17671-1999 [18], compression tests were conducted to measure the compressive strength of the high water grouting material, using a full dynamic cement strength testing machine. After being cured at the standard condition for predetermined age, the three specimens (40 mm × 40 mm × 160 mm) first experienced the flexural test and then the six remaining prisms (40 mm × 40 mm × 80 mm) were compressed at a uniform loading rate of 2400 N/s until they were damaged. The maximum loads were recorded to calculate the compressive strength. For each group, six compressive strength values of three specimens were measured and the results were averaged within the margin of error.

2.4.2. Pore Structure Analysis

The pore structures of blended pastes with different w/b ratios, CaO contents in lime, and curing ages, were characterized by MIP, and 3D-XRM. At the desired age, the specimens with a small size of 2 cm3 were obtained randomly from the prism samples. The hydration of specimens was ceased by immersing the crushed pastes into the anhydrous ethanol for 7 days, and the immersed specimens were dried in a vacuum oven at 60 °C for 48 h to remove the remaining water and ethanol.
Mercury Intrusion Porosimetry (MIP) is widely employed to investigate the pore structure of cementitious materials. The measurement range is generally from 4 nm to 360 μm. On the assumption that the shape of the pore is cylindrical and the equivalent pore diameter is inversely proportional to the pressure of the non-wetting fluid, the Washburn Equation is often applied to calculate the pore diameter [19,20] as in Equation (1):
d = 4 σ cos θ p
where d is the pore diameter, σ is the surface tension of mercury, θ is the contact angle between mercury and the pore surface, and p is the applied pressure. For the MIP experiment, the surface tension and the contact angle were chosen as 0.480 N/m and 140 degrees, respectively. The four groups of prepared specimens (W2L1-7d, W2L3-7d, W3L1-7d, and W2L1-28d) were put into a glass tube for a pressure test. The test was performed by Auto Pore Ⅳ 9510 from Micromeritics Instrument Corp.
The high-resolution 3D X-Ray Microscopic imaging system (3D-XRM) is a nondestructive method for pore structure analysis. The X-ray in the system passed through the rotating sample (W2L1-28d) to obtain the 2D projection image, and then the 3D reconstructed body and pore feature were analyzed. The rotation angle was 360 degrees and the resolution was 12.13 μm in the test. The high-resolution 3D X-ray microscopic imaging system (Xradia 510 Versa) produced by the Germany Karl Zeiss company was used [17,21].

2.4.3. Hydration Mechanism Analysis

Thermogravimetry and Derivate Thermogravimetry (TG-DTG) is performed to analyze the hydration products. The dried pieces described before were ground to a powder less than 200 mesh by a mortar. The prepared samples were heated from room temperature to 1000 °C with the heating rate of 5 °C/min by a synchronous thermal analyzer (model STA449F5), using a nitrogen atmosphere.
Scanning Electron Microscope (SEM) is adopted to investigate the microscopic morphology of the hydration products. The dried samples coated with gold were tested by the scanning electron microscope of American FEI Company (Model Quanta 250), with its accessories Energy Dispersive Spectrometer (EDS) for element analysis [22,23,24].

2.4.4. Grey Correlation Analysis Method

The correlation degree represents the degree of correlation between two system factors. In the process of system development, if variety trend of the two factors is consistent, the correlation between them is relatively higher. On the contrary, it is lower. Therefore, the grey correlation analysis method is a method to measure the correlation degree between factors according to the grey correlation degree (the degree of similarity or difference between the development trends of factors). The grey correlation coefficient is a measure of the grey correlation degree. The average value of the grey correlation coefficients is taken as the correlation degree. The closer the value is to 1, the better the correlation degree is [23,25,26].

3. Results and Discussion

3.1. Compressive Strength

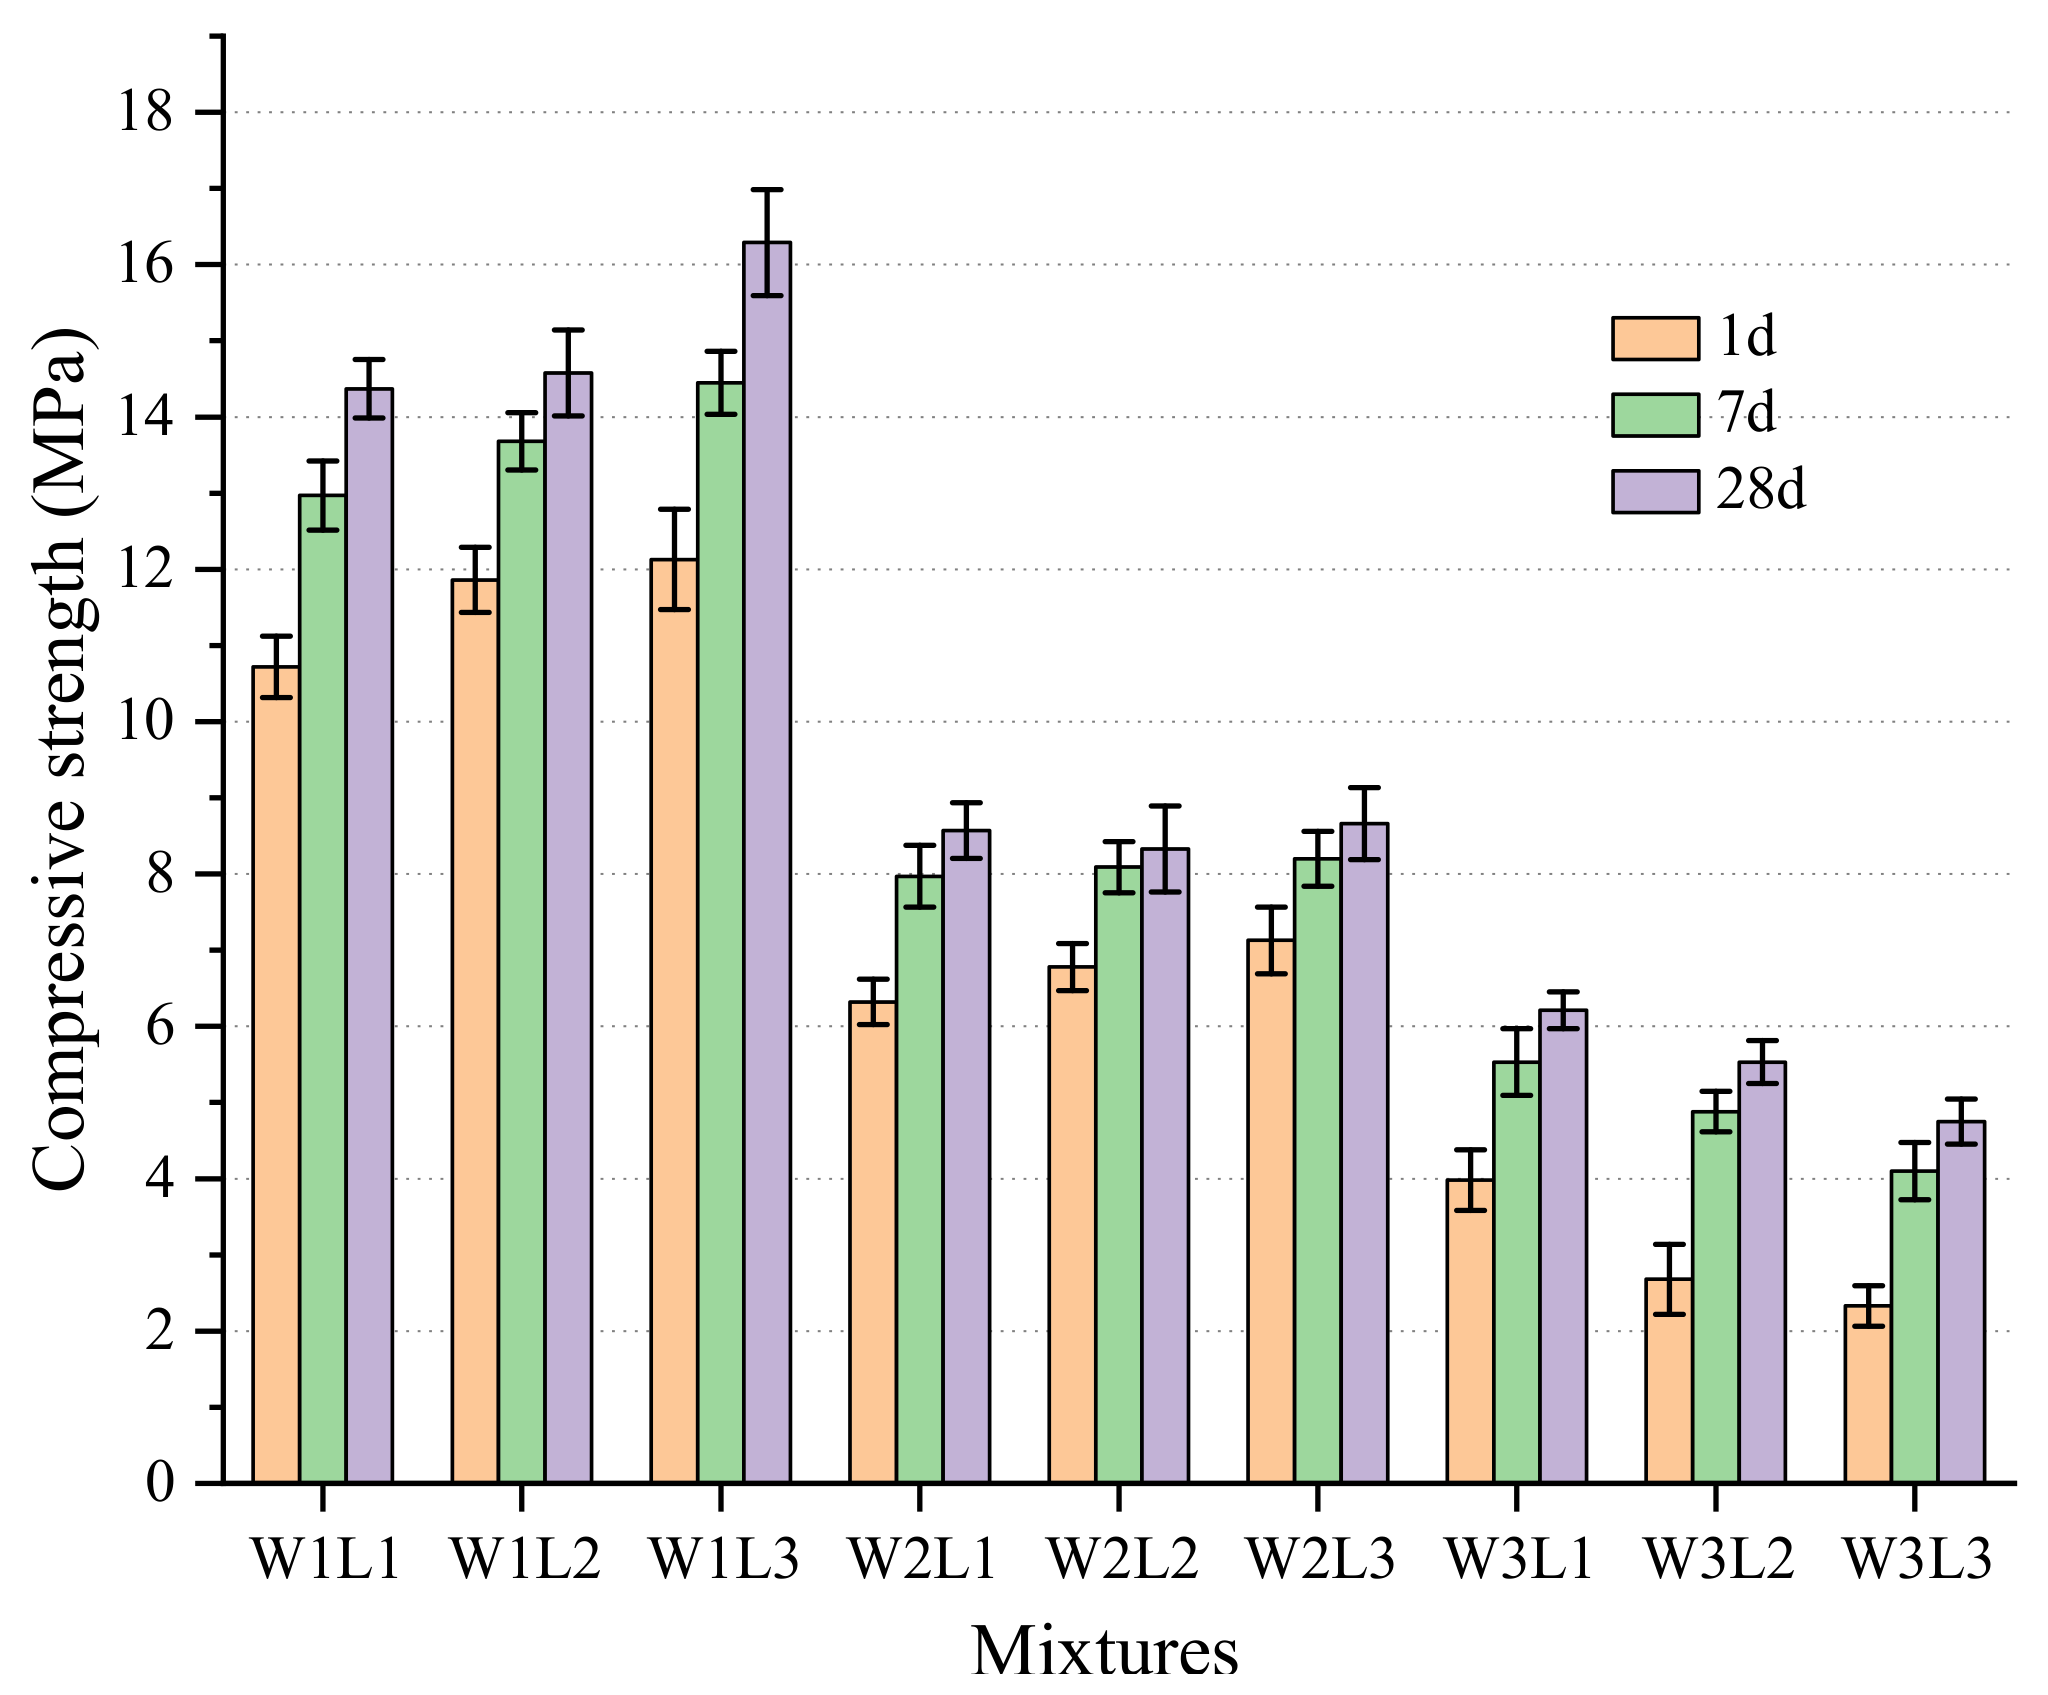
The compressive strengths of different mixtures were measured at 1 d, 7 d, and 28 d and are presented in Figure 2. It shows that the compressive strength of the sample is proportional to curing ages and inversely proportional to the w/b ratio. With the w/b ratio of 1.0, the 1 d compressive strength reached 76.8% of the 28 d strength averagely. In addition, the lower the w/b ratio is, the more excellent the early strength of the high water grouting material is. What is more, CaO content in lime plays a critical role in the development of compressive strength. With the increase of the CaO content, the 7 d compressive strengths of W1L2 and W1L3 had increased by 5.5% and 11.4% respectively, compared with that of W1L1. However, as the w/b ratio increases, the impact of CaO content on the compressive strength exhibits an opposite varying trend. The 7 d compressive strengths of W2L2 and W2L3 increased by 1.5% and 2.9% respectively compared to that of W2L1, while the 7 d compressive strengths of W3L2 and W3L3 decreased by 11.8% and 25.9% respectively compared with that of W3L1.

3.2. Pore Structure

3.2.1. The Results of MIP

As obtained from the mercury intrusion porosimetry test, the pore diameter range is 3 nm to 367 μm [17]. The pores are characterized as gel pores (<10 nm), transitional pores (10~100 nm), capillary pores (100~1000 nm), and large pores (>1000 nm). As shown in Figure 3 and Figure 4, the capillary pores and large pores within 100 nm to 2 μm dominate in the pores of different mixtures or curing age. Hence, the high water grouting material belongs to the macropore material when compared with common cementitious material [27,28].
Figure 3 depicts the pore size distribution (PSD) curves of cumulative pore volumes and differential pore volumes for pastes with different mixtures or curing times. The intrusion PSDs tell how much mercury penetrates porous media. As can be seen in Figure 3a–c, the mercury intrusion accumulates slowly at the large pores (>2000 nm) and then rapidly at the large pores (1000~2000 nm) and the capillary pores (200~1000 nm), similar in curve shape. However, a further analysis reflects the subtle influence of CaO content in lime, w/b ratio, and curing ages on the pore structure.
Figure 3d and Table 3 shows that the most probable pore diameter (corresponding to the peak of differential PSD) of W2L1-7d and W2L3-7d is 919.7 nm and 552.1 nm, respectively, indicating that the most probable pore size diameter decreases as the CaO content increases in lime when the w/b ratio is 1.5. As demonstrated in Figure 4, the pore volume fraction of pore diameter within 100~500 nm, 500~1000 nm, and 1000~10,000 nm of W2L1-7d account for 24%, 45%, and 18% respectively, while those of W2L3-7d occupy 52%, 32%, and 4% respectively, indicating that the CaO content in lime has a significant influence on the pore with the diameter of 100~10,000 nm. Though the cumulative mercury intrusion of W2L1-7d and W2L3-7d is 0.9005 mL/g and 0.9057 mL/g respectively, in little difference, the pore size distribution, and especially the most probable pore diameter, may have remarkable effects on compressive strength.
Comparing the mixture of W3L1-7d with W2L1-7d (Figure 3b), it can be seen clearly that the paste with the higher w/b ratio contained more porosity and total pore volume than the lower one, with the cumulative mercury intrusion of 1.3596 mL/g and 0.9005 mL/g, respectively. Moreover, the total pore area of W3L1-7d and W2L1-7d provided in Table 3 is 25.6 m2/g and 32.5 m2/g, respectively. Another notable finding from Figure 3e and Figure 4 is that the pore size distribution in the paste with a higher w/b ratio of 2.0 is mainly concentrated in the range of 500~1000 nm, accounting for 57% of total pore volume, which is due to the formation of water pocket and larger harmful pores within 500~1000 nm induced by a higher water content.
When it comes to the influence of curing ages, the W2L1-7d and W2L1-28d were selected to be examined by MIP. As seen from Figure 3 and Figure 4, the curing age has a negligible influence on the PSD of the pastes, attributing to the relatively complete hydrate reaction in the early stage, and thus the high water grouting material exhibits the excellent early strength performance. However, it is worth noting that the total pore area of the W2L1-7d and W2L1-28d is 25.6 m2/g and 22.2 m2/g, respectively, as shown in Table 3, and that the pore structure becomes denser as the curing time increases with further hydration.

3.2.2. The Results of 3D-XRM

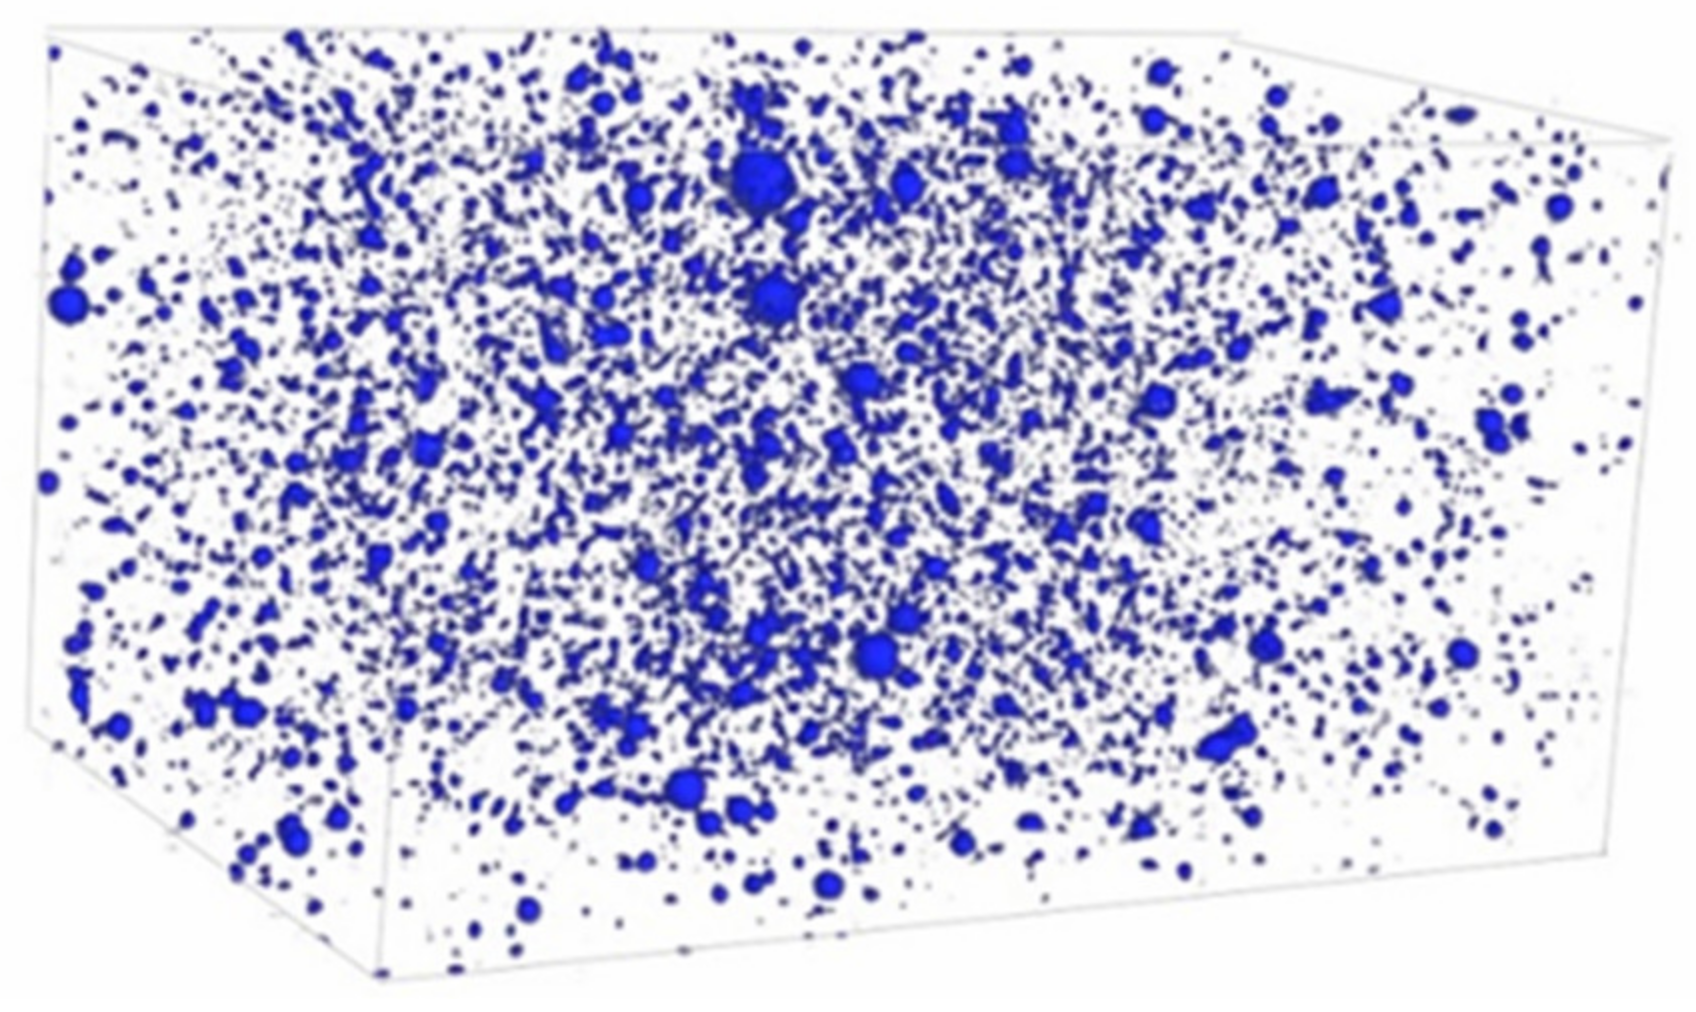
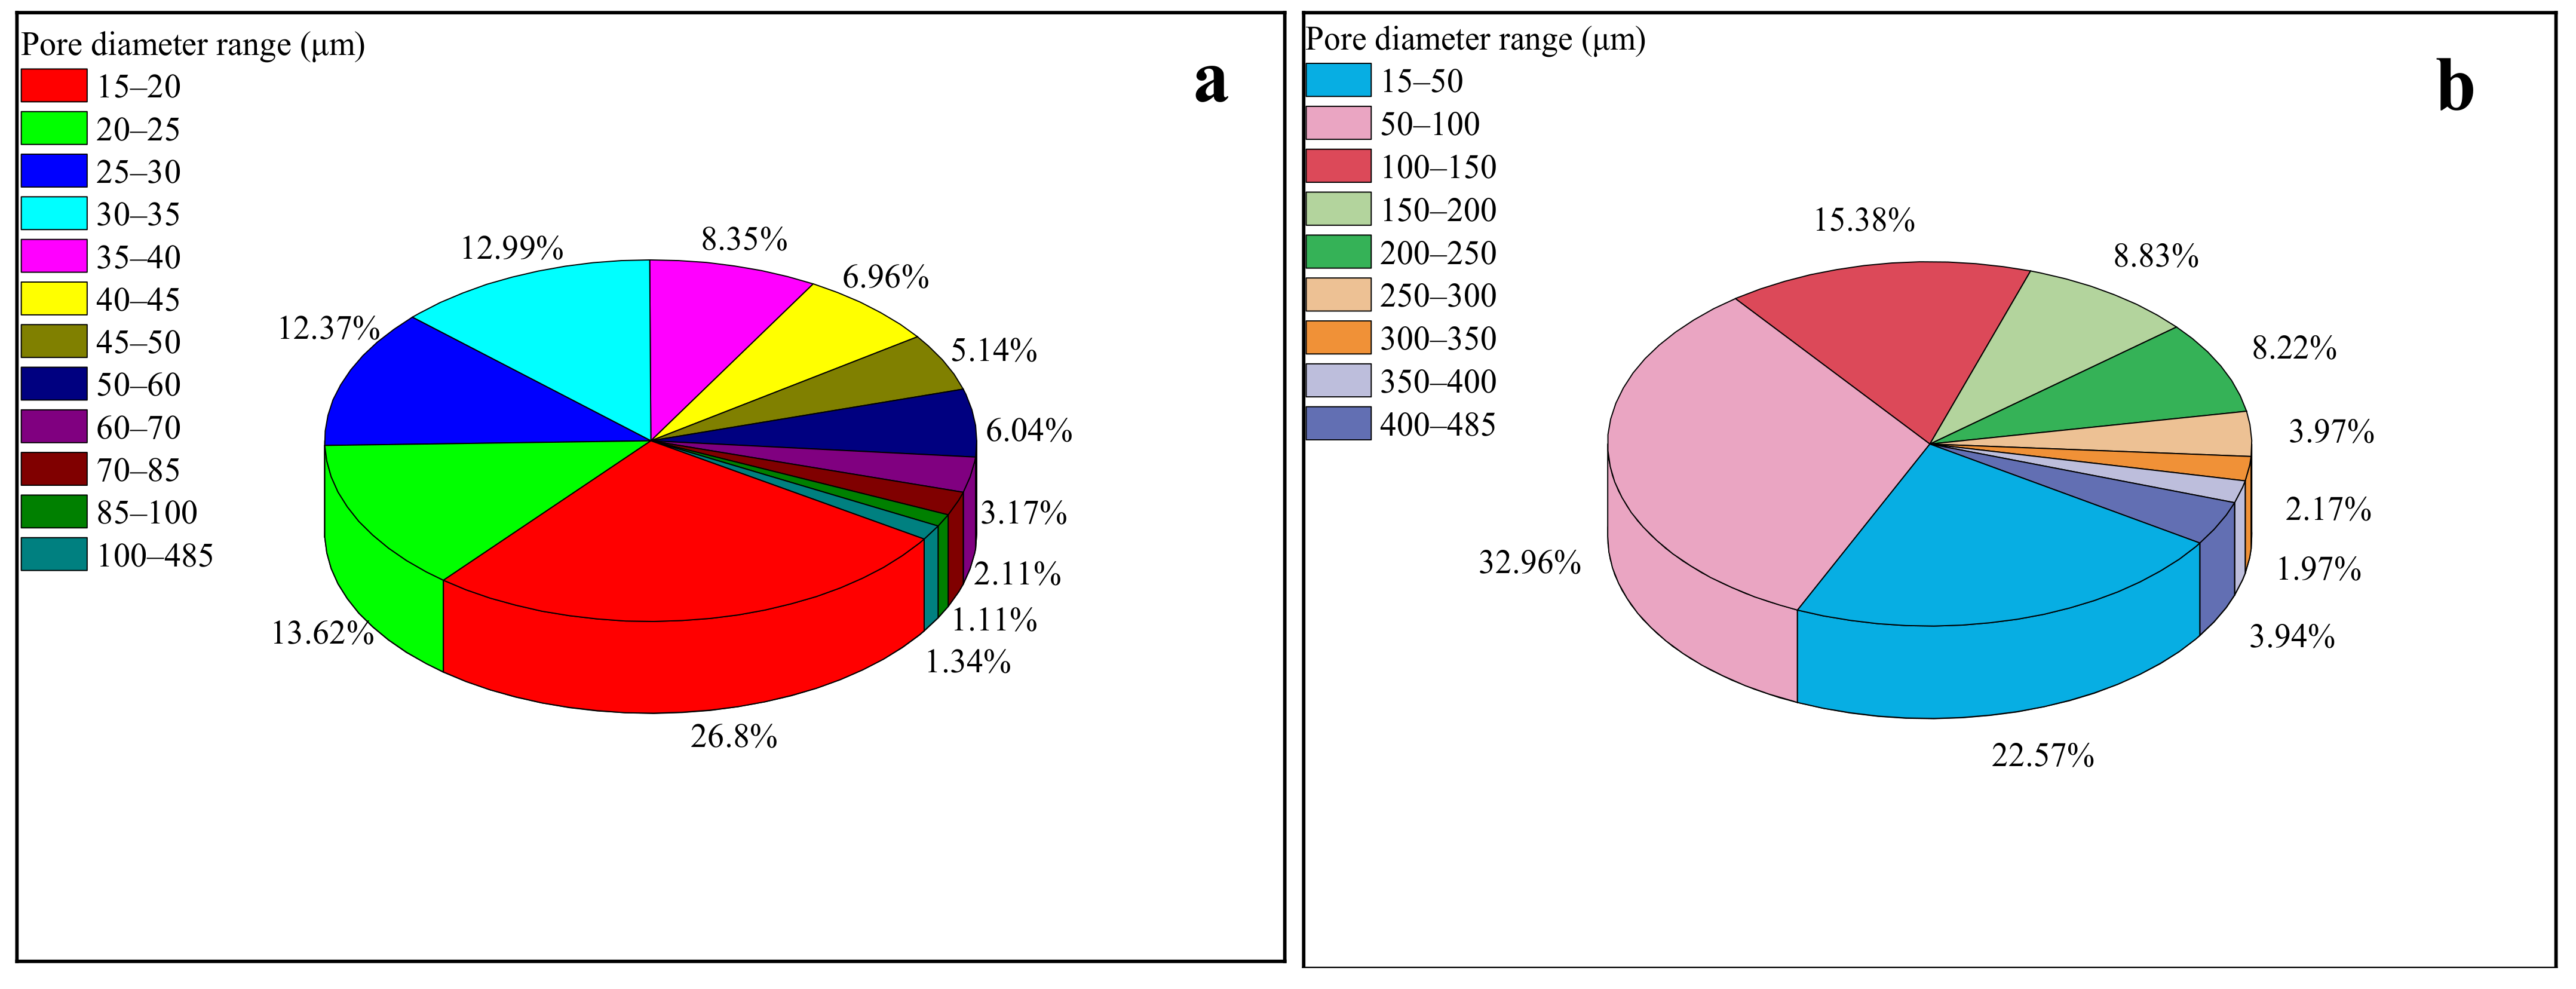
The 3D-XRM is more accurate to measure the pore with the pore size in the micron meter scale, and therefore the pore diameter range obtained from 3D-XRM is from 15.05 μm to 484.72 μm [17,21]. As we can see from Figure 5, the pore in the high water grouting material is almost spherical and is scattered homogeneously. Figure 6a further exhibits that the pore number decreases as the pore diameter increases. In addition, the majority of pores range from 15 to 50 μm, accounting for 86.22%, while the percentage of the pore within 50~100 μm and 100~485 μm is 12.44% and 1.34%, respectively, indicating that the number of large pores decreases rapidly. It also can be found from Figure 6b that the pores ranging from 100~485 μm occupy 44.48% in pore volume, while it is 1.34% in pore number. This could be one of the main reasons for inferior compressive strength.
For the macropores that exceed 15 μm, the results of pore volume percentage with different diameter ranges obtained by MIP and 3D-XRM were compared, as shown in Table 4. It can be found that the pore volume percentage within 15−100 μm is 57.27% and 55.53%, respectively, corresponding to the results of MIP and 3D-XRM, in very little difference. Nevertheless, as the pore diameter range increases, the difference between them grows, indicating that the 3D-XRM is more appropriate for the large pore in the micron scale.

3.3. Hydration Mechanisms

As depicted in Figure 7, the thermogravimetric results show that the mass-loss peak temperatures of different mixtures and curing ages occur at 86.5~96.0 °C, 228.5~237.7 °C, and 651.0~667.0 °C, corresponding to the dehydrations of ettringite (AFt) crystal and aluminum gel (AH3), together with the decarbonation of CaCO3, respectively [29,30,31]. Part of CaCO3 is generated by a carbonization reaction of Ca(OH)2 [30,31], and the other part is a small amount of CaCO3 contained in the raw material lime L1 (Table 1). In addition, the images (Figure 8) obtained from SEM and EDS exhibit the morphology and element distribution of the mixture W2L1-28d. There are plenty of needle-like and prismatic AFt crystals (Point 1) and amorphous Calcium Silicate Hydrate (C-S-H) gels (Point 2), shown in Figure 8 [23,32]. Therefore, it is concluded that the hydration products of the high water grouting material contain AFt, C-S-H, and AH3.
Combining the component of the raw materials and the hydration products, the equations of hydrate reaction can be inferred as follows [10,17]:
C 4 A 3 S ¯ + 2 C S ¯ H 2 + 34 H C 6 A S ¯ 3 H 32 ( AFt ) + 2 AH 3
2 C 2 S + 4 H C 3 S 2 H 3 ( C S H ) + CH
AH 3 + 3 CH C 3 AH 6
3 C S ¯ H 2 + C 3 AH 6 + 20 H C 6 A S ¯ 3 H 32 ( AFt )
It can be noticed from Figure 7 in DTG curves that the endothermic peak of AFt is strongest when compared with the other two peaks, in accordance with plenty of needle-like AFt crystals in SEM images from Figure 9, indicating that AFt is the uppermost hydration product. The AFt peak of W2L1-7d and W2L3-7d is almost the same, with little difference. However, when it comes to the influence of the CaO content in lime, it can be found from Figure 9a,b that the amorphous C-S-H gels increase with more CaO content in lime, which might due to the fact that more CaO participates in the hydrate reaction, facilitating the formation of C-S-H gels [31]. Comparing the thermogravimetric peaks (Figure 7) and the morphologies (Figure 9a,c) of W3L1-7d with W2L1-7d, the peak of AFt becomes slightly weaker and the microstructure becomes looser as the water increases. The most probable cause for these could be that the setting time of high water material increase with increasing w/b [8] and a higher w/b ratio contributes to the lower production of AFt crystals and C-S-H gels per unit volume. At the early curing age of 5 h, the peak of AFt in the DTG curve is obviously weaker than that of 7 d and there is a weak peak of dehydrate gypsum ( C S ¯ H 2 ). Besides, AFt crystals and C-S-H gels increase with the growing curing age as can be seen from Figure 9a,d. Therefore, the productions of hydration products of the high water grouting material are positively correlated with its compressive strength.

3.4. The Relationship Between Pore Structure and Compressive Strength

To some extent, porosity, pore diameter, and pore size distribution have a vital influence on the macro performance of the high water grouting material, and thus, the grey correlation theory was applied to evaluate the correlation between pore structure and compressive strength [23,25,26]. Furthermore, the relevant equation was established. According to the pore structure parameters of the four different samples obtained from the MIP test, the porosity, total pore area, most probable pore diameter, the mercury intrusion volume of the pore within 0~10 nm, 10~100 nm, 100~500 nm, 500~1000 nm, 1000~10,000 nm, and >10,000 nm, about 9 parameters, were taken as the reference sequence X,
X = x i k | i = 1 , 2 , , 9 ; k = 1 , 2 , , 4
Meanwhile, the compressive strength of the four mixtures was taken as the main sequence Y,
Y = y k | k = 1 , 2 , , 4
Thus, based on the consequence from the MIP test, the sequences X and Y with specific values were exhibited in Table 5.
Every data sequence was converted to the dimensionless value by dividing the mean of each array in the same influence factor. Then the sequence difference Δ i k were calculated and the minimum and maximum of them were selected:
Δ i k = Y ( k ) X i ( k ) , i = 1 , 2 , , 9 ; k = 1 , 2 , , 4
Finally, the average grey correlation degree was achieved on the basis of the equation as follows:
γ x i , y = 1 4 k = 1 4 min Δ i ( k ) + ξ max Δ i ( k ) Δ i ( k ) + ξ max Δ i ( k ) , i = 1 , 2 , , 9 ; k = 1 , 2 , , 4
where γ x i , y is the grey correlation coefficient, Δ i k is the sequence difference, and ξ , generally in the range of 0 to 1, is the identification coefficient, set as 0.5 here for the smaller error.
The results of the grey correlation degree are exhibited in Table 6 and Table 7. The grey correlation coefficients between pore characteristic parameters, pore size distribution, and compressive strength are more than 0.6, even up to 0.8 and 0.9, varied in degree, which indicates that the micropore structure is closely related to the compressive strength of the high water grouting material.
Apparently, it can be found that the grey correlation coefficients of the porosity and the most probable pore diameter reach 0.81089 and 0.80401, respectively, higher than the total pore area. Moreover, the compressive strength is inversely proportional to the porosity and the total pore area, as demonstrated in the previous three samples of 7 d curing age. With the curing age increasing, the most probable pore diameter and the total pore area decrease, contributing to the development of compressive strength.
As for the influence of pore size distribution, obviously, the capillary pores within the diameter range of 100 to 500 nm play the most important role in the compressive strength with the coefficient of 0.93416, and the next is the transition pores (10~100 nm), whose grey correlation coefficient attains 0.85787. The mercury intrusion volume of the sample W2L3-7d within 100~500 nm occupies 0.472 mL/g for some larger pores (>500 nm) turn into smaller pores (<500 nm) to dense the structure of the sample, corresponding to the higher compressive strength of 8.2 MPa, compared with other mixtures. Moreover, the compressive strength is inversely proportional to the mercury intrusion volume of large pores (>10,000 nm). Although the proportion of large pores (>10,000 nm) in the volume is small, it is the root of the sample failure, so it also has a great influence on the compressive strength, with the coefficient of 0.74904.
Above all, this illustrates that the porosity, the most probable pore diameter, and the pore volumes within 100~500 nm and 10~100 nm have a greater impact on the compressive strength.

4. Conclusions

Based on the above results and analysis, the following conclusions can be drawn for the high water grouting material:
(1)
The high water grouting material presents a high early strength characteristic, and the 1 d compressive strength reaches 76.8% of that at age of 28 d with the w/b ratio of 1.0. The compressive strength increases as the CaO content in lime increases with the w/b ratio of 1.0 or 1.5, while the inverse trend appears with the w/b ratio of 2.0. However, the influence mechanisms of CaO content in lime under different w/b ratios need to be further studied.
(2)
The high water grouting material belongs to the macropore material with the pores mainly within 100 nm to 2 μm. The pore structure has a remarkable impact on the macro mechanical property. The CaO content in lime is negatively correlated with the most probable pore diameter. The w/b ratio is positively correlated with porosity, total pore volume, and total pore area. The curing age is negatively correlated with the total pore area.
(3)
The hydration products of the high water grouting material contain AFt crystals, C-S-H gels, and AH3 gels. AFt is the uppermost hydration product. The productions of the hydration products are positively correlated with its compressive strength.
(4)
According to the grey correlation theory, the compressive strength of the high water grouting material is closely related to the pore characteristic parameters and the pore size distribution, especially the porosity, the most probable pore diameter, and the pore volumes within 100~500 nm and 10~100 nm.

Author Contributions

Conceptualization, J.X.; methodology, Y.H. and L.Y.; investigation, Q.S. and X.C.; data curation, Q.S. and L.Y.; writing—original draft preparation, Q.S., L.Y. and Y.H.; writing—review and editing, J.X., Y.H. and X.C.; funding acquisition, J.X. and Y.H. All authors have read and agreed to the published version of the manuscript.

Funding

This research was funded by National Natural Science Foundation of China (Grant No. 52074270), Jiangsu Collaborative Innovation Center for Building Energy Saving and Construction Technology (Grant No. SJXTBS1719), and Anhui Polytechnic University (Grant No. 2015YQ08).

Conflicts of Interest

The authors declare no conflict of interest.

References

  1. Chen, M.; Huang, Z. Experimental Research on Performances of Dry-Grinding Fine Cement of Grouting. J. Wuhan Univ. Technol. Mater. Sci. Ed. 2002, 17, 66–69. [Google Scholar]
  2. Huang, W.-H. Properties of cement-fly ash grout admixed with bentonite, silica fume, or organic fiber. Cem. Concr. Res. 1997, 27, 395–406. [Google Scholar] [CrossRef]
  3. Li, S.; Zhang, J.; Li, Z.; Gao, Y.; Qi, Y.; Li, H.; Zhang, Q. Investigation and practical application of a new cementitious anti-washout grouting material. Constr. Build. Mater. 2019, 224, 66–77. [Google Scholar] [CrossRef]
  4. Mirza, J.; Mirza, M.; Roy, V.; Saleh, K. Basic rheological and mechanical properties of high-volume fly ash grouts. Constr. Build. Mater. 2002, 16, 353–363. [Google Scholar] [CrossRef]
  5. Tekin, E. Ince Taneli Cimento (Rheocem 900) Karisimlarinin Reolojik Ozellikleri. J. Fac. Eng. Archit. Gazi Univ. 2011, 26, 777–785. [Google Scholar]
  6. Xia, J.; Zhang, L.; Yang, Y.; Yu, L. Experimental Study on Durability of Various Grouting Materials. J. Huazhong Univ. Sci. Technol. (Nat. Sci. Ed.) 2018, 46, 99–104. [Google Scholar]
  7. Zhang, J.; Guan, X.; Li, H.; Liu, X. Performance and hydration study of ultra-fine sulfoaluminate cement-based double liquid grouting material. Constr. Build. Mater. 2017, 132, 262–270. [Google Scholar] [CrossRef]
  8. Xia, J.; Su, Q.; Liu, D. Optimal gypsum-lime content of high water material. Mater. Lett. 2018, 215, 284–287. [Google Scholar] [CrossRef]
  9. Xia, J.; Zhao, W.; Liu, D.; Bai, J. Study on the hydration and hardening mechanism of the high-water rapid-setting material. IOP Conf. Ser. Mater. Sci. Eng. 2018, 439, 042044. [Google Scholar] [CrossRef]
  10. Zhang, Y.; Wang, Y.; Li, T.; Xiong, Z.; Sun, Y. Effects of lithium carbonate on performances of sulphoaluminate cement-based dual liquid high water material and its mechanisms. Constr. Build. Mater. 2018, 161, 374–380. [Google Scholar] [CrossRef]
  11. He, T.; Liu, C.; Ye, D.; Wang, Y. Experimental Study on Environmental Effects on the Compressive Strength of the High-Water-Content and Quick-Setting Stone. J. Sichuan Univ. (Eng. Sci. Ed.) 2014, 46 (Suppl. 1), 86–91. [Google Scholar]
  12. Tang, S.; Zhu, H.; Li, Z.; Chen, E.; Shao, H. Hydration stage identification and phase transformation of calcium sulfoaluminate cement at early age. Constr. Build. Mater. 2015, 75, 11–18. [Google Scholar] [CrossRef]
  13. Huang, L.; Cheng, G.; Huang, S. Effects of Calcination Conditions on the Formation and Hydration Performance of High-Alite White Portland Cement Clinker. Materials 2020, 13, 494. [Google Scholar] [CrossRef] [PubMed] [Green Version]
  14. Lü, Q.; Qiu, Q.; Zheng, J.; Wang, J.; Zeng, Q. Fractal dimension of concrete incorporating silica fume and its correlations to pore structure, strength and permeability. Constr. Build. Mater. 2019, 228, 116986. [Google Scholar] [CrossRef]
  15. Allevi, S.; Marchi, M.; Scotti, F.; Bertini, S.; Cosentino, C. Hydration of calcium sulphoaluminate clinker with additions of different calcium sulphate sources. Mater. Struct. 2015, 49, 453–466. [Google Scholar] [CrossRef]
  16. Zarnaghi, V.N.; Fouroghi-Asl, A.; Nourani, V.; Ma, H. On the pore structures of lightweight self-compacting concrete containing silica fume. Constr. Build. Mater. 2018, 193, 557–564. [Google Scholar] [CrossRef]
  17. Xie, W.; Xia, J.; Yu, L.; Chang, H. Porous Multiphase Microcharacteristics Research of New Cement-Based Grouting Material Concretion. Adv. Civ. Eng. 2021, 2021, 1–17. [Google Scholar] [CrossRef]
  18. China National Standards. Standards China Gb/T17671-1999: Method of Testing Cements-Determination of Strength; China National Standards: Beijing, China, 2004. [Google Scholar]
  19. Zou, C.; Long, G.; Xie, Y.; He, J.; Ma, C.; Zeng, X. Evolution of multi-scale pore structure of concrete during steam-curing process. Microporous Mesoporous Mater. 2019, 288, 109566. [Google Scholar] [CrossRef]
  20. Tatar, J.; Brenkus, N.R.; Subhash, G.; Taylor, C.R.; Hamilton, H. Characterization of adhesive interphase between epoxy and cement paste via Raman spectroscopy and mercury intrusion porosimetry. Cem. Concr. Compos. 2018, 88, 187–199. [Google Scholar] [CrossRef]
  21. Sun, Y.; Zhai, C.; Xu, J.; Cong, Y.; Qin, L.; Zhao, C. Characterisation and evolution of the full size range of pores and fractures in rocks under freeze-thaw conditions using nuclear magnetic resonance and three-dimensional X-ray microscopy. Eng. Geol. 2020, 271, 105616. [Google Scholar] [CrossRef]
  22. Xia, J.; Yu, L.; Su, Q. Study on mechanical properties and microstructure of the new grouting material. IOP Conf. Ser. Mater. Sci. Eng. 2018, 439, 042047. [Google Scholar] [CrossRef]
  23. Qiu, J.; Zhu, M.; Zhou, Y.; Guan, X. Effect and mechanism of coal gangue concrete modification by fly ash. Constr. Build. Mater. 2021, 294, 123563. [Google Scholar] [CrossRef]
  24. Xu, J.; Peng, C.; Wan, L.; Wu, Q.; She, W. Effect of Crack Self-Healing on Concrete Diffusivity: Mesoscale Dynamics Simulation Study. J. Mater. Civ. Eng. 2020, 32, 04020149. [Google Scholar] [CrossRef]
  25. Liu, J.; Li, Y.; Li, Y.; Sang, S.; Li, S. Effects of pore structure on thermal conductivity and strength of alumina porous ceramics using carbon black as pore-forming agent. Ceram. Int. 2016, 42, 8221–8228. [Google Scholar] [CrossRef]
  26. Zhang, M.; Yao, X.; Guan, J.; Li, L.; Wang, J.; Qing, L. Study of Concrete Strength and Pore Structure Model Based on Grey Relation Entropy. Material 2021, 14, 432. [Google Scholar] [CrossRef]
  27. Li, H.; Xue, Z.; Liang, H.; Guo, Y.; Liang, G.; Ni, D.; Yang, Z. Influence of defoaming agents on mechanical performances and pore characteristics of Portland cement paste/mortar in presence of EVA dispersible powder. J. Build. Eng. 2021, 41, 102780. [Google Scholar] [CrossRef]
  28. Zhang, Z.; Scherer, G.W. Physical and chemical effects of isopropanol exchange in cement-based materials. Cem. Concr. Res. 2021, 145, 106461. [Google Scholar] [CrossRef]
  29. Qoku, E.; Bier, T.A.; Westphal, T. Phase assemblage in ettringite-forming cement pastes: A X-ray diffraction and thermal analysis characterization. J. Build. Eng. 2017, 12, 37–50. [Google Scholar] [CrossRef]
  30. Gijbels, K.; Pontikes, Y.; Samyn, P.; Schreurs, S.; Schroeyers, W. Effect of NaOH content on hydration, mineralogy, porosity and strength in alkali/sulfate-activated binders from ground granulated blast furnace slag and phosphogypsum. Cem. Concr. Res. 2020, 132, 106054. [Google Scholar] [CrossRef]
  31. Han, Y.; Xia, J.; Chang, H.; Xu, J. The Influence Mechanism of Ettringite Crystals and Microstructure Characteristics on the Strength of Calcium-Based Stabilized Soil. Materials 2021, 14, 1359. [Google Scholar] [CrossRef] [PubMed]
  32. Atta-ur-Rehman; Qudoos, A.; Kim, H.G.; Ryou, J. Influence of Titanium Dioxide Nanoparticles on the Sulfate Attack upon Ordinary Portland Cement and Slag-Blended Mortars. Materials 2018, 11, 356. [Google Scholar] [CrossRef] [PubMed] [Green Version]
Figure 1. The diagram of sample preparation.
Crystals 11 00865 g001
Figure 2. Variation in compressive strength of the high water grouting materials.
Crystals 11 00865 g002
Figure 3. The pore size distribution of samples with different mixtures in cumulative (ac) and differential (df) forms.
Crystals 11 00865 g003
Figure 4. The distribution of pore volume with different mixtures.
Crystals 11 00865 g004
Figure 5. The three-dimensional reconstruction diagram of the pore phase with the mixture W2L1-28 d.
Crystals 11 00865 g005
Figure 6. The percentages of (a) pore quantities and (b) pore volumes in different diameter ranges of W2L1-28d.
Crystals 11 00865 g006
Figure 7. TG and DTG curves of the high water grouting material with different mixtures and curing ages.
Crystals 11 00865 g007
Figure 8. SEM and EDS images of the high water grouting material with W2L1-28d (MAG:3000×). (a) SEM, (b) EDS of Point 1, (c) EDS of Point 2.
Crystals 11 00865 g008
Figure 9. The morphologies with different mixtures: (a) W2L1-7d; (b) W2L3-7d; (c) W3L1-7d; (d) W2L1-28d.
Crystals 11 00865 g009
Table 1. Chemical composition of material A, gypsum, L1, L2, and L3.
MaterialMass Fraction (%)
CaOAl2O3SiO2Fe2O3SO3MgOK2ONa2OCO3P2O5TiO2Others
A40.7633.667.412.4390.920.290.163.650.211.260.27
Gypsum36.330.171.070.0445.482.850.04/13.67//0.29
L169.060.851.620.230.440.820.03/26.84//0.17
L288.120.491.150.130.159.870.02/0.00//0.08
L398.80//////////1.20
Table 2. The mixture proportions of the high water grouting materials.
Mixturesw/bSlurry ASlurry B
AAAWaterGypsumLimeBBWater
W1L11.0100101108020 (L1)10110
W1L21.0100101108020 (L2)10110
W1L31.0100101108020 (L3)10110
W2L11.5100101658020 (L1)10165
W2L21.5100101658020 (L2)10165
W2L31.5100101658020 (L3)10165
W3L12.0100102208020 (L1)10220
W3L22.0100102208020 (L2)10220
W3L32.0100102208020 (L3)10220
Table 3. The characteristic parameters of MIP pore structure for the high water grouting material samples with different mixtures.
MixturesPorosityTotal Pore Volume
(mL/g)
Total Pore Area
(m2/g)
Most Probable Pore Diameter
(nm)
W2L1-7d65.92%0.900525.6919.7
W2L3-7d66.12%0.905722.4552.1
W3L1-7d74.77%1.359632.5835.6
W2L1-28d67.71%0.986022.2748.1
Table 4. Pore volume percentages within different diameters of W2L1-28d by MIP and 3D-XRM test (D > 15 μm).
Pore Diameter Range (μm)Pore Volume Percentage
MIP3D-XRM
15 < D < 10057.27%55.53%
100 ≤ D < 20014.55%24.21%
200 ≤ D < 30010.45%12.19%
D ≥ 30017.73%8.08%
Table 5. The various parameters of sequence X and Y.
Samples
(k)
Pore Structure ParametersPore Size Distribution (mL/g)Compressive Strength
(Mpa)
Porosity
(%)
Total Pore Area
(m2/g)
Most Probable Pore Diameter
(nm)
0~10 nm10~100 nm100~500 nm500~1000 nm1000~10,000 nm>10,000 nm
X1X2X3X4X5X6X7X8X9Y
1(W2L1-7d)65.9225.6919.70.0170.07490.21880.40180.15880.02927.97
2(W2L3-7d)66.1222.4552.10.01130.07810.4720.28530.03220.02688.2
3(W3L1-7d)74.7732.5835.60.01970.10190.34470.78000.06710.04625.53
4(W2L1-28d)67.7122.2748.10.01310.08370.2170.44880.19810.02538.57
Table 6. Grey correlation coefficients between pore characteristic parameters and compressive strength.
γ (xi, y) xPorosityTotal Pore AreaMost Probable Pore Diameter
y
Compressive Strength0.810890.669060.80401
Table 7. Grey correlation coefficients between pore diameter distribution and compressive strength.
γ (xi, y) xi0~10 nm10~100 nm100~500 nm500~1000 nm1000~10,000 nm>10,000 nm
y
Compressive strength0.640190.857870.934160.784470.681540.74904
Publisher’s Note: MDPI stays neutral with regard to jurisdictional claims in published maps and institutional affiliations.