Article

DC Ionic Conductivity in KTP and Its Isomorphs: Properties, Methods for Suppression, and Its Connection to Gray Tracking

1
Integrated Quantum Optics, Paderborn University, 33098 Paderborn, Germany
2
Theoretical Materials Physics, Paderborn University, 33098 Paderborn, Germany
3
Institute for Photonic Quantum Systems (PhoQS), Paderborn University, 33098 Paderborn, Germany
*
Author to whom correspondence should be addressed.
Crystals 2022, 12(10), 1359; https://doi.org/10.3390/cryst12101359
Submission received: 30 August 2022 / Revised: 21 September 2022 / Accepted: 22 September 2022 / Published: 26 September 2022
(This article belongs to the Special Issue Research and Development of Ferroelectric Material)

Abstract

:
We study the DC conductivity in potassium titanyl phosphate (KTiOPO4, KTP) and its isomorphs KTiOAsO4 (KTA) and Rb1%K99%TiOPO4 (RKTP) and introduce a method by which to reduce the overall ionic conductivity in KTP by a potassium nitrate treatment. Furthermore, we create so-called gray tracking in KTP and investigate the ionic conductivity in theses areas. A local unintended reduction of the ionic conductivity is observed in the gray-tracked regions, which also induce additional optical absorption in the material. We show that a thermal treatment in an oxygen-rich atmosphere removes the gray tracking and brings the ionic conductivity as well as the optical transmission back to the original level. These studies can help to choose the best material and treatment for specific applications.

1. Introduction

Potassium titanyl phosphate (KTiOPO4; KTP) is one of the most common materials used in nonlinear optics. It was first synthesized in a molten potassium pyrophosphate and orthophosphate flux by Ouvrard [1] in 1890. The family of KTP shows isomorphs, which can be described by MTiOXO4, with M being, i.a., potassium (K), rubidium (Rb), or cesium (Cs) and X being either phosphorus (P) or arsenic (As). The crystallographic structure of the isomorphs remains the same as for KTP, which is orthorombic, and belongs, at room temperature, to the point group mm2 and the space group Pna21 [2]. Stoichiometric KTP cannot be grown. Regardless of the growth method, a deficit of M ions occurs in crystals from the KTP family during the growth process. In KTP grown from the KTP/K6-flux [3,4],
3 KH 2 PO 4 + 2 K 2 HPO 4 + TiO 2 KTiOPO 4 + K 6 P 4 O 13 + 4 H 2 O ,
high concentrations of K vacancies (500–800 ppm) have been observed [5]. These vacancies can be charge-compensated by positively charged oxygen vacancies [6] and by holes trapped at bridging oxygen ions between two titanium ions [7]. The crystallographic structure of KTP, which is composed of TiO6 octahedral and PO4 tetrahedral structures, permits a K+-ion diffusion along the polar c axis [8,9]. This diffusion of ions takes place via a vacancy-hopping mechanism [10], which results in an ionic current in the material. Because ions must migrate through a bottleneck consisting of oxygen ions, the ionic conductivity is limited at low voltages. However, with an increasing external field the ionic conductivity increases exponentially. Thus, ionic conductivity values have to be compared at the same field strength. The ionic conductivity of KTP is a significant drawback, which restrains its applicability for operations with DC or slowly varying electric fields, like for periodic poling [11] or electro-optical modulation [12]. For this reason, the characterisation of ionic conductivity and understanding how to manipulate it are of paramount importance to fully exploit the properties of this class of materials [13]. Several attempts to reduce the ionic conductivity in KTP-type crystals can be found in the literature [5,14,15,16,17]. However, most investigations analyse the AC conductivity [18,19,20], whereas the DC conductivity is not analysed in detail [21,22]. A reduction of the ionic conductivity can be achieved by a reduction of the temperature. At room temperature, a typical ionic conductivity along the polar axis of a KTP crystal is σ c = 10 6 1 Ω cm . With a decrease in the crystal temperature, the ionic conductivity is strongly reduced, e.g., to σ c = 10 12 1 Ω cm at T = 170 K [15]. Furthermore, a potassium treatment can enhance the stoichiometry of the crystal. An increased stoichiometry leads to fewer K+ vacancies, which reduces the hopping conductivity.
In the optical domain, an important phenomenon that hampers the usage of KTP crystals in high optical power applications, e.g., in laser cavities or waveguide structures, is the appearance of gray tracking in the crystal itself [23]. Gray tracking is fatigue damage caused by crystal defects, characterized by their colored appearance, commonly referred to as darkening. It impairs the linear and nonlinear properties of the crystal through optical power loss and is associated with high optical absorption, which is particularly detrimental for optical applications requiring high efficiencies. This can lead to catastrophic damage in high-power experiments and even to the destruction of the crystal itself [23]. Several experiments have been conducted to investigate and understand the origin of gray tracking [7,24,25,26]. However, an exact description of the physical mechanism behind gray tracking is still an open question [27,28,29]. In 1992, Loiacono et al. [25] observed gray tracking in samples illuminated by monochromatic light at a 530 nm wavelength. This wavelength corresponds to an absorption wavelength in Ti3+ centers. Therefore, they speculated a reduction process from Ti4+ to Ti3+ as the origin of the increased absorption in the material. Already in 1989, Roelofs could detect Ti3+ in gray-tracked samples [7], which were caused by the application of external electric fields, commonly used for periodic poling in nonlinear optical applications.
In this paper, we analyse variously doped members of the KTP family, namely potassium titanyl arsenide (KTA), potassium titanyl phosphate (KTP), and rubidium-doped KTP (RKTP), where the KTP crystals contain between 1.0% and 1.5% of rubidium, and compare the ionic conductivity at different electric field strengths. We show that our approach reduces the overall ionic conductivity in KTP by treatment with potassium nitrate and show that the conductivity can be reduced by one order of magnitude. Following these experiments, we investigate the influence of gray tracking on the ionic conductivity and show that, in addition to the optical transmission, the conductivity is also reduced in gray-tracked areas. Both effects, the reduced conductivity and the reduced transmission, can be brought back to the original value before gray tracking by thermal treatment, which is critical for the fabrication and operation of optical devices. The appearance of gray tracking has to be prevented during operation, which can be assisted by an optimised fabrication process, e.g., by reducing the ionic conductivity using our introduced method. These studies can help to choose the best material and treatment for specific applications, e.g., to reduce gray-tracking effects during periodic poling in quasi-phase-matched applications or for devices using high optical-power densities.

2. Experimental Methods

Several samples of KTP, KTA, and RKTP single crystals with electrodes coated on the +c and −c side were used for the measurements described below. We used samples with dimensions of 6–6–1 mm3 along the crystallographic a, b, and c axes, cut from commercially available flux-grown wafers. Gold–palladium (AuPd) was sputtered to make electrodes used for electrical contact in the center of the samples. To measure the average ionic conductivity of the material, we contacted the samples by using a liquid electrode (mixture of water and KNO3) and the AuPd electrode on the −c side and on the +c side of the sample only of the AuPd electrode. We used a high-voltage amplifier (Trek 2020C) to generate high-voltage pulses. The voltage was applied in the same direction as the spontaneous polarisation to prevent an additional component induced by domain inversion. The conductivity increases nonlinearly with an increasing electric field strength. We increased the voltage with a linear ramp of DC voltage from zero to the maximum applied voltages within 1 ms. The maximum voltage depends on the material (see Figure 1), and is chosen close to the coercive field strength of each material.
Because KTP is one of the most common materials in nonlinear optics, we investigated this material in more detail. We introduced a potassium treatment to reduce and homogenize the ionic conductivity of the material. We immersed the wafer in pure KNO3 for 24 h at a temperature of 375 °C. During this process, the wafers were also annealed at a high temperature. This treatment aims to homogenize and redistribute potassium ions inside the crystal, ideally reducing the density of K vacancies and thus reducing the ionic conductivity. For our gray-tracking experiments, we first had to create gray-tracking areas in the samples. We applied high-voltage pulses along the crystallographic c axis to an undoped KTP sample by using the high-voltage amplifier. An electric field above 3 kV mm is sufficient to introduce gray tracks. We used the Trek (2020C) to analyse the ionic conductivity in such gray-tracked samples in the same electrical setup as before, but we measured smaller areas allowing for spatially resolved measurements. For this, we removed the AuPd metal electrodes on the −c side and contacted the samples by using a metal stamp with a diameter of 0.5 mm2. We measured the conductivity on different positions with a distance of 0.5 mm along the a and b direction. Afterward, the gray tracking was reversed by annealing in an oxygen-rich atmosphere [30]. Thermal annealing in pure oxygen can recover gray-tracked samples or even increase the transmittance of as-grown KTP [30]. Therefore, we analysed the optical transmission by using a spectrometer (Agilent, Cary UV–VIS–NIR 6000, Santa Clara, CA, USA) and the ionic conductivity in gray-tracked and annealed samples.

3. Results

3.1. Reducing the Ionic Conductivity in KTP

We characterized 1 mm thick KTP, KTA, and RKTP by monitoring the ionic current as a function of the applied voltage as shown in Figure 1. In order to compare different values and materials, we measure at the same field strength. We choose 2 kV mm in our experiments.
KTP shows an ionic conductivity of 44 μ S · cm 1 (see dark blue line in Figure 1). In total, we measured ten KTP wafers, which showed an average conductivity of 36 ± 11 μ S · cm 1 . A small amount of Rb doping in KTP (red line) lowers the ionic conductivity to 2 μ S · cm 1 . The ion mobility highly depends on the ion species [31,32,33], which makes the movement of the K ions easier compared to Rb ions. If a chain is already blocked by one Rb atom, the migration of K ions along the c axis is also hindered. Therefore, the overall ionic conductivity is reduced. In RTP crystals, there is no K present, and the Rb ions occupy all M sites. However, the ion conductivity here is not significantly lower compared to RKTP, because the chains relevant for the vacancy-migration mechanisms are already blocked in the latter [14]. In contrast to that, the measurement shows that KTA (orange line) exhibits the highest ionic conductivity of 658 μ S · cm 1 . Pure KTP (blue line) shows a six-times lower ionic conductivity. We attribute this to non-perfect crystal compositions and impurities in KTA, which lead to a higher concentration of potassium vacancies [25]. A lower amount of K-ion vacancies suggests a possible way to reduce ionic conductivity, which is explored by a potassium treatment.
We compared KTP wafer from two different vendors, Roditi and Bright Crystals Technology (BCT). Figure 2 shows the average conductivity of a wafer from Roditi and BCT for as-grown, thermally treated (annealed) and potassium-treated wafers.
First, we measured the ionic conductivity in one wafer from each company at 500 V mm before any treatment. A thermal annealing, which could homogenize the ionic conductivity distribution of the wafer, does not result in a lower conductivity (compare to Figure 2). After that, we applied the K treatment on the same wafers. In the case of KTP material from Roditi, it is possible to reduce the ionic conductivity by one order of magnitude. The wafer from Roditi shows one order of magnitude higher conductivity in comparison to the wafer from BCT, as shown in Figure 2. It is worth noting that the wafers were grown at a distance of three years, so the fabrication technique might have improved, resulting in a lower conductivity. Even after a potassium treatment of the material from Roditi, the ionic conductivity is higher than of the initial BCT material. We could not observe an effect on the homogeneity or the absolute number of the conductivity after an annealing or a potassium treatment of BCT material (compare Figure 2). We conclude, no additional pre-treatment step is necessary in the BCT wafer.

3.2. Ionic Conductivity in Gray-Tracked Areas

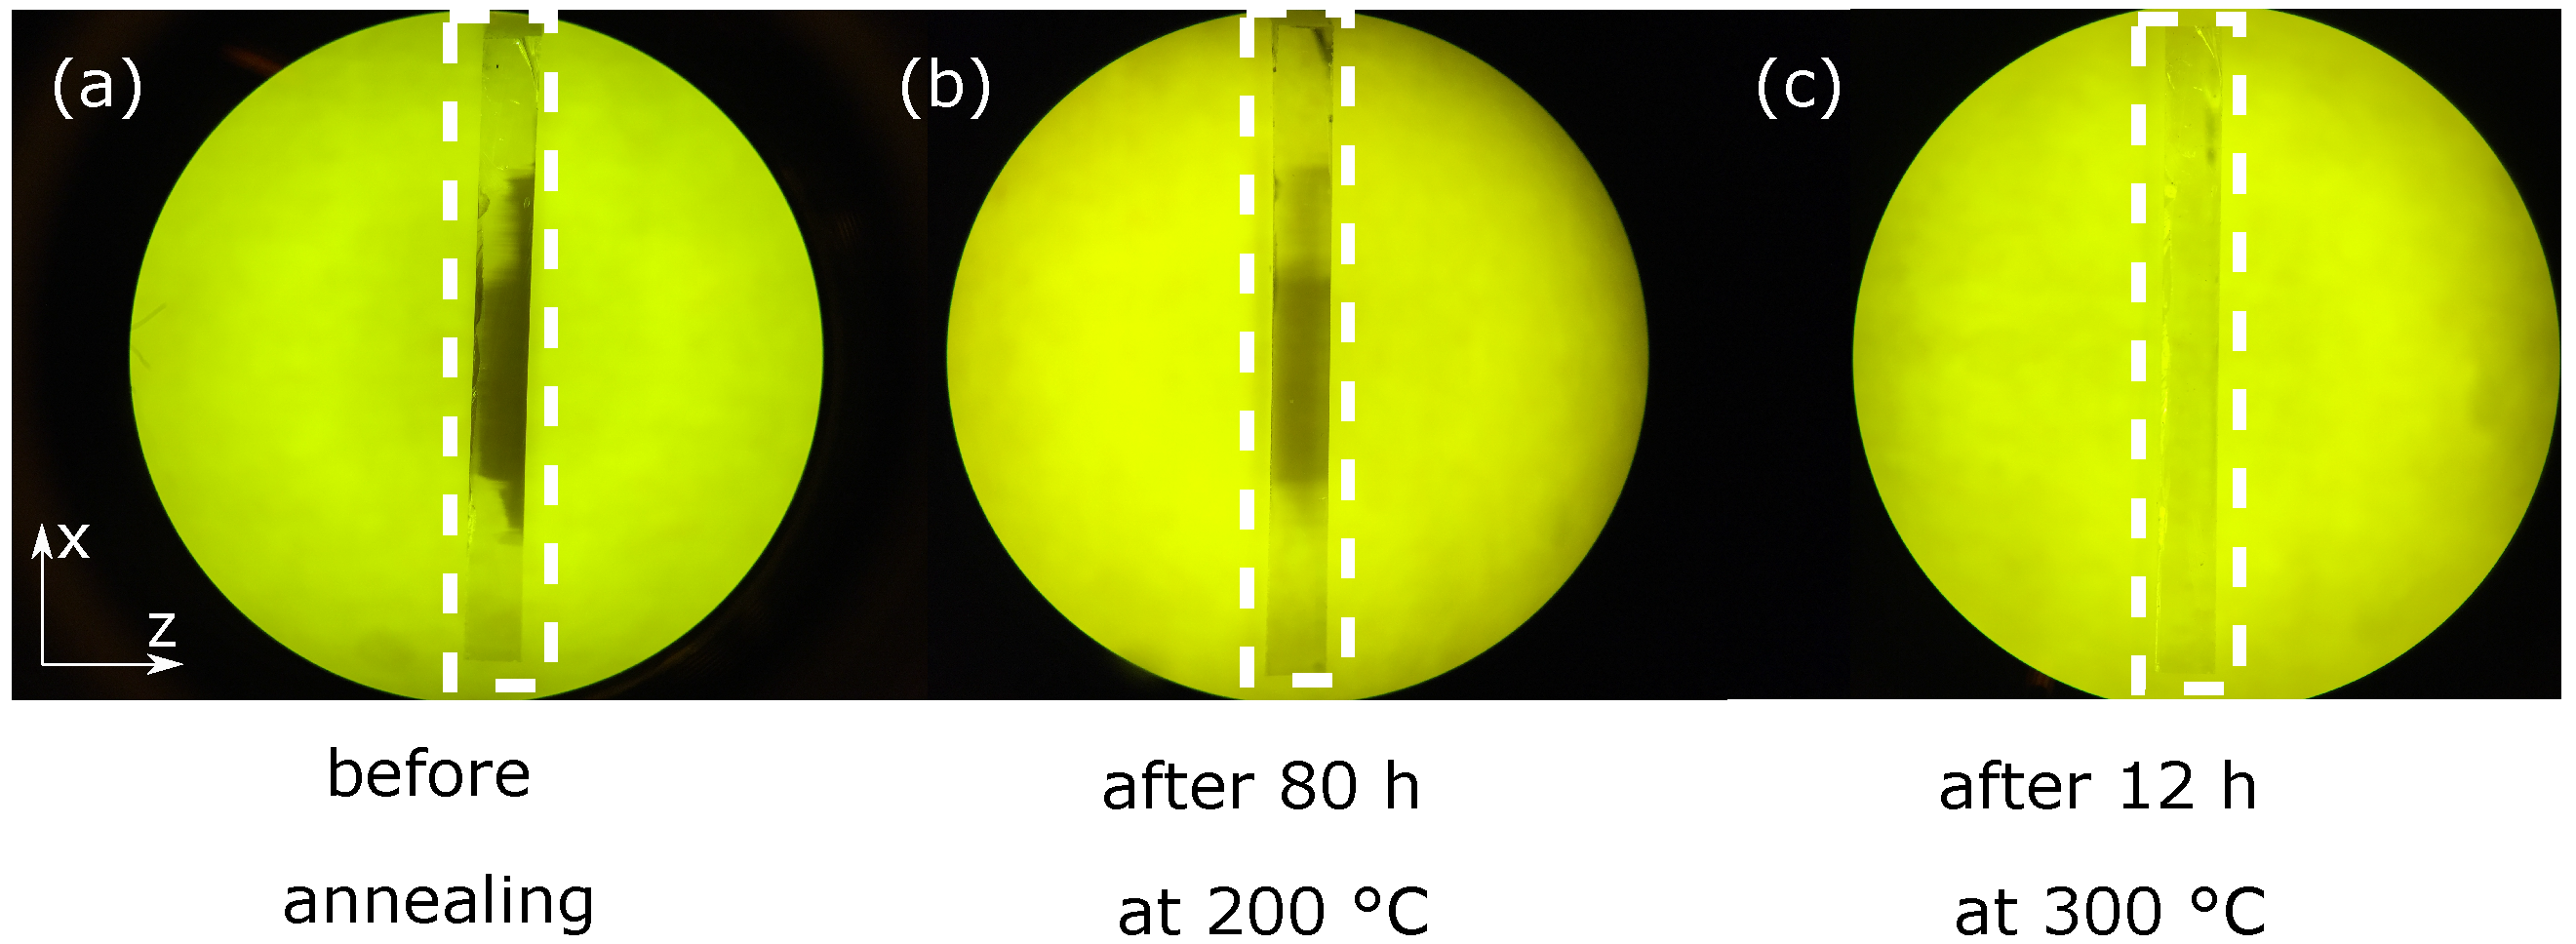
For our experiments in gray-tracked samples, we applied 30 high-voltage pulses along the crystallographic c axis to an undoped KTP sample from BCT, which results in gray-tracking areas. We took microscope images of the samples and show them for different annealing steps in Figure 3.
An image of the y surface was recorded in transmitted light so that the gray-tracking growth direction can be examined. An electric field above 3 kV mm introduces gray tracks starting from the −c side and growing deep into the crystal to the opposite electrode. The gray tracks look like needles that grow into the crystal (compare Figure 3a).
We have characterized the optical absorption in the gray-tracked sample by a transmission measurement and compared the transmission of an as-grown, gray-tracked region, for 120 h at 200 °C annealed and for 12 h at 300 °C annealed sample. The corresponding measurements of the sample at the specific process step can be found in Figure 4. We measured the absolute transmission along the c axis of unpolarized light in the wavelength range between 350 nm and 700 nm. The transmission is not corrected for Fresnel reflections at the two surfaces.
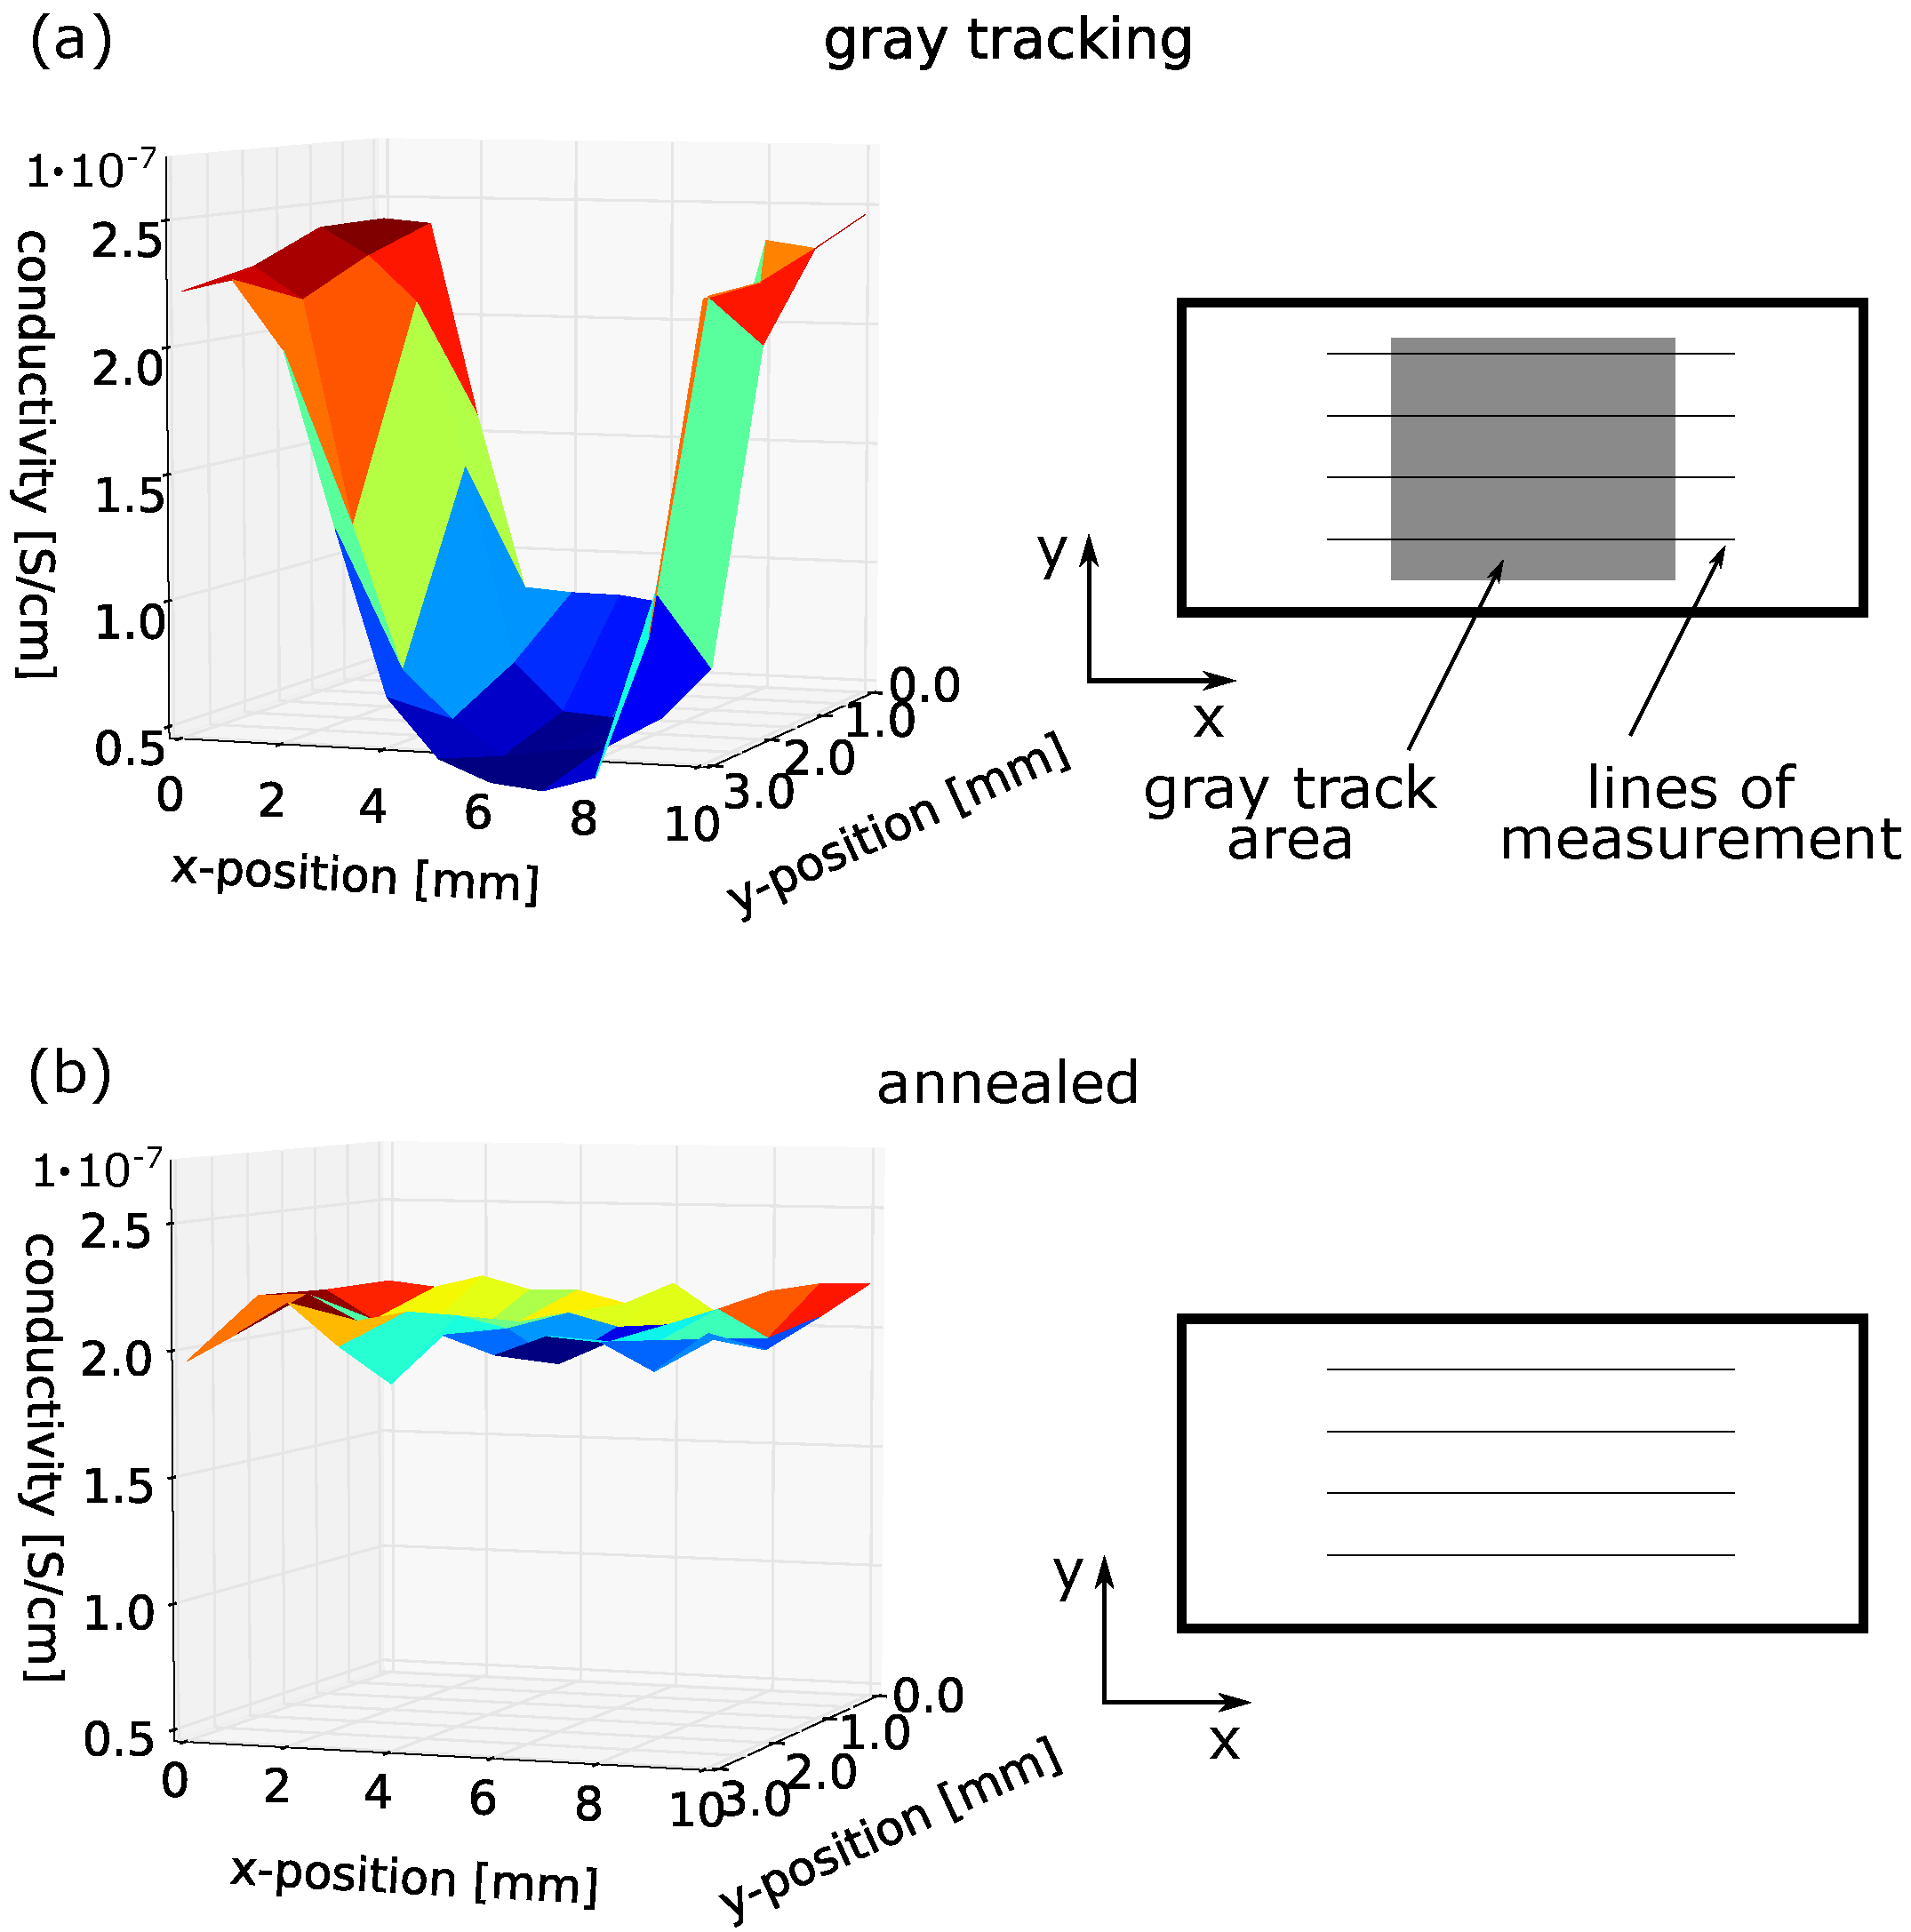
To characterize the electrical properties of the gray-tracked region, we measured the ionic conductivity of the material in different positions inside the gray-tracked area. To this aim, we used a small electrode with a diameter of 0.5 mm, which allows for a scanning of different position on the sample. In Figure 5a, the local ionic conductivity is shown. In gray-track areas, the ionic conductivity is clearly reduced. The schematic sketch on the right-hand side of Figure 5a indicates the gray-tracked area on the KTP sample. The horizontal black lines show the lines on which we measured the conductivity.
We interpret the origin of the reduced ionic conductivity by the oxygen ions to be generated by the gray tracking [26]. The oxygen ions move along the crystal c axis to the surface and block the movement of K ions through the one-dimensional channels and reducing the ionic conductivity as a result. The mechanism is not fully understood, as discussed in the introduction of this paper.
To study the reversibility of gray tracking, we annealed the gray-tracked sample in an oven with an oxygen-enriched atmosphere over 120 h at 200 °C. This had only a small effect on the gray tracking. The effect of 80 h annealing can be seen in Figure 3b and after 120 h in the transmission measurement in Figure 4 (orange line). An annealing at 300 °C in an oxygen-enriched atmosphere for 12 h removed the gray tracking and the sample is transparent again (see Figure 3c). After annealing, the ionic conductivity increases (see Figure 5b) to values comparable to non-gray-tracked areas (see red areas in Figure 5a).
The gray-tracked areas show a reduced ionic conductivity, which can be reversed by a thermal annealing step in an enriched oxygen atmosphere at 300 °C for 12 h. In RKTP, it was not possible to create gray-tracked samples by applying high-voltage pulses to the sample. We assume this behaviour is induced by the already-reduced ionic conductivity of the rubidium doping. Because the gray tracking occurs through high-voltage pulses, one has to be cautious that this phenomenon can occur during high-voltage operations, e.g., in optical modulators or periodic poling [11].

4. Conclusions

In this work, we investigated the DC ionic conductivity of different members of the KTP family. We showed that it is possible to reduce the overall ionic conductivity in KTP crystals by a potassium treatment in a KNO3 melt. Independent of the K treatment, we assume the crystal quality improved over the years, resulting in a lower ionic conductivity. Furthermore, we induced gray tracking in KTP samples by applying several high-voltage pulses and analysed the ionic conductivity in the gray-tracked regions. We showed that a thermal treatment in oxygen-rich atmosphere at 300 °C removes the gray tracking and brings the ionic conductivity back to the original level. We thus suggest that gray tracking is a relevant parameter linked to the ionic conductivity of the material. The behaviour of gray tracking linked to ionic conductivity is strongly supported by so-called gray track-resistant KTP, which contains a small amount of Rb and shows a drastically reduced ionic conductivity and, at the same time, much lower appearance of gray tracking. Although the link between ionic conductivity and gray tracking is strongly supported by our investigations, we have no direct evidence for it at the moment. To face this issue, further investigations are necessary, such as a systematic comparison of potassium-vacancy-density investigations and theoretical modelling of the ionic conductivity and gray-tracking link. Beyond this paper, these studies can help to choose the best material and treatment for specific applications.

Author Contributions

Conceptualization, C.E. and C.S.; methodology, C.E., L.P. and A.B.; software, M.S. and A.B.; investigation, C.E., L.P. and V.Q.; writing—original draft preparation, L.P., V.Q., A.B., M.S., U.G., W.G.S., C.S. and C.E.; writing—review and editing, A.B., W.G.S., C.S. and C.E.; project administration, C.E. and W.G.S.; funding acquisition, C.E., U.G., W.G.S. and C.S. All authors have read and agreed to the published version of the manuscript.

Funding

This research was funded by the Deutsche Forschungsgemeinschaft (DFG, German Research Foundation)–SFB-Geschäftszeichen TRR142/3-2022–Projektnummer 231447078. Laura Padberg is part of the Max Planck School of Photonics supported by BMBF, Max Planck Society, and Fraunhofer Society.

Data Availability Statement

The data that support the findings of this study are contained within the article or are available from the corresponding author upon reasonable request.

Conflicts of Interest

The authors declare no conflict of interest.

References

  1. Ouvrard, M.L. Recherches sur les phosphate double de titane, d’étain et de cuivre. Comptes Rendus 1890, 111, 177–179. [Google Scholar]
  2. Masse, R.; Grenier, J.C. Study of the monophosphates of type M1TiOpO4 where M1 = K, Rb and Tl. Bull. Soc. Fr. Minéral. Cristallogr. 1971, 94, 437. [Google Scholar]
  3. Gandhi, J.R.; Vijayalakshmi, B.; Rathnakumari, M.; Sureshkumar, P. Growth of Pure and Mo Doped Potassium Titanyl Phosphate (KTP) Crystals: Influence of KTP/Flux Ratios on the Growth Morphology. J. Miner. Mater. Charact. Eng. 2011, 10, 683–691. [Google Scholar]
  4. Bordui, P.F.; Jacco, J.C. Viscosity and density of solutions used in high-temperature solution growth of KTiOPO4 (KTP). J. Cryst. Growth 1987, 82, 351–355. [Google Scholar] [CrossRef]
  5. Morris, P.; Ferretti, A.; Bierlein, J.; Loiacono, G. Reduction of the ionic conductivity of flux grown KTiOPO4 crystals. J. Cryst. Growth 1991, 109, 361–366. [Google Scholar] [CrossRef]
  6. Kugel, V.; Roseman, G.; Angert, N.; Yaschin, E.; Roth, M. Domain inversion in KTiOPO4 crystal near the Curie point. J. Appl. Phys. 1994, 76, 4823–4826. [Google Scholar] [CrossRef]
  7. Roelofs, M.G. Identification of Ti3+ in potassium titanyl phosphate and its possible role in laser damage. J. Appl. Phys. 1989, 65, 4976–4982. [Google Scholar] [CrossRef]
  8. Mohamadou, B.; Kugel, G.E.; Brehat, F.; Wyncke, B.; Marnier, G.; Simon, P. High-temperature vibrational spectra, relaxation and ionic conductivity effects in KTiOPO4. J. Phys. Condens. Matter 1991, 3, 9489–9501. [Google Scholar] [CrossRef]
  9. Choi, B.; Kim, J.; Kim, J. Ionic conduction associated with polaronic hopping in KTiOPO4 single crystal. Solid State Commun. 1992, 84, 1077–1080. [Google Scholar] [CrossRef]
  10. Yashima, M.; Komatsu, T. Order-disorder and displacive components in the ferroelectric-paraelectric phase transition of potassium titanyl phosphate KTiOPO4. Chem. Commun. 2009, 9, 1070. [Google Scholar] [CrossRef]
  11. Eigner, C.; Padberg, L.; Santandrea, M.; Herrmann, H.; Brecht, B.; Silberhorn, C. Spatially single mode photon pair source at 800 nm in periodically poled Rubidium exchanged KTP waveguides. Opt. Express 2020, 28, 32925–32935. [Google Scholar] [CrossRef] [PubMed]
  12. Furusawa, S.; Hayasi, H.; Ishibashi, Y.; Miyamoto, A.; Sasaki, T. Ionic Conductivity of Quasi-One-Dimensional Superionic Conductor KTiOPO4(KTP) Single Crystal. J. Phys. Soc. Jpn. 1993, 62, 183–195. [Google Scholar] [CrossRef]
  13. Eigner, C.; Santandrea, M.; Padberg, L.; Volk, M.F.; Rüter, C.E.; Herrmann, H.; Kip, D.; Silberhorn, C. Periodically poled ridge waveguides in KTP for second harmonic generation in the UV regime. Opt. Express 2018, 26, 28827. [Google Scholar] [CrossRef] [PubMed]
  14. Canalias, C.; Hirohashi, J.; Pasiskevicius, V.; Laurell, F. Polarization-switching characteristics of flux-grown KTiOPO4 and RbTiOPO4 at room temperature. J. Appl. Phys. 2005, 97, 124105. [Google Scholar] [CrossRef]
  15. Rosenman, G.; Skliar, A.; Eger, D.; Oron, M.; Katz, M. Low temperature periodic electrical poling of flux-grown KTiOPO4 and isomorphic crystals. Appl. Phys. Lett. 1998, 73, 3650–3652. [Google Scholar] [CrossRef]
  16. Choi, B.C.; Moon, B.K.; Seo, H.J.; Park, J.H.; Kim, C.S. Impedance spectroscopy of KTiOPO4 single crystal in the temperature range −100 to 100 °C. Appl. Phys. A Mater. Sci. Process. 2004, 78, 745–748. [Google Scholar] [CrossRef]
  17. Jiang, Q.; Womersley, M.N.; Thomas, P.A.; Rourke, J.P.; Hutton, K.B.; Ward, R.C.C. Ferroelectric, conductive, and dielectric properties of KTiOPO4 at low temperature. Phys. Rev. B 2002, 66, 094102. [Google Scholar] [CrossRef]
  18. Moorthy, S.G.; Kumar, F.J.; Kannan, C.V.; Subramanian, C.; Ramasamy, P. Conductivity and dielectric studies on flux grown KTiOPO4 single crystals. Ferroelectrics 1999, 230, 175–180. [Google Scholar] [CrossRef]
  19. Theerthan, R.A.; Menaert, B.; Boulanger, B.; Maglione, M. Linking ionic conductivity and piezoelectric resonance in KTiOPO4. Phys. Rev. B 2012, 85, 024103. [Google Scholar] [CrossRef]
  20. Sorokin, N.I.; Shaldin, Y.V. Ionic Conductivity of KTiOPO4 Single Crystals Grown by Flux Crystallization under Different Conditions. Crystallogr. Rep. 2018, 63, 780–783. [Google Scholar] [CrossRef]
  21. Bierlein, J.D.; Arweiler, C.B. Electro-optic and dielectric properties of KTiOPO4. Appl. Phys. Lett. 1986, 49, 917–919. [Google Scholar] [CrossRef]
  22. Guan, Q.; Wang, J.; Cui, W.; Wei, J.; Liu, Y.; Yin, X. DC Conductivity of Potassium Titanyl Phosphate Crystal along ITS Z-AXIS. MRS Proc. 1998, 527, 519–523. [Google Scholar] [CrossRef]
  23. Zhang, Q.; Feng, G.; Han, J.; Li, B.; Zhu, Q.; Xie, X. High repetition rate laser pulse induced damage in KTP crystal: Gray-tracking and catastrophic damage. Opt. Int. J. Light Electron Opt. 2011, 122, 1313–1318. [Google Scholar] [CrossRef]
  24. Maslov, V.A.; Mikhailov, V.A.; Shaunin, O.P.; Shcherbakov, I.A. Nonlinear absorption in KTP crystals. Quantum Electron. 1997, 27, 356–359. [Google Scholar] [CrossRef]
  25. Loiacono, G.M.; Loiacono, D.N.; McGee, T.; Babb, M. Laser damage formation in KTiOPO4 and KTiOAsO4 crystals: Grey tracks. J. Appl. Phys. 1992, 72, 2705–2712. [Google Scholar] [CrossRef]
  26. Scripsick, M.P.; Edwards, G.J.; Halliburton, L.E.; Belt, R.F.; Loiacono, G.M. Effect of crystal growth on Ti3+ centers in KTiOPO4. J. Appl. Phys. 1994, 76, 773–776. [Google Scholar] [CrossRef]
  27. Bocchini, A.; Neufeld, S.; Gerstmann, U.; Schmidt, W.G. Oxygen and potassium vacancies in KTP calculated from first principles. J. Phys. Condens. Matter 2019, 31, 385401. [Google Scholar] [CrossRef]
  28. Bocchini, A.; Eigner, C.; Silberhorn, C.; Schmidt, W.G.; Gerstmann, U. Understanding gray track formation in KTP: Ti3+ centers studied from first principles. Phys. Rev. Mater. 2020, 4, 124402. [Google Scholar] [CrossRef]
  29. Bocchini, A.; Gerstmann, U.; Schmidt, W.G. Oxygen vacancies in KTiOPO4: Optical absorption from hybrid DFT. Phys. Rev. 2022, 105, 205118. [Google Scholar] [CrossRef]
  30. Terashima, K.; Takena, M.; Kawachi, M. Transparency Improvement of Potassium Titanyl Phosphate (KTP) Crystals by Annealing under Oxygen Atmosphere. Jpn. J. Appl. Phys. 1991, 30, 497–499. [Google Scholar] [CrossRef]
  31. Fedotov, S.S.; Samarin, A.S.; Nikitina, V.A.; Aksyonov, D.A.; Sokolov, S.A.; Zhugayevych, A.; Stevenson, K.J.; Khasanova, N.R.; Abakumov, A.M.; Antipov, E.V. Reversible facile Rb+ and K+ ions de/insertion in a KTiOPO4-type RbVPO4F cathode material. J. Mater. Chem. A 2018, 6, 14420–14430. [Google Scholar] [CrossRef]
  32. Huang, J.; Cai, X.; Yin, H.; Li, Y.; Lin, W.; Huang, S.; Zhang, Y. A New Candidate in Polyanionic Compounds for a Potassium-Ion Battery Cathode: KTiOPO4. J. Phys. Chem. Lett. 2021, 12, 2721–2726. [Google Scholar] [CrossRef] [PubMed]
  33. Huang, J.; Cai, X.; Li, Y.; Fang, Z.; Li, Y.; Lin, W.; Huang, S.; Zhang, Y. DFT investigations of KTiOPO4Mx (M = K, Na, and Li) anodes for alkali-ion battery. J. Chem. Phys. 2022, 156, 204702. [Google Scholar] [CrossRef] [PubMed]
Figure 1. Measured ionic conductivities for KTA, KTP, and RKTP.
Crystals 12 01359 g001
Figure 2. Comparison of ionic conductivities in different KTP wafers for as-grown, annealed and K-treated wafer.
Crystals 12 01359 g002
Figure 3. Microscope images of gray-tracked KTP samples for different annealing steps. The sample is shown in the white dashed box. We illuminated the sample with a green light source from the back side of the sample. In (a), we show the gray-tracked sample before annealing, in (b) the annealed sample after 80 h at 200 °C and in (c) the sample, annealed for 12 h at 300 °C.
Crystals 12 01359 g003
Figure 4. Comparison of the optical transmission of an as-grown sample (red line), gray-tracked sample (dark blue line), for 120 h at 200 °C annealed sample (orange line) and for 12 h at 300 °C annealed sample (green line).
Crystals 12 01359 g004
Figure 5. Comparison of the ionic conductivity between (a) gray-tracked and (b) annealed samples.
Crystals 12 01359 g005
Publisher’s Note: MDPI stays neutral with regard to jurisdictional claims in published maps and institutional affiliations.