
Origin of Blue-Water Jadeite Jades from Myanmar and Guatemala: Differentiation by Non-Destructive Spectroscopic Techniques

School of Gemmology, China University of Geosciences (Beijing), Beijing 100083, China
*
Author to whom correspondence should be addressed.
Crystals 2022, 12(10), 1448; https://doi.org/10.3390/cryst12101448
Submission received: 21 September 2022
/
Revised: 9 October 2022
/
Accepted: 11 October 2022
/
Published: 13 October 2022
Abstract
:Identifying the origin of jadeite jades has become increasingly important from both mineral resource and metamorphic geology perspectives. In this study, we differentiate Myanmar gem-quality blue-water jadeite jades from their Guatemala counterparts via integrating various non-destructive spectrographic techniques, including X-ray fluorescence (XRF), Ultraviolet-Visible spectroscopy (UV-Vis), Fourier transform infrared spectroscopy (FTIR), and Raman spectroscopy. Our results show that the Myanmar blue-water jadeite jades are structurally homogenous with very few impurities, while their Guatemala counterparts commonly have a yellowish margin with scattered white albite and disseminated greenish inclusions of omphacite and (minor) aegirine-augite. Geochemically, the UV absorption spectral data indicate that the Guatemala samples have higher total Fe and Fe2+ contents, but lower Fe3+ content than the Myanmar samples. The Guatemala samples also have higher omphacite content (lower molar Na/(Na+Ca) ratio, as reflected by the lower IR absorption peak wavenumber) and higher heterogeneity (as reflected by the ~680 cm−1 Raman peak shift difference) than that from Myanmar. Major differences are also discovered in the blue series (Myanmar: 0–0.7 cm−1; Guatemala: 1.7–3.2 cm−1) and blue-green series (Myanmar: 6.9 cm−1; Guatemala 13.7 cm−1) of the Raman peak shift difference, which altogether can provide a novel, nondestructive method for distinguishing blue-water jadeite jades from different origins.
1. Introduction
Jadeite jades or jadeitites are one of the most precious jades. Jadeite jades consist predominantly of jadeite or other sodic (-calcic) clinopyroxenes (e.g., omphacite and kosmochlor), together with minor amphibole, albite, and chromite, which is collectively called feicui in Chinese [1,2]. Jadeite jades vary greatly in transparency, homogeneity, and color, giving these jadeite jades different names, such as the imperial green, glassy, and blue-water [2,3]. Myanmar hosts the world’s main jadeite jade resource, while Guatemala has become the second most important jade source since 2010 [4,5]. In the past (decades ago), about 95% of the commercial-grade jadeite jades on the Chinese gemstone market were from Myanmar, yet in recent years the share of Guatemala jadeite jade has gained considerably due to: (1) the gradual depletion of Myanmar’s jadeite jade resource, and (2) the high-quality of some Guatemala jadeite jades, as manifested by their excellent transparency and color, notably the blue-water jadeite jades. Distinguishing the Myanmar and Guatemala jadeite jades has thus become an issue, both from an economic geological and geoscientific perspectives (e.g., to understand and contrast the jade-forming metamorphic processes in Myanmar and Guatemala).
The jadeite jade origin issue is hard to tackle because those from Guatemala and Myanmar are generally similar in appearance (with naked eye or hand-lens), and distinguishing them visually is unreliable. Distinguishing the origin has economic significance also because Guatemala jadeite jades were occasionally sold feignedly as Myanmar’s. Besides, jewelry testing institutes across the world are better in identifying the variety of jadeite jades and whether post-treatment had occurred, than in distinguishing the origin. Although previous works were done on the Myanmar/Guatemala jadeite jades to reveal their mineral composition and internal structure [2,6,7,8,9], the jade-forming age and metamorphic pressure-temperature (P-T) conditions [10,11,12,13], and the jade-forming (subduction-related) fluid evolution and ore-forming material source [14,15,16,17,18,19,20,21,22,23], only a handful of studies were dedicated to the origin, especially for the high-quality Guatemalan jadeite jade.
In this study, we examined the high-quality blue-water jadeite jades from Guatemala and Myanmar using gemological microscopy and non-destructive spectroscopic techniques, such as X-ray fluorescence (XRF), ultraviolet-visible diffuse reflectance spectroscopy (UV-Vis DRS), and diffuse reflectance infrared Fourier transform spectroscopy (DRIFTS), in order to identify any mineralogical and geochemical differences in samples from the two regions.
2. Materials and Methods
2.1. Materials
Blue-water jadeite jades are commonly described via integrating jade color and transparency, and are featured by their uniform, light blue to bluish-green lake water-like appearance. Common colors include blue, bluish-green, and grayish blue. Blue-water jadeite jades have high transparency, with most of them having icy (minor glassy) transparency.
Hues of blue-water jadeite jades can be divided into the blue and blue-green series. Both series were investigated here, and our samples were selected according to the conventional blue-water jadeite jade classification criteria. A total of 30 blue-water jadeite jade samples from Myanmar (bought in Mandalay, Myanmar) and Guatemala (collected from jadeite jade mines in Guatemala) were analyzed, among which 12 representative samples were selected on the whole color spectrum from light blue to blue and blue-green. The samples were finely polished for spectroscopic measurement. Blue series samples include G-1 to G-5 (from Guatemala) and M-1 to M-5 (from Myanmar), whilst samples M-6 (from Myanmar) and G-6 (from Guatemala) are largely blue-green series (rare bright green or white spots were avoided during the analysis) (Figure 1).
2.2. Methods
Analyses of gemological microscopy, X-ray fluorescence (XRF) spectroscopy (Shimadzu EDX7000), Ultraviolet-Visible spectroscopy (UV-Vis) (GEM-3000 jewelry detector, Biaoqi, Guangzhou, China), Fourier transform infrared spectroscopy (FTIR) (TENSOR 27 FTIR equipped with reflectance module, Bruker, German), and Raman spectroscopy (Horiba HR Evolution confocal laser Raman spectrometer) were performed at the laboratory of School of Gemology, China University of Geosciences (Beijing). The refractive index of the samples was determined with the distant vision technique on a refractometer, and the specific gravity of the samples was measured hydrostatically. Each sample was measured three times and the mean values of these parameters were reported. The sample internal structural features were observed under the gemological microscope.
XRF analysis was performed under vacuum conditions, operating at 50 kV and 240 µA (Al–U), 15 kV and 1000 µA (Na–Sc) (analysis spot diameter: ~3 mm). The data were processed with the PCEDX Navi analyzer software.
In situ reflection method was used for both UV-Vis and FTIR analyses. Finely polished samples are suitable for reflection spectroscopy, where a spectrum within a few millimeters (depending on the beam diameter or sample cap aperture) of the analyzed area can be obtained [24,25].
UV-Vis DRS analysis here was equipped with an integrating sphere, and all the reflected radiation emitted by the sample can be diffused and analyzed efficiently by the inner walls of the sphere (Figure 2). Barite (BaSO4, standard white board) (Figure 2a) was first measured, followed by the relative reflectance of the samples (Figure 2b). The beam diameter is ~8 mm. The spectra recorded are in the 220–1000 nm detection range, with 0.5 nm interval and 220 s integration time.
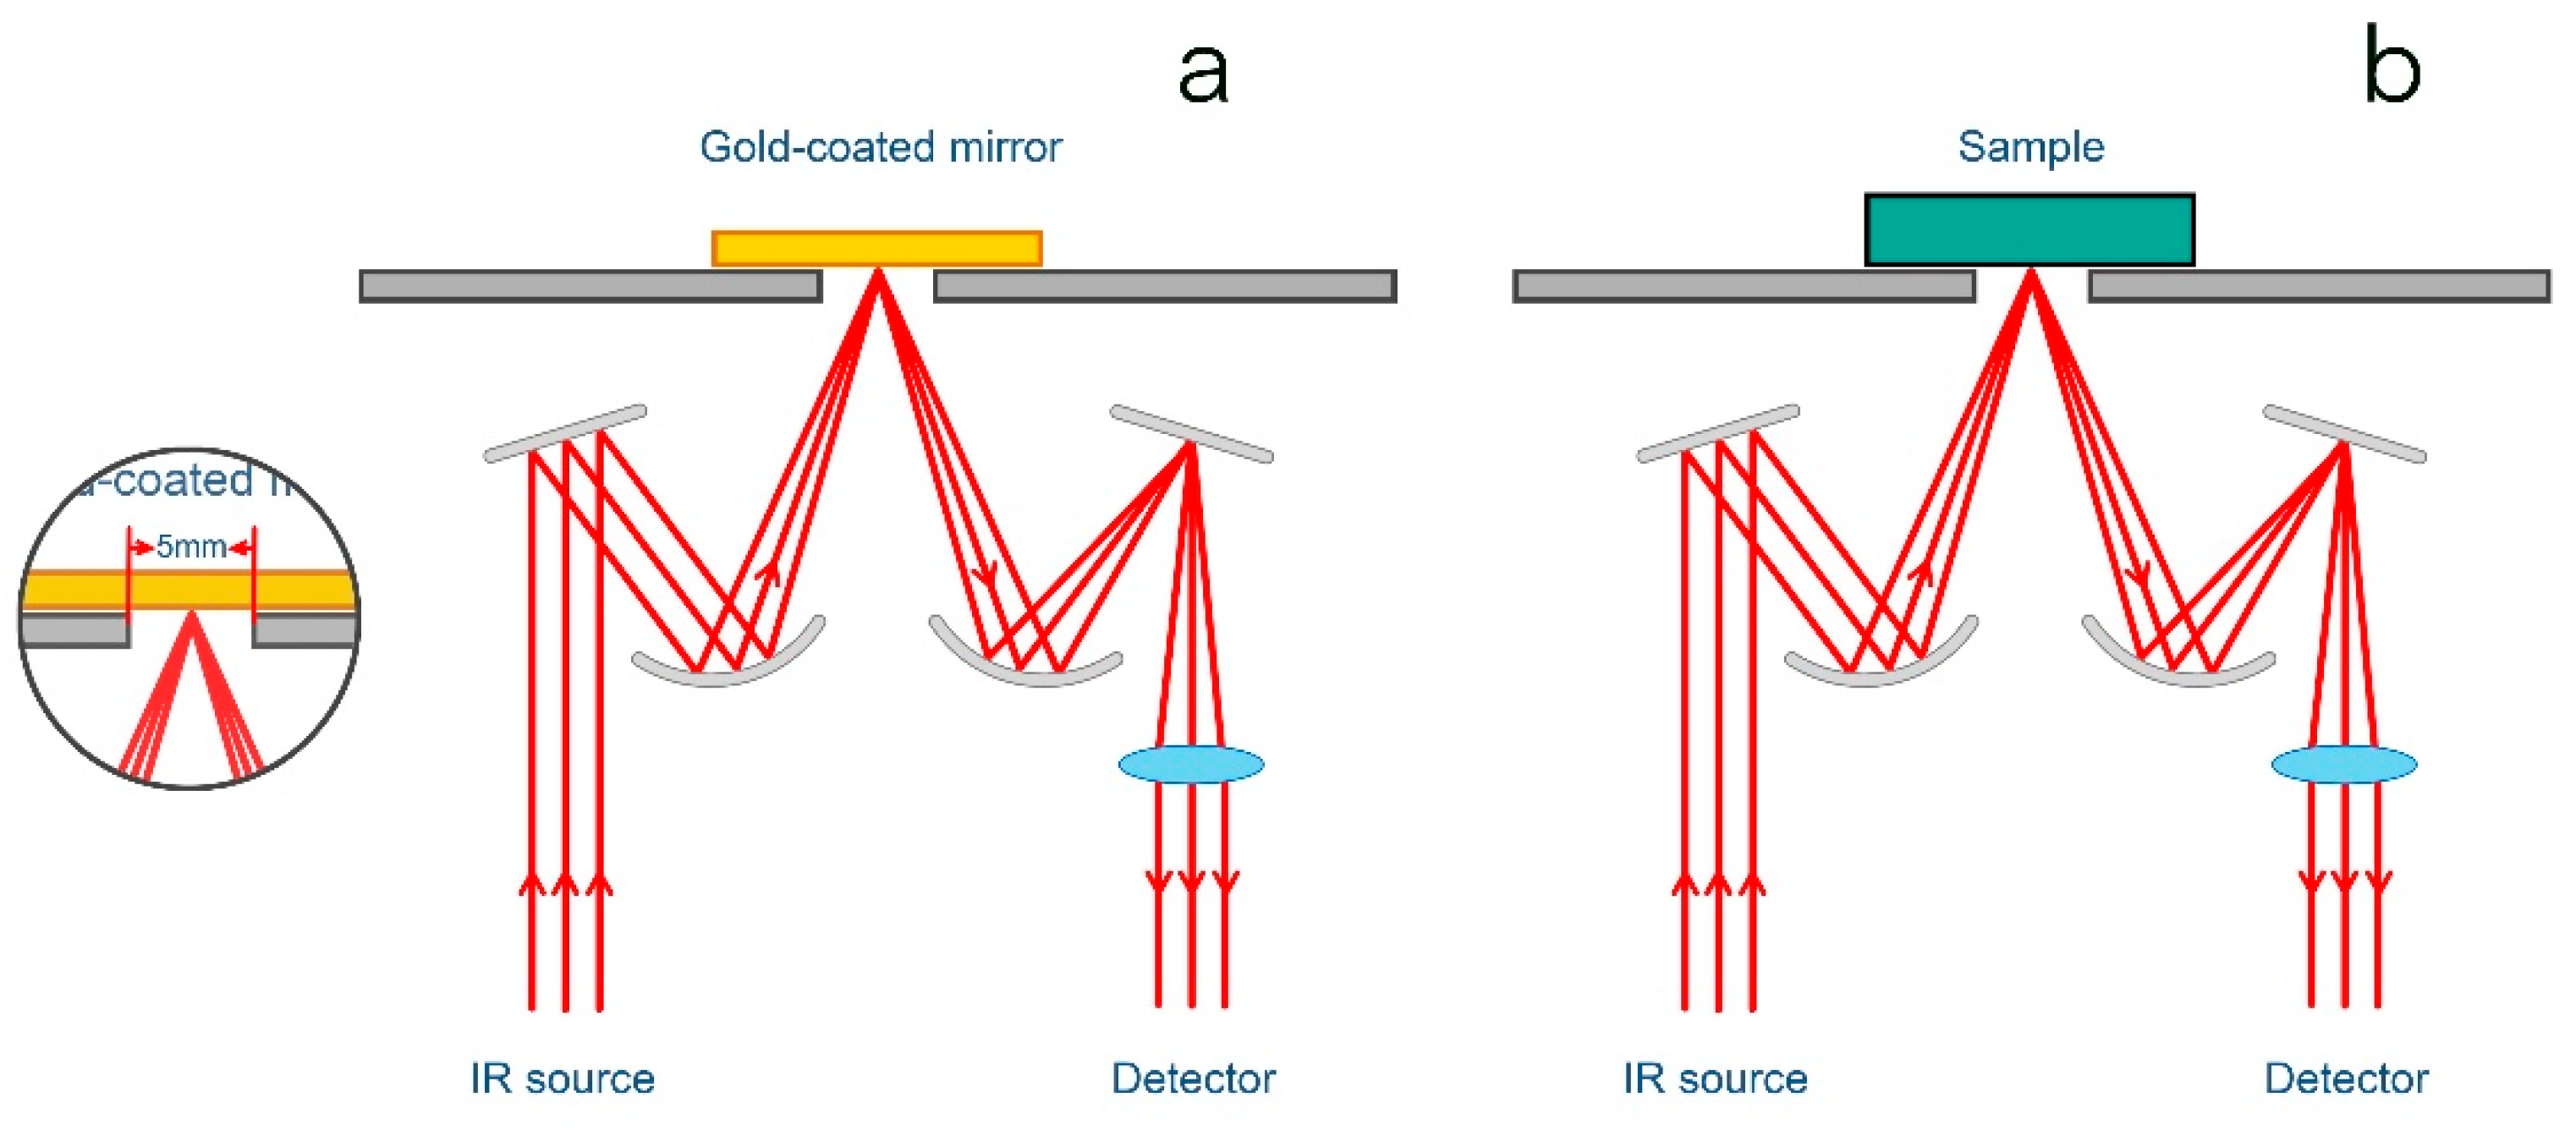
FTIR was performed with the reflection mode. The infrared beam illuminates the sample on the bench, and the detector collects the scattered light to obtain spectra (Figure 3). Background spectra were recorded with a gold-coated mirror with a 5 mm sample cap aperture (Figure 3a), and sample spectra were recorded with the same sample cap (Figure 3b). Both background and sample spectra were obtained in the reflectance mode by 32 scans, with 4 cm−1 resolution over the 400–2000 cm−1 range.
The Raman spectrometric analysis (laser beam diameter: ~2 µm) was performed using a 532 nm laser source, 100 μm slit width, 600 gr/mm grating, 4 s scanning time, integration number = 3, and a collection range of 100–1500 cm−1.
3. Results and Discussions
3.1. Sample Appearance and Gemological Characterization
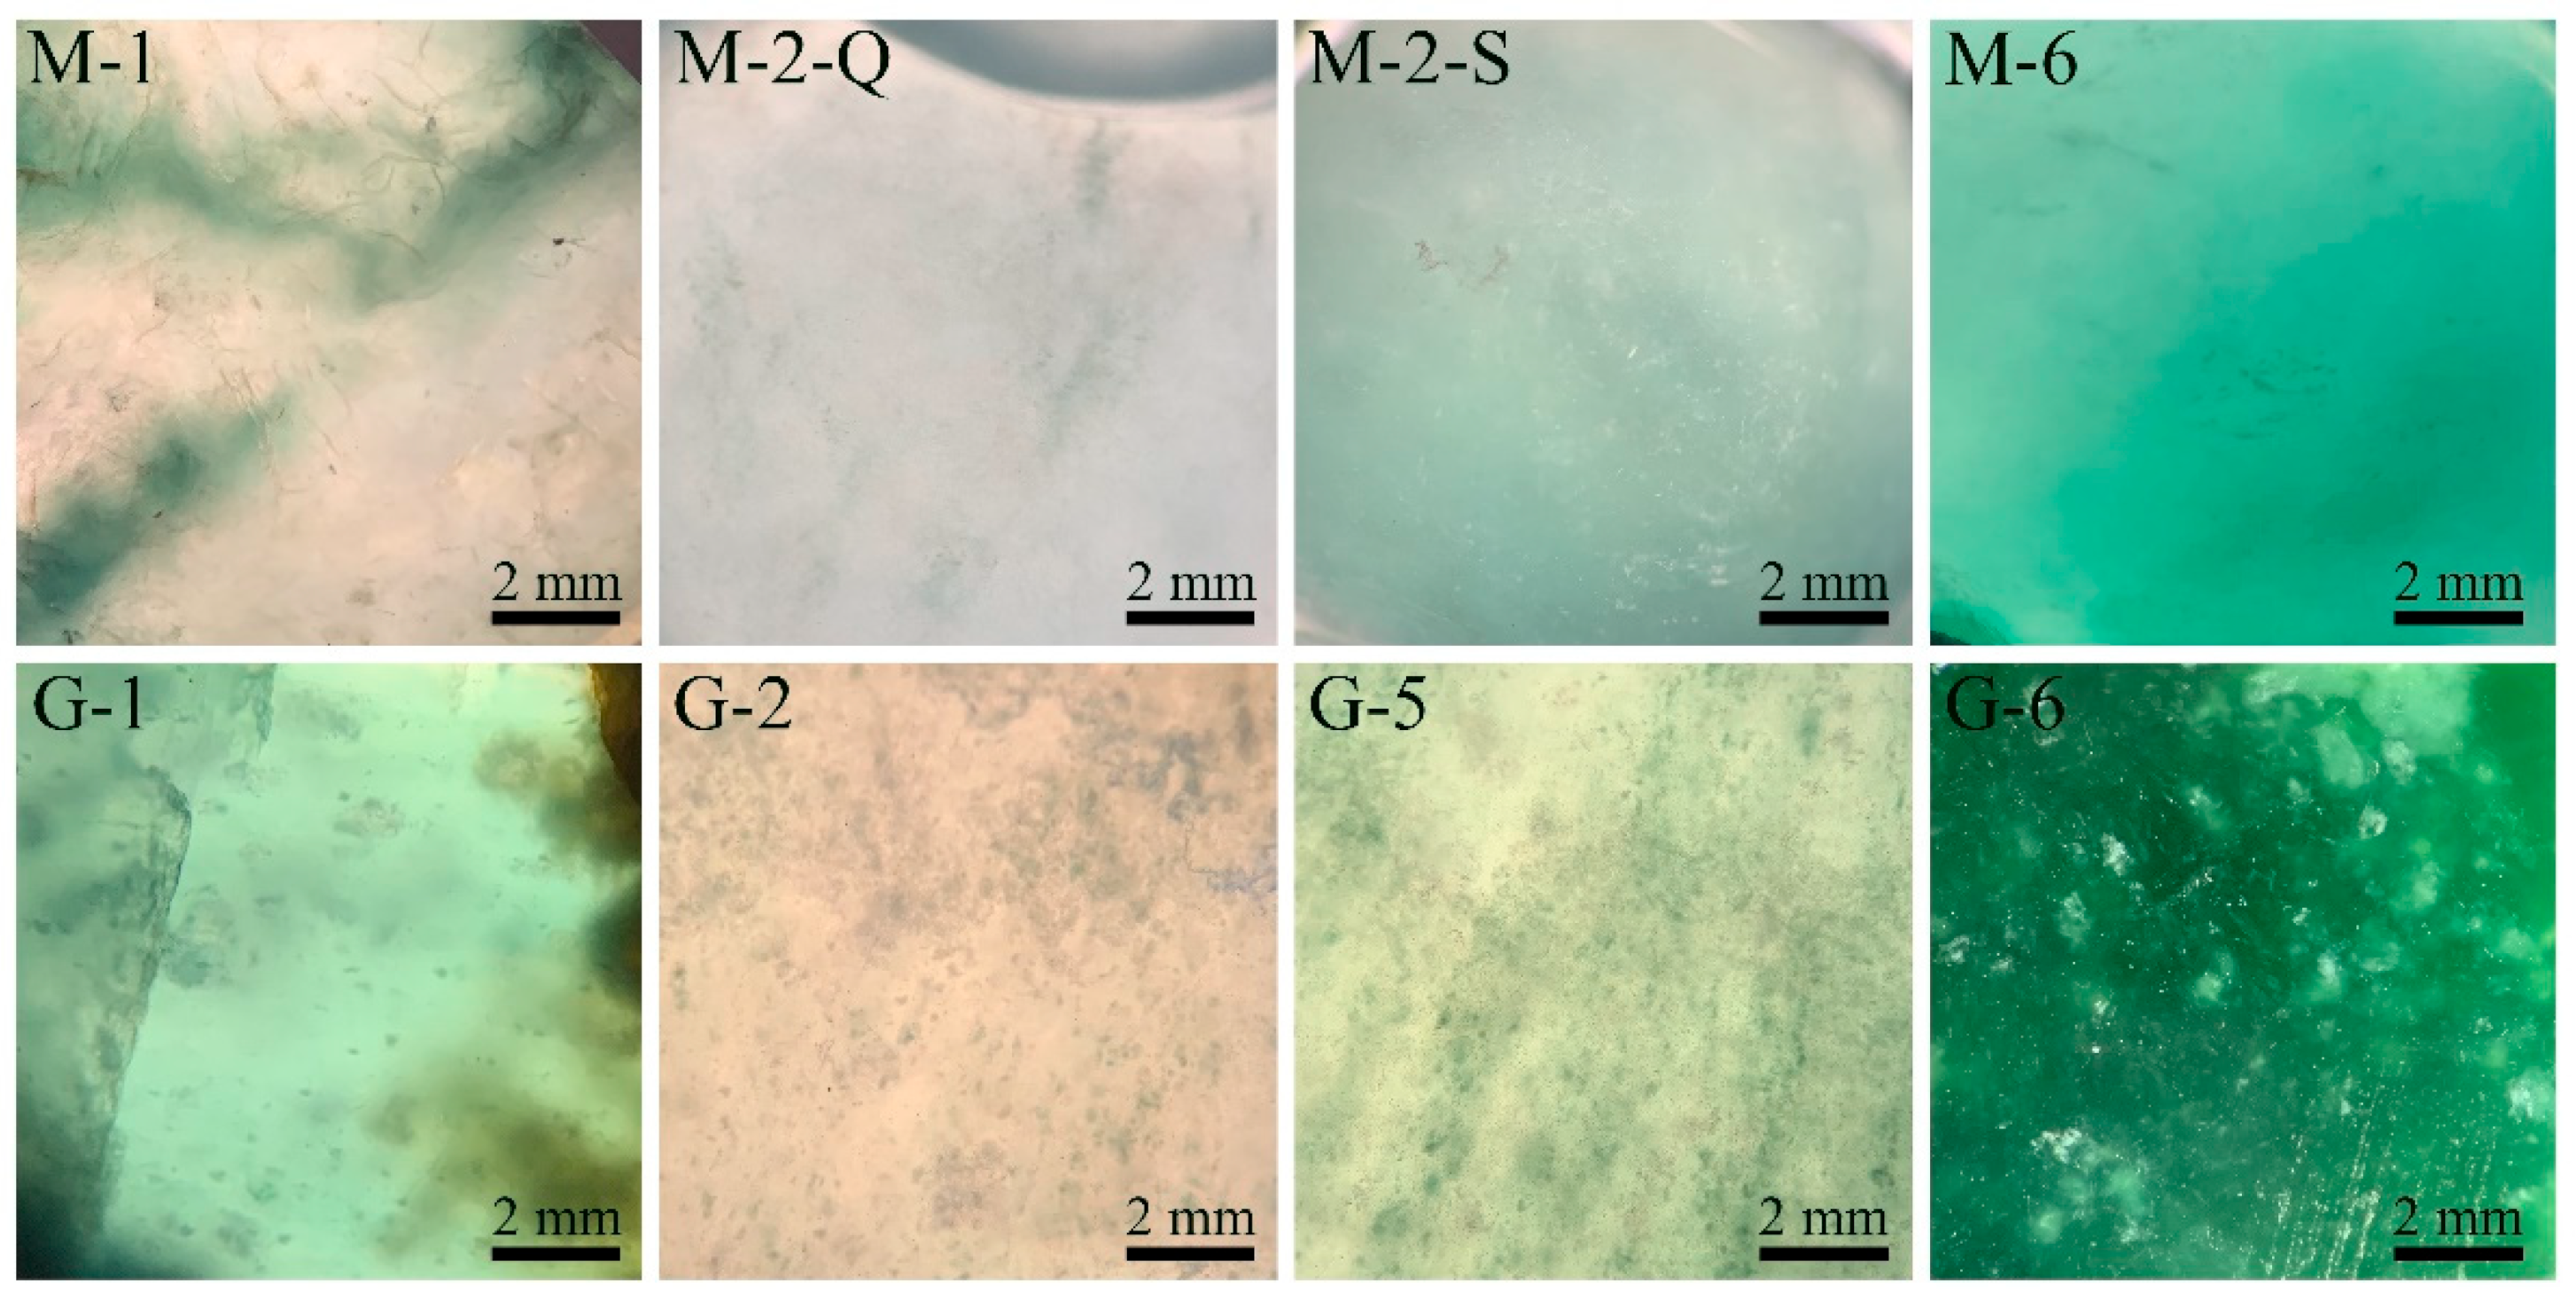
All jadeite jade samples have some similarities in appearance (blue to blue-green, vitreous luster and translucent). The color, structure, and inclusions of each sample are described in Table 1 and illustrated in Figure 4.
The results indicate that the Guatemala samples commonly have yellow jade margin and white minerals disseminations [26], which is rare in the Myanmar jadeite jades. Moreover, the Guatemala samples have green mineral disseminations [27], which are absent in the Myanmar jadeite jades. It is noteworthy that some white and light green jadeite jades from Myanmar have granular white inclusions scattered in a cotton-/snow-flake-like pattern [28]. These inclusions are mostly similar in size and shape, and with a smooth grain margin [28]. In contrast, white inclusions in the Guatemalan samples have varying sizes and irregular grain margin.
The refractive index (RI) of the Guatemala blue-green sample G-6 is 1.67, while the other Guatemala samples and all Myanmar samples have the same refractive index (1.66). The results indicate no major difference in refractive index between the Guatemala and Myanmar samples. Specific gravity of the Guatemala samples (3.24–3.31) is lower than that of the Myanmar samples (3.33–3.34), which can be attributed to the existence of more fissures, white mineral inclusions, and the more-porous yellow jade margin in the Guatemalan samples.
3.2. XRF Spectrum
The Guatemalan samples have higher Ca, Mg, and total Fe (TFeO) contents than the Myanmar samples, i.e., TFeO (Guatemala: 1.95–2.47 wt.% (avg. 2.22 wt.%); Myanmar: 0.79–2.09 wt.% (avg. 1.31 wt.%)). The blue-series samples have lower Cr content (0.01–0.03 wt.%) than the blue-green-series samples (0.09 wt.% (from Myanmar) and 0.10 wt.% (from Guatemala); Table 2).
Blue-water jadeite jades are predominantly composed of jadeite (mineral) with minor omphacite [26,27,29]. Jadeite (NaAlSi2O6), a hard and dense monoclinic metamorphic pyroxene, is formed under high-pressure and low-temperature conditions (5–11 kbar, 150–400 °C) [15]. Omphacite [(Ca,Na) (Mg,Fe2+,Al)Si2O6] is composed of a solid solution of jadeite (Jd: NaAlSi2O6) and diopside (Di: CaMgSi2O6), with subordinate hedenbergite (Hd: CaFe2+Si2O6) and aegirine (Ac: NaFe3+Si2O6) [8,30,31,32].
The omphacite content in jadeite jades rises with increasing Ca-Mg-Fe contents. The Guatemalan jadeite jades contain about 10%–12% diopside, significantly higher than that in the Myanmar jadeite jades (1.5%) [33]. Viggiano et al. (2016) found that CaFe2+ substitutes for NaAl in both light green and dark green jadeites from Guatemala [34]. Ouyang et al. (2017) suggested that the Guatemala jadeite jades have higher TFeO content than those from Myanmar [35]. Xing et al. (2021) compared the electron probe microanalysis (EPMA) composition data of jadeite jades from Guatemala and Myanmar, and found that the former has higher omphacite TFeO content [26]. Combined with our findings, we concluded that the higher TFeO content of the Guatemalan blue-water jadeite jade is likely attributed to its higher omphacite content.
3.3. UV-Vis Results
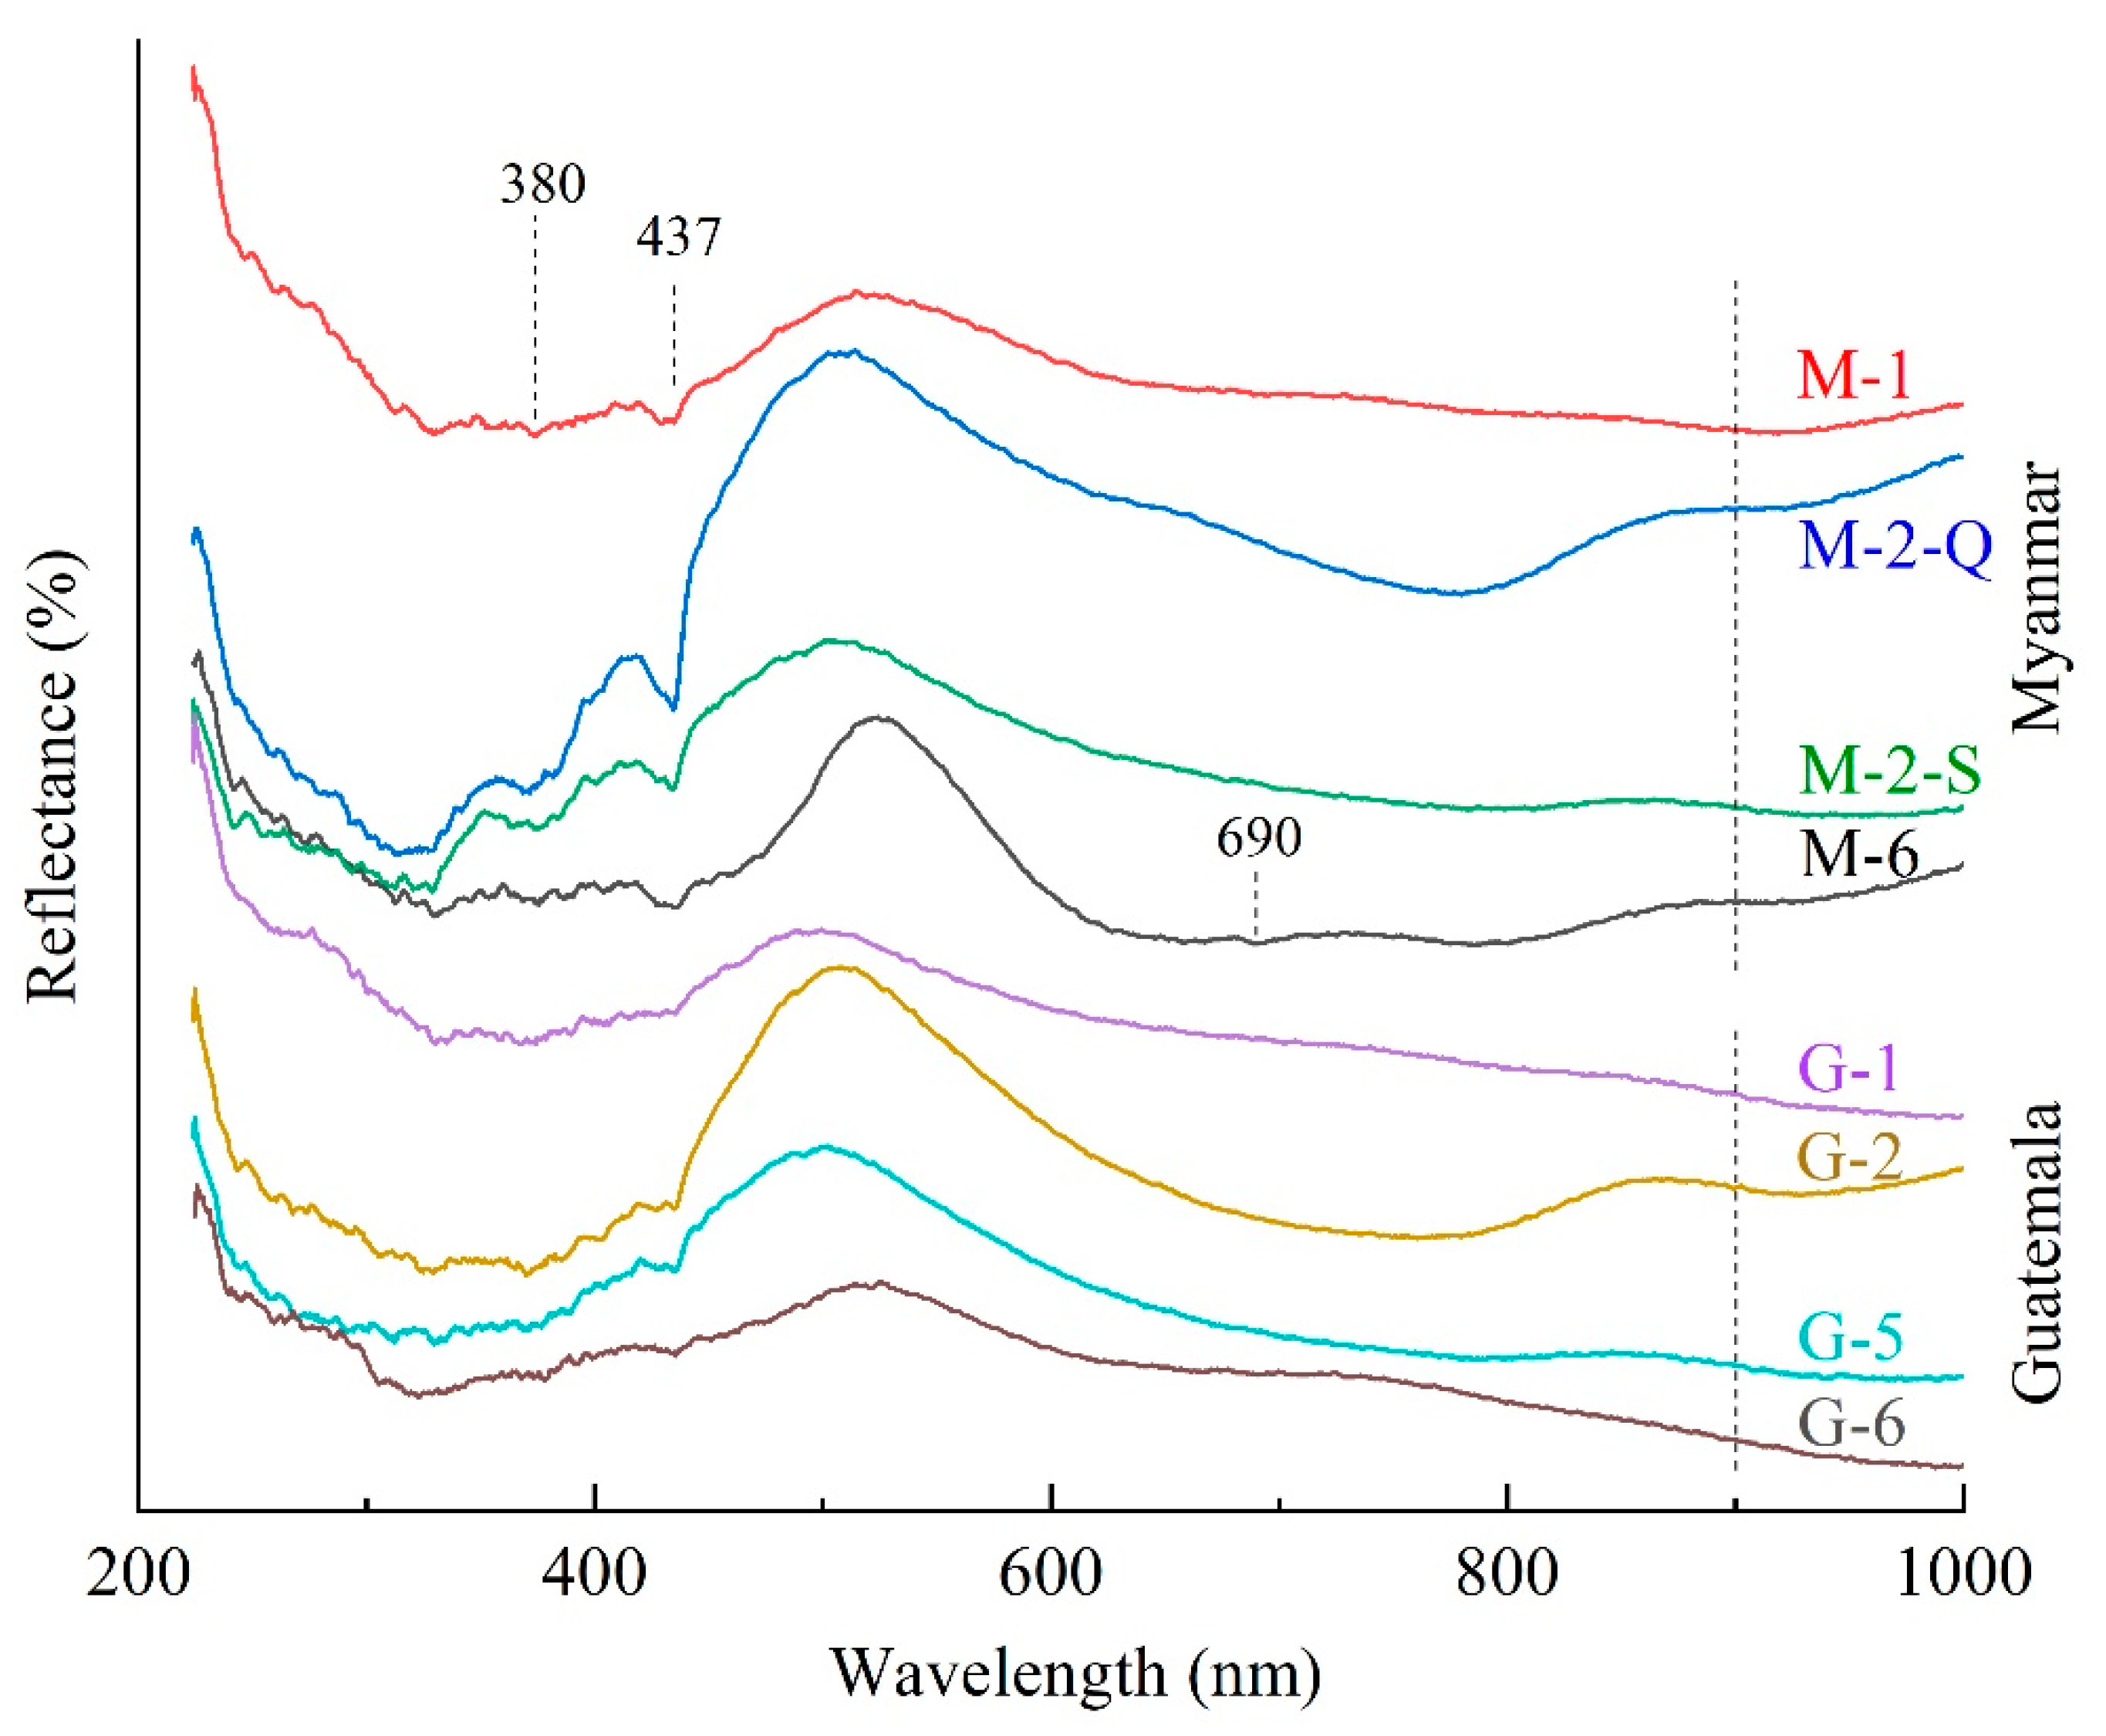
The results show that all the blue-water jadeite jade (both blue and blue-green series) samples have a strong absorption peak at 437 nm, and a weak absorption peak at 380 nm (Figure 5), with their intensity being positively correlated with each other. Furthermore, both the 437 nm and 380 nm absorption peaks are more distinct in the Myanmar samples (than in the Guatemala samples). The absorption spectra of the Guatemalan samples are more intense above 900 nm than those of the Myanmar samples (Figure 5), with the spectra showing a significant dip at 900–1000 nm due to absorption (esp. G-1, G-5, G-6). The light blue sample G-2 (Guatemalan) does not show such a major dip in the >900 nm absorption spectra, but the stronger absorption above 900 nm (cf. light blue Myanmar sample M-2-Q) is still present.
In jadeite, iron commonly replaces Al3+ with Fe3 (Fe2+only minor in jadeite), and the absorption peaks at 437 and 380 nm can be attributed to the d–d electronic transition of Fe3+ in the octahedral field [36,37,38,39]. Intensity of the 437 nm absorption peak indicates the amount of Fe3+ in the jadeite jade [36,37,38,39]. In contrast, iron usually exists as Fe2+ in omphacite due to charge-balanced coupled substitution [40]. Harlow et al. (2011) showed that all the Guatemalan blue to bluish-green, light green, pale green, and bluish-gray jadeite jades contain jadeite and minor omphacite [8]. Lin et al. (2020) found that dark/mottled green pyroxenic jadeites from Guatemala are composed of jadeite and omphacite, and µ-XRF elemental maps of the omphacite show elevated Ca-Mg-Fe contents [41]. Although the Fe content in omphacite is higher than that of jadeite, the 437 nm absorption peak is weak and barely visible [39]. Clinopyroxenes have 900–1000 nm absorption bands, which are assigned to Fe2+ [30,37,38,39]. The XRF analysis shows that the Myanmar samples have lower TFeO content (0.79%–2.09 wt.%) than the Guatemala samples (1.95%–2.47 wt.%). However, the UV-Vis absorption spectra show that the absorption of Fe3+ in the Myanmar samples is stronger than that of the Guatemalan samples. The >900 nm absorption (attributed to Fe2+) is more intense in the Guatemalan samples (than the Myanmar samples). Thus, the Myanmar samples have higher Fe3+ but lower Fe2+ contents than the Guatemalan samples. It can be inferred that the Myanmar samples have higher jadeite (iron occurs as Fe3+) but lower omphacite (iron occurs as Fe2+) contents than the Guatemala samples.
For the blue-green series, the Myanmar sample M-6 and the Guatemalan sample G-6 have some different features in the visible red region, in addition to those in the 380 nm and 437 nm absorption peaks above-mentioned. Sample M-6 has a clear absorption broadband in the visible red region, including a weak peak at 660 nm and a stronger one at 690 nm. These absorption peaks are typically from Cr3+ in octahedral coordination [37,42,43]. Sample G-6 has a wide range of weak absorption in the red zone (600–1000 nm), but no major spectral peaks. Although both samples have a similar appearance (blue-green with a distinct green hue) and contain similar Cr content (XRF data), the Myanmar samples (but not the Guatemalan samples) have distinct Cr3+ absorption spectrum.
3.4. IR Spectroscopy
The 400 to 1300 cm−1 IR spectral range is diagnostic of the mineral components. Midinfrared diffuse reflectance spectroscopy is used to study the main chemical composition of the sample (analysis spot diameter: ~5 mm). The most intense bands lie in the 900–1200 cm−1 region, which are attributed to the characteristic Si-O stretching modes of the [SiO4] crystal tetrahedron [34,39,44,45]. The vibrational absorption peaks appear mainly at 1163–1167 cm−1, 1074–1084 cm−1 (strongest), and 958–964 cm−1. The sharp 651–667 cm−1 peaks are assigned to the non-bridging O-Si-O bending vibration and the Al-O-bond stretching vibration, whilst the other 852–891 cm−1 peaks are assigned to the Si-O non-bridging stretching mode [34,39,44,45]. Meanwhile, the bands between 300 and 600 cm−1 regions are due to the Si-O-Si and Si-O-Al bending vibration link [34,39,44,45]. IR absorption spectra of the studied samples are summarized in Table 3.
The IR reflection spectra of jadeite are characterized by typical bands at 1165, 1083, and 954 cm−1 [45,46,47,48]. The omphacite FTIR spectra can be identified by the strong modes at 964 cm−1 and 1064 cm−1, and by the Si-O stretching [45,46,47,48]. Figure 6 shows that all the detected bands are consistent with the vibrations of the jadeite (NaAlSi2O6) functional groups (both in position and intensity) [45,46,47,48], although some differences are present among the spectra.
For the jadeite jade samples of the same color series, the absorption peak positions are slightly different, and the absorption bands in each sample are displaced to various degrees. Compared to the Guatemalan samples, most of the IR absorption peaks of the Myanmar samples are shifted to higher wavenumbers (1 to 11 cm−1). The FeO, CaO, and MgO contents of the Guatemala samples are obviously higher than those of the Myanmar samples, whereas their Na2O and Al2O3 contents are slightly lower [8,33,35,49]. The substitution of Na+ by Ca2+ at the clinopyroxene M2 position and the substitution of Al3+ by Mg2+, Fe2+, and Fe3+ at the M1 position (Na/(Na+Ca) molar ratio decreases) shift the wavenumbers lower (with decreasing Jd content in diopside (CaMgSi2O6)-jadeite (NaAlSi2O6)) [34,44,46]. The Na/(Na+Ca) molar ratio of the Myanmar samples is higher than that of the Guatemala samples, thus its IR absorption peak shifts to higher wavenumber [8,26,33,35,49]. Absorption peaks of the Myanmar samples are more distinct than those of the Guatemalan samples, especially those with higher wavenumbers (e.g., 1074–1084 cm−1, 958–964 cm−1, and 852–891 cm−1). This lack of sharp features in the Guatemalan samples is likely due to the lower crystallinity of omphacite (P2/n symmetry) relative to jadeite (C2/c) [40,44].
This shift is distinct in the wavenumber region (at the absorption peaks of 1084 cm−1, 588 cm−1, 530 cm−1, 474 cm−1, and 434 cm−1), especially at the 1084 cm−1, 474 cm−1, and 434 cm−1 peaks. For the blue-series samples, the peak positions are 1082–1084 cm−1, 473–474 cm−1, and 433–434 cm−1 for the Myanmar samples, and 1078–1080 cm−1, 467–469 cm−1, and 428–430 cm−1 for the Guatemala samples. In view of these absorption peak differences, the three most variable spectral peaks of the blue-series samples (Figure 7) show that the absorption peaks of the Myanmar and Guatemala samples are located in different regions. This implies that the absorption peak shift can be used to identify the origin of blue-water jadeite jades.
Compared to the blue series jadeite jades, the blue-green series jadeite jades have higher omphacite and iron contents, but lower Na+/(Na++Ca2+) molar ratio (Table 2) and IR absorption peak position wavenumber [8,34,44,46]. For the Myanmar blue-green sample M-6, the peak positions have shifted from 667 to 659 cm−1, from 588 to 576 cm−1, from 530 to 526 cm−1, from 474 to 466 cm−1, and from 434 to 432 cm−1 (Figure 8). For the Guatemala blue-green jade sample G-6, the corresponding peak positions are at 651 cm−1, 571 cm−1, 524 cm−1, 455 cm−1, and 426 cm−1. We conclude that the IR absorption peak positions of the Myanmar blue-green-series samples shift to a higher wavenumber than those of their Guatemala counterparts.
3.5. Raman Spectral Results
Raman spectroscopy can identify the different mineral phases of jadeite jades, and can show the compositional heterogeneity of solid solutions [50].
Jadeite, omphacite, and diopside belong to the clinopyroxene complete isomorphic series. All clinopyroxenes have intense Raman modes, corresponding to metal–oxygen translation (M-O, <500 cm−1), O-Si-O bending (500–600 cm−1), Si-O bridging stretching (Si-Obr, 650–760 cm−1), and Si-O non-bridging stretching (Si-Onbr, >800 cm−1) [45,51,52]. Jadeite shows prominent Raman peaks at ~204, 255, 310, 328, 375, 433, 524, 575, 700, 779, 987, and 1039 cm−1, whereas omphacite has distinct features at 335, 374, 409, 554, 678, 905, and 1015 cm−1 [50]. For clinopyroxenes of different compositions, the peak position at 670–700 cm−1 of Si-Obr bridging stretching vibrations is linearly related to multi-valent isomorphism of Na+Al3+-Ca2+Mg2+, and there are only slight changes in the different crystal orientations [51,53]. The most prominent are the positive Na2O vs. Al2O3 and the negative CaO vs. MgO correlations [40,51,52]. Due to elemental substitutions and the corresponding structural changes, there are major Raman spectral differences in the jadeite and omphacite, especially at the ~680 cm−1 peak position [34,39,50]. The peak position of Si-Obr bridging stretching of omphacite (at 680 cm−1) is at a lower wavenumber than that of jadeite (at 700 cm−1). Thus, the ~680 cm−1 peak can be used to identify jadeite and omphacite, and can reveal compositional variations of the jadeite-omphacite solid solution.
High-pressure minerals are often heterogeneous. The Raman spectrometer used in the study has a small analysis area (incident laser diameter: ~2 µm), and minor mineral phases can be identified.
For the two blue-green-series samples, this compositional difference is significant. Using Raman high-magnification (50× or 100×) microscopy, light and dark gray mineral grains are clearly visible, with most particle sizes of 10–30 μm. The visually-homogeneous area (inclusion-free) was selected for the Raman microprobe analysis. The results show that the Raman spectra of the dark- and light-gray mineral grains are different (Table 4 and Figure 9a,b). Figure 9a shows the Raman spectral comparison of the gray (M-6-A) and light gray (M-6-B) mineral grains of Myanmar sample M-6, with peak at 687.2 cm−1 and 694.1 cm−1, respectively. The dark gray peak level is lower than the light gray one, with a peak shift difference of 6.9 cm−1. Figure 9b shows the Raman spectral comparison of the dark gray (G-6-A) and light gray (G-6-B) mineral grains of Guatemalan sample G-6, with peaks at 694.1 cm−1 and 680.4 cm−1, respectively. The dark gray peak is higher than the light gray one, with a peak shift difference of 13.7 cm−1.
For the blue series samples, mineral particles with varying compositions cannot be distinguished with a Raman high magnification (50× or 100×) microscope. Eight spots were analyzed along a line (in the 60–70 μm range), of which the maximum and minimum peak shifts at ~680 cm−1 were compared to assess the sample compositional variation range (Table 4 and Figure 9c,d). We found that the peak shift of the Myanmar samples was 692.6–694.1 cm−1, with a peak shift difference of 0–0.7 cm−1 due to intragrain compositional variations. Meanwhile, peak shift of the Guatemala samples was 692.6–697.5 cm−1, with a peak shift difference of 1.7–3.2 cm−1. The results show that the main composition of the samples from both countries is jadeite, and the spectra shift toward omphacite for some analysis spots, indicating that the composition of the solid solution shifts toward omphacite.
Meanwhile, the peak of the darker region M-2-S (692.6–693.3 cm−1) in sample M-2 shifts toward the omphacite range (cf. the lighter M-2-Q peak level: 695.8 cm−1) (Table 4). Thus, we inferred that the blue-water jadeite becomes darker with increasing omphacite content.
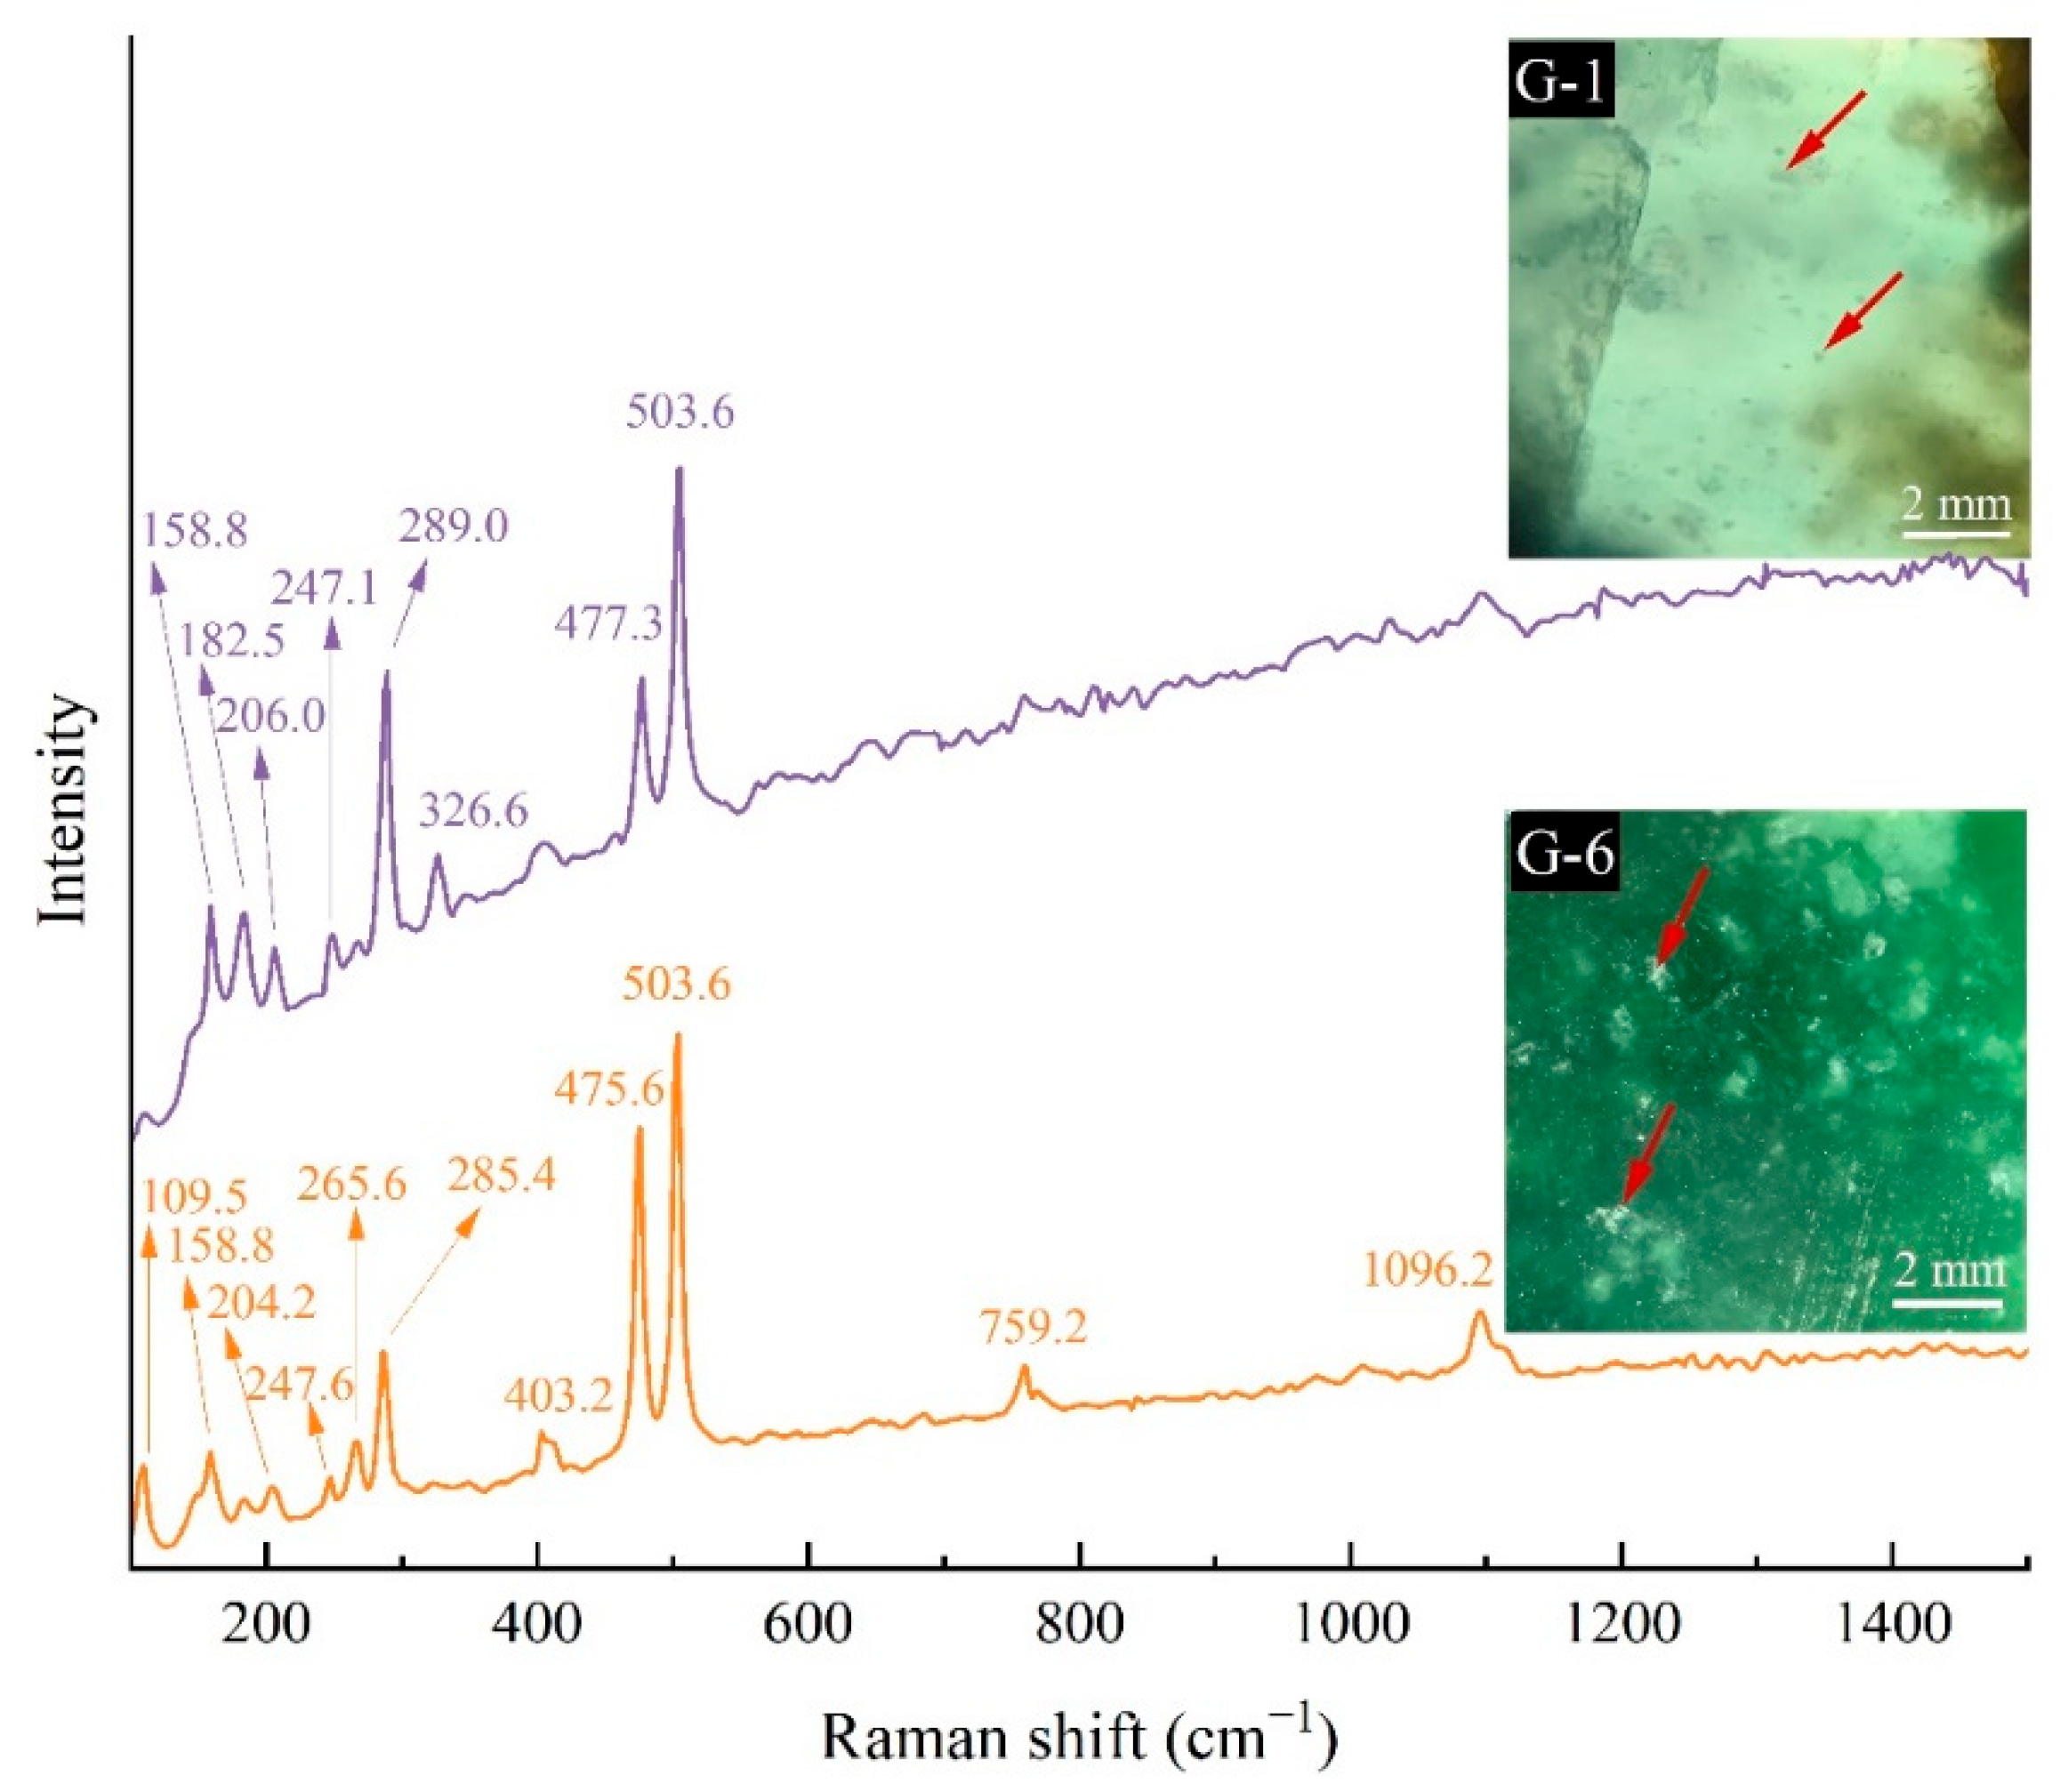
The Raman spectral data indicate that the Myanmar samples are relatively pure with no detectable mineral inclusions. Raman peaks of the white mineral inclusions in the Guatemalan samples (e.g., samples G-1 and G-6) are at 158.8, 204.2, 247.6, 265.6, 285.4, 475.6, 503.6, 759.2, and 1096.2 cm−1 (Figure 10). The comparison with minerals of the RRUFF database shows that the white minerals are albite [54]. The Raman peaks of the green mineral inclusions (e.g., samples G-2 and G-5) are at 140.6, 198.8, 340.9, 410.3, 514.1, 556.1, 677.1, 974.3, 1017.3, and 1025.6 cm−1. Raman peak comparison among omphacite, augite, and aegirine in the RRUFF database (Figure 11) indicates that its main component is omphacite [54]. The peak shift at 677.1 cm−1 and the stronger 340–556 cm−1 peaks indicate certain similarity to augite and aegirine, meaning that compositional variations of the solid solution shift toward the aegirine-augite field. This suggests that the green punctate minerals are mainly omphacite with some aegirine-augite mixture.
In general, the Myanmar jadeite jade samples have a narrower solid-solution composition range and are compositionally more homogeneous than the composition range in the Guatemalan samples. The blue-green series shows a very heterogeneous growth pattern, with intergrowth of relatively pure jadeite and mixed jadeite-omphacite in the Myanmar samples, and intergrowth of relatively pure jadeite and omphacite in the Guatemalan samples. This investigation further suggests that origin of gem-quality jade composed of pyroxene aggregate from Myanmar and Guatemala—even the chemical composition of the component pyroxene varies greatly [55]—could be determined by non-destructive spectroscopic techniques.
4. Conclusions
Yellow grain margin and disseminated white albite and green (mainly omphacite and some aegirine–augite mixture) inclusions are diagnostic of some Guatemala blue-water jadeite jades. Comparatively, the Myanmar blue-water jadeite jades have a finer and more uniform texture and much fewer impurities.
Total Fe content of the Myanmar blue-water jadeite is generally lower than that of its Guatemala counterpart. UV-Vis absorption spectra show that the Myanmar blue-water jadeite has higher Fe3+ content, resulting in strong absorption at 437 nm and 380 nm. Meanwhile, the Guatemala blue-water jadeite has higher Fe2+ content, and the 900–1000 nm absorption is stronger than that of its Myanmar counterpart.
Compared with the Myanmar blue-water jadeite jade, the Na/(Na+Ca) molar ratio of the Guatemala blue-water jadeite jade is lower (i.e., higher omphacite content), and most of the IR absorption peaks shift to lower wavenumbers. This shift is distinct at the absorption peaks of 1074–1084 cm−1, 455–474 cm−1, and 426–434 cm−1, which can be used to differentiate the blue-water jadeite jade origin.
Compared with the Myanmar blue-water jadeite jades, the Guatemalan samples are more heterogeneous (have a broader solid-solution composition range) and can be distinguished by the ~680 cm−1 Raman peak shift difference in the composition range. For the blue series samples, the peak shift difference is 0–0.7 cm−1 (Myanmar samples) and 1.7–3.2 cm−1 (Guatemala samples). For the blue-green series samples, this difference is 6.9 cm−1 (Myanmar samples) and 13.7 cm−1 (Guatemala samples).
In summary, a novel, nondestructive method was provided to distinguish samples from Myanmar and Guatemala. Although the number of samples is not enough, this result would have certain applications and lead to related attentions.
Author Contributions
Conceptualization, Y.Z. and G.S.; methodology, Y.Z.; software, Y.Z.; validation, Y.Z.; formal analysis, Y.Z. and G.S.; investigation, Y.Z. and G.S.; resources, Y.Z. and G.S.; data curation, Y.Z.; writing—original draft preparation, Y.Z.; writing—review and editing, G.S.; visualization, Y.Z.; supervision, G.S.; project administration, Y.Z. and G.S.; funding acquisition, Y.Z. and G.S. All authors have read and agreed to the published version of the manuscript.
Funding
This research was funded by the National Science Foundation of China (No. 42273044), the Second Tibetan Plateau Scientific Expedition and Research Program (No. 2019QZKK0802), and the Program of National Mineral Rock and Fossil Specimens Resource Center from most.
Institutional Review Board Statement
Not applicable.
Informed Consent Statement
Not applicable.
Data Availability Statement
Data are contained within the article.
Acknowledgments
The authors would like to thank Yuan Y. for the lab technical support (School of Gemology, China University of Geosciences, Beijing), and Long C. and Hu J. for their kind help and fruitful discussion.
Conflicts of Interest
The authors declare no conflict of interest.
References
- GB/T 16553–2017; Gems-Testing. Standards Press of China: Beijing, China, 2017; pp. 50–51.
- Shi, G.H.; Wang, X.; Chu, B.B.; Cui, W.Y. Jadeite jade from Myanmar: Its texture and gemmological implications. J. Gemmol. 2009, 31, 185–195. [Google Scholar] [CrossRef]
- Harder, H. Trace elements as colouring agents in jadeites. J. Gemmol. 1995, 24, 508–511. [Google Scholar] [CrossRef]
- Harlow, G.E.; Sisson, V.B.; Lallemant, H.G.A.; Sorensen, S.S.; Seitz, R. High-pressure, metasomatic rocks along the Motagua fault zone, Guatemala. Ofioliti 2003, 28, 115–120. [Google Scholar]
- Hughes, R.W.; Galibert, O.; Bosshart, G.; Ward, F.; Oo, T.; Smith, M.; Sun, T.T.; Harlow, G.E. Burmese jade: The inscrutable gemstone. Gems Gemol. 2000, 36, 2–26. [Google Scholar] [CrossRef] [Green Version]
- Harlow, G.E. Jadeitites, albitites and related rocks from the Motagua Fault Zone, Guatemala. J. Metamorph. Geol. 1994, 12, 49–68. [Google Scholar] [CrossRef]
- Shi, G.H.; Stöckhert, B.; Cui, W.Y. Kosmochlor and chromian jadeite aggregates from the Myanmar jadeitite area. Miner. Mag. 2005, 69, 1059–1075. [Google Scholar] [CrossRef]
- Harlow, G.E.; Sisson, V.B.; Sorensen, S.S. Jadeitite from Guatemala: New observations and distinctions among multiple occurrences. Geol. Acta 2011, 9, 363–387. [Google Scholar]
- Shi, G.H.; Harlow, G.E.; Wang, J.; Wang, J.; Enoch, N.G.; Wang, X.; Cao, S.M.; Cui, W.Y. Mineralogy of jadeitite and related rocks from Myanmar: A review with new data. Eur. J. Mineral. 2012, 24, 345–370. [Google Scholar] [CrossRef]
- Harlow, G.E.; Hemming, S.R.; Lallemant, H.G.A.; Sisson, V.B.; Sorensen, S.S. Two high-pressure-low-temperature serpentinite-matrix mélange belts, Motagua fault zone, Guatemala: A record of Aptian and Maastrichtian collisions. Geology 2004, 32, 17–20. [Google Scholar] [CrossRef] [Green Version]
- Shi, G.H.; Cui, W.Y.; Cao, S.M.; Jiang, N.; Jian, P.; Liu, D.Y.; Miao, L.C.; Chu, B.B. Ion microprobe zircon U-Pb age and geochemistry of the Myanmar jadeitite. J. Geol. Soc. 2008, 165, 221–234. [Google Scholar] [CrossRef]
- Brueckner, H.K.; Lallemant, H.G.A.; Sisson, V.B.; Harlow, G.E.; Hemming, S.R.; Martens, U.; Tsujimori, T.; Sorensen, S.S. Metamorphic reworking of a high pressure-low temperature mélange along the Motagua fault, Guatemala: A record of Neocomian and Maastrichtian transpressional tectonics. Earth Planet. Sci. Lett. 2009, 284, 228–235. [Google Scholar] [CrossRef] [Green Version]
- Qi, M.; Xiang, H.; Zhong, Z.Q.; Qiu, H.N.; Wang, H.; Sun, X.L.; Xu, B. 40Ar/39Ar geochronology constraints on the formation age of Myanmar jadeitite. Lithos 2013, 162, 107–114. [Google Scholar] [CrossRef]
- Harlow, G.E. Crystal chemistry of barium enrichment in micas from metasomatized inclusions in serpentine, Motagua fault zone, Guatemala. Eur. J. Mineral. 1995, 7, 775–789. [Google Scholar] [CrossRef]
- Johnson, C.A.; Harlow, G.E. Guatemala jadeitites and albitites were formed by deuterium-rich serpentinizing fluids deep within a subduction zone. Geology 1999, 27, 629–632. [Google Scholar] [CrossRef]
- Sorensen, S.; Harlow, G.E.; Rumble III, D. The origin of jadeitite-forming subduction-zone fluids: CL-guided SIMS oxygen-isotope and trace-element evidence. Am. Mineral. 2006, 91, 979–996. [Google Scholar] [CrossRef]
- Shi, G.H.; Jiang, N.; Liu, Y.; Wang, X.; Zhang, Z.Y.; Xu, Y.J. Zircon Hf isotope signature of the depleted mantle in the Myanmar jadeitite: Implications for Mesozoic intra-oceanic subduction between the Eastern Indian Plate and the Myanmar Platelet. Lithos 2009, 112, 342–350. [Google Scholar] [CrossRef]
- Shi, G.H.; Jiang, N.; Wang, Y.W.; Zhao, X.; Wang, X.; Li, G.W.; Ng, E.; Cui, W.Y. Ba minerals in clinopyroxene rocks from the Myanmar jadeitite area: Implications for Ba recycling in subduction zones. Eur. J. Mineral. 2010, 22, 199–214. [Google Scholar] [CrossRef] [Green Version]
- Shi, G.H.; Zhu, X.K.; Deng, J.; Mao, Q.A.; Liu, Y.X.; Li, G.W. Spherules with pure iron cores from Myanmar jadeitite: Type-I deep-sea spherules? Geochim. Cosmochim. Acta 2011, 75, 1608–1620. [Google Scholar] [CrossRef]
- Tsujimori, T.; Harlow, G.E. Petrogenetic relationships between jadeitite and associated high-pressure and low-temperature metamorphic rocks in worldwide jadeitite localities: A review. Eur. J. Mineral. 2012, 24, 371–390. [Google Scholar] [CrossRef] [Green Version]
- Wang, X.; Shi, G.H.; Qiu, D.F.; Wang, J.; Cui, W.Y. Grossular-bearing jadeite omphacite rock in the Myanmar jadeite area: A kind of jadeitized rodingite? Eur. J. Mineral. 2012, 24, 237–246. [Google Scholar] [CrossRef]
- Harlow, G.E.; Flores, K.E.; Marschall, H.R. Fluid-mediated mass transfer from a Paleosubduction channel to its mantle wedge: Evidence from jadeitite and related rocks from the Guatemala Suture Zone. Lithos 2016, 258, 15–36. [Google Scholar] [CrossRef] [Green Version]
- Chen, Y.; Huang, F.; Shi, G.H.; Wu, F.Y.; Chen, X.; Jin, Q.Z.; Su, B.; Guo, S.; Sein, K.; Nyunt, T.T. Magnesium isotope composition of subduction zone fluids as constrained by jadeitites from Myanmar. J. Geophys. Res. Solid Earth 2018, 123, 7566–7585. [Google Scholar] [CrossRef]
- Morozzi, P.; Ballarin, B.; Arcozzi, S.; Brattich, E.; Lucarelli, F.; Nava, S.; Gómez-Cascales, P.J.; Orza, J.A.G.; Tositti, L. Ultraviolet-Visible Diffuse Reflectance Spectroscopy (UV-Vis DRS), a rapid and non-destructive analytical tool for the identification of Saharan dust events in particulate matter filters. Atmos. Environ. 2021, 252, 118297. [Google Scholar] [CrossRef]
- Guerrero-Pérez, M.O.; Patience, G.S. Experimental methods in chemical engineering: Fourier transform infrared spectroscopy-FTIR. Can. J. Chem. Eng. 2020, 98, 25–33. [Google Scholar] [CrossRef]
- Xing, B.Q.; Shi, G.H.; Zhang, J.H.; Long, C.; Zhang, Y.; He, L.Y.; Hu, R.J. Characteristics of the guatemalan feicui and its comparison to the myanmar feicui. Geoscience 2021, 35, 1769–1788, (In Chinese with English abstract). [Google Scholar]
- Xue, H.Y.; Chen, T.; Li, Z.G. Mineralogical comparison between omphacite-bearing jadeite from Guatemala and that from Myanmar. Acta Petrol. Mineral. 2020, 39, 481–494, (In Chinese with English abstract). [Google Scholar]
- Wang, J. The Study on “Snowflake Floc” of Jadeitites in Myanmar and Discussion of Evolution Process. Master’s Thesis, Guilin University of Technology, Guilin, China, 2019; pp. 1–67, (In Chinese with English abstract). [Google Scholar]
- He, L.Y.; Liu, J.; Long, C.; Liao, B.B. Gemmological and mineralogical characteristic of “Lan shui” jadeite. J. Gems Gemmol. 2018, 20, 31–37, (In Chinese with English abstract). [Google Scholar]
- Harlow, G.E.; Quinn, E.P.; Rossman, G.R.; Rohtert, W.R. Blue omphacite from Guatemala. Gems Gemol. 2004, 40, 68–70. [Google Scholar]
- Skelton, R.; Walker, A. The effect of cation order on the elasticity of omphacite from atomistic calculations. Phys. Chem. Miner. 2015, 42, 677–691. [Google Scholar] [CrossRef] [Green Version]
- Flores, K.E.; Martens, U.C.; Harlow, G.E.; Brueckner, H.K.; Pearson, N.J. Jadeitite formed during subduction: In situ zircon geochronology constraints from two different tectonic events within the Guatemala Suture Zone. Earth Planet. Sci. Lett. 2013, 371–372, 67–81. [Google Scholar] [CrossRef] [Green Version]
- Foshag, W.F. Mineralogical studies on Guatemalan jade. In Smithsonian Miscellaneous Collections; The Smithsonian Institution: Washington, DC, USA, 1957; Volume 135, pp. 15–17. [Google Scholar]
- Viggiano, A.M.; Sil, J.L.R.; Ortega, M.D.M.; Berdasco, V.C. Non-destructive micro-chemical and micro-luminescence characterization of jadeite. Microsc. Microanal. 2016, 22, 1304–1315. [Google Scholar] [CrossRef]
- Ouyang, C.M.; Shi, G.H.; Zhang, W.; Wen, J.Y.; Yan, J. The chemical composition and gemological characteristics of Fei Cui from Guatemala. Hong Kong Gemol. Assoc. Annu. 2017, 38, 84–89, (In Chinese with English abstract). [Google Scholar]
- Shinno, I.; Oba, T. Absorption and photo-luminescence spectra of Ti3+ and Fe3+ in jadeites. Mineral. J. 1993, 16, 378–386. [Google Scholar] [CrossRef] [Green Version]
- Burns, R.G. Mineralogical Applications of Crystal Field Theory, 2nd ed.; Cambridge University Press: New York, NY, USA, 1993; pp. 87–92. [Google Scholar]
- Rossman, G.R. Lavender jade. The optical spectrum of Fe3+ and Fe2+→Fe3+ intervalence charge transfer in jadeite from Burma. Am. Mineral. 1974, 59, 868–870. [Google Scholar]
- Coccato, A.; Karampelas, S.; Wörle, M.; Van Willigend, S.; Pétrequin, P. Gem quality and archeological green ‘jadeite jade’ versus ‘omphacite jade’. J. Raman Spectrosc. 2014, 45, 11–12. [Google Scholar] [CrossRef]
- Gendron, F.; Smith, D.C.; Masson, P.; Rodríguez Martínez, M.D.C.; Ortiz Ceballos, P. Portable Raman verification and quantification of jade in Olmec ceremonial axes from El Manatí, Veracruz, Mexico. J. Raman Spectrosc. 2017, 48, 1618–1632. [Google Scholar] [CrossRef]
- Lin, C.; He, X.; Lu, Z.; Yao, Y. Phase composition and genesis of pyroxenic jadeite from Guatemala: Insights from cathodoluminescence. RSC Adv. 2020, 10, 15937–15946. [Google Scholar] [CrossRef] [Green Version]
- Khomenko, V.M.; Platonov, A.N. Electronic absorption spectra of Cr3+ ions in natural clinopyroxenes. Phys. Chem. Miner. 1985, 11, 261–265. [Google Scholar] [CrossRef]
- Lu, R. Color origin of lavender jadeite: An alternative approach. Gems Gemol. 2012, 48, 273–283. [Google Scholar] [CrossRef]
- Jindal, R.; Jayaganthan, R.; Singh, I.V.; Reinhard Conradt, R. Synthesis and characterization of clinopyroxene based glasses and glass-ceramics along diopside (CaMgSi2O6)-jadeite (NaAlSi2O6) join. Ceram. Int. 2011, 37, 741–748. [Google Scholar] [CrossRef]
- Diella, V.; Bocchio, R.; Caucia, F.; Marinoni, N.; Langone, A.; Possenti, E. New insights for gem-quality mn-bearing diopside-omphacite, violane variety, from saint Marcel (Val D’Aosta, Italy): Its trace elements and spectroscopic characterization. Minerals 2021, 11, 171. [Google Scholar] [CrossRef]
- Ostrooumov, M.; Morales, A.V. Mexican jadeite-bearing rock: A first mineralogical and gemmological approach. J. Gemmol. 2010, 32, 1–4. [Google Scholar] [CrossRef]
- Ouyang, C.M.; Li, J.Q.; Li, H.; Kwok, B. Recent studies on inky black omphacite jade. J. Gemmol. 2003, 28, 337–344. [Google Scholar]
- Manrique-Ortega, M.D.; Mitrani, A.; Casanova-González, E.; Jiménez-Galindo, L.A.; Ruvalcaba-Sil, J.L. Methodology for the non-destructive characterization of jadeite-jade for archaeological studies. Spectrochim. Acta A Mol. Biomol. Spectrosc. 2019, 217, 294–309. [Google Scholar] [CrossRef]
- Hargett, D. Jadeite of Guatemala: A contemporary view. Gems Gemol. 1990, 26, 134–141. [Google Scholar] [CrossRef]
- Eaton-Magaña, S.; Breeding, C.M.; Palke, A.C.; Homkrajae, A.; Sun, Z.; McElhenny, G. Raman and photoluminescence mapping of gem materials. Minerals 2021, 11, 177. [Google Scholar] [CrossRef]
- Kalugina, A.D.; Zedgenizov, D.A. Micro-Raman spectroscopy assessment of chemical compounds of mantle clinopyroxenes. Minerals 2020, 10, 1084. [Google Scholar] [CrossRef]
- Huang, E.; Chen, C.H.; Huang, T.; Lin, E.H.; Xu, J.A. Raman spectroscopic characteristics of Mg-Fe-Ca pyroxenes. Am. Mineral. 2000, 85, 473–479. [Google Scholar] [CrossRef]
- Smith, D.C. The RAMANITA© method for non-destructive and in situ semi-quantitative chemical analysis of mineral solid-solutions by multidimensional calibration of Raman wavenumber shifts. Spectrochim. Acta A Mol. Biomol. Spectrosc. 2015, 61, 2299–2314. [Google Scholar] [CrossRef]
- RRUFF Project. Available online: http://rruff.info (accessed on 26 August 2022).
- Xing, B.Q.; Shi, G.H.; Long, T.; Shih, M.Y. Origin determination of inky black omphacite jade from Myanmar and Guatemala with non-destructive analysis. J. Raman Spectrosc. 2022, 1. [Google Scholar] [CrossRef]
Figure 1.
Polished slab photos of studied jadeite jade samples: Myanmar (M-1 to M-6) and Guatemalan jadeite jade (G-1 to G-6).
Figure 1.
Polished slab photos of studied jadeite jade samples: Myanmar (M-1 to M-6) and Guatemalan jadeite jade (G-1 to G-6).

Figure 2.
Schematic diagram of the integrating sphere used in the UV-Vis DRS measurements for the BaSO4 standard white board (a) and jadeite jade sample (b).
Figure 2.
Schematic diagram of the integrating sphere used in the UV-Vis DRS measurements for the BaSO4 standard white board (a) and jadeite jade sample (b).

Figure 3.
Schematic diagram of the FTIR reflection mode for measuring (a) background spectra with gold-coated mirror, and (b) jadeite jade sample spectra.
Figure 3.
Schematic diagram of the FTIR reflection mode for measuring (a) background spectra with gold-coated mirror, and (b) jadeite jade sample spectra.

Figure 4.
Microscopic photos of samples (M-1, M-2-Q, M-2-S, M-6 from Myanmar, and G-1, G-2, G-5, G-6 from Guatemala).
Figure 4.
Microscopic photos of samples (M-1, M-2-Q, M-2-S, M-6 from Myanmar, and G-1, G-2, G-5, G-6 from Guatemala).

Figure 5.
UV-Vis absorption spectra of the blue-water jadeite jades from Myanmar and Guatemala.

Figure 6.
IR spectra of the blue series samples from Myanmar and Guatemala.

Figure 7.
Plot of IR absorption peak shifts in the blue-series jadeite jade samples from Myanmar and Guatemala.
Figure 7.
Plot of IR absorption peak shifts in the blue-series jadeite jade samples from Myanmar and Guatemala.

Figure 8.
Comparison of IR spectra of the blue-green-series jadeite jade samples from Myanmar (M-6) and Guatemala (G-6).
Figure 8.
Comparison of IR spectra of the blue-green-series jadeite jade samples from Myanmar (M-6) and Guatemala (G-6).

Figure 9.
Raman spectra of the samples from Myanmar (M-6, M-1) and Guatemala (G-6, G-1): (a) dark gray (M-6-A) and light gray (M-6-B) mineral grains in sample M-6; (b) dark gray (G-6-A) and light gray (G-6-B) mineral grains in sample G-6; (c) All analysis spots of M-1 have the same peak shift at ~680 cm−1 (e.g., M-1-a and M-1-e); (d) Two analysis spots of G-1 with the maximum (G-1-c) and minimum (G-1-f) peak shifts at ~680 cm−1 in G-1.

Figure 10.
Raman spectra of white albite in the Guatemalan samples (G-6, G-1).

Figure 11.
Raman spectra of the green mineral inclusions in the Guatemalan samples (G-2, G-5), which are mainly omphacite and some aegirine–augite mixture. The reference spectra of omphacite, augite, and aegirine are plotted from the RRUFF database (No. R061129, R070231, and R040054) [54].
Figure 11.
Raman spectra of the green mineral inclusions in the Guatemalan samples (G-2, G-5), which are mainly omphacite and some aegirine–augite mixture. The reference spectra of omphacite, augite, and aegirine are plotted from the RRUFF database (No. R061129, R070231, and R040054) [54].


Table 1.
Gemological characteristics of the studied jadeite jade samples.
| Origin | Series | Sample | Color | Appearance | Specific Gravity | RI |
|---|---|---|---|---|---|---|
| Myanmar | Blue | M-1 | Blue | Blue with “floating blue flowers” inclusions, good transparency | 3.33 | 1.66 |
| M-2-Q | Light blue | Good transparency, uniform, and fine (high quality) | 3.33 | 1.66 | ||
| M-2-S | Blue | Good transparency, uniform, and fine (high quality) | 3.33 | 1.66 | ||
| Blue-green | M-6 | Blue-green | Good transparency and fine. The color is similar to the blue-green area of the G-6. | 3.34 | 1.66 | |
| Guatemala | Blue series | G-1 | Blue with slight green tone | Good transparency, uniform, and fine, but with thin yellow weathered crust (~0.5 mm thick), disseminated white spotty inclusions (various sizes) and a bright green crosscutting vein | 3.24 | 1.66 |
| G-2 | Light blue with gray tone | Less uniform, fine, and transparent than G-1. Numerous blue-green or white spotty mineral inclusions of various sizes | 3.26 | 1.66 | ||
| G-5 | Blue | Less transparent than G-1. Similar texture and inclusions to G-2, albeit appears darker. Thin yellow weathered crust (~0.2 mm thick) | 3.30 | 1.66 | ||
| Blue-green series | G-6 | Blue-green | Good transparency, uniform, and fine, but with local bright green and white patches | 3.31 | 1.67 |
M-2-Q and M-2-S are two regions from the same sample but with different colors.
Table 2.
XRF major elemental oxide contents of the studied jadeite jade samples.
| Origin | Myanmar | Guatemala | ||||||
|---|---|---|---|---|---|---|---|---|
| Series | Blue | Blue-Green | Blue | Blue-Green | ||||
| Sample | M-1 | M-2-Q | M-2-S | M-6 | G-1 | G-2 | G-5 | G-6 |
| SiO2 | 56.34 | 55.39 | 53.95 | 54.85 | 57.59 | 59.14 | 57.34 | 57.67 |
| Al2O3 | 18.63 | 20.82 | 21.02 | 16.51 | 19.51 | 19.23 | 18.76 | 13.73 |
| Na2O | 14.64 | 20.35 | 20.75 | 17.19 | 14.65 | 11.97 | 12.93 | 8.69 |
| CaO | 5.54 | 1.74 | 2.43 | 5.57 | 3.91 | 4.70 | 5.30 | 10.63 |
| MgO | 3.23 | 0.80 | 0.86 | 3.52 | 2.03 | 2.48 | 3.00 | 6.48 |
| TFeO | 1.50 | 0.79 | 0.86 | 2.09 | 1.95 | 2.15 | 2.33 | 2.47 |
| TiO2 | 0.06 | 0.07 | 0.11 | 0.14 | 0.32 | 0.26 | 0.29 | 0.14 |
| Cr2O3 | 0.03 | 0.01 | 0.01 | 0.09 | 0.01 | 0.01 | 0.01 | 0.10 |
| MnO | 0.03 | 0.02 | 0.01 | 0.03 | 0.03 | 0.05 | 0.04 | 0.08 |
| NiO | 0.01 | 0.01 | 0.01 | 0.02 | 0.01 | 0.01 | 0.00 | 0.02 |
| Total | 100.01 | 100.00 | 100.01 | 100.01 | 100.01 | 100.00 | 100.00 | 100.01 |
| Na+/(Na++Ca2+) | 0.83 | 0.95 | 0.94 | 0.85 | 0.87 | 0.82 | 0.82 | 0.60 |
| TFeOav | 1.31 | 2.22 | ||||||
M-2-Q and M-2-S are two different-color regions within the same sample.
Table 3.
IR spectra of blue-water jadeite samples from Myanmar and Guatemala.
| Series | Blue | Blue-Green | ||||||
|---|---|---|---|---|---|---|---|---|
| Origin | Myanmar | Guatemala | Myanmar | Guatemala | ||||
| Sample | M-1 | M-2-Q | M-2-S | G-1 | G-2 | G-5 | M-6 | G-6 |
| 1167 | 1166 | 1167 | 1165 | 1163 | 1163 | 1163 | 1163 | |
| 1083 | 1082 | 1084 | 1080 | 1078 | 1078 | 1080 | 1074 | |
| 1049 | 1049 | 1049 | ||||||
| 962 | 962 | 962 | 961 | 961 | 959 | 964 | 958 | |
| Wavenumber | 854 | 855 | 854 | 852 | 853 | 852 | 891 | |
| (cm−1) | 743 | 743 | 743 | 740 | 740 | 740 | ||
| 665 | 667 | 667 | 663 | 663 | 663 | 659 | 651 | |
| 586 | 586 | 588 | 584 | 584 | 582 | 576 | 571 | |
| 528 | 530 | 530 | 527 | 527 | 527 | 526 | 524 | |
| 473 | 474 | 473 | 469 | 467 | 467 | 466 | 455 | |
| 433 | 434 | 434 | 430 | 430 | 428 | 432 | 426 | |
Table 4.
Summary of Raman spectral data of the blue-water jadeite jades analyzed in this study.
| Series | Origin | Analysis Spot | Raman Shift (cm−1) | S.E. (cm−1) * | Difference (cm−1) ** | ||||||||
|---|---|---|---|---|---|---|---|---|---|---|---|---|---|
| M-O Stretch/Bend | O-Si-O Bend | Si-Obr Stretch | Si-Onbr Stretch | ||||||||||
| Blue | Myanmar | M-1-a | 144.6 | 200.8 | 370.9 | 427.4 | 522.0 | 694.1 | 1034.6 | 0.1 | 0 | ||
| M-1-e | 142.8 | 200.8 | 370.9 | 427.4 | 522.0 | 694.1 | 981.8 | 1034.6 | 0.2 | ||||
| M-2-Q-c | 141.6 | 200.8 | 372.4 | 431.1 | 521.1 | 571.5 | 695.8 | 988.0 | 1035.5 | 0.1 | 0 | ||
| M-2-Q-e | 141.6 | 200.8 | 370.9 | 427.4 | 520.3 | 695.8 | 988.0 | 1035.5 | 0.1 | ||||
| M-2-S-amin | 142.4 | 200.6 | 369.4 | 428.5 | 519.4 | 692.6 | 980.9 | 1035.5 | 0.1 | 0.7 | |||
| M-2-S-cmax | 142.8 | 200.6 | 369.4 | 428.5 | 521.1 | 571.5 | 693.3 | 986.2 | 1033.8 | 0.1 | |||
| Guatemala | G-1-cmax | 142.8 | 202.6 | 372.6 | 430.9 | 522.0 | 572.4 | 697.5 | 988.5 | 1036.3 | 0.1 | 3.2 | |
| G-1-fmin | 142.8 | 200.6 | 369.4 | 420.9 | 517.6 | 694.3 | 979.3 | 1033.8 | 0.3 | ||||
| G-2-bmax | 140.9 | 202.6 | 372.6 | 430.9 | 533.0 | 572.4 | 697.5 | 988.5 | 1036.3 | 0.1 | 1.7 | ||
| G-2-emin | 142.8 | 200.8 | 370.9 | 427.4 | 520.3 | 570.7 | 695.8 | 986.8 | 1036.3 | 0.2 | |||
| G-5-fmin | 140.4 | 200.6 | 369.4 | 422.7 | 519.4 | 570.0 | 692.6 | 976.0 | 1032.2 | 0.3 | 3.2 | ||
| G-5-dmax | 140.9 | 200.8 | 370.9 | 425.7 | 520.3 | 570.7 | 695.8 | 986.8 | 1036.3 | 0.2 | |||
| Blue-green | Myanmar | M-6-A | 142.8 | 202.6 | 369.1 | 413.3 | 518.5 | 567.2 | 687.2 | 980.2 | 1029.7 | 0.1 | 6.9 |
| M-6-B | 142.8 | 200.8 | 370.9 | 422.1 | 518.5 | 569.0 | 694.1 | 985.2 | 1033.0 | 0.2 | |||
| Guatemala | G-6-A | 142.8 | 202.6 | 370.9 | 415.1 | 520.3 | 567.0 | 694.1 | 1029.7 | 0.1 | 13.7 | ||
| G-6-B | 142.8 | 202.6 | 370.9 | 409.8 | 516.8 | 563.8 | 680.4 | 1023.1 | 0.2 | ||||
* S.E. = Standard error of peak shift at ~680 cm−1 (peaks were obtained using the fitting function of Origin software). ** Peak shift difference at ~680 cm−1.
Publisher’s Note: MDPI stays neutral with regard to jurisdictional claims in published maps and institutional affiliations. |
© 2022 by the authors. Licensee MDPI, Basel, Switzerland. This article is an open access article distributed under the terms and conditions of the Creative Commons Attribution (CC BY) license (https://creativecommons.org/licenses/by/4.0/).
Share and Cite
MDPI and ACS Style
Zhang, Y.; Shi, G. Origin of Blue-Water Jadeite Jades from Myanmar and Guatemala: Differentiation by Non-Destructive Spectroscopic Techniques. Crystals 2022, 12, 1448. https://doi.org/10.3390/cryst12101448
AMA Style
Zhang Y, Shi G. Origin of Blue-Water Jadeite Jades from Myanmar and Guatemala: Differentiation by Non-Destructive Spectroscopic Techniques. Crystals. 2022; 12(10):1448. https://doi.org/10.3390/cryst12101448
Chicago/Turabian StyleZhang, Yu, and Guanghai Shi. 2022. "Origin of Blue-Water Jadeite Jades from Myanmar and Guatemala: Differentiation by Non-Destructive Spectroscopic Techniques" Crystals 12, no. 10: 1448. https://doi.org/10.3390/cryst12101448
Note that from the first issue of 2016, this journal uses article numbers instead of page numbers. See further details here.