
Radiation Damage on Selenomethionine-Substituted Single-Domain Substrate-Binding Protein


College of General Education, Kookmin University, Seoul 02707, Republic of Korea
Crystals 2023, 13(12), 1620; https://doi.org/10.3390/cryst13121620
Submission received: 1 November 2023
/
Revised: 19 November 2023
/
Accepted: 21 November 2023
/
Published: 22 November 2023
(This article belongs to the Section Macromolecular Crystals)
Abstract
:Radiation damage is an inherent challenge in macromolecular crystallography (MX). This diminishes the diffraction quality and also compromises the accuracy of the crystal structure. Investigating the impact of radiation damage on the crystal quality and structure can offer valuable insights into the structural interpretation and data collection strategy. Selenomethionine (SeMet, Mse) is an amino acid that exists in nature and contains a high-Z atom, i.e., selenium (Se), which is sensitive to radiation damage; however, little is known regarding the radiation damage of this amino acid. To better understand the radiation damage that affects SeMet, we investigated the radiation damage to a SeMet-substituted substrate-binding protein from Rhodothermus marinus. As the X-ray dose increased, the quality of the data statistics deteriorated. In particular, an increase in the X-ray dose increased the negative Fo-Fc electron density map near the Se atom of the Mse residue, while no negative Fo-Fc electron density map was observed in the other atoms (O, C, and N). Radiation damage increased the absolute B-factor value of the Se atom in the Mse residue, which was higher than that of the other atoms. This indicates that Se is more sensitive to radiation damage than other atoms. These results will contribute to advancing our knowledge of the radiation damage that can occur in MX.
1. Introduction
The macromolecular crystallography (MX) technique is a useful tool to determine the crystal structure of biomolecules at an atomic scale [1,2]. The crystal structure that is determined with MX provides valuable information to understand the phenomena of life at the atomic level [3,4,5,6]. Moreover, this structural information contributes to the development of a wide range of fields, including applications in drug design, food, and medical industries [7,8,9,10]. Although the MX technique is very useful in assembling the structural information of biomolecules, when this technique is used for experimentation, it involves the inherent challenge of radiation damage to the crystal sample caused by X-rays [11]. When a crystal sample is exposed to X-rays, free radicals are generated due to the absorption of the X-rays by the crystal sample, which causes global or specific radiation damage [12]. Global radiation damage increases the non-isomorphism of the crystal, which increases the unit cell volume or Wilson B coefficient [13,14]. This disrupts the crystal packing, lowers the diffraction intensity of the crystal, and prevents the collection of high-resolution data [13,14]. Specific radiation damage causes problems, such as the elongation and breakage of disulfide bonds, decarboxylation of the aspartic and glutamic acid side chains, disorganization of the sulfur atom in methionine (Met), and photoreduction of the metal centers [13,14,15,16,17,18,19]. Therefore, radiation damage not only interferes with high-resolution diffraction because of the deterioration of the crystal diffraction quality but also reduces the accuracy of the assessed molecule structure [20,21,22]. To understand the effects of radiation damage on protein crystals, various model crystals with high diffraction intensity, such as lysozyme, thaumatin, and insulin, were used [23,24,25,26].
Previous studies that considered radiation damage have mainly focused on sulfur-containing disulfide bonds, Met, metal centers, and negatively charged amino acids, which are known to be sensitive to radiation damage [27]. Meanwhile, little is known regarding the radiation damage to selenoprotein that contains selenomethionine (SeMet) and selenocysteine, which are not included in common amino acids. In humans, selenoproteins have a wide range of pleiotropic effects that range from antioxidant and anti-inflammatory effects to the production of active thyroid hormones [28]. To elucidate the phenomenon of radiation damage through MX experimental techniques, it is essential to utilize a broad range of model samples.
SeMet is a naturally occurring amino acid that contains a S-to-Se modification in Met [29]. The L-SeMet enantiomer is the major selenocompound that is found in grains, grassland legumes, soybeans, and selenium-enriched yeast [30]. SeMet can be non-specifically incorporated into proteins, usually in place of Met, of bacterial or eukaryotic cells [31,32,33]. When SeMet was used instead of Met in the production of recombinant proteins in E. coli, yeast, or baculoviral systems, successful recombinant expression of SeMet-containing proteins was generated [32,33,34,35]. The Se atom in the SeMet residue has a higher number of electrons than the other atoms that amino acids consist of. Accordingly, SeMet-substituted protein crystal is utilized in a standard method, such as single-wavelength anomalous dispersion (SAD) or multiwavelength anomalous dispersion (MAD), to solve the phase phasing of the MX experiment [36,37]. Therefore, the magnitude of radiation damage affecting Se is an important factor that can affect the solving of phasing problems in Se-SAD or Se-MAD experiments.
The amino acid sequence of the substrate-binding protein (SBP) (gene name: Rmar_2177) from Rhodothermus marinus (RmSBP) was annotated as an ABC-type uncharacterized periplasmic transport system, which is located near the methyl-accepting chemotaxis protein gene (Rmar_2177) [38]. Unlike typical SBPs that recognize substrates using two α/β domains, RmSBP has a single domain that consists of one α/β fold [38]. The structural features and molecular flexibility of RmSBP have been previously reported [39]; however, their exact molecular function has not yet been elucidated. High-resolution structures are important for the accurate molecular analysis of radiation damage, and the RmSBP crystals used in previous studies showed high diffraction intensities in the range of 1.5–1.9 Å; thus, they are suitable for use as model samples in radiation damage studies.
In this study, instead of evaluating the biological function of RmSBP, SeMet-substituted RmSBP was used as a model sample to investigate radiation damage in protein crystals that contain SeMet. Diffraction data were collected by continuously exposing SeMet-RmSBP crystals to X-rays. The diffraction images, data processing statistics, crystal structures, and electron density maps for four data sets that were categorized by the applied X-ray dose were comprehensively compared. The global radiation damage of SeMet-RmSBP and the specific radiation damage to SeMet were analyzed. These findings contribute to the broader understanding of radiation damage in MX experiments and SeMet-substituted protein crystals.
2. Materials and Methods
2.1. Protein Preparation
The construction and cloning information have been previously reported [38]. The pET28a vector containing the gene encoding RmSBP (UniProt: D0MDR1, residues 22–185) was transformed into E. coli BL21 (DE3) cells and cultured overnight in 5 mL Luria–Bertani media supplemented with 50 μg/mL kanamycin. The SeMet-substituted RmSBP was expressed using the SeMet expression kit. The cells were harvested through centrifugation at 3000 rpm for 5 min, and these cells were inoculated into 1L M9 media supplemented with 50 μg/mL kanamycin and cultured at 37 °C until the OD600 reached 0.6–0.8. Protein expression was induced with 0.5 mM isopropyl β-D-1-thiogalactopyranoside for 20 h at 18 °C. The cells were harvested through centrifugation at 4000 rpm for 30 min. The cell pellets were resuspended in 50 mM Tris-HCl, pH 8.0, 200 mM NaCl, 10 mM imidazole, and 5 mM β-mercaptoethanol. The cell suspension was sonicated on ice and centrifuged at 39,000× g for 30 min to remove the cell debris. The supernatant was loaded onto a column containing 5 mL Ni-NTA resin (Qiagen, Valencia, CA, USA). The resin was washed with a wash buffer containing 50 mM Tris-HCl, pH 8.0, 200 mM NaCl, 20 mM imidazole, and 5 mM β-mercaptoethanol. The proteins were eluted using a buffer containing 50 mM Tris-HCl, pH 8.0, 200 mM NaCl, 300 mM imidazole, and 10 mM β-mercaptoethanol. The eluted proteins were incubated overnight with thrombin protease at 4 °C to remove the N-terminal expression hexahistidine-tag. The proteins were concentrated using a Centricon and loaded onto a HiLoad Sephacryl 100 16/60 column (GE Healthcare, Chicago, IL, USA) with a buffer containing 10 mM Tris-HCl, pH 8.0, 200 mM NaCl, and 2 mM DTT. All protein purification steps were performed at room temperature.
2.2. Crystallization
RmSBP crystals were grown using the hanging drop vapor diffusion method at 22 °C. RmSBP solution (1 μL, 20 mg/mL) was mixed with 1 μL crystallization solution containing 0.1 M Na-acetate, pH 4.5, 0.2 M MgCl2, and 10% (w/v) polyethylene glycol 3350. Crystallization was performed in a 24-well VDX™ hanging drop plate (Hampton Research, Aliso Viejo, CA, USA), and the crystallization drops were equilibrated with 500 μL crystallization solution. The RmSBP crystal were grown to approximately 0.2 × 0.2 × 0.4 mm3 within a month.
2.3. Data Collection
Diffraction data were collected at beamline 7A at the Pohang Light Source II (PLS-II, Pohang, Republic of Korea). The X-ray photon flux was approximately 1 × 10¹² photons/s. The vertical and horizontal X-ray sizes were 100 and 100 μm (full width at half maximum, FWHM), respectively. The SeMet-RmSBP crystal was soaked into a cryoprotectant solution containing reservoir solution supplemented with 20% (v/v) glycerol for 5 s and mounted on a goniometer under 100 K of liquid nitrogen stream. Diffraction data were collected by rotating the crystal 360°, and all data were collected with a 1 s exposure time and an oscillation angle of 1°. This was repeated an additional three times, and the diffraction data were collected while rotating for a total of 1080°. The diffraction data were collected using an ADSC Q270 CCD detector. The diffraction images were indexed, integrated, and scaled using the Xia2 program [40]. The diffraction patterns were visualized using ADXV (https://www.scripps.edu/tainer/arvai/adxv.html) (accessed on 9 August 2023).
2.4. Structure Determination
The phasing problems were solved by using the molecular replacement method with MOLREP [41]. The crystal structures of the native RmSBP (PDB code 5Z6V) [38] were used as the search model. Model building was performed using the COOT program [42]. Structure refinement was performed using phenix.refine in PHENIX [43]. The final structures were validated using MolProbity [44]. The structure figures were generated using PyMOL (https://pymol.org) (accessed on 9 August 2023).
3. Results
3.1. Data Collection and Processing
To determine the radiation damage of SeMet containing a Se atom with high-Z dependent on the X-ray dose, X-ray diffraction experiments were performed using recombinant SeMet-RmSBP crystals as model structure samples. SeMet-RmSBP crystals were rotated 360° on a goniometer in a cryogenic environment to collect the diffraction data. To investigate the radiation damage caused by X-ray exposure, the same crystal was exposed to X-rays an additional three times using the same method, and diffraction data were collected. The datasets for the crystal exposed to X-rays 1, 2, 3, and 4 times were named Dose I, II, III, and IV, respectively.
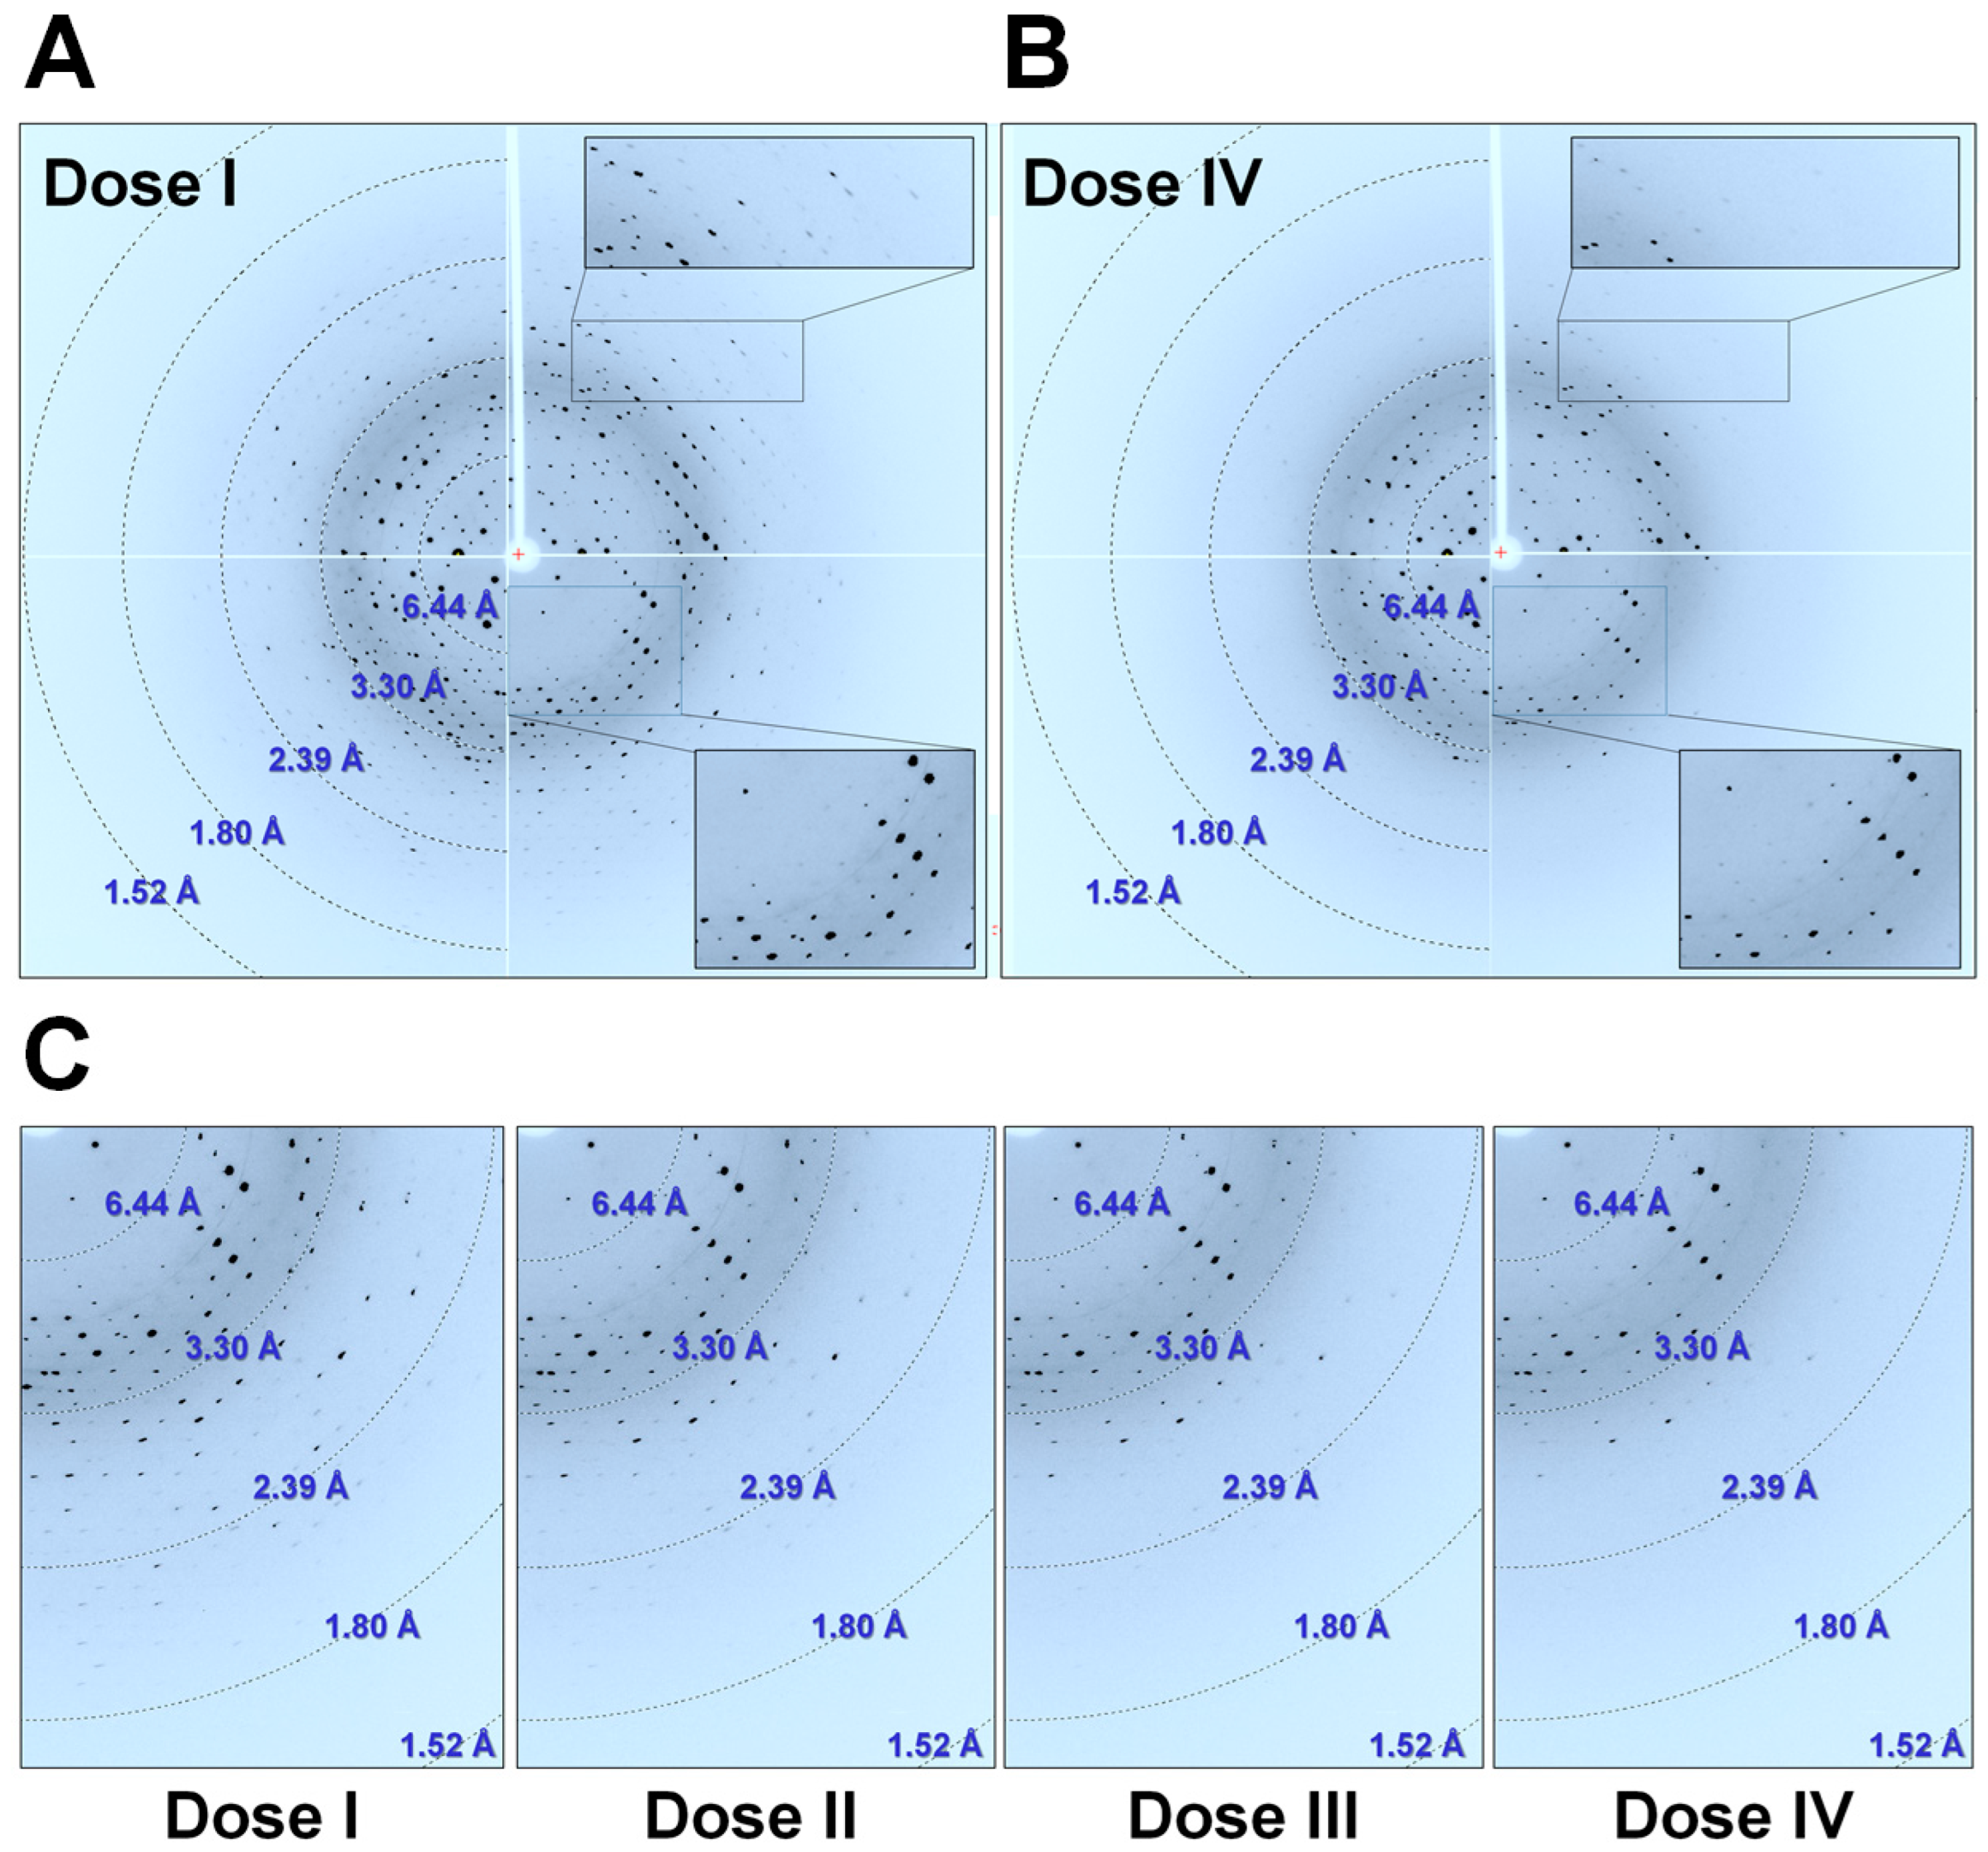
In all of the collected diffraction datasets, the beginning and end images of each set had weaker or missing signals compared to the other images. This was a technical problem that was caused by the X-ray shutter and detector not being accurately synchronized at the beamline. Accordingly, the data quality according to the X-ray accumulation was investigated only using 300 diffraction images (31–330°), thus excluding the intensities observed in the initial (1–30°) and later images (331–360°). In the initial diffraction image of Dose I, a Bragg peak was observed up to around 1.5 Å (Figure 1A). Meanwhile, in the later diffraction image in Dose IV, the Bragg peak was observed up to around 2.4 Å (Figure 1B). The diffraction data analysis revealed that as the crystals are exposed to X-rays, the Bragg peaks near the highest resolution visually decrease as the exposure continues (Figure 1C). In addition, as the X-ray dose increased, the intensity of the Bragg peak in low resolution also decreased. In low resolution, the low-intensity Bragg peak disappeared as the X-ray dose increased.
Meanwhile, the peak intensities in the diffraction images were relatively comparable; however, a direct comparison was not possible because the observed intensity varied depending on the contrast level of the image. Accordingly, data processing was performed to quantitatively demonstrate the radiation damage. To avoid bias in data processing, all diffraction data were automatically processed using the Xia2 program. The resolution cutoff for the diffraction data was applied based on the <I/sigma>, completeness, and CC1/2 of the highest resolution being >1.2, >90%, and >0.5, respectively.
The diffraction limits of the processed Doses I, II, III, and IV were 1.50, 1.58, 1.68, and 1.75 Å, respectively. All data belonged to the monoclinic C2 space group, containing two molecules in an asymmetric unit. Unlike the general increase in unit cell size as the crystal samples undergo global radiation damage [45], all SeMet-RmSBP datasets showed no trend toward an increase in the unit cell size with an increasing X-ray dose (Table 1). Meanwhile, the values of I/sigma, Rmerge, Rmease, and Rpim showed a tendency to decrease as the X-ray dose increased, indicating that radiation damage increases with the X-ray dose (Table 1).
On the other hand, since the diffraction limit is different for each of the four datasets (Doses I–IV), a direct comparison was not appropriate. Accordingly, the highest resolution of Doses I–IV was reprocessed as a set at 1.75 Å, and the values for the data collection and refinement statistics were compared for each dataset.
In the comparisons of the datasets (Doses I–IV), I/sigma showed an overall tendency to decrease as the X-ray dose increased (Figure 2A). Rmerge and Rpim of all the data were similar and near low resolution in the 30–2.6 Å range, but these values showed a gradual increasing trend within 2 Å, and the increase was greater as the dose amount increased (Figure 2B,C).
The CC1/2 data showed similar values from low resolution to around 2.2 Å, whereas the CC1/2 values within 2 Å decreased as the X-ray dose increased (Figure 2D). Considered together, for SeMet-RmSBP, X-ray exposure degrades the data quality and results in an overall decrease in I/sigma regardless of the resolution range. However, the quality of Rmerge, Rpim, and CC1/2 was shown to be significantly lower at a high resolution than at a low resolution.
Among the various data statistics, the Rmerge value is an indicator that is mainly used to determine radiation damage [46,47]. To compare the extent to which the Rmerge value differs depending on the X-ray dose amount in the datasets (Doses I–IV), the Rmerge and SmRmerge values for each image were analyzed (Figure 3). The result showed that the image numbers at approximately 31–80 showed similar Rmerge values regardless of the X-ray dose (Figure 3). In contrast, between the image numbers 90 and 250, the Rmerge value tended to increase as the X-ray dose increased (Figure 3). Even in the image numbers in the 250–330 range, there was a tendency for Rmerge and SmRmerge to increase depending on the X-ray dose; however, this increase was lower than that of image numbers 90–250 (Figure 3).
Meanwhile, around image number 120 of Dose III, the Rmerge and SmRmerge values showed a significant increase compared to the other datasets. As the same volume of crystals was repeatedly exposed to X-rays, this was considered to be due to a difference in the autoprocessing procedure. When the differences in some of these sections were excluded, the overall tendency of Rmerge and SmRmerge to increase was proportional to the X-ray dose. This indicates that differences in the increased Rmerge values may occur depending on the crystal volume exposed to X-rays. Therefore, this suggests that there is a specific section where radiation damage can occur, which is dependent on the location of the crystal exposed to X-rays.
3.2. Structure Determination
The crystal structures of SeMet-RmSBP were determined to identify the radiation damage caused to the RmSBP protein structure and the selenomethionine (Mse) residue. All crystal structures had two molecules in an asymmetric unit. Refinement was performed up to the diffraction limit resolution of each dataset and deposited in the PDB (Table S1). The Rwork/Rfree of Doses I, II, III, and IV were 21.95/24.67, 22.16/22.90, 21.76/25.65, and 22.33/27.03, respectively (Table S1).
The quality of the electron density map and B-factor value can vary depending on the resolution used for the structure refinement. Accordingly, all structures from Doses I–IV were refined with a resolution range of 35.0–1.75 Å (Table 2).
The electron density maps of all the datasets were of good quality and sufficient to construct the amino acids; however, the α3-helix region inherently exhibited a relatively low electron density map quality. The Rwork/Rfree of Doses I, II, III, and IV were 20.89/23.65, 21.21/24.98, 21.74/25.89, and 23.00/25.91, respectively (Table 2). This indicates that the Rwork and Rfree values tended to increase as the X-ray dose increased. The B-factors of the whole protein for Doses I, II, III, and IV were 24.30, 29.91, 20.84, and 31.93, which indicates that the B-factor increased as the X-ray dose increased. To avoid bias in the model building for the water molecules, water molecules were automatically added according to the default parameters during structure refinement in the PHENIX program. The model structures of Doses I, II, III, and IV contained 145, 107, 75, and 72 molecules, respectively (Table 2), which indicates that the electron density map of the water molecules was also affected by radiation damage. Meanwhile, in Doses I, II, and IV, the B-factor of the water molecules tended to increase as the X-ray dose increased, while Dose II showed a higher B-factor compared to the other datasets.
3.3. Analysis of Radiation Damage on SeMet-RmSBP
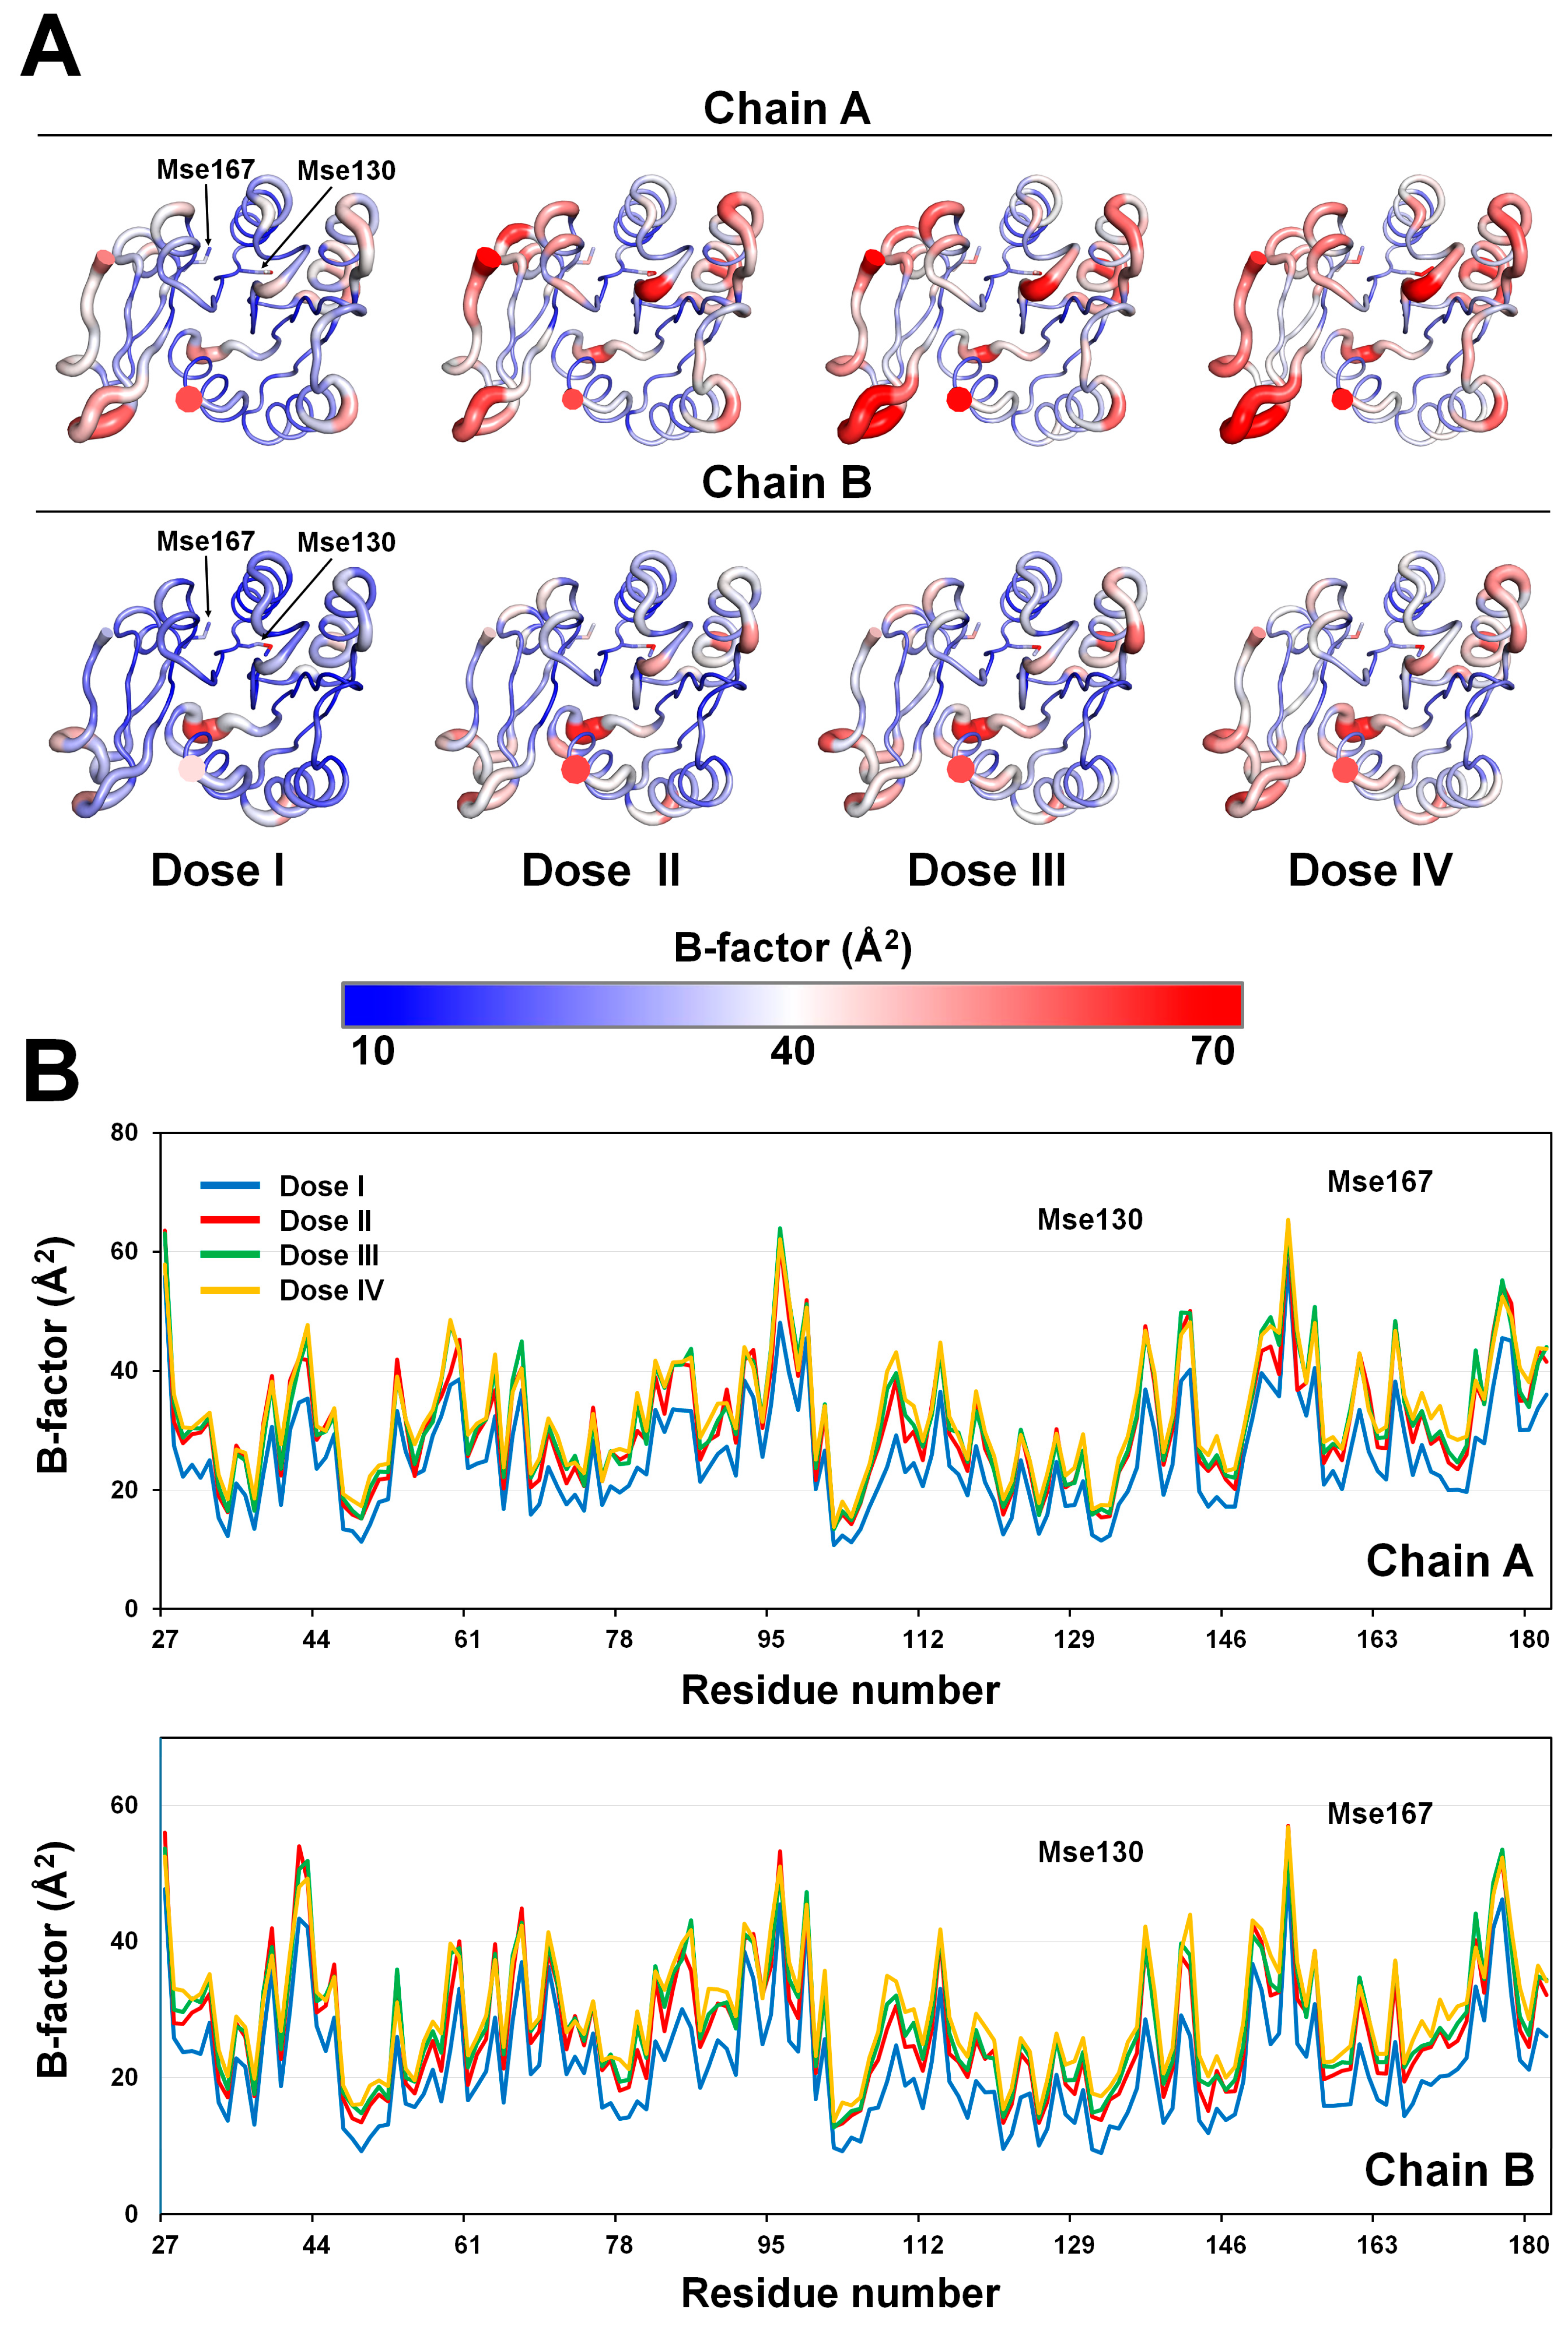
SeMet-RmSBP consists of a single-domain α/β fold (Figure 4A), which is identical to a previous report [38]. In the B-factor putty representation, the α3-helix, the loop between β4 and β5, and the C-terminal of SeMet-RmSBP showed relatively high flexibilities (Figure 4B), which is similar to the previously reported structural property of RmSBP [39]. Between the two molecules contained in the asymmetric unit, molecule A had a relatively higher B-factor value than molecule B. This is because molecule A was more exposed to the solvent in the crystal than molecule B. The B-factor putty representation indicates that the flexibility increased as the X-ray dose increased (Figure 4A). As the X-ray dose increased, the overall B-factor values increased and tended to increase at a constant overall rate rather than in specific areas (Figure 4B). Accordingly, in SeMet-RmSBP, the absolute B-factor was further increased in areas where the initial B-factor was high (Figure 4B).
High-Z atoms are more sensitive to radiation damage than low-Z atoms [48]. RmSBP consists of 184 amino acids, including 4 Met residues (Met1, Met130, Met167, and Met184). Met1 is within the signal peptide region but is not involved in the construction of the recombinant protein (Pro22–Asn185). Met184 is located at the C-terminal end of RmSBP, which was not observed in the electron density map because the C-terminal end of RmSBP is inherently disordered. Therefore, in the crystal structure of SeMet-RmSBP, the electron density map for the Mse residue can only be observed at the Met130 and Met167 residue positions. To confirm whether Met in the SeMet-RmSBP crystals was successfully substituted with SeMet, structure refinement was performed after model building with the Met residues at Met130 and Met167 in the Dose I dataset. Refinement results revealed that a positive Fo-Fc electron density map was obtained for the near S atom in both the Met130 and Met167 residues (Supplementary Figure S1). This result indicates that SeMet was substituted at the Met130 and Met167 residue positions because Mse has a higher electron density than Met residues.
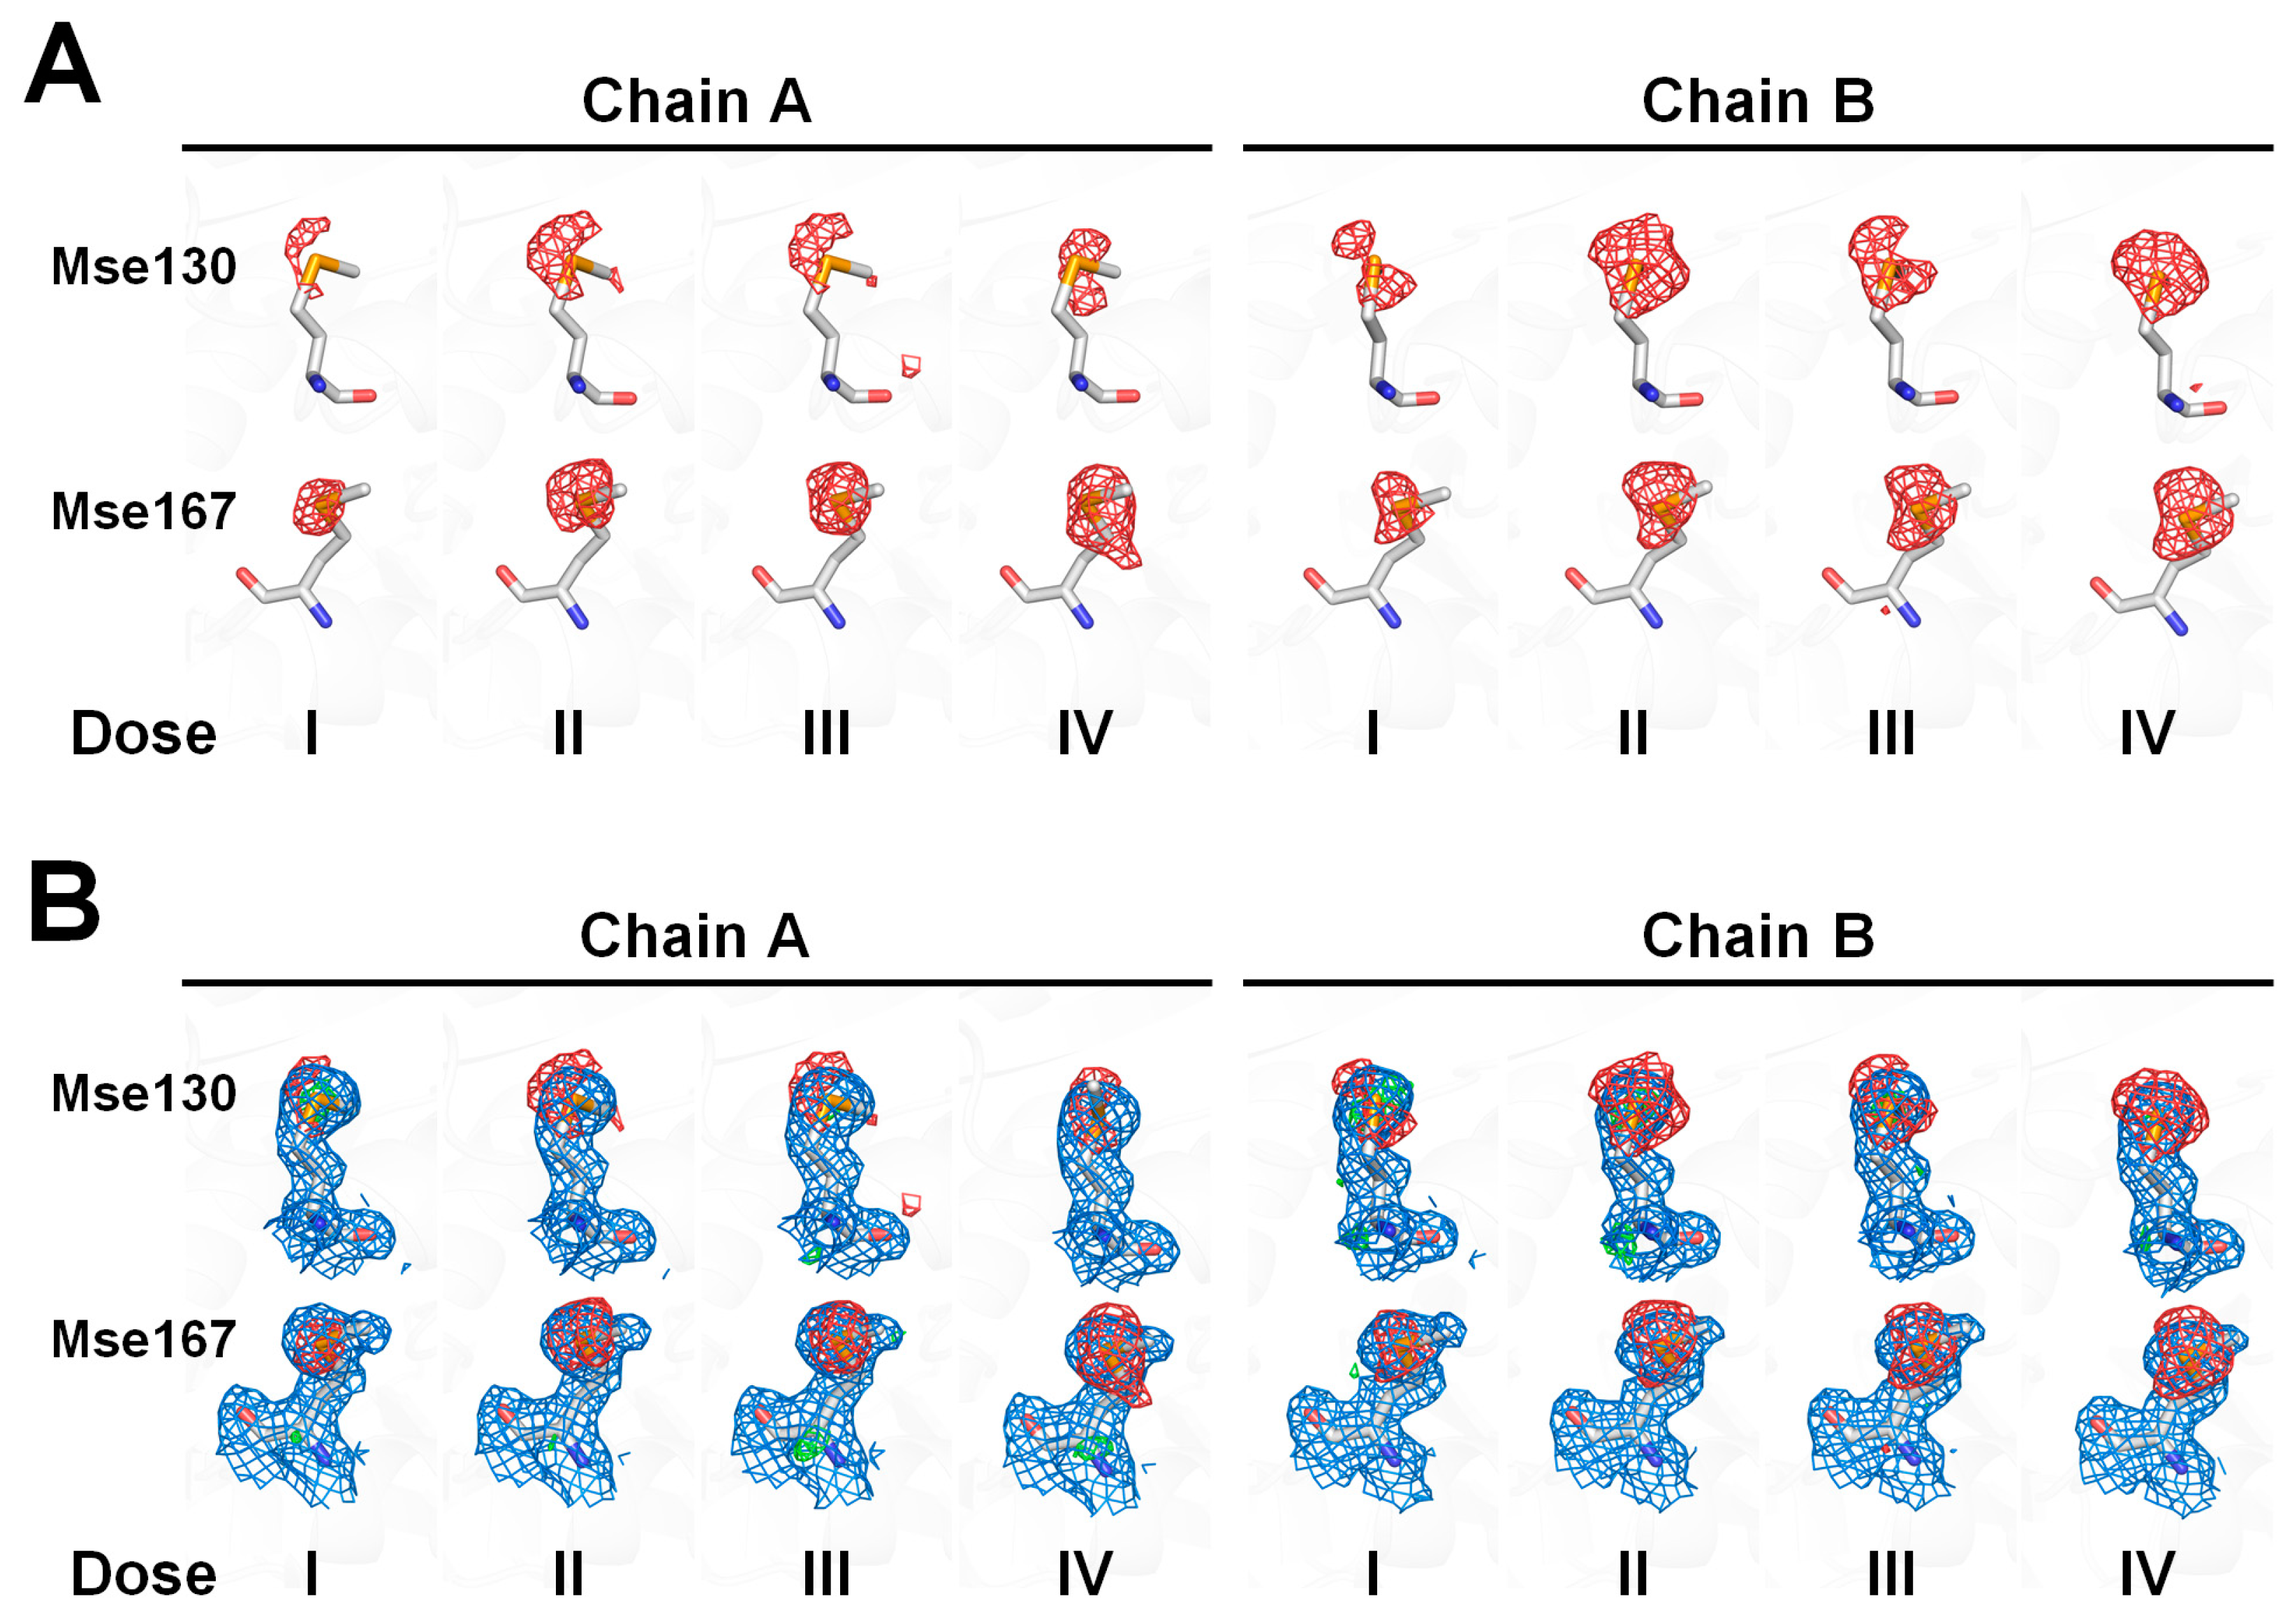
Next, structure refinement was performed after replacing the Met residues with Mse residues in the Dose I dataset. This result revealed that a partial negative Fo-Fc electron density map was observed at the Se atoms of Mse130 and Mse167 (Figure 5A). This indicates that in the SeMet-RmSBP, the built residue at Mse130 and Mse167 locations has a lower electron density than that of the electrons of native Mse. This includes the possibility that Mse is not completely substituted at the Met position of RmSBP during protein expression or the possibility that radiation damage had already occurred to SeMet in the early X-ray exposure stage. However, it is not possible to distinguish whether the cause of the negative electron density in Mse is due to occupancy or radiation damage. Therefore, the discussion presented in this study focuses on the trends in radiation damage due to X-ray dose accumulation from Doses I–IV. The electron density map of the CG-SE-CE region of the side chain of Mse130 shows a spherical shape and is assumed to potentially have multiple conformations. The electron density map of the side chain of Mse167 showed a distinct distribution for all the atoms, and Mse167 has only one side chain conformation.
In theory, as high-Z atoms are more sensitive to X-ray radiation damage, the induced radiation damage can be greater than that of other amino acids that consist of atoms which have relatively low-Z atoms [49]. The results of the electron density analysis indicated that as the X-ray dose increased, the negative Fo-Fc electron density map at the Se atoms of Mse130 and Mse167 increased (Figure 5A). In contrast, no negative Fo-Fc electron density map was found for the other atoms (C, N, and O) that comprised Mse130 and Mse167 as the X-ray dose increased (Figure 5B). In addition, no notable changes in quality were observed in all the atoms of the Fo-Fc electron density maps. This indicates that as the X-ray exposure increases, Se, which has more electrons in the Mse amino acid, suffers greater radiation damage than C, N, and O atoms, which have relatively fewer electrons.
The B-factor values of the atoms in the Mse130 and Mse167 residues were evaluated (Table 3 and Figure 6). The B-factor values of Mse130 and Mse167 showed a tendency to increase most with X-ray exposure. The average B-factor of the Se atom in the Mse130 residues of Doses I, II, III, and IV was 48.33, 55.84, 59.87, and 63.25 Å2, respectively, and the increase in the B-factor between Doses I and IV was 14.92 Å2. The average B-factor of the CG/CE atom in the Mse130 residues of Doses I, II, III, and IV was 23.39/30.04, 27.78/39.21, 27.28/35.45, and 31.84/40.26 Å2, respectively, and the increase in the B-factor between Doses I and IV was about 8.45/10.22 Å2. Accordingly, the B-factor increase in the Se atom as the dose increased was greater than that of the neighboring atoms. When calculating the ratio by dividing the B-factor of Dose IV by Dose I, the B-factor increasing rates of N, CA, C, O, CB, CG, SE, and CE atoms were approximately 1.57/1.50 (chain A/B), 1.62/1.60, 1.31/1.73, 1.37/1.55, 1.27/1.36, 1.36/1.41, 1.30/1.36, and 1.34/1.68. The absolute B-factor increase of the Se atom of the Mse130 residue was due to the increase in the X-ray dose and was higher than that of the other atoms; however, there was no significant difference in the B-factor increase rate.
The average B-factor of the Mse167 residues in Doses I, II, III, and IV was 26.50, 34.43, 37.98, and 41.94 Å2, respectively, and the B-factor increase between Doses I and IV was approximately 15.44. Å2. The average B-factor of the CG/CE atoms in the Mse167 residues of Doses I, II, III, and IV was 17.24/16.33, 22.96/23.01, 27.45/23.95, and 28.92/24.96 Å2, respectively, and the B-factor increased between Doses I and IV was approximately 11.67/8.63 Å2. When calculating the rate of change by dividing the B-factor of Dose IV by Dose I, the B-factor increase rates of N, CA, C, O, CB, CG, SE, and CE were approximately 1.33/1.40, 1.26/1.67, 1.48/1.52, 1.28/1.44, 1.55/1.58, 1.55/1.86, 1.52/1.64, and 1.57/1.49, respectively. As a result, like with the Mse130 residue, the absolute B-factor increase of the Se atoms in the Mse167 residue because of the increased X-ray dose was higher than that of the other atoms; however, there was no significant difference in the B-factor increase rate.
4. Discussion
Radiation damage is an inherent challenge of MX experiments. A variety of research studies are required to understand this phenomenon and develop data collection strategies that minimize radiation damage. Specifically, it is essential to explore the relationship between the crystal sample characteristics and the extent of radiation damage caused by X-ray exposure over time, specifically as it pertains to the data collection strategies. To advance our knowledge of radiation damage to SeMet, RmSBP crystals substituted with SeMet were used to investigate the phenomena caused by radiation damage via crystal images, electron density maps, and crystal structures following X-ray exposure.
In a general MX experiment, the global radiation damage increases the unit cell volume of the crystal [13,14], which is a good indicator for the estimation of radiation damage during data collection. However, in this study, although global radiation damage occurred in the SeMet-RmSBP crystals due to X-ray exposure, no significant change in the crystal unit cell volume was observed. This is a good experimental example in which the crystal unit cell volume does not increase even when global radiation damage occurs in the crystal. On the other hand, similar to the common radiation damage to crystal structures, the quality of the I/sigma, Rmerge, Rpim, and CC1/2 values of SeMet-RmSBP tended to significantly decrease with the increase in the X-ray dose. However, their figures showed a greater difference according to the X-ray dose near the high resolution than near the low resolution. This indicates that these figures can be utilized to clearly distinguish the near-high resolution when judging or comparing the radiation damage. Analysis of Rmerge and SmRmerge for the collected images showed that there was a significant change in the specific areas rather than an overall decrease in the quality that depended on X-ray exposure. This is considered to vary depending on the shape or area of the crystal exposed to the X-ray.
In the crystal structure of SeMet-RmSBP, the B-factor values tended to increase as the X-ray dose increased. The B-factor of the crystal structure generally increased in proportion to the X-ray dose rather than within a specific area, and no peak was observed in the B-factor plot that could be considered specific to radiation damage. This indicates that the values shown in the B-factor plot were difficult to distinguish because they were the average values of the amino acid atoms. Therefore, it is appropriate to compare the B-factors with atomic units when investigating the specific radiation damage.
In this study, the electron density according to the X-ray dose was analyzed through the SeMet-substituted crystal structure. It was confirmed that the negative Fo-Fc electron density map of the Se atom of the Mse130 and Mse167 residues increased as the X-ray dose increased. However, this was not found in the other O, N, and C atoms of the same amino acid. This is an experimental example showing that the high-Z atom is more sensitive to radiation damage than the other low-Z atoms. On the other hand, through the analysis of the B-factor, it was observed that the B-factor growth rate of each atom of Mse was similar in the datasets of Doses I and II; however, the B-factor increase of the Se atoms was higher than that of the other atoms in terms of the increasing absolute value of the B-factor. This indicates that radiation damage to the Se atom can reduce the quality of the results from the heavy atom evaluation in the experimental phasing of Se-SAD or Se-MAD due to the reduced electron density.
Meanwhile, in this study, a negative Fo-Fc electron density map was observed at the Se positions of the amino acids of the Mse130 and Mse167 residues from the Dose I dataset for the first X-ray exposure. This may be due to the incomplete substitution from the SeMet-RmSBP to Mse amino acids and may have already induced radiation damage with the initial X-ray exposure during the data collection of Dose I, which was not experimentally distinguished or demonstrated. To analyze the radiation damage of the SeMet-substituted proteins more accurately in the future, the following approaches may be considered. First, it will be important to use E. coli B834 (DE3) strains to increase SeMet absorption during protein expression. This strain is a Met auxotroph and allows for high-specific-activity labeling of target proteins with SeMet [50]. Second, Se may be sensitive to X-ray radiation damage. There is a need for a method to collect and compare data by accumulating additional data, which can begin by providing a very low photon flux using an attenuator, etc. These results will enhance our understanding of the radiation damage in SeMet-containing proteins and provide insights into the optimal data collection strategies to address the experimental phase problems using the Se-SAD or Se-MAD techniques.
In this experiment, the tendency of SeMet to undergo radiation damage was investigated using a single SeMet-substituted RmSBP crystal. To draw more generalizable conclusions, future research should involve obtaining statistical values of radiation damage data from multiple SeMet-substituted protein crystals.
On the other hand, radiation damage occurring in SeMet-substituted protein crystals may exhibit different tendencies compared to the radiation damage observed in SeMet-RmSBP, depending on the quality of the crystal used and the properties of X-rays (i.e., beam size, photon flux, energy, etc.). Specifically, the X-ray dose exposed to SeMet-substituted protein crystals varies depending on the properties of X-rays, such as beam size and photon flux. Therefore, the tendency and impact of radiation damage may vary. Consequently, in order to collect Se-SAD or Se-MAD data while minimizing radiation damage, it is important to establish a data collection strategy by conducting radiation damage studies on SeMet-substituted protein crystals in accordance with the X-ray characteristics at the beamline.
5. Conclusions
This study examined both global and specific radiation damage to SeMet-RmSBP crystals and analyzed the experimental radiation damage data for SeMet residues. As X-ray exposure increased, the absolute B-factor value of the Se atom in SeMet exhibited a significantly larger increase compared to other atoms, indicating that Se is more susceptible to radiation damage than them. These findings contribute to broadening our understanding of radiation damage in macromolecular crystallography.
Supplementary Materials
The following supporting information can be downloaded at: https://www.mdpi.com/article/10.3390/cryst13121620/s1, Figure S1: Validation of selenomethionine substitution in SeMEt-RmSBP; Table S1. Structure refinement statistics.
Funding
This work was funded by the National Research Foundation of Korea (NRF) (NRF-2017M3A9F6029736 and NRF-2021R1I1A1A01050838) and the Korea Initiative for Fostering University of Research and Innovation (KIURI) Program of the NRF (NRF-2020M3H1A1075314). This study was supported by ProGen.
Institutional Review Board Statement
Not applicable.
Informed Consent Statement
Not applicable.
Data Availability Statement
The structure factors and coordinates were deposited in the Protein Data Bank under the accession codes 8WXM (Dose I), 8WXN (Dose II), 8WXO (Dose III), and 8WXP (Dose IV).
Acknowledgments
I would like to thank the beamline staff at the 7A beamline, Pohang Accelerator Laboratory, for their assistance with the collection of data.
Conflicts of Interest
The author declares no conflict of interest.
References
- McPherson, A.; Gavira, J.A. Introduction to protein crystallization. Acta Crystallogr. F Struct. Biol. Commun. 2013, 70, 2–20. [Google Scholar] [CrossRef] [PubMed]
- Wlodawer, A.; Minor, W.; Dauter, Z.; Jaskolski, M. Protein crystallography for aspiring crystallographers or how to avoid pitfalls and traps in macromolecular structure determination. FEBS J. 2013, 280, 5705–5736. [Google Scholar] [CrossRef] [PubMed]
- Nam, K.H. Crystal structure of human brain-type fatty acid-binding protein FABP7 complexed with palmitic acid. Acta Crystallogr. D Struct. Biol. 2021, 77, 954–965. [Google Scholar] [CrossRef] [PubMed]
- Nam, K.H. Structural analysis of metal chelation of the metalloproteinase thermolysin by 1,10-phenanthroline. J. Inorg. Biochem. 2021, 215, 111319. [Google Scholar] [CrossRef]
- Kim, I.J.; Kim, S.R.; Kim, K.H.; Bornscheuer, U.T.; Nam, K.H. Characterization and structural analysis of the endo-1,4-β-xylanase GH11 from the hemicellulose-degrading Thermoanaerobacterium saccharolyticum useful for lignocellulose saccharification. Sci. Rep. 2023, 13, 17332. [Google Scholar] [CrossRef] [PubMed]
- Xu, Y.; Nam, K.H. Xylitol binding to the M1 site of glucose isomerase induces a conformational change in the substrate binding channel. Biochem. Biophys. Res. Commun. 2023, 682, 21–26. [Google Scholar] [CrossRef] [PubMed]
- Zheng, H.; Hou, J.; Zimmerman, M.D.; Wlodawer, A.; Minor, W. The future of crystallography in drug discovery. Expert Opin. Drug Discov. 2013, 9, 125–137. [Google Scholar] [CrossRef]
- Hogg, T.; Hilgenfeld, R. Protein Crystallography in Drug Discovery. In Comprehensive Medicinal Chemistry II; Elsevier: Amsterdam, The Netherlands, 2007; pp. 875–900. [Google Scholar]
- Paiardini, A. Protein Structure Prediction in Drug Discovery. Biomolecules 2023, 13, 1258. [Google Scholar] [CrossRef]
- Kim, I.J.; Kim, S.R.; Bornscheuer, U.T.; Nam, K.H. Engineering of GH11 Xylanases for Optimal pH Shifting for Industrial Applications. Catalysts 2023, 13, 1405. [Google Scholar] [CrossRef]
- Shelley, K.L.; Garman, E.F. Quantifying and comparing radiation damage in the Protein Data Bank. Nat. Commun. 2022, 13, 1314. [Google Scholar] [CrossRef]
- Taberman, H. Radiation Damage in Macromolecular Crystallography—An Experimentalist’s View. Crystals 2018, 8, 157. [Google Scholar] [CrossRef]
- Ravelli, R.B.G.; McSweeney, S.M. The ‘fingerprint’ that X-rays can leave on structures. Structure 2000, 8, 315–328. [Google Scholar] [CrossRef] [PubMed]
- Murray, J.; Garman, E. Investigation of possible free-radical scavengers and metrics for radiation damage in protein cryocrystallography. J. Synchrotron Radiat. 2002, 9, 347–354. [Google Scholar] [CrossRef] [PubMed]
- Carugo, O.; Carugo, K.D. When X-rays modify the protein structure: Radiation damage at work. Trends Biochem. Sci. 2005, 30, 213–219. [Google Scholar] [CrossRef] [PubMed]
- Weiss, M.S.; Panjikar, S.; Mueller-Dieckmann, C.; Tucker, P.A. On the influence of the incident photon energy on the radiation damage in crystalline biological samples. J. Synchrotron Radiat. 2005, 12, 304–309. [Google Scholar] [CrossRef] [PubMed]
- Corbett, M.C.; Latimer, M.J.; Poulos, T.L.; Sevrioukova, I.F.; Hodgson, K.O.; Hedman, B. Photoreduction of the active site of the metalloprotein putidaredoxin by synchrotron radiation. Acta Crystallogr. D Biol. 2007, 63, 951–960. [Google Scholar] [CrossRef] [PubMed]
- Garman, E.F. Radiation damage in macromolecular crystallography: What is it and why should we care? Acta Crystallogr. D Biol. 2010, 66, 339–351. [Google Scholar] [CrossRef] [PubMed]
- Burmeister, W.P. Structural changes in a cryo-cooled protein crystal owing to radiation damage. Acta Crystallogr. D Biol. 2000, 56, 328–341. [Google Scholar] [CrossRef]
- McCoy, A.J.; Read, R.J. Experimental phasing: Best practice and pitfalls. Acta Crystallogr. D Biol. 2010, 66, 458–469. [Google Scholar] [CrossRef]
- Schmidt, M.; Šrajer, V.; Purwar, N.; Tripathi, S. The kinetic dose limit in room-temperature time-resolved macromolecular crystallography. J. Synchrotron Radiat. 2012, 19, 264–273. [Google Scholar] [CrossRef]
- Matsui, Y.; Sakai, K.; Murakami, M.; Shiro, Y.; Adachi, S.-I.; Okumura, H.; Kouyama, T. Specific Damage Induced by X-ray Radiation and Structural Changes in the Primary Photoreaction of Bacteriorhodopsin. J. Mol. Biol. 2002, 324, 469–481. [Google Scholar] [CrossRef]
- Kmetko, J.; Husseini, N.S.; Naides, M.; Kalinin, Y.; Thorne, R.E. Quantifying X-ray radiation damage in protein crystals at cryogenic temperatures. Acta Crystallogr. D Biol. 2006, 62, 1030–1038. [Google Scholar] [CrossRef] [PubMed]
- Nam, K.H. Radiation Damage on Thaumatin: A Case Study of Crystals That Are Larger Than the Microfocusing X-ray Beam. Appl. Sci. 2023, 13, 1876. [Google Scholar] [CrossRef]
- Schulze-Briese, C.; Wagner, A.; Tomizaki, T.; Oetiker, M. Beam-size effects in radiation damage in insulin and thaumatin crystals. J. Synchrotron Radiat. 2005, 12, 261–267. [Google Scholar] [CrossRef] [PubMed]
- Russi, S.; González, A.; Kenner, L.R.; Keedy, D.A.; Fraser, J.S.; van den Bedem, H. Conformational variation of proteins at room temperature is not dominated by radiation damage. J. Synchrotron Radiat. 2017, 24, 73–82. [Google Scholar] [CrossRef] [PubMed]
- Weik, M.; Ravelli, R.B.; Kryger, G.; McSweeney, S.; Raves, M.L.; Harel, M.; Gros, P.; Silman, I.; Kroon, J.; Sussman, J.L. Specific chemical and structural damage to proteins produced by synchrotron radiation. Proc. Natl. Acad. Sci. USA 2000, 97, 623–628. [Google Scholar] [CrossRef]
- Rayman, M.P. Selenium and human health. Lancet 2012, 379, 1256–1268. [Google Scholar] [CrossRef] [PubMed]
- Gandin, V.; Khalkar, P.; Braude, J.; Fernandes, A.P. Organic selenium compounds as potential chemotherapeutic agents for improved cancer treatment. Free Radic. Biol. Med. 2018, 127, 80–97. [Google Scholar] [CrossRef]
- Whanger, P.D. Selenocompounds in Plants and Animals and their Biological Significance. J. Am. Coll. Nutr. 2002, 21, 223–232. [Google Scholar] [CrossRef]
- Possee, R.D. Baculoviruses as expression vectors. Curr. Opin. Biotechnol. 1997, 8, 569–572. [Google Scholar] [CrossRef]
- Hendrickson, W.A.; Horton, J.R.; LeMaster, D.M. Selenomethionyl proteins produced for analysis by multiwavelength anomalous diffraction (MAD): A vehicle for direct determination of three-dimensional structure. EMBO J. 1990, 9, 1665–1672. [Google Scholar] [CrossRef]
- Doublié, S. [29] Preparation of selenomethionyl proteins for phase determination. In Methods in Enzymology; Macromolecular Crystallography Part A; Elsevier: Amsterdam, The Netherlands, 1997; pp. 523–530. [Google Scholar]
- Naumann, T.A.; Sollenberger, K.G.; Hao, G. Production of selenomethionine labeled polyglycine hydrolases in Pichia pastoris. Protein Expr. Purif. 2022, 194, 106076. [Google Scholar] [CrossRef]
- Bellizzi, J.J.; Widom, J.; Kemp, C.W.; Clardy, J. Producing selenomethionine-labeled proteins with a baculovirus expression vector system. Structure 1999, 7, R263–R267. [Google Scholar] [CrossRef] [PubMed]
- Rice, L.M.; Earnest, T.N.; Brunger, A.T. Single-wavelength anomalous diffraction phasing revisited. Acta Crystallogr. D Biol. 2000, 56, 1413–1420. [Google Scholar] [CrossRef] [PubMed]
- Rose, J.P.; Wang, B.-C. SAD phasing: History, current impact and future opportunities. Arch. Biochem. Biophys. 2016, 602, 80–94. [Google Scholar] [CrossRef] [PubMed]
- Bae, J.E.; Kim, I.J.; Kim, K.J.; Nam, K.H. Crystal structure of a substrate-binding protein from Rhodothermus marinus reveals a single alpha/beta-domain. Biochem. Biophys. Res. Commun. 2018, 497, 368–373. [Google Scholar] [CrossRef] [PubMed]
- Bae, J.E.; Kim, I.J.; Xu, Y.; Nam, K.H. Structural Flexibility of Peripheral Loops and Extended C-terminal Domain of Short Length Substrate Binding Protein from Rhodothermus marinus. Protein J. 2021, 40, 184–191. [Google Scholar] [CrossRef] [PubMed]
- Winter, G. xia2: An expert system for macromolecular crystallography data reduction. J. Appl. Crystallogr. 2009, 43, 186–190. [Google Scholar] [CrossRef]
- Vagin, A.; Teplyakov, A. Molecular replacement with MOLREP. Acta Crystallogr. D Biol. Crystallogr. 2010, 66, 22–25. [Google Scholar] [CrossRef] [PubMed]
- Emsley, P.; Cowtan, K. Coot: Model-building tools for molecular graphics. Acta Crystallogr. D Biol. Crystallogr. 2004, D60, 2126–2132. [Google Scholar] [CrossRef]
- Liebschner, D.; Afonine, P.V.; Baker, M.L.; Bunkoczi, G.; Chen, V.B.; Croll, T.I.; Hintze, B.; Hung, L.W.; Jain, S.; McCoy, A.J.; et al. Macromolecular structure determination using X-rays, neutrons and electrons: Recent developments in Phenix. Acta Crystallogr. D Struct. Biol. 2019, 75, 861–877. [Google Scholar] [CrossRef]
- Williams, C.J.; Headd, J.J.; Moriarty, N.W.; Prisant, M.G.; Videau, L.L.; Deis, L.N.; Verma, V.; Keedy, D.A.; Hintze, B.J.; Chen, V.B.; et al. MolProbity: More and better reference data for improved all-atom structure validation. Protein Sci. 2018, 27, 293–315. [Google Scholar] [CrossRef] [PubMed]
- Ravelli, R.B.G.; Theveneau, P.; McSweeney, S.; Caffrey, M. Unit-cell volume change as a metric of radiation damage in crystals of macromolecules. J. Synchrotron Radiat. 2002, 9, 355–360. [Google Scholar] [CrossRef] [PubMed]
- Sliz, P.; Harrison, S.C.; Rosenbaum, G. How does Radiation Damage in Protein Crystals Depend on X-Ray Dose? Structure 2003, 11, 13–19. [Google Scholar] [CrossRef] [PubMed]
- Christensen, J.; Horton, P.N.; Bury, C.S.; Dickerson, J.L.; Taberman, H.; Garman, E.F.; Coles, S.J. Radiation damage in small-molecule crystallography: Fact not fiction. IUCrJ 2019, 6, 703–713. [Google Scholar] [CrossRef] [PubMed]
- Gopakumar, G.; Unger, I.; Slavíček, P.; Hergenhahn, U.; Öhrwall, G.; Malerz, S.; Céolin, D.; Trinter, F.; Winter, B.; Wilkinson, I.; et al. Radiation damage by extensive local water ionization from two-step electron-transfer-mediated decay of solvated ions. Nat. Chem. 2023, 15, 1408–1414. [Google Scholar] [CrossRef] [PubMed]
- Neufeld, M.J.; Lutzke, A.; Pratx, G.; Sun, C. High-Z Metal–Organic Frameworks for X-ray Radiation-Based Cancer Theranostics. Chem. Eur. J. 2020, 27, 3229–3237. [Google Scholar] [CrossRef] [PubMed]
- Guerrero, S.A.; Hecht, H.J.; Hofmann, B.; Biebl, H.; Singh, M. Production of selenomethionine-labelled proteins using simplified culture conditions and generally applicable host/vector systems. Appl. Microbiol. Biotechnol. 2001, 56, 718–723. [Google Scholar] [CrossRef] [PubMed]
Figure 1.
Diffraction images of selenomethionine (SeMet)-substituted Rhodothermus marinus substrate-binding protein (RmSBP) crystal. Diffraction image of SeMet-RmSBP for (A) Dose I (oscillation angle 120°) and (B) Dose II (120°). (C) Magnified view of the diffraction pattern of SeMet-RmSBP in Dose I, II, III, and IV at a 120°oscillation angle.

Figure 2.
Analysis of the selenomethionine-substituted Rhodothermus marinus substrate-binding protein (SeMet-RmSBP) dataset depending on the X-ray dose. Plot of the (A) I/sigma, (B) Rmerge, (C) Rpim, and (D) CC1/2 values of SeMet-RmSBP for the datasets (Doses I–IV).
Figure 2.
Analysis of the selenomethionine-substituted Rhodothermus marinus substrate-binding protein (SeMet-RmSBP) dataset depending on the X-ray dose. Plot of the (A) I/sigma, (B) Rmerge, (C) Rpim, and (D) CC1/2 values of SeMet-RmSBP for the datasets (Doses I–IV).

Figure 3.
Analysis of the diffraction images of the selenomethionine-substituted Rhodothermus marinus substrate-binding protein (SeMet-RmSBP) datasets. Profile of the (A) Rmerge and (B) SmRmerge values of SeMet-RmSBP for the datasets (Doses I–IV).
Figure 3.
Analysis of the diffraction images of the selenomethionine-substituted Rhodothermus marinus substrate-binding protein (SeMet-RmSBP) datasets. Profile of the (A) Rmerge and (B) SmRmerge values of SeMet-RmSBP for the datasets (Doses I–IV).

Figure 4.
Analysis of the temperature factor of selenomethionine-substituted Rhodothermus marinus substrate-binding protein (SeMet-RmSBP) dependent on the X-ray dose. (A) B-factor putty representation of SeMet-RmSBPs from the datasets (Doses I, II, III, and IV). (B) Profile of B-factors of SeMet-RmSBPs from the datasets (Doses I, II, III, and IV).

Figure 5.
Analysis of the electron density map of selenomethionine (SeMet) residue in selenomethionine-substituted Rhodothermus marinus substrate-binding protein (SeMet-RmSBP) dependent on the X-ray dose. (A) mFo–DFc (green mesh, 3σ; red mesh, −3σ) electron density map of the Mse130 and Mse167 resides in the SeMet-RmSBP from the datasets (Doses I–IV). (B) 2mFo-DFc (marine mesh, 1σ) and mFo–DFc (green mesh, 3σ; red mesh, −3σ) electron density map of the Mse130 and Mse167 resides in the SeMet-RmSBP from the datasets (Doses I–IV).

Figure 6.
B-factor analysis of the atoms in the Mse130 and Mse167 residues of selenomethionine-substituted Rhodothermus marinus substrate-binding protein (SeMet-RmSBP) for the (A) chain A and (B) chain B from the datasets (Doses I–IV). The number above the bar is the ratio of the B-factor of Dose IV divided by that of Dose I.


Table 1.
Data collection statistics.
| Data Collection | Dose I | Dose II | Dose III | Dose IV |
|---|---|---|---|---|
| X-ray source | Beamline 7A, PLS-II | Beamline 7A, PLS-II | Beamline 7A, PLS-II | Beamline 7A, PLS-II |
| X-ray exposure (s/°) | 1 | 1 | 1 | 1 |
| Total images | 300 | 300 | 300 | 300 |
| Space group | C2 | C2 | C2 | C2 |
| Cell dimension | ||||
| a, b, c | 63.55, 64.16, 69.86 | 63.73, 64.14, 69.76 | 63.57, 64.08, 69.61 | 63.49, 64.06, 69.54 |
| α, β, γ | 90.00, 96.06, 90.00 | 90.00, 96.10, 90.00 | 90.00, 96.13, 90.00 | 90.00, 96.16, 90.00 |
| Resolution (Å) | 39.09–1.50 (1.55–1.50) | 36.56–1.58 (1.64–1.58) | 39.09–1.68 (1.74–1.68) | 39.06–1.75 (1.81–1.75) |
| Number of reflections | 252,990 (18,059) | 227,674 (22,949) | 189,080 (19,148) | 167,204 (16,932) |
| Unique reflections | 43,941 (4052) | 38,227 (3822) | 31,655 (3159) | 27,946 (2791) |
| Completeness (%) | 98.8 (91.6) | 99.75 (100.00) | 99.79 (100.00) | 99.77 (99.96) |
| Redundancy | 5.8 (4.5) | 6.0 (6.0) | 6.0 (6.1) | 6.0 (6.1) |
| <I/sigma> | 7.7 (1.4) | 7.0 (1.3) | 6.4 (1.2) | 5.9 (1.2) |
| R-merge | 0.104 (1.034) | 0.109 (1.304) | 0.123 (1.560) | 0.136 (1.841) |
| R-meas | 0.114 (1.179) | 0.120 (1.434) | 0.135 (1.714) | 0.149 (2.023) |
| R-pim | 0.048 (0.555) | 0.049 (0.590) | 0.056 (0.703) | 0.062 (0.831) |
| CC1/2 | 0.997 (0.587) | 0.997 (0.656) | 0.996 (0.608) | 0.997 (0.547) |
| Wilson B-factor (Å2) | 17.68 | 20.48 | 22.31 | 23.47 |
Values for the outer shell are given in parentheses.
Table 2.
Structure refinement statistics.
| Refinement | Dose I | Dose II | Dose III | Dose IV |
|---|---|---|---|---|
| Resolution (Å) | 34.66–1.75 | 34.74–1.75 | 34.68–1.75 | 34.67–1.75 |
| Rwork a | 20.89 | 21.21 | 21.74 | 23.00 |
| Rfree b | 23.65 | 24.98 | 25.89 | 25.91 |
| No. of non-H atoms | ||||
| Protein | 2433 | 2433 | 2433 | 2433 |
| Water | 145 | 107 | 75 | 72 |
| R.m.s.deviation | ||||
| Bonds (Å) | 0.008 | 0.023 | 0.008 | 0.007 |
| Angles (°) | 0.961 | 1.489 | 0.948 | 0.957 |
| Average B-factors (Å2) | ||||
| Protein | 24.30 | 29.91 | 30.84 | 31.93 |
| Water | 33.09 | 39.16 | 36.55 | 38.01 |
| SeMet | 19.55 | 24.80 | 26.20 | 28.17 |
| Ramachandran plot | ||||
| Favored (%) | 97.73 | 97.73 | 98.38 | 98.05 |
| Allowed (%) | 2.27 | 2.27 | 1.62 | 1.95 |
Values for the outer shell are given in parentheses. a Rwork = Σ||Fobs| Σ |Fcalc||/Σ|Fobs|, where Fobs and Fcalc are the observed and calculated structure factor amplitudes, respectively. b Rfree was calculated as Rwork using a randomly selected subset (7.14%) of unique reflections not used for structural refinement.
Table 3.
B-factor of atoms in the Mse130 and Mse167 residues.
| Chain A (Å2) | ||||||||
| Mse130 | Mse167 | |||||||
| Atom | Dose I | Dose II | Dose III | Dose IV | Dose I | Dose II | Dose III | Dose IV |
| N | 11.79 | 15.42 | 14.85 | 18.57 | 24.54 | 28.04 | 31.76 | 32.66 |
| CA | 13.13 | 18.00 | 17.81 | 21.38 | 16.92 | 20.82 | 21.17 | 21.38 |
| C | 13.15 | 16.85 | 16.88 | 17.27 | 28.29 | 35.46 | 33.75 | 41.99 |
| O | 15.07 | 18.79 | 19.86 | 20.68 | 25.23 | 30.56 | 30.06 | 32.37 |
| CB | 17.01 | 19.82 | 21.00 | 21.63 | 20.77 | 28.17 | 32.34 | 32.39 |
| CG | 23.39 | 27.78 | 27.28 | 31.84 | 20.97 | 26.70 | 34.42 | 32.66 |
| SE | 48.33 | 55.84 | 59.87 | 63.25 | 28.16 | 35.84 | 39.08 | 43.03 |
| CE | 30.04 | 39.21 | 35.45 | 40.26 | 15.50 | 22.78 | 24.19 | 24.36 |
| Chain B (Å2) | ||||||||
| Mse130 | Mse167 | |||||||
| Atom | Dose I | Dose II | Dose III | Dose IV | Dose I | Dose II | Dose III | Dose IV |
| N | 12.12 | 15.33 | 13.97 | 18.23 | 13.28 | 17.31 | 19.23 | 18.69 |
| CA | 11.69 | 17.27 | 14.67 | 18.75 | 12.17 | 19.19 | 20.34 | 20.39 |
| C | 9.56 | 12.71 | 14.47 | 16.54 | 14.41 | 17.09 | 20.61 | 21.91 |
| O | 13.25 | 17.22 | 18.9 | 20.54 | 20.79 | 25.66 | 28.27 | 30.08 |
| CB | 15.12 | 18.00 | 19.62 | 20.63 | 12.93 | 18.73 | 19.05 | 20.45 |
| CG | 21.73 | 27.89 | 25.22 | 30.81 | 13.52 | 19.23 | 20.49 | 25.18 |
| SE | 49.29 | 55.25 | 57.98 | 67.25 | 24.85 | 33.03 | 36.88 | 40.85 |
| CE | 12.01 | 22.21 | 25.25 | 20.19 | 17.16 | 23.24 | 23.71 | 25.57 |
Disclaimer/Publisher’s Note: The statements, opinions and data contained in all publications are solely those of the individual author(s) and contributor(s) and not of MDPI and/or the editor(s). MDPI and/or the editor(s) disclaim responsibility for any injury to people or property resulting from any ideas, methods, instructions or products referred to in the content. |
© 2023 by the author. Licensee MDPI, Basel, Switzerland. This article is an open access article distributed under the terms and conditions of the Creative Commons Attribution (CC BY) license (https://creativecommons.org/licenses/by/4.0/).
Share and Cite
MDPI and ACS Style
Nam, K.H. Radiation Damage on Selenomethionine-Substituted Single-Domain Substrate-Binding Protein. Crystals 2023, 13, 1620. https://doi.org/10.3390/cryst13121620
AMA Style
Nam KH. Radiation Damage on Selenomethionine-Substituted Single-Domain Substrate-Binding Protein. Crystals. 2023; 13(12):1620. https://doi.org/10.3390/cryst13121620
Chicago/Turabian StyleNam, Ki Hyun. 2023. "Radiation Damage on Selenomethionine-Substituted Single-Domain Substrate-Binding Protein" Crystals 13, no. 12: 1620. https://doi.org/10.3390/cryst13121620
Note that from the first issue of 2016, this journal uses article numbers instead of page numbers. See further details here.