Article

Carbonate Minerals’ Precipitation in the Presence of Background Electrolytes: Sr, Cs, and Li with Different Transporting Anions

by
Pedro Marin-Troya
1,
Carlos Espinosa
1,
Luis Monasterio-Guillot
1,2,* and
Pedro Alvarez-Lloret
1,3,*
1
Department of Mineralogy and Petrology, University of Granada, 18071 Granada, Spain
2
Institut des Sciences de la Terre (ISTerre), University of Grenoble Alpes, 38000 Grenoble, France
3
Department of Geology, University of Oviedo, 33005 Oviedo, Spain
*
Authors to whom correspondence should be addressed.
Crystals 2023, 13(5), 796; https://doi.org/10.3390/cryst13050796
Submission received: 18 April 2023 / Revised: 5 May 2023 / Accepted: 8 May 2023 / Published: 10 May 2023
(This article belongs to the Special Issue Mineralogical Crystallography (3rd Edition))

Abstract

:
Carbonate minerals are largely associated with many geological and biological environments as well as several industrial and technological processes. The crystalline characteristics of these mineral phases can be modified by background salts present in the solution due to the effect of different electrolytes on the dynamics of ion-water interactions and ionic strength during precipitation. In the current research, we studied the effect of the presence of several electrolytes (i.e., Cs, Li, and Sr), combined with chloride and carbonate as transporting anions, on the growth and mineral evolution processes of carbonate precipitation in solution. The electrolyte composition during the reaction (experimental times from 24 h up to 30 days) determined the formation of specific calcium carbonate polymorphs. The Li presence induced the formation of vaterite which was progressively transformed into calcite during the reaction time, while Cs stabilized the calcite formation. The Sr presence in the system caused the precipitation of strontianite with modifications in its cell parameters and the structural arrangement of the carbonate molecular group. During the mineral evolution considering chloride and carbonate experimental set-ups, several compositional and cell parameters/crystallinity variations of the carbonated phases were also observed. A better understanding of the relationship between the compositional properties of the aqueous solvent and the crystallization mechanisms can contribute to a deeper comprehension of the mineral precipitation and transformation in different multicomponent solutions that occur in natural environments and in controlled synthesis processes.

1. Introduction

There are three crystalline anhydrous calcium carbonate (CaCO3) polymorphs; aragonite, calcite and vaterite. Aragonite and calcite are the most stable structures from the thermodynamic point of view and are also more frequent carbonate phases in nature. These polymorphs are common in surface and subsurface environments [1], and as the main mineral component of several biominerals (e.g., mollusk shells) [2]. Vaterite is a much less stable phase, occurring as a transitional intermediate between an amorphous calcium carbonate (ACC) and calcite phase [3]. In nature, vaterite occurrences are largely associated with biominerals and several organo-mineral formations [4,5] as well as more rarely in other geological environments [6,7]. The precipitation processes of these carbonate phases have been extensively studied due to their key role in the carbon cycle and, therefore, controlling global warming on Earth [8], their influence during biological mineralization [9,10] and their importance in numerous industrial processes, for example, in cement clinker production [11,12].
The nucleation and growth of the different calcium carbonate polymorphs can be manipulated during the crystallization process by including, for example, biopolymers, macromolecules and/or other inorganic salts [13,14]. It has been demonstrated that some ions (e.g., V, Se, As, Cs) play a key role during CaCO3 precipitation in aqueous reactions, being able to modify the resultant product by affecting the nucleation kinetics, crystal growth or even stabilize metastable phases [15,16]. The presence of background electrolytes can affect nucleation kinetics, crystal growth and size distribution, dissolution rates and purity of the precipitates [17,18]. The abundance and presence of specific ions in solution in contact with the crystals’ surfaces during dissolution/growth can lead to changes in both the morphology and crystalline structure of the precipitates as well as in the kinetics of the process [19]. In multicomponent aqueous solutions, the hydration state of the crystalline components (i.e., crystal building units) and the structure and dynamics of the solvent can critically affect the growth and dissolution kinetics of the crystalline phases [17]. These mechanisms depend on the energy barriers involving these ions that may attach to and detach from the crystal surfaces, considering different types of interactions (i.e., water-water, ion-water, and ion-ion interactions) [20,21]. Therefore, the crystalline characteristics of the formed phases can be modified by background salts present in solution, due to the effects of these electrolytes on the dynamics of ion-water interactions and ionic strength during precipitation, among other factors. Thus, the presence of different elements (for instance, selenium [22]) has a great influence on the composition of the precipitated phases and especially on the crystallization sequence of calcium carbonate polymorphs. In addition, the incorporation of these ions into the crystalline structure of carbonates minerals has an important potential for the immobilization of contaminants (for example; Sr2+, Mn2+, and Cd2+) present in aqueous solutions [23,24].
Despite the recent progress in the knowledge of the effect of cations during CaCO3 precipitation, the action of some ions highly present in the injection brines and ocean water (i.e., Cs+, Sr2+, and Li+) and the role of the transporting anion (i.e., CO32−, Cl) have been scarcely studied. Lithium compounds, such as lithium carbonate, lithium hydroxide and lithium bromide, are used for numerous industrial and technological applications (e.g., the manufacture of glass, ceramics, lubricants and greases, catalysts in the pharmaceutical and rubber industries) and, more recently, in electric battery ion technology [25,26]. While the demand for lithium minerals has increased during the last decades, their availability is relatively scarce, being one of the least abundant elements in nature [27]. Cesium is a relatively rare element and deposits are commonly found in association with pollucite -Cs(Si2Al)O6·nH2O-, the main ore of this element. In addition, pollucite is also found in zoned pegmatites where it is often related to lepidolite, the most commercially important lithium mineral [28]. Cesium, as an oxide or carbonate, is used as an effective ionization promoter in the hot flue gas stream used in magnetohydrodynamic power generators to obtain electricity [29]. In addition, cesium-based formation fluids have also applications in oil and petroleum exploration for the management of drilling muds [29]. Strontium (Sr) is an alkaline earth metal commonly found naturally in strontianite (SrCO3) and celestine (SrSO4) minerals. However, the current Sr production processes involve the extraction of ore, mainly in the form of celestine, and its subsequent conversion to SrCO3 by different techniques, such as a combination of calcination, reduction or double decomposition [30]. Strontium is employed in numerous technological applications, such as the fabrication of pigments, ceramics and special glasses, pyrotechnics and electronics (semiconductors, permanent magnets) as well as in the metallurgical industry and cement production [31]. Likewise, strontium also plays a fundamental role in numerous metabolic functions in living organisms [32]. Chloride systems develop a fundamental role in many natural environments, playing an essential contribution in both marine (i.e., ocean salinity, weather patterns and marine life) and terrestrial (plant nutrients, soil development) environments. Moreover, the presence of Cl ions in high concentrations in surface waters has been linked to different damage to terrestrial and aquatic flora and fauna, so its availability may be influential in the maintenance of many ecosystems [33,34] The use of Cl-based systems in industrial applications is also of great relevance for various processes. The presence of chloride as a transporting anion has been encountered in several systems such as oil brines and CO2 injection gas [35,36], concretes [37] or electrochemical properties in alloys [38].
A better understanding of the relationship between the aqueous solvent properties and mineral crystallization mechanisms can contribute to a deeper comprehension of the phase mineral transition processes in natural multicomponent solutions, such as seawater, or physiological fluids. Moreover, the effect of different ions when interacting with carbonate minerals during its nucleation and precipitation, and how these elements affect its physicochemical properties (e.g., crystallinity and composition), are critical in the final use of these precipitates for their various industrial and technological applications. Thus, this study aims to experimentally determine the effects of the presence of different electrolytes Cs+, Li+, and Sr2+ on the formation mechanisms of crystalline carbonate phases and how the occurrence of these elements in the form of their chloride and carbonate ion salts, as transporting anions, affect the processes of mineral growth and evolution of the precipitates.

2. Materials and Methods

2.1. Crystallization Experiments

Three experimental set-ups of carbonates precipitation from supersaturated solutions were performed using 50 mL Milli-Q water (resistivity 18.2 M.Ω.cm, Millipore, Merck, Burlington, MA, USA) for each experiment at 25 °C and 1 atm in the presence of different Cs+, Li+, and Sr2+ electrolytes solutions. First, the main solution experiment control reaction was performed by mixing directly into a closed batch reactor two equimolar solutions (25 mM) of Na2CO3 and CaCl2 in 50 mL of water.
Secondly, ion-chloride experiments were carried out in order to study the influence of Cs+, Li+, and Sr2+ electrolytes during carbonation experiments in chloride form as transporting anion. For this purpose, LiCl, CsCl, and SrCl2·6H2O (25 mM) solutions were added independently to different solutions of 50 mL to an equimolar solution of Na2CO3 and CaCl2 (25 mM).
Thirdly, ion-carbonate experiments were performed to elucidate the influence of these electrolytes (i.e., Cs+, Li+, and Sr2+) incorporated as carbonates (CO32−), transporting anion. Accordingly, Li2CO3, Cs2CO3 and SrCO3 solutions (25 mM) were added independently to different solutions of 50 mL to an equimolar solution of Na2CO3 and CaCl2 (25 mM).
For the experimental design, a concentration of 25 mM was selected to ensure a supersaturation state in all the experiments. Calculation of solution speciation and saturation indexes (SI) with respect to relevant phases (i.e., calcite, aragonite and strontianite) was performed using PHREEQC computer code (version 3.3.12, USGS, Reston, VA, USA) and the lnll.dat database [39]. Calcite and aragonite SI values ranged between 1 and 1.5 in all experiments, while strontianite SI reached higher values in the experiments using Sr as a background electrolyte (SISrCO3 = 1.99 for the experiments using SrCl2·6H2O and 2.26 for the experiments using SrCO3).
The solutions were filtered before the reaction experiments and the solids were rinsed with ultrapure water to prevent the sodium chloride presence in further XRD and Raman analyses. All experiments were performed in closed reactors and maintained under continuous stirring at 400 rpm and stopped at the following experimental times: 24 h (1 day), 48 h (2 days), 168 h (7 days), and 720 h (30 days). All the experiments were performed in triplicate to ensure reproducibility. After each experimental run, the solids and liquids were separated by filtration (0.22 μm filters; Durapore®) using a vacuum pump. Then, solids were dried for 24 h at 60 °C and liquids were diluted and stored at room temperature for further ICP-OES analyses. All the solutions were prepared using ultrapure Milli-Q water and analytical grade reactants (≥97–99%; Panreac and Scharlau, Barcelona, Spain; Sigma Aldrich, Darmstadt, Germany; and ACROS, Waltham, MA, USA).

2.2. Chemistry of the Solutions and pH Measurement

The concentration of Ca, Sr, Li, and Cs in reacted solutions was determined by ICP-OES Optima 8300 spectrometer (Perkin Elmer, Waltham, MA, USA). The pH of the solutions was obtained by using Hanna HI 5522-02 pH meter. Calibration was performed by using 4.01, 7.00, and 10.01 DuraCal pH buffer solutions provided by Hamilton Company (Reno, NV, USA).

2.3. Characterization of the Mineral Precipitates

Mineralogical characterization and crystalline properties for each solid product were identified by powder X-ray diffraction (XRD). Samples of all the precipitates were pulverized in an agate mortar and analyzed using a PANalytical X’Pert PRO diffractometer (PANalytical, Almelo, The Netherlands). The XRD working conditions were: Cu-Kα radiation (λ = 1.5405 Å), current = 40 mA and tension 45 kV. Measurement range = 3–70° 2θ, time per step = 4 s, and step size = 0.004° 2θ. Prior to analysis, powder samples were placed on zero-background Si sample holders. Instrumental parameters were modelled by refining data collected from a LaB6 660b NIST standard. Diffraction patterns obtained were analyzed using HighScore Plus 2.2.4 (PANalytical, Almelo, The Netherlands) software. Phase identification was performed by matching the experimental diffraction patterns with those included in the PDF-2 database. Lattice parameters and quantitative analysis were conducted by Rietveld analyses using the crystal structure information provided by the American Mineralogist Crystal Structure Database (AMCSD): Calcite: 0000098, Vaterite: 0004854, Strontianite: 0000234. Goodness of fitting (GoF) has been fixed at values lower than 5 to ensure the reproducibility of each analysis.
Raman spectroscopy was employed to determine the mineralogical/structural changes undergone by the reacted samples. Spectra were recorded at room temperature using an XploRATM PLUS equipment (Horiba, Kyoto, Japan) with a Si-based charge-coupled device (CCD) detector (Peltier-cooled), an integrated Olympus BX41 optical microscope and an automatized x–y stage. Spectra were calibrated using the 520.5 cm−1 band of a silicon standard. The 532 nm laser line of a frequency-doubled Nd:YAG laser was used for excitation with a laser spot size of ca 2 × 2 μm. Data acquisition was carried out with the following parameters: acquisition time of 2 s and 10 accumulations, 1300–100 cm−1 spectral range and 1800 grooves/mm grating. Spectrometric analyses were performed using LabSpec software. Peak identification was performed by comparing with the Raman spectra database available in RRUFF. Furthermore, the crystallinity of carbonate products was measured at v1 asymmetric stretch ( ~ 1073 cm−1) for strontianite [40], v1 asymmetric stretch ( ~ 1085 cm−1) for calcite [41] using FITYK software for data processing and non-linear-curve fitting [42]. Split-Voight function fit was performed using Equation (1):
y = a 0 exp ln 2 x a 1 a 2 2
where a0 is the height of the peak, a1 is the full width at half maximum (FWHM), and a2 corresponds to the standard deviation.
Samples of the precipitates from the 720 h reaction time runs (specifically, SrCl and LiCl experiments) were collected, dispersed in ethanol, sonicated for 60 s and transferred to Formvar-coated copper grids. Further ultrastructural analyses were studied by means of transmission electron microscopy (TEM) using a ThermoFisher Scientific TALOS F200X equipped with energy dispersive analyses of X-rays (EDX) and a high-angle annular dark-field (HAADF) detectors (Thermo Fisher Scientific, Waltham, MA, USA). Analyses were performed using 200 kV accelerating voltage and image drift correction.

3. Results

3.1. Evolution of Solution Chemistry

The pH measurements for the ion-chloride and ion-carbonate experiments are shown in Figure 1. Chloride experiments set-up (CaCl2 + Na2CO3 + MCl) show values ranged 9.3–11.3 at the beginning of the reaction (time indicated as 0 h), where “M” refers to the chemical element combined with the transporting anion (i.e., Sr2+, Li+, and Cs+). These pH values stabilize progressively until 7 days (168 h), reaching values of approximately 10.5 for the control and CsCl and LiCl experiments (Figure 1a). In contrast, the pH evolution for the SrCl2 experiments markedly decreases until reaching 7.6 values at the end of the reaction time. The pH measurements for the ion-carbonate (CaCl2 +MCO3) experimental set-up are shown in Figure 1b. The control reaction together with Li2CO3 and Cs2CO3 experiments had similar pH progression, with a slightly increasing pattern, reaching values around 10.4 after 7 days. The experiment with SrCO3 solution showed lower pH values, starting at 8.4 and reaching values between 7.9 and 8 at the end of the reaction.
The chemical composition of Ca, Li, and Sr elements in aqueous solutions for both experimental set-ups are shown in Figure 2. The presence of Cs was not represented due to the low concentration under the detection limits of the analyses. The concentration of Ca in solution progressively decreased in the experiments using lithium salts Figure 2a (i.e., CaCl2 + Li2CO3 and CaCl2 + Na2CO3 + LiCl reactions) and cesium salts—Figure 2e (CaCl2 + Cs2CO3 and CaCl2 + Na2CO3 + CsCl reactions), being its higher loss during the first initial reaction time (24 to 48 h), particularly when these ions were present in chloride form. In addition, the concentration of Ca was lower throughout the evolution of the reaction in the systems with the associated presence of the Li and Cs combined with carbonate ion (blue lines in Figure 2a,e). In contrast, the concentration of Ca in solution was higher (>10 mmol/L) for the experiments using Sr salts (Figure 2c), slightly decreasing during reaction time for CaCl2 + SrCO3 reaction and increasing for CaCl2 + Na2CO3 + SrCl2 reaction. The concentration of Li (Figure 2b) decreased progressively over the reaction time, having a large decrease in the range from 168 to 720 h (7 to 30 days). Furthermore, the concentrations of Sr in aqueous solutions (Figure 2d) increased during the reaction time for the CaCl2 + SrCO3 reactions, while showing a progressive decrease for the CaCl2 + Na2CO3 + SrCl2 reactions showing the inverse trend observed for Ca concentrations in the same runs (Figure 2c).

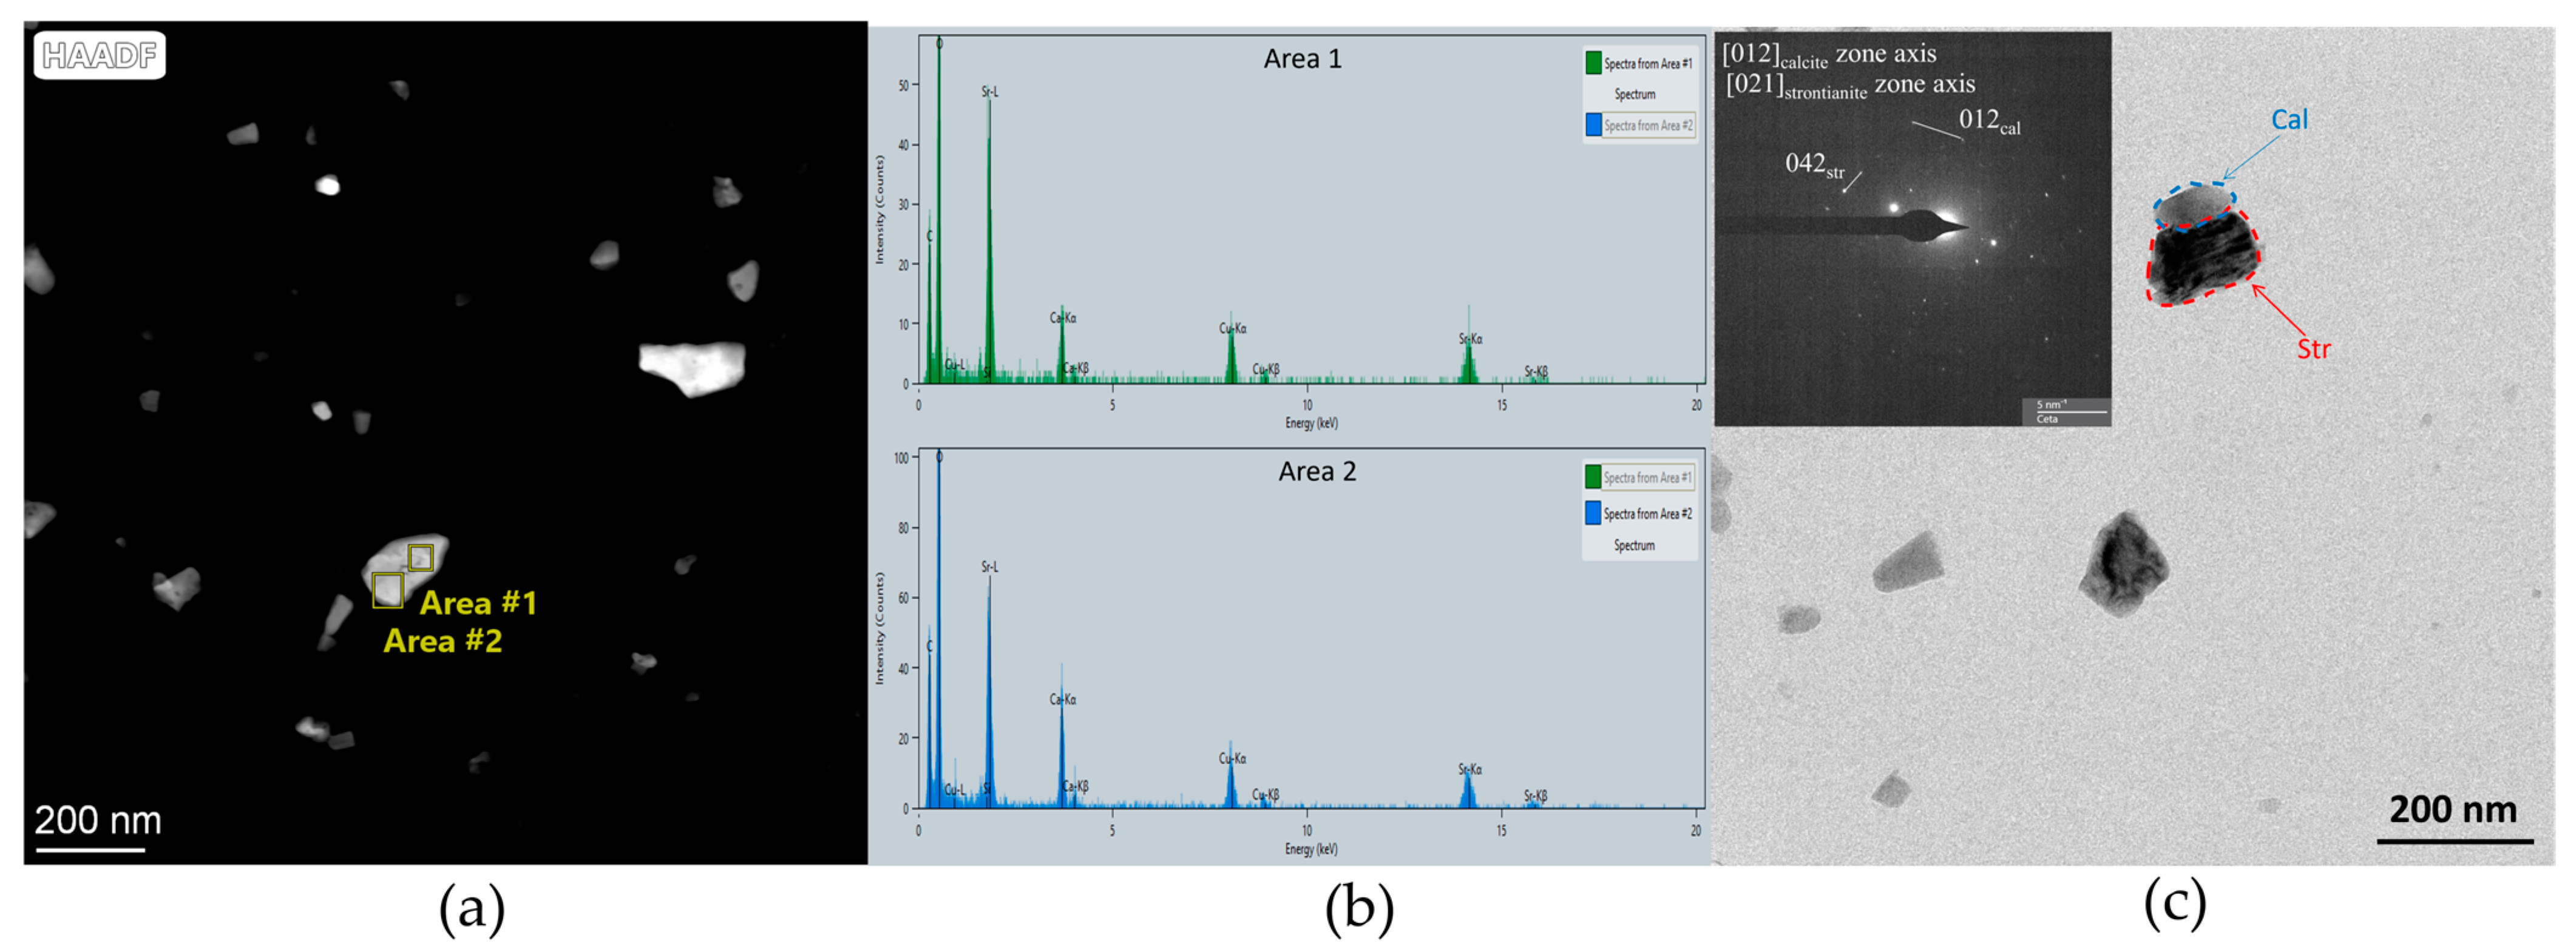
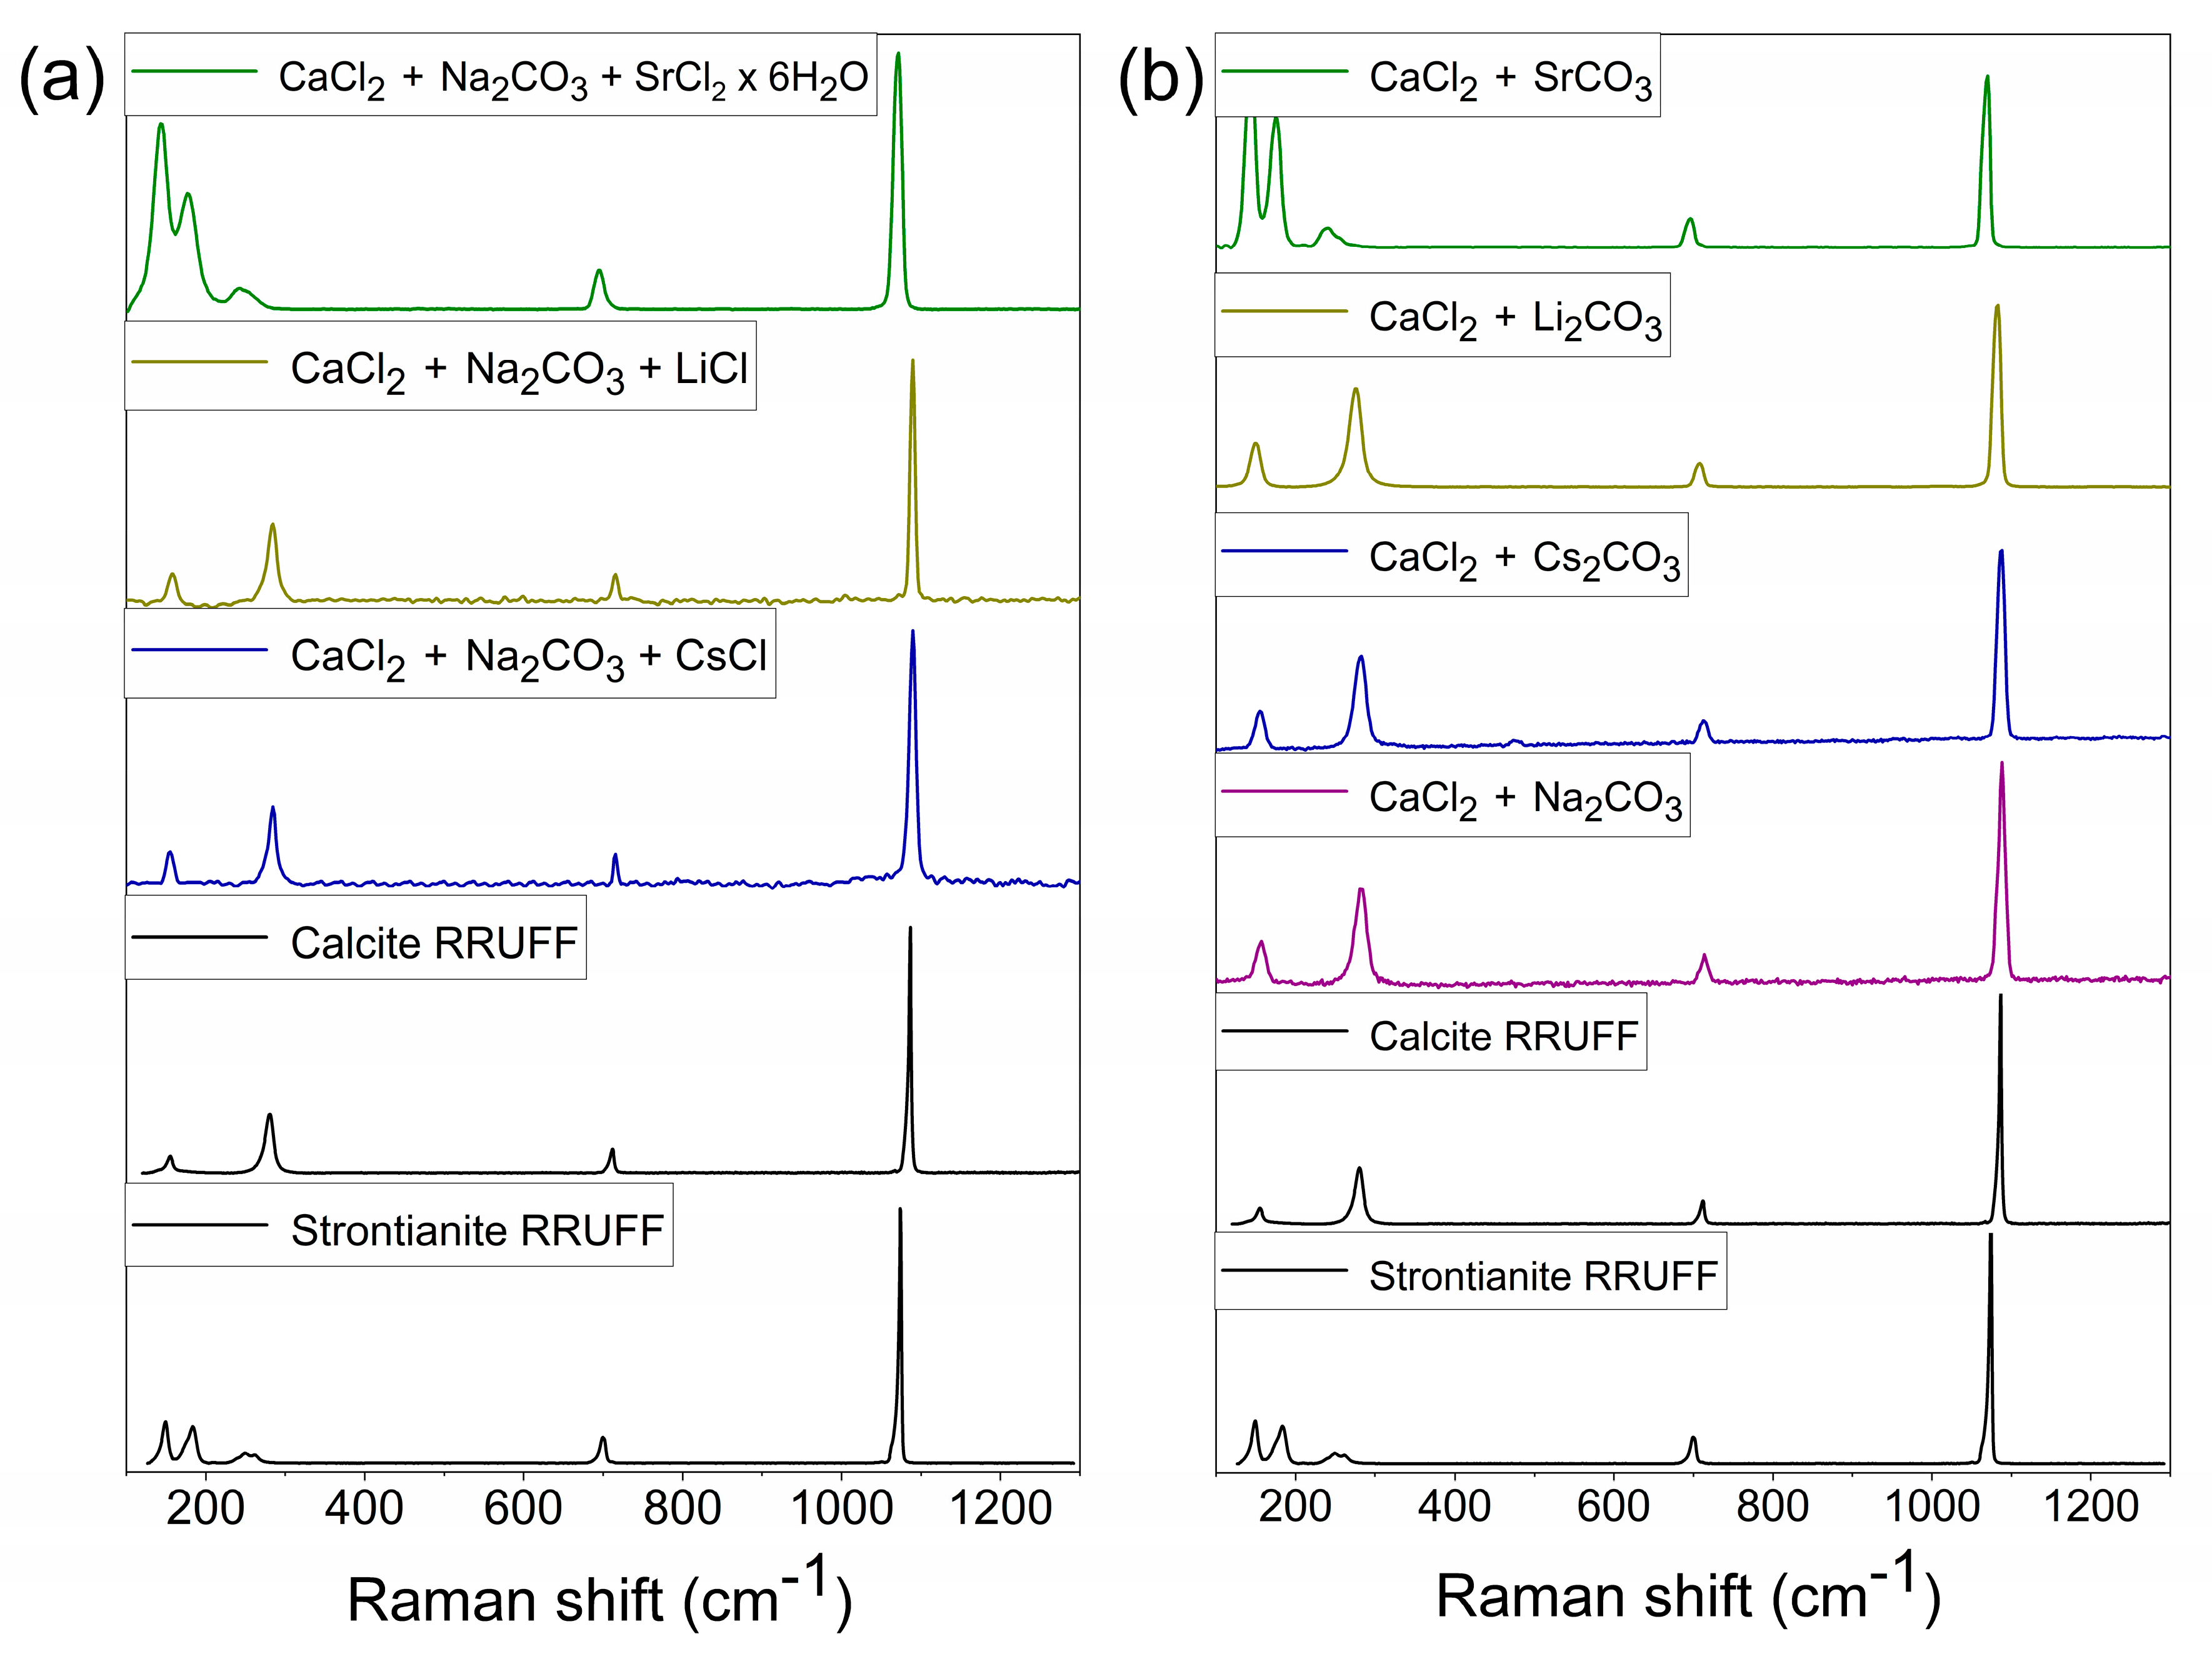
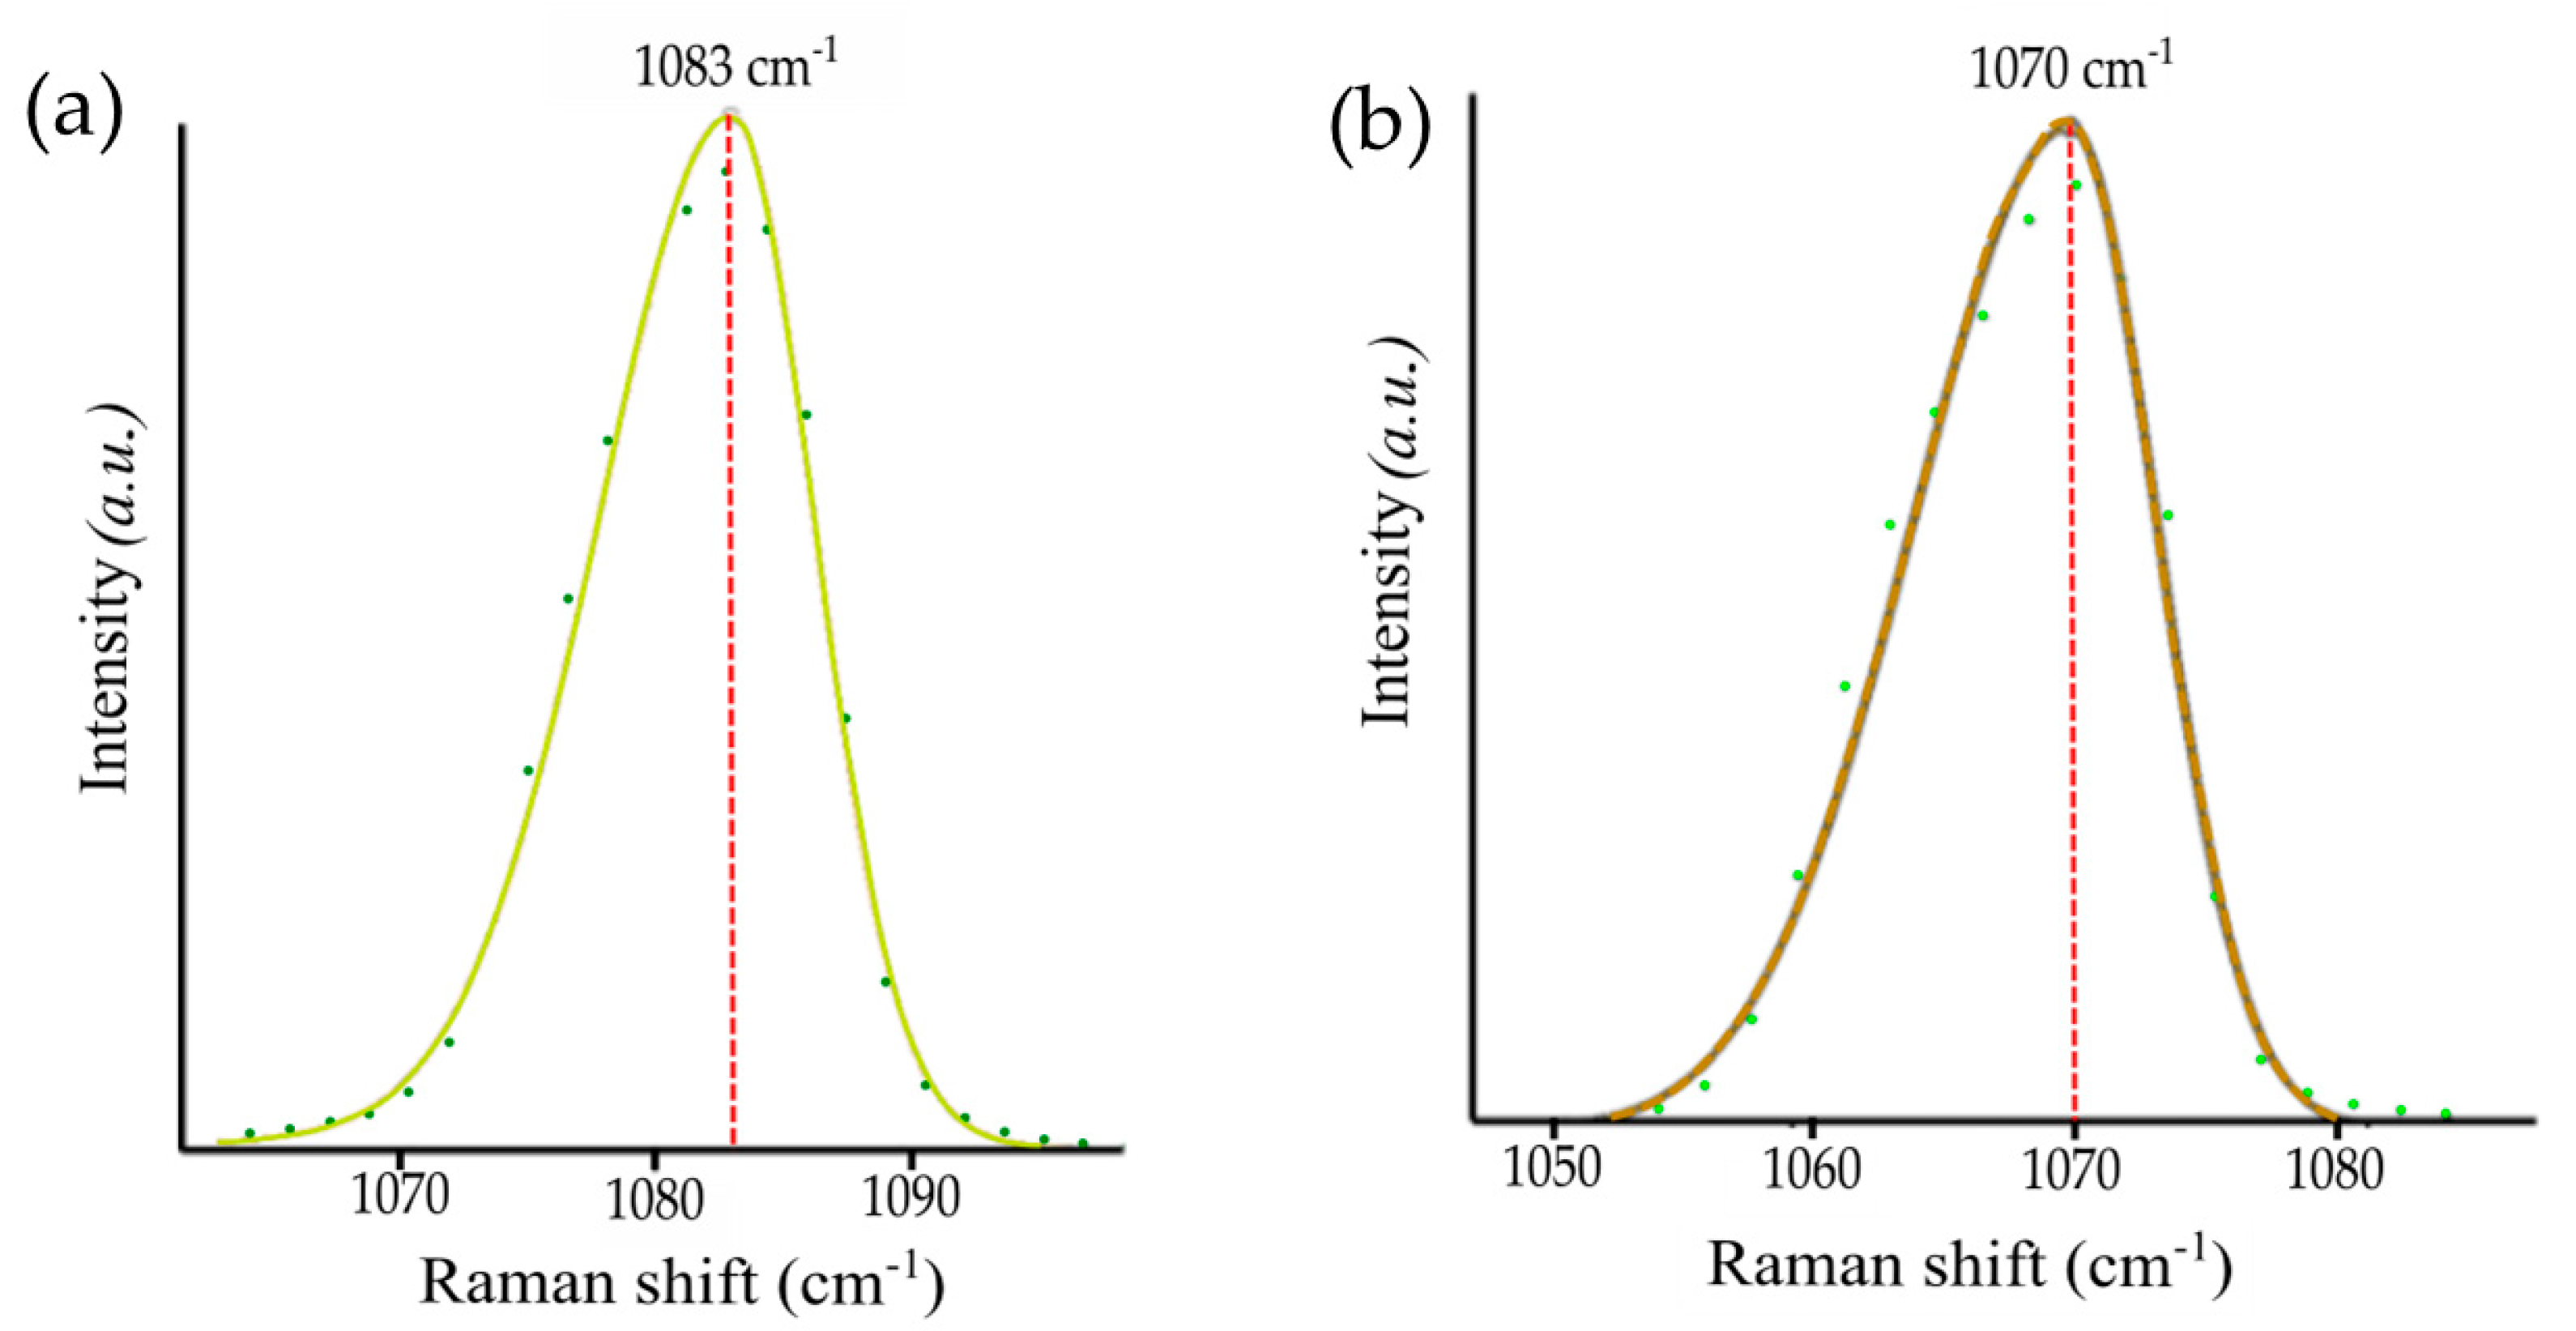
3.2. Mineral and Crystalline Characterization of the Precipitates

The mineralogy of the solid samples and their crystalline characteristics were evaluated by XRD, TEM and Raman analysis. The XRD results of the carbonated mineral phases showed the final formation of calcite (CaCO3) in the reaction time after 30 days (720 h) in the control groups and Cs and Li systems, while strontianite (SrCO3) was formed in the reactions using Sr salts (Figure 3). It should be noted that the strontianite present in the experiments is a newly formed phase and not the remaining original reagent due to the complete dissolution of SrCO3 salt before the start of each experiment (i.e., the solutions were filtered before the experimental reactions). No mineralogical differences (phase identification) were observed when ion chloride (Cl) Figure 3a and carbonated (CO32−) Figure 3b forms (both experimental set-ups) were considered at the end of the reaction times (30 days). It should be also stated that the strontianite sample with the chlorine source (i.e., CaCl2 + Na2CO3 + SrCl2) shows a more dispersed XRD pattern (higher peak broadening) compared to the corresponding carbonate form. This variation in the peak profile may be due to a smaller crystallite size of the strontianite in the case of the Cl ion experiments, as well as to possible differential incorporation of Ca into the strontianite lattice structure for both reactions.
Rietveld analysis of the XRD patterns obtained for each experimental time showed the mineral evolution of chloride and carbonate systems over time. Table 1 summarizes the crystalline phase content present at each reaction time. In the early stages of carbonate precipitation in the control samples (e.g., Na2CO3 + CaCl2) vaterite was present (20.7 wt.%) contemporaneously with calcite (79.3 wt.%), to completely transform into calcite after 48 h of reaction time. Experiments in the presence of Cs for both CaCl2 + Cs2CO3 and CaCl2 + Na2CO3 + CsCl systems resulted in calcite precipitation as the only mineral phase present during the reaction over time. Vaterite was also present in Li-rich experiments (i.e., CaCl2 + Li2CO3; CaCl2 + Na2CO3 + LiCl) in variable amounts and decreasing with time. These lithium salts reactions lead to the formation of calcite (reaching 100% at the end of the experiments), although this transformation seems to occur more rapidly after 48 h of reaction for the chloride system. The reactions related to Sr experiments (i.e., CaCl2 + SrCO3 and CaCl2 + Na2CO3 + SrCl2) resulted in the precipitation of strontianite as the main mineral phase (above 90%), transforming into a small amount of calcite during reaction time for the carbonate set-up. It is important to note that aragonite was also present in a minor amount (i.e., 4.8 wt%) in the early reaction stage (24 h) of the reaction between CaCl2 + SrCO3, but it was not detected in the reactions with chloride anion.
On the basis of the Rietveld analyses, the cell parameters for the mineral phases formed in both experimental set-ups were also calculated during the reaction time (Table 2). In particular, the cell parameters for the control experiment show that the a and c-axes of calcite had an increase between 24 h and 48 h (i.e., +0.002 Å) and a subsequent stabilization after 7 days of reaction. This increase was also observed for the rest of the calcite precipitates in the presence of Sr and Cs in the form of chloride and carbonate. However, the opposite trend was detected for the experiments in the presence of LiCO3 for the a- and c-axes, where a first decrease and a subsequent stabilization were observed after 7 days. In contrast, it is important to note that the a-axis of calcite in the presence of SrCl2 has systematically smaller values (~0.003 Å) compared to the rest of the newly formed calcite, while the c-axis showed higher values (~0.009 Å), starting from the 48 h experiments. Regarding the structural evolution of vaterite, the values for the a-axis in the presence of Li2CO3 showed a slight increase while the c-axis showed the opposite pattern. However, vaterite precipitated in the presence of LiCl showed a huge decrease in both a- and c-axes. The cell parameters of the precipitated vaterite in the lithium experiments were higher than those observed for the control group. Finally, the cell parameters observed for strontianite (orthorhombic system) showed a different performance depending on the experimental set-up. Considering samples precipitated in the presence of SrCO3, the cell parameters showed a slight decrease with respect to the experimental time at 24 h. For strontianite in the presence of SrCl2 an increase was observed for the a- and b-axes values (especially marked in the latter), while there was a slight decrease for the parameter related to the c-axis.
TEM-EDX analyses of the Sr systems (Figure 4) showed an incorporation of Ca into the strontianite crystal structure (calcian-strontianite) (Figure 4a,b). Furthermore, TEM micrographs showed the typical morphologies of strontianite crystals (indicated by a dashed red line in Figure 4c) with black lines crossing the crystals [43] and the calcite crystal (dashed blue line in Figure 4c), confirming the simultaneous precipitation of both phases. The selected area electron diffraction (SAED) pattern also confirmed these mineral occurrences (inset Figure 4c), showing d-spacing distances of 3.85 Å, characteristic of the crystallographic plane (012) of calcite [44], combined with a d-spacing of 1.71 Å corresponding to the crystallographic plane (042) of strontianite [45].
TEM analyses also confirmed the presence of calcite and vaterite in Li systems for CaCl2 + Na2CO3 + LiCl experiment set-up (Figure 5). Two different morphologies were observed in the HAADF images, a major presence of crystals with defined shapes (forming a dense aggregate) and smaller spherulitic crystals on the rim, both with the same chemical composition (Figure 5a,b). The main crystals correspond to calcite, while the spherulitic forms are related to vaterite, previously described with this morphology by TEM analysis [46]. SAED patterns (Figure 5c, inset) confirmed the presence of the (104) and (012) crystallographic planes of calcite crystals (i.e., 3.85 Å and 3.04 Å, respectively), as well as the characteristic d-spacing of the (306) crystallographic plane (corresponding to 1.88 Å) of vaterite crystals. However, it is important to note that these analyses corresponded to the experiments (CaCl2 + Na2CO3 + LiCl reaction) in which the XRD analyses (Table 1) revealed no presence of vaterite after 30 days of reaction time. It can be assumed, on the one hand, that the high crystallinity of calcite crystals masks the less intense diffraction peaks of vaterite, which hinders its identification by conventional XRD analysis. On the other hand, our Rietveld analyses showed a standard deviation above the lower representation of the total crystalline fraction of vaterite in these experiments.
Raman spectroscopy analyses for the samples obtained in both experimental set-ups at the end of the reaction time (720 h) showed the characteristic bands of calcite in the control experiment and Cs and Li as background electrolytes and strontianite in the experiments with Sr (Figure 6). The most representative difference between these two carbonates is the double band observed at 148 and 185 cm−1 in the strontianite, corresponding to the A1g and B2g modes, translational and rotational lattice modes [47], while calcite presents two bands at 153 and 280 cm−1. Moreover, the peak at 712 cm−1 corresponding to the ν4 bending mode of carbonate in calcite [48] also shifted to lower values in strontianite (~700 cm−1). Finally, the main single peak at 1085 cm−1 corresponding to symmetric stretching of C-O bonds in calcite (~1083 cm−1, [49]) showed a shift to lower values in strontianite (~1070 cm−1, [50]).
A detailed analysis of the higher intensity bands in the Raman spectra of the mineral samples revealed a differential broadening of the peak associated with the symmetric stretching of the carbonate groups (Table 3, Figure 7). Particularly, a broadening increase in the v1 stretching band for the precipitated calcite in the two experimental set-ups was observed with respect to the control sample. In addition, this peak broadening was lower for those calcites formed in the CO32− experiments (i.e., CaCl2 + Cs2CO3 and CaCl2 + Li2CO3), accompanied by a slight peak shift (approximately −2 cm−1). With respect to the precipitated strontianite samples, a lower peak broadening was also observed for the CO32− experiments coupled with a slight shift of the peak associated with the v1 symmetric stretching mode of carbonate.
Figure 7 represents the fitting procedure for the symmetric stretching of the carbonate group (1050–1100 cm−1) in the Raman spectra performed to disclose the band positions and FWHM values of each deconvoluted peak (see Table 3). For example, the adjustment of the Raman spectrum to obtain the previously calculated parameters allows us to observe a significant shift of the v1 ν1 band to lower wavenumbers between the control calcite and the SrCl2 experimental set-up strontianite samples (1083 cm−1 to 1070 cm−1, respectively).

4. Discussion

Carbonate minerals present several industrial and technological applications modulated by their physicochemical properties (e.g., polymorphism, crystallinity, composition, etc.). The development of experimental methods and protocols to access different calcium carbonate phases is crucial to elucidate the formation processes occurring in nature, as well as to mimic other precipitation mechanisms in different environments and artificial synthesis. It is also important to control the interconversion between these polymorphs as certain applications require the presence of a specific phase with particular characteristics (e.g., particle size or crystal morphology), while others may require in situ conversion from one CaCO3 phase to another (e.g., via solubility differences, as in drug delivery). Our results demonstrated how the presence of the electrolytes in solution (i.e., Cs, Li, and Sr combined with Cl and CO3 transporting anion forms) determined the formation and transition between various carbonate minerals (aragonite-calcite-vaterite and strontianite) and led to the modification of the compositional and crystalline properties of these phases with the reaction conditions over time.
The formation of different carbonate minerals in solution depends on many highly variable thermodynamic and kinetic factors. Although the synthesis of CaCO3 can be reached by a simple precipitation reaction between Ca2+ and CO2−3 ions, the controlled precipitation of a specific CaCO3 polymorph with predictable crystalline characteristics is currently a challenge during its formation [51]. Furthermore, according to the non-classical nucleation theory [52], the first step of calcium carbonate precipitation and polymorph evolution is the formation of metastable prenucleation clusters (PNCs) and their aggregation into solid amorphous calcium carbonate (ACC). Previous studies have shown that the presence of background electrolytes greatly affects the stability of ACC (e.g., [53,54]). It should be noted that the presence of ACC has not been directly detected in this study, although its occurrence at early experimental times (instantaneous reaction) cannot be discarded. In all the experiments conducted, the precipitates formed at shorter reaction times were crystalline carbonate phases (calcium carbonate polymorphs and strontianite), so if metastable phases exist, these have evolved rapidly at the starting reaction times considered. The mechanisms by which electrolytes stabilize the ACC or CaCO3 polymorphs depend largely on the character of the ions and their spatial distribution within the crystal structure, also influencing the kinetics of the crystal growth [55,56]. A recent study showed how the presence of Li can influence the kinetics of the transformation of vaterite (metastable polymorph) to plate-like calcite formation [57]. Similarly, in our study the reaction conditions of the Li system show the stabilization of the vaterite that progressively transforms into calcite during the reaction time (ageing), associated with alterations at the crystalline level. This transformation raises a detailed study by modifying and extending the reaction conditions considered in the present research.
Solution pH is one of the important factors determining CaCO3 polymorphism, affecting not only the equilibrium concentration of carbonate species, such as HCO3 and CO3−2, but also the binding strength between Ca-CO3 and other anionic and cationic electrolytes present in the solution during the variation of the pH values [15,52]. The evaluation of the effect of Li presence as M+ showed significant variations in the pH values in the two experimental set-ups (i.e., X: Cl and CO32−) during the initial reaction time, in which steps the major transformation between mineral phases occurs. The presence of Li from the ion chloride salts decreases the pH of the solution while it is accompanied by a transformation from vaterite into calcite during the initial reaction time. In contrast, the experimental set-up in which Li appears associated with the carbonate group showed a smaller variation in pH values, while it transforms more rapidly from vaterite to calcite. This mineral transformation was accompanied by an appreciable decrease of Ca and Li ions in solution during the experimental time (or aging). A recent study analyzed the transformation kinetics of vaterite to calcite in the presence of Li ions within a wide range of concentrations and correlated it with different parameters during experimentation (e.g., stirring of the solutions) [57]. The presence of Li during calcite precipitation has been shown to influence the morphological development of its crystal faces (i.e., increased expression of {001} crystallographic planes) [58,59]. In our case, the relative increase of the concentration of Li ions from the chloride form set-up in the precipitated phases (inversely proportional to the concentration present in solution) caused the delay of the transformation of vaterite into stable calcite polymorph, which could be explained by a coupled process of slower dissolution of vaterite and slower growth of calcite, as previously observed for other experiments [60]. Furthermore, the lithium ions may remain entrapped on the calcite surface, reducing the rate of calcite nucleation and therefore, stabilizing the presence of vaterite [61,62]. In fact, TEM results show a presence of vaterite at longer reaction times (30 days) due to the possible stabilization of this polymorph, although in a much lower relative proportion than calcite formation (detected mostly by XRD). In addition, the crystalline properties of these mineral phases were also modified during the experimental time. Calcite synthesized in the presence of Li showed higher a and c-axis values compared to the control experiments. However, after 30 days of reaction time, calcite formed in the LiCl-rich reactors showed lower a-axis values than in the experiments in the presence of Li2CO3 and control samples. This structural effect agrees with the incorporation of Li (with a lower ionic radius than calcium) into the calcite lattice, as it can be also observed for other monovalent ions, such as Na [63]. Furthermore, the peak broadening of the band located at 1085 cm−1 (symmetric stretching of carbonate groups) presented higher values for the Li-systems compared to the control system. These values suggest a low-ordered crystal structure of calcite compared to the control samples [64] and therefore, indicate how the Li presence in the calcite structure strongly affects its crystallinity. Previous studies [62] also hypothesized that the reduction of the nucleation rate of the calcite by the effect of Li can be extrapolated to other monovalent cations.
The Cs adsorption capacity with different geological mineral phases (v.gr., sericite, biotite, vermiculite, zeolite, opal) has been explored in previous studies [65,66]. Distribution coefficients obtained at trace concentrations of Cs can vary by several orders of magnitude between minerals, being relatively high for some phyllosilicates (such as montmorillonite and vermiculite) and very low for other minerals, such as fluorite, quartz, apatite, calcite, gibbsite, manganese dioxide and iron oxides [67]. Thus, its presence as a single monovalent redox state considerably limits its incorporation in mineral adsorbents associated with most anionic groups (i.e., carbonates, sulphates, and phosphates). Furthermore, considering that the ionic radius of Cs greatly exceeds that of Ca ions, and since the partition coefficient of alkali ions in calcite is invariable low, co-precipitation of Cs with calcite is likely to be insignificant [68]. However, the effects of the ionic strength and electrolyte composition of Cs in different solutions have been scarcely studied. A previous study compared the sorption capacity of Cs with different background electrolytes in rocks and minerals [69]. This research stated how the low Cs sorption in calcite can be explained by the paucity of sites associated with Cs ions or by competition with dissolved Ca in the electrolyte solution. Furthermore, this cationic competition may be influenced by the low selectivity of Cs for sites such as CO3 groups formed on calcite surfaces. Our results showed how the presence of Cs in solution from different anionic forms (both experimental set-ups) modified the crystalline characteristics of calcite during its formation. The main effects of the presence of the Cs ion were observed in the first steps of the reaction (e.g., pH, [Ca] in solution, lattice parameters). Particularly, for both experimental Cs conditions in the reaction time up to 24 h a stabilization of calcite precipitation occurred, whereas the control experiment showed the formation of vaterite as an intermediate phase. Furthermore, the presence of the electrolyte (Cl) associated with Cs was related to a higher dimension in the calcite cell parameters (i.e., a and c-axes values), showing an increase of ~0.008 Å with respect to the parameters obtained for the control reaction (see Table 2), combined with a faster incorporation of Ca from solution (observed from spectrophotometer data). In addition, our results also demonstrated a lower crystallinity of the calcite samples as compared to the control samples, observed from Raman analyses (i.e., 11 cm−1 in the presence of CsCl2 with respect to 10.3 cm−1 in the v1ν1 calcite control vibration band, Table 3). This calcite crystallinity associated with the vibrational stretching modes of the carbonate groups was slightly higher in the CO32− form experiments, as was also observed in the Li reactions. Therefore, despite the ubiquitous presence of calcite in these systems, crystallinity was strongly affected by the existence of Cs in the experimental set-ups.
Cations larger than Ca2+ (e.g., Sr2+ and Ba2+) mainly form mineral carbonates with orthorhombic symmetry, analogous to aragonite under ambient conditions [70]. In both experimental set-ups (Cl and CO32− salt forms), the reaction resulted in pH drops (to values below pH = 8) at the initial reaction times, coupled with rapid strontianite formation. The presence of Sr decreases the thermodynamic stability of calcite due to the higher hydration capacity of Sr ions, resulting in the preferential formation of strontianite in solution. However, Sr has also a complex behavior as an impurity during calcite growth [71]. A previous study demonstrated how increasing Sr concentrations in solution promoted a nanoscale effect during calcite growth associated with specific crystallographic directions [72]. In the current study, we observed that at the early stages of the reaction under the SrCO3 experimental set-up, aragonite formation occurred which was rapidly transformed into strontianite, due to its higher solubility constant. Our results suggest that Ca incorporation was higher in the presence of carbonates than in the presence of chloride ions in solution and, therefore, carbonation may be hindered depending on the transport agent of the background electrolyte. Furthermore, it can be also observed that the presence (and variation) of Ca in the aqueous solution influences the crystallinity of the precipitated strontianite. At the longest reaction times (30 days) TEM results indicated the coexistence of calcite (a very small relative amount) with majority strontianite, which also showed the presence of calcium in its structure (calcian-strontianite). Moreover, this crystalline variation was also reflected in the structural arrangement of the carbonate group in strontianite, showing a greater broadening of the peak associated with the symmetrical stretching modes in the experiments performed with the chloride form, as occurred in the reaction with Li and Cs in calcite precipitates.
In summary, the presence of different ions in an aqueous solution affected the mineral evolution of carbonate mineral phases transformation under specific background electrolyte composition, both cationic (i.e., Sr2+, Li+ and Cs+) and coupled anionic (Cl and CO3−2). The current study revealed that the ionic strength effect (a term proposed by Buhmann and Dreybrodt [15]) of these combined electrolytes in the solution was able to influence the polymorphism of CaCO3 formation (vaterite-calcite) and the compositional and crystalline properties of the carbonate precipitates. The mineral transformation and the possible incorporation of these elements as impurities during the reaction time could be associated with the modification of the structural factors, such as crystallinity and cell parameter of these crystalline phases. More complex investigations can help to understand the effect and magnitude of these crystallization processes in controlling the precipitation of different types of carbonates (and polymorphs) both in nature and industrial synthesis.

5. Conclusions

The precipitation of carbonate minerals is of great relevance in numerous natural processes and current technological and industrial challenges. The experimental results reported in this research aim to improve the predictability of carbonate formation under different aqueous solution compositions. It should be considered that the presence of various electrolyte solutions of Sr, Li, and Cs ions, coupled with chloride and carbonate anionic groups, determined the formation of specific calcium carbonate polymorphs and strontianite minerals during the reaction time (aging). The effect of the ionic strength of these electrolytes during the experimental time (up to 30 days) influenced the mineral evolution in the experimental set-ups and led to a modification of the crystalline and compositional properties of the precipitates, affecting the final properties of the resultant carbonate minerals and therefore, their possible industrial uses (e.g., vaterite for lubricants, stabilization of CO2 in a stable and permanent form). The presence of Li is shown to influence the initial vaterite precipitation and would reduce the kinetics of calcite precipitation, leading to a relative increase in volume during mineral transformation. This variation during the replacement process may have important implications in some particular scenarios, such as CCS strategies to prevent potential damage to the injection area. Furthermore, it was also observed how the Li ion differently affected the crystallinity of the precipitated calcite in both experimental sets. This crystalline alteration could affect the mechanical and chemical properties of the final product, especially critical if the required compound needs to achieve a specific mechanical strength or solubility. The presence of Cs stabilized calcite formation for all reaction times, being a potential mechanism for the retention of this element, a particularly interesting process in contaminated soils and wastewater remediation. Finally, strontianite was mainly formed in the reactions using Sr salts, showing differences in crystallinity during aging. This effect should be taken into account, especially in the industrial precipitation of calcite in the presence of Sr-rich water, which would affect the resulting end product. Overall, the electrolyte chemistry of aqueous solutions plays a key role in the development of the physicochemical characteristics of carbonate mineral phases, determining in turn many of their technological and industrial applications, as well as the formation processes in natural environments that lead to their formation. Further studies will be necessary to understand and quantify the combined effect of these and other anions under different experimental conditions. In particular, the detailed and extensive role of the ionic strengths of these electrolytes during the formation of crystalline/amorphous phases at shorter reaction times and other possible coprecipitation phenomena will be a challenge to address.

Author Contributions

Conceptualization, L.M.-G.; methodology, P.M.-T., C.E. and L.M.-G.; software, P.M.-T., C.E. and L.M.-G.; validation, P.M.-T., C.E., L.M.-G. and P.A.-L.; formal analysis, P.M.-T., C.E. and L.M.-G.; investigation, P.M.-T., C.E., L.M.-G. and P.A.-L.; resources, L.M.-G. and P.A.-L.; data curation, P.M.-T., C.E. and L.M.-G.; writing—original draft preparation, P.M.-T., C.E., L.M.-G. and P.A.-L.; writing—review and editing, P.A.-L.; visualization, P.M.-T., C.E. and L.M.-G.; supervision, L.M.-G. and P.A.-L.; project administration, P.A.-L.; funding acquisition, L.M.-G. and P.A.-L. All authors have read and agreed to the published version of the manuscript.

Funding

This research was funded by the Spanish Ministry of Economy and Competitiveness, grant number PCI2019-111931-2 and the European Regional Development Fund (ERDF)—Next Generation/EU program.

Data Availability Statement

The data presented in this study are available on request from the corresponding authors.

Acknowledgments

The authors would like to thank the staff of Centro de Instrumentación Científica (CIC; University of Granada) and Servicios Científico-Técnicos (SCT; University of Oviedo) for kindly providing technical support and assistance.

Conflicts of Interest

The authors declare no conflict of interest.

References

  1. Radha, A.V.; Navrotsky, A. Thermodynamics of Carbonates. Rev. Mineral. Geochem. 2013, 77, 73–121. [Google Scholar] [CrossRef]
  2. Falini, G.; Albeck, S.; Weiner, S.; Addadi, L. Control of Aragonite or Calcite Polymorphism by Mollusk Shell Macromolecules. Science 1996, 271, 67–69. [Google Scholar] [CrossRef]
  3. Christy, A.G. A Review of the Structures of Vaterite: The Impossible, the Possible, and the Likely. Cryst. Growth Des. 2017, 17, 3567–3578. [Google Scholar] [CrossRef]
  4. Soldati, A.L.; Jacob, D.E.; Wehrmeister, U.; Hofmeister, W. Structural characterization and chemical composition of aragonite and vaterite in freshwater cultured pearls. Mineral. Mag. 2008, 72, 579–592. [Google Scholar] [CrossRef]
  5. Kabalah-Amitai, L.; Mayzel, B.; Kauffmann, Y.; Fitch, A.N.; Bloch, L.; Gilbert, P.U.P.A.; Pokroy, B. Vaterite Crystals Contain Two Interspersed Crystal Structures. Science 2013, 340, 454–457. [Google Scholar] [CrossRef] [PubMed]
  6. McConnell, J.D.C. Vaterite from Ballycraigy, Larne, Northern Ireland. Mineral. Mag. J. Mineral. Soc. 1960, 32, 535–544. [Google Scholar] [CrossRef]
  7. Grasby, S. Naturally Precipitating Vaterite (μ-CaCO3) Spheres: Unusual Carbonates Formed in an Extreme Environment. Geochim. Cosmochim. Acta 2003, 67, 1659–1666. [Google Scholar] [CrossRef]
  8. Falkowski, P.; Scholes, R.J.; Boyle, E.; Canadell, J.; Canfield, D.; Elser, J.; Gruber, N.; Hibbard, K.; Hogberg, P.; Linder, S.; et al. The global carbon cycle: A test of our knowledge of earth as a system. Science 2000, 290, 291–296. [Google Scholar] [CrossRef]
  9. Meldrum, F.C. Calcium carbonate in biomineralisation and biomimetic chemistry. Int. Mater. Rev. 2003, 48, 187–224. [Google Scholar] [CrossRef]
  10. Cartwright, J.H.E.; Checa, A.; Gale, J.; Gebauer, D.; Sainz-Díaz, C.I. Calcium Carbonate Polyamorphism and Its Role in Biomineralization: How Many Amorphous Calcium Carbonates Are There? Angew. Chem. Int. Ed. 2012, 51, 11960–11970. [Google Scholar] [CrossRef]
  11. Lee, K.-M.; Park, P.-J. Estimation of the environmental credit for the recycling of granulated blast furnace slag based on LCA. Resour. Conserv. Recycl. 2005, 44, 139–151. [Google Scholar] [CrossRef]
  12. Rodriguez-Navarro, C.; Elert, K.; Ševčík, R. Amorphous and crystalline calcium carbonate phases during carbonation of nanolimes: Implications in heritage conservation. Crystengcomm 2016, 18, 6594–6607. [Google Scholar] [CrossRef]
  13. Butler, M.F.; Glaser, N.; Weaver, A.C.; Kirkland, M.; Heppenstall-Butler, M. Calcium Carbonate Crystallization in the Presence of Biopolymers. Cryst. Growth Des. 2006, 6, 781–794. [Google Scholar] [CrossRef]
  14. Kirboga, S.; Öner, M. Investigation of calcium carbonate precipitation in the presence of carboxymethyl inulin. Crystengcomm 2013, 15, 3678–3686. [Google Scholar] [CrossRef]
  15. Buhmann, D.; Dreybrodt, W. Calcite dissolution kinetics in the system H2O CO2 CaCO3 with participation of foreign ions. Chem. Geol. 1987, 64, 89–102. [Google Scholar] [CrossRef]
  16. Burgos-Cara, A.; Putnis, C.V.; Rodriguez-Navarro, C.; Ruiz-Agudo, E. Hydration Effects on the Stability of Calcium Carbonate Pre-Nucleation Species. Minerals 2017, 7, 126. [Google Scholar] [CrossRef]
  17. Kowacz, M.; Putnis, A. The effect of specific background electrolytes on water structure and solute hydration: Consequences for crystal dissolution and growth. Geochim. Cosmochim. Acta 2008, 72, 4476–4487. [Google Scholar] [CrossRef]
  18. Ruiz-Agudo, E.; Urosevic, M.; Putnis, C.V.; Rodríguez-Navarro, C.; Cardell, C.; Putnis, A. Ion-specific effects on the kinetics of mineral dissolution. Chem. Geol. 2011, 281, 364–371. [Google Scholar] [CrossRef]
  19. Ruiz-Agudo, E.; Kowacz, M.; Putnis, C.; Putnis, A. The role of background electrolytes on the kinetics and mechanism of calcite dissolution. Geochim. Cosmochim. Acta 2010, 74, 1256–1267. [Google Scholar] [CrossRef]
  20. Collins, K. Charge density-dependent strength of hydration and biological structure. Biophys. J. 1997, 72, 65–76. [Google Scholar] [CrossRef]
  21. De Yoreo, J.J. Principles of Crystal Nucleation and Growth. Rev. Mineral. Geochem. 2003, 54, 57–93. [Google Scholar] [CrossRef]
  22. Fernandez-Gonzalez, A.; Lozano-Letellier, A.; Fernandez, B. The Influence of Aqueous Se(IV) on the Stability of Different CaCO3 Polymorphs Precipitated under Ambient Conditions. Minerals 2021, 11, 1238. [Google Scholar] [CrossRef]
  23. Paquette, J.; Reeder, R.J. Relationship between surface structure, growth mechanism, and trace element incorporation in calcite. Geochim. Cosmochim. Acta 1995, 59, 735–749. [Google Scholar] [CrossRef]
  24. Prieto, M.; Fernández-González, A.; Putnis, A.; Fernández-Díaz, L. Nucleation, growth, and zoning phenomena in crystallizing (Ba,Sr)CO3, Ba(SO4,CrO4), (Ba,Sr)SO4, and (Cd,Ca)CO3 solid solutions from aqueous solutions. Geochim. Cosmochim. Acta 1997, 61, 3383–3397. [Google Scholar] [CrossRef]
  25. Ebensperger, A.; Maxwell, P.; Moscoso, C. The lithium industry: Its recent evolution and future prospects. Resour. Policy 2005, 30, 218–231. [Google Scholar] [CrossRef]
  26. Bolan, N.; Hoang, S.A.; Tanveer, M.; Wang, L.; Bolan, S.; Sooriyakumar, P.; Robinson, B.; Wijesekara, H.; Wijesooriya, M.; Keerthanan, S.; et al. From mine to mind and mobiles–Lithium contamination and its risk management. Environ. Pollut. 2021, 290, 118067. [Google Scholar] [CrossRef]
  27. Greim, P.; Solomon, A.A.; Breyer, C. Assessment of lithium criticality in the global energy transition and addressing policy gaps in transportation. Nat. Commun. 2020, 11, 4570. [Google Scholar] [CrossRef] [PubMed]
  28. Wang, R.C.; Hu, H.; Zhang, A.C.; Huang, X.-L.; Ni, P. Pollucite and the cesium-dominant analogue of polylithionite as expressions of extreme cs enrichment in the yichun topaz–lepidolite granite, southern china. Can. Mineral. 2004, 42, 883–896. [Google Scholar] [CrossRef]
  29. Butterman, W.C.; Brooks, W.E.; Reese, R.G. Mineral Commodity Profiles: Cesium; USGS: Reston, VA, USA, 2005. [Google Scholar] [CrossRef]
  30. Chen, W.; Zhu, Y. Preparation of strontium carbonate from celestite. Miner. Process. Extr. Met. 2000, 109, 1–5. [Google Scholar] [CrossRef]
  31. Ober, J.A. Mineral Commodity Summaries 2016; USGS: Reston, VA, USA, 2016. [Google Scholar]
  32. Lenihan, J.M.A. Strontium Metabolism. Nature 1966, 211, 572–573. [Google Scholar] [CrossRef]
  33. Kaushal, S.S.; Groffman, P.M.; Likens, G.E.; Belt, K.T.; Stack, W.P.; Kelly, V.R.; Band, L.E.; Fisher, G.T. Increased salinization of fresh water in the northeastern United States. Proc. Natl. Acad. Sci. USA 2005, 102, 13517–13520. [Google Scholar] [CrossRef] [PubMed]
  34. Wilcox, D.A. Water Resources Bulletin. Am. Water Resour. Assoc. 1986, 22, 57–65. [Google Scholar] [CrossRef]
  35. Last, G.V.; Schmick, M.T. Identification and Selection of Major Carbon Dioxide Stream Compositions GV Last MT Schmick; No. PNNL-20493; Pacific Northwest National Lab. (PNNL): Richland, WA, USA, 2011. [Google Scholar]
  36. Sazali, Y.; Sazali, W.; Ibrahim, J.; Dindi, M.; Graham, G.; Gödeke, S. Investigation of high temperature, high pressure, scaling and dissolution effects for Carbon Capture and Storage at a high CO2 content carbonate gas field offshore Malaysia. J. Pet. Sci. Eng. 2018, 174, 599–606. [Google Scholar] [CrossRef]
  37. Yoon, I.-S.; Chang, C.-H. Effect of Chloride on Electrical Resistivity in Carbonated and Non-Carbonated Concrete. Appl. Sci. 2020, 10, 6272. [Google Scholar] [CrossRef]
  38. Liu, W.; Cao, F.; Chen, A.; Chang, L.; Zhang, J.; Cao, C. Effect of Chloride Ion Concentration on Electrochemical Behavior and Corrosion Product of AM60 Magnesium Alloy in Aqueous Solutions. Corrosion 2012, 68, 45001. [Google Scholar] [CrossRef]
  39. Parkhurst, D.L.; Appelo1, C.A.J. User’s Guide to Phreeqc (Version 2) A Computer Program for Speciation, Batch-Reaction, One-Dimensional Transport, and Inverse Geochemical Calculation; USGS: Reston, VA, USA, 1999. [Google Scholar]
  40. Wang, X.; Ye, Y.; Wu, X.; Smyth, J.R.; Yang, Y.; Zhang, Z.; Wang, Z. High-temperature Raman and FTIR study of aragonite-group carbonates. Phys. Chem. Miner. 2019, 46, 51–62. [Google Scholar] [CrossRef]
  41. Dufresne, W.J.; Rufledt, C.J.; Marshall, C.P. Raman spectroscopy of the eight natural carbonate minerals of calcite structure. J. Raman Spectrosc. 2018, 49, 1999–2007. [Google Scholar] [CrossRef]
  42. Wojdyr, M. Fityk: A general-purpose peak fitting program. J. Appl. Crystallogr. 2010, 43, 1126–1128. [Google Scholar] [CrossRef]
  43. Hong, J.; Heo, S.J.; Singh, P. Water mediated growth of oriented single crystalline SrCO3 nanorod arrays on strontium compounds. Sci. Rep. 2021, 11, 3368. [Google Scholar] [CrossRef]
  44. Graf, D.L. Crystallographic Tables for the Rhombohedral Carbonates. Am. Mineral. 1961, 46, 1283–1316. [Google Scholar]
  45. de Villiers, D.M. Crystal Structures of Aragonite, Strontianite, and Witherite. Am. Mineral. 1971, 56, 758–767. [Google Scholar]
  46. Rodriguez-Navarro, C.; Jimenez-Lopez, C.; Rodriguez-Navarro, A.; González-Muñoz, M.T.; Rodriguez-Gallego, M. Bacterially mediated mineralization of vaterite. Geochim. Cosmochim. Acta 2007, 71, 1197–1213. [Google Scholar] [CrossRef]
  47. Alia, J.M.; Diaz De Mera, Y.; Edwards, H.G.M.; Gonzsilez Martin, P.; Andres, L.S. FT-Raman and Infrared Spectroscopic Study of Aragonite-Strontianite (Ca,Sr) Solid Solution. Spectrochim. Acta Part A Mol. Biomol. Spectrosc. 1997, 53, 2347–2362. [Google Scholar] [CrossRef]
  48. Donnelly, F.C.; Purcell-Milton, F.; Framont, V.; Cleary, O.; Dunne, P.W.; Gun’Ko, Y.K. Synthesis of CaCO3nano- and micro-particles by dry ice carbonation. Chem. Commun. 2017, 53, 6657–6660. [Google Scholar] [CrossRef] [PubMed]
  49. DeCarlo, T.M. Characterizing coral skeleton mineralogy with Raman spectroscopy. Nat. Commun. 2018, 9, 5325. [Google Scholar] [CrossRef] [PubMed]
  50. Lin, C.-C.; Liu, L.-G. Post-aragonite phase transitions in strontianite and cerussite—A high pressure Raman spectroscopic study. J. Phys. Chem. Solids 1997, 58, 977–987. [Google Scholar] [CrossRef]
  51. Chang, R.; Kim, S.; Lee, S.; Choi, S.; Kim, M.; Park, Y. Calcium Carbonate Precipitation for CO2 Storage and Utilization: A Review of the Carbonate Crystallization and Polymorphism. Front. Energy Res. 2017, 5, 17. [Google Scholar] [CrossRef]
  52. Gebauer, D.; Völkel, A.; Cölfen, H. Stable Prenucleation Calcium Carbonate Clusters. Science 2008, 322, 1819–1822. [Google Scholar] [CrossRef]
  53. Wada, N.; Yamashita, K.; Umegaki, T. Effects of divalent cations upon nucleation, growth and transformation of calcium carbonate polymorphs under conditions of double diffusion. J. Cryst. Growth 1995, 148, 297–304. [Google Scholar] [CrossRef]
  54. Mergelsberg, S.T.; Riechers, S.L.; Graham, T.R.; Prange, M.P.; Kerisit, S.N. Effect of Cd on the Nucleation and Transformation of Amorphous Calcium Carbonate. Cryst. Growth Des. 2021, 21, 3384–3393. [Google Scholar] [CrossRef]
  55. Liendo, F.; Arduino, M.; Deorsola, F.A.; Bensaid, S. Factors controlling and influencing polymorphism, morphology and size of calcium carbonate synthesized through the carbonation route: A review. Powder Technol. 2022, 398, 117050. [Google Scholar] [CrossRef]
  56. Fernández-Díaz, L.; Fernández-González, A.; Prieto, M. The role of sulfate groups in controlling CaCO3 polymorphism. Geochim. Cosmochim. Acta 2010, 74, 6064–6076. [Google Scholar] [CrossRef]
  57. Mlinarić, N.M.; Kontrec, J.; Džakula, B.N.; Falini, G.; Kralj, D. Role of Hydrodynamics, Li+ Addition and Transformation Kinetics on the Formation of Plate-Like {001} Calcite Crystals. Crystals 2021, 11, 250. [Google Scholar] [CrossRef]
  58. Pastero, L.; Costa, E.; Bruno, M.; Rubbo, M.; Sgualdino, G.; Aquilano, D. Morphology of Calcite (CaCO3) Crystals Growing from Aqueous Solutions in the Presence of Li+ Ions. Surface Behavior of the {0001} Form. Cryst. Growth Des. 2004, 4, 485–490. [Google Scholar] [CrossRef]
  59. Aquilano, D.; Bruno, M.; Pastero, L. Impurity Effects on Habit Change and Polymorphic Transitions in the System: Aragonite–Calcite–Vaterite. Cryst. Growth Des. 2020, 20, 2497–2507. [Google Scholar] [CrossRef]
  60. Matijaković, N.; Magnabosco, G.; Scarpino, F.; Fermani, S.; Falini, G.; Kralj, D. Synthesis and Adsorbing Properties of Tabular {001} Calcite Crystals. Crystals 2019, 9, 16. [Google Scholar] [CrossRef]
  61. Füger, A.; Konrad, F.; Leis, A.; Dietzel, M.; Mavromatis, V. Effect of growth rate and pH on lithium incorporation in calcite. Geochim. Cosmochim. Acta 2019, 248, 14–24. [Google Scholar] [CrossRef]
  62. Zhang, D.-K.; Zhou, X.-Q.; Liu, C.-L.; Lu, G.-M. Crystallization of calcium carbonate from lithium-containing brines. J. Cryst. Growth 2020, 556, 125989. [Google Scholar] [CrossRef]
  63. Devriendt, L.; Mezger, E.; Olsen, E.; Watkins, J.; Kaczmarek, K.; Nehrke, G.; de Nooijer, L.; Reichart, G.-J. Sodium incorporation into inorganic CaCO3 and implications for biogenic carbonates. Geochim. Cosmochim. Acta 2021, 314, 294–312. [Google Scholar] [CrossRef]
  64. Wehrmeister, U.; Soldati, A.L.; Jacob, D.E.; Häger, T.; Hofmeister, W. Raman spectroscopy of synthetic, geological and biological vaterite: A Raman spectroscopic study. J. Raman Spectrosc. 2009, 41, 193–201. [Google Scholar] [CrossRef]
  65. Yin, X.; Wang, X.; Wu, H.; Ohnuki, T.; Takeshita, K. Enhanced desorption of cesium from collapsed interlayer regions in vermiculite by hydrothermal treatment with divalent cations. J. Hazard. Mater. 2017, 326, 47–53. [Google Scholar] [CrossRef] [PubMed]
  66. Ishikawa, N.K.; Kuwata, M.; Ito, A.; Umita, T. Effect of pH and Chemical Composition of Solution on Sorption and Retention of Cesium by Feldspar, Illite, and Zeolite as Cesium Sorbent from Landfill Leachate. Soil Sci. 2017, 182, 1. [Google Scholar] [CrossRef]
  67. Cornell, R.M. Adsorption of cesium on minerals: A review. J. Radioanal. Nucl. Chem. 1993, 171, 483–500. [Google Scholar] [CrossRef]
  68. Curti, E. Coprecipitation of radionuclides with calcite: Estimation of partition coefficients based on a review of laboratory investigations and geochemical data. Appl. Geochem. 1999, 14, 433–445. [Google Scholar] [CrossRef]
  69. Fujikawa, Y.; Fukui, M. Radionuclide Sorption to Rocks and Minerals: Effects of pH and Inorganic Anions. Part 1. Sorption of Cesium, Cobalt, Strontium and Manganese. Radiochim. Acta 1997, 76, 153–162. [Google Scholar] [CrossRef]
  70. Kim, Y.; Kwon, S.; Roh, Y. Effect of Divalent Cations (Cu, Zn, Pb, Cd, and Sr) on Microbially Induced Calcium Carbonate Precipitation and Mineralogical Properties. Front. Microbiol. 2021, 12, 646748. [Google Scholar] [CrossRef]
  71. Sunagawa, I.; Takahashi, Y.; Imai, H. Strontium and aragonite-calcite precipitation. J. Mineral. Pet. Sci. 2007, 102, 174–181. [Google Scholar] [CrossRef]
  72. Wasylenki, L.E.; Dove, P.M.; Wilson, D.S.; De Yoreo, J.J. Nanoscale effects of strontium on calcite growth: An in situ AFM study in the absence of vital effects. Geochim. Cosmochim. Acta 2005, 69, 3017–3027. [Google Scholar] [CrossRef]
Figure 1. pH evolution of the solutions during reaction time for (a) Ion-chloride experimental set-up: reactions using MCl salts; (b) Ion-carbonate experimental set-up: reaction using MCO3 salts. M: Sr2+, Li+, and Cs+ cations.
Crystals 13 00796 g001
Figure 2. Solution composition during reaction time for ion-chloride (MCl) and ion-carbonate (MCO3) experimental set-ups (M: Sr2+, Li+, and Cs+). Total calcium (Ca) concentration in aqueous solution (a) for control and lithium (Li) systems (b). Total Ca concentration (c) for control and strontium (Sr) systems (d). Total Ca concentration (e) for control and cesium (Cs) systems. It should be noted that Cs was not represented due to the low concentration, under the detection limits of the equipment (<0.06 ppm). Theoretical concentration values of the elements represented at the initial reaction (i.e., time zero) are equivalent to 25 mM.
Crystals 13 00796 g002
Figure 3. XRD patterns obtained for the two experimental set-ups at the end of the reaction time (30 days–720 h). (a) Mineral phases identified in the experimental set-up using as ion-chloride (Cl) forms during carbonate phase precipitation. Calcite (CaCO3) was precipitated in all runs (control, Li, and Cs systems), except strontianite (SrCO3) in the experiment using Sr salt. (b) Mineral phases identified in the experimental set-up using ion-carbonate (CO32−) forms during carbonate phase precipitation. The reactions with Na-control-, Li, and Cs systems showed the formation of calcite, while Sr corresponded to strontianite. Note the strontianite sample with the chlorine source (i.e., SrCl2) shows a more dispersed XRD pattern (higher peak broadening) compared to the corresponding carbonate form.
Crystals 13 00796 g003
Figure 4. TEM results of the reaction between CaCl2 + Na2CO3 + SrCl. (a) High-angle annular dark-field imaging (HAADF) image of the mineral precipitates after 720 h reaction time (1 month). (b) EDS elemental analyses areas of the previous HAADF image showing the main CaKα and CaKβ peaks: Area #1: green spectrum and Area #2: blue spectrum. (c) TEM image of the results of the product phases (Strontianite: dashed red line -Str- and Calcite: dashed blue line -Cal-). The inset shows the SAED pattern, in which the coexistence of calcite and strontianite is observed.
Crystals 13 00796 g004
Figure 5. TEM results of the reaction between CaCl2 + Na2CO3 + LiCl. (a) HAADF image combined with EDS elemental maps of the precipitate results after 720 h reaction time (1 month). (b) EDS elemental analyses of the previous HAADF image showing the main CaKα and CaKβ peaks: Area #1: green spectrum and Area #2: blue spectrum. (c) TEM micrograph of the results of the product phases. The inset shows the SAED pattern, in which the coexistence of calcite and vaterite is observed.
Crystals 13 00796 g005
Figure 6. Raman spectra of calcite and strontianite minerals formed Sr, Li, and Cs experiments in the experimental stage at 720 h for (a) chloride anion form and (b) carbonate forms.
Crystals 13 00796 g006
Figure 7. Example of the Raman spectral fitting of the symmetric stretching ν1 region (1050–1100 cm−1) of calcite (a) and strontianite (b) showing the adjustment procedure performed with FITYK software (Split-Voight function).
Crystals 13 00796 g007
Table 1. Results of the quantitative Rietveld analyses vs experimental times for the control and the different carbonate and chloride experimental set-ups (Cs, Li, and Sr salts).
TimeSampleCalciteVateriteAragoniteStrontianite
24 hCaCl2 + Na2CO379.320.7--
CaCl2 + Na2CO3 + CsCl100---
CaCl2 + Cs2CO3100---
CaCl2 + Na2CO3 + LiCl8.191.9--
CaCl2 + Li2CO33.896.2--
CaCl2 + Na2CO3 + SrCl2---100
CaCl2 + SrCO3--4.895.2
48 hCaCl2 + Na2CO3100---
CaCl2 + Na2CO3 + CsCl100---
CaCl2 + Cs2CO3100---
CaCl2 + Na2CO3 + LiCl16.383.7--
CaCl2 + Li2CO324.675.4--
CaCl2 + Na2CO3 + SrCl23.9--96.1
CaCl2 + SrCO3---100
1 weekCaCl2 + Na2CO3100---
CaCl2 + Na2CO3 + CsCl100---
CaCl2 + Cs2CO3100---
CaCl2 + Na2CO3 + LiCl40.959.1--
CaCl2 + Li2CO363.136.9--
CaCl2 + Na2CO3 + SrCl25.6--94.4
CaCl2 + SrCO3---100
1 monthCaCl2 + Na2CO3100---
CaCl2 + Na2CO3 + CsCl100---
CaCl2 + Cs2CO3100---
CaCl2 + Na2CO3 + LiCl100---
CaCl2 + Li2CO3100---
CaCl2 + Na2CO3 + SrCl27.5--92.5
CaCl2 + SrCO3---100
Table 2. Values of a and c lattice parameters for calcite and vaterite (rhombohedral crystal symmetry; a = b = c/α = β = γ ≠ 90°) and a, b and c lattice parameters for strontianite and aragonite (orthorhombic crystal symmetry; a ≠ b ≠ c/α = β = γ = 90°). Lattice parameters values are given in Å and time interval ranging from 24 h to 720 h. Error based on standard deviation of the measured samples are marked in brackets.
24 h48 h168 h720 h
MineralExperimentac ac ac ac
Calcite
rhombohedral
CaCl2 + Na2CO34.9893 (3)17.0545 (1) 4.9909 (9)17.0634 (5) 4.9913 (6)17.0652 (1) 4.9910 (6)17.0589 (1)
CaCl2 + Na2CO3 + CsCl4.9903 (4)17.0625 (1) 4.9912 (2)17.0663 (1) 4.9910 (6)17.0647 (8) 4.9902 (7)17.0651 (6)
CaCl2 + Cs2CO3 4.9902 (1)17.0601 (7) 4.9907 (2)17.0635 (9) 4.9911 (8)17.0633 (3) 4.9924 (9)17.0591 (7)
CaCl2 + Na2CO3 + LiCl4.9902 (1)17.0648 (7) 4.9910 (5)17.0670 (9) 4.9915 (1)17.0702 (1) 4.9894 (5)17.0649 (9)
CaCl2 + Li2CO34.9928 (2)17.0729 (2) 4.9901 (5)17.0627 (4) 4.9909 (4)17.0658 (5) 4.9913 (2)17.0646 (3)
CaCl2 + Na2CO3 + SrCl2 4.9798 (4)17.0838 (3) 4.9878 (3)17.0755 (5) 4.9880 (6)17.0679 (2)
CaCl2 + SrCO3
Vaterite
rhombohedral
CaCl2 + Na2CO34.1284 (9)8.4665 (4)
CaCl2 + Na2CO3 + LiCl4.1307 (3)8.4771 (9) 4.1278 (3)8.4706 (1) 4.1296 (5)18.4712 (6)
CaCl2 + Li2CO34.1295 (9)8.4751 (8) 4.1299 (5)8.4745 (1) 4.1300 (7)8.4730 (1)
abcabcabcabc
Strontianite
orthorhombic
CaCl2 + SrCO3 6.0336 (1)5.1075 (2)8.4249 (1)6.0322 (7)5.1068 (7)8.4217(6)6.0324 (5)5.1070 (2)8.4213(4)6.0328 (6)5.1074 (1)8.4213 (1)
CaCl2 + Na2CO3 + SrCl25.8708 (6)4.8469 (3)8.5898 (9)5.8743 (7)4.9647 (4)8.3744(2)5.9563 (1)5.0449 (4)8.3225(4)5.9478 (5)5.0175 (5)8.3908 (9)
Aragonite
orthorhombic
CaCl2 + Na2CO3 + SrCl26.0275 (6)4.7251 (7)7.8750 (8)
Table 3. Raman band positions and FWHM values (wavenumber in cm−1) of the ν1 stretching modes of the carbonates considering the experimental time at 720 h.
SampleCalcite ν1Strontianite ν1
Band Position FWHMBand Position FWHM
CaCl2 + Na2CO31083.0 (7)10.3 (8)--
CaCl2 + Na2CO3 + CsCl1083.4 (1)11.0 (4)--
CaCl2 + Cs2CO31081.7 (3)10.5 (2)--
CaCl2 + Na2CO3 + LiCl1086.0 (1)10.9 (1)--
CaCl2 + Li2CO31084.3 (4)10.7 (8)--
CaCl2 + Na2CO3 + SrCl2--1071.1 (6)12.5 (1)
CaCl2 + SrCO3--1070.0 (1)10.8 (3)
Disclaimer/Publisher’s Note: The statements, opinions and data contained in all publications are solely those of the individual author(s) and contributor(s) and not of MDPI and/or the editor(s). MDPI and/or the editor(s) disclaim responsibility for any injury to people or property resulting from any ideas, methods, instructions or products referred to in the content.

