
In Silico Interactome of a Room-Temperature Ferroelectric Nematic Material


1
School of Physics and Astronomy, University of Leeds, Leeds LS2 9JT, UK
2
School of Chemistry, University of Leeds, Leeds LS2 9HT, UK
Crystals 2023, 13(6), 857; https://doi.org/10.3390/cryst13060857
Submission received: 2 May 2023
/
Revised: 16 May 2023
/
Accepted: 18 May 2023
/
Published: 23 May 2023
(This article belongs to the Special Issue Nematic Liquid Crystal)
Abstract
:The ferroelectric nematic (NF) phase, characterised by the combination of orientational and polar order, offers unique properties that are challenging to replicate in other systems. Understanding the molecular structure requirements for generating the NF phase is crucial for the design of new materials with enhanced properties. This study investigates UUQU-4-N, a room-temperature NF material, using fully atomistic molecular dynamics simulations. UUQU-4-N does not spontaneously form an apolar nematic phase in silico, but exhibits a stable polar nematic configuration akin to the NF phase. The polar order remains significant and near saturation throughout the simulations. The study also examines the cylindrical pair correlation functions, providing insights into the preferred pairing modes and intermolecular interactions which we can then attribute to specific molecular features. We then simulate structural variants of UUQU-4-N, highlighting the potential for developing further examples of near-room-temperature ferroelectric nematic materials via the manipulation of the fluorination pattern, variations in terminal chain length, and replacement of the difluoromethyleneoxy linker.
1. Introduction
The nematic phase (N) is the simplest liquid crystal phase, and features molecules which have some sort of shape anisotropy (rods, disks, etc.) and are positionally disordered with some degree of orientational order along a common direction known as the director. The ferroelectric nematic (NF) phase is the most recently discovered nematic phase variant, in which the orientational order of the ‘classical’ nematic phase is augmented with a polar order [1,2,3,4,5]. This polar order endows the NF phase—and the materials that exhibit it—with remarkable properties, the combination of which is difficult if not impossible to replicate in other systems [6,7,8,9]. The design of new molecules and materials that exhibit the NF phase is in its earliest stages; from Refs. [10,11,12,13,14,15,16,17,18,19,20,21,22,23], we know little about how molecular structure generates this phase, with the majority of materials known to exhibit it being derivatives of either RM734 [11] or DIO [24]. It stands to reason that, if we understood which parts of a molecule’s structure are key for generating the NF phase, we would be able to synthesise ‘better’ materials with (relative) ease.
The material known as UUQU-4-N (Figure 1) [25] is an interesting example of an NF material which does not derive from RM734/DIO. UUQU-4-N is heavily fluorinated, with the fluorination pattern (and also the difluoromethoxy and nitrile units) contributing to a large molecular electric dipole moment of circa 11 Debye (supra vide). Experimentally, UUQU-4-N exhibits a direct isotropic-to-NF transition which occurs around room temperature; if—in some hypothetical descendent material of UUQU-4-N—the clearing point could be increased slightly (~30 °C) and the melting point brought down by a similar magnitude, then one might expect a bona fide single-component near-room-temperature NF material—in effect, something akin to the 5CB of NF research.
2. Method
Simulation Setup and Analysis
Fully atomistic molecular dynamics (MD) simulations were performed in Gromacs 2019 [26,27,28,29,30,31,32]. The ferroelectric nematic material UUQU-4-N (Figure 1) and its variants (vide supra) were modelled using the General Amber Force Field (GAFF) [33]. Atomic charges were determined using the RESP method [34] for geometries optimised at the B3LYP/6–31G(d) level of DFT [35,36] using the Gaussian G09 revision d01 software package [37]. Topologies were generated using AmberTools 16 [38,39] and converted into Gromacs readable format with Acpype [40].
We initially constructed a low-density lattice of 1000 molecules of UUQU-4-N with random positional and orientational order (500 molecules for variants). Following energy minimization by the steepest decent method, we performed short (5 ns) equilibration simulations in the NVE and NVT (T = 600 K) ensembles. We then performed a short ‘compression’ simulation (25 ns) at 600 K with an isotropic barostat (P = 100 Bar) to compress the simulation to a liquid-like density (~1.1 g cm3). The resulting isotropic configuration was then used as a starting configuration for apolar nematic simulations (UUQU-4-N only).
We obtained a polar nematic configuration by applying a static electric field (1 V nm−1) along the x-axis of the isotropic starting configuration for a total of 100 ns at 288 K and 1 Bar. The resulting configuration was then used as the starting configuration for all polar nematic simulations (UUQU-4-N and variants).
For production MD simulations of UUQU-4-N—both apolar or polar—we used an anisotropic barostat with a pressure of 1 Bar, at temperatures of 258–348 K in 10 K increments for a further 1 μs, unless otherwise noted. For variants, we performed production MD simulations starting from the polar configuration only; we perform simulations for 250 ns at 10 K above and below the simulated TNf-Iso of UUQU-4-N.
Simulations employed periodic boundary conditions in xyz. Bonds’ lengths were constrained to their equilibrium values with the LINCS algorithm [41]. During production MD simulations, the system pressure was maintained at 1 Bar using an anisotropic Parrinello–Rahman barostat [42,43]. Compressibilities in xyz dimensions were set to 4.5 × 10⁻⁵, with the off-diagonal compressibilities set to zero to ensure the simulation box remained rectangular. Simulation temperature was controlled with a Nosé–Hoover thermostat [44,45]. Long-range electrostatic interactions were calculated using the Particle Mesh Ewald method with a cut-off value of 1.2 nm. A van der Waals cut-off of 1.2 nm was used. MD trajectories were visualised using PyMOL 4.5. Q-tensor analysis was performed using MDTraj 1.9.8 [46]. Cylindrical distribution functions (CDF) were computed using the cylindr code. [47] Simulation densities, dipole moments, and volumes were obtained with the gmx energy program, with dipole and volume being used to compute spontaneous polarisation.
We judged a simulation to be ‘nematic’ when the second-rank orientational order parameter (<P2>) takes a value of >0.3, and, conversely, we judge it isotropic if <P2> is below this value. We calculate <P2> via the Q-tensor according to Equation (1):
where N is the number of monomers; m is the monomer number within a given simulation; α and β represent the Cartesian x, y, and z axes; delta is the Kronecker delta; and a is a vector that describes the molecular long axis, which is computed for each monomer as the eigenvector associated with the smallest eigenvalue of the inertia tensor. The director at each frame was defined as the eigenvector associated with the largest eigenvalue of the ordering tensor. The order parameter, <P2>, corresponds to the largest eigenvalue of , and the biaxial order parameter, <Β>, corresponds to the difference between the two smallest eigenvalues. The polar order parameter, <P1>, was calculated as the total dipole moment of the simulation box over the sum of the individual molecular dipoles. The polarization, P, was calculated from the total dipole of the box over the volume.
3. Results
We start by considering apolar simulations that begin from an isotropic starting configuration. We find that UUQU-4-N does not spontaneously form a classical apolar nematic phase during MD simulations at any of the temperature ranges studied (278–358 K, Table S1). We also performed simulations beginning from a pseudo-nematic starting configuration at a temperature of 288 K; however, the orientational order decays within a few hundred nanoseconds to give an isotropic liquid (Figure S1).
For the polar simulations, our initial starting configuration was obtained by application of a large (0.1 V nm−1) static electric field parallel to the simulation x-axis at a temperature of 288 K; this yields a polar nematic phase with <P2> of 0.73 ± 0.02, <P1> = 0.95 ± 0.03, and <B> = 0.01 ± 0.01. The large values of <P1> and <P2> here are sustained by the applied field; we remove the field and perform a short relaxation simulation at the same temperature for 10 ns, after which we obtain <P2> of 0.71 ± 0.03, <P1> = 0.93 ± 0.04, and <B> = 0.01 ± 0.02. From this configuration, we studied the evolution of each order parameter at a range of temperatures (258–358 K, 10 K increments). Plots of simulation order parameters (<P1>, <P2>, and <B>), density, and spontaneous polarisation as a function of temperature are given in Figure 2; tabulated data are given in the Supplementary Materials to this article (Table S1).
Examination of the behaviour of both the polar (<P1>) and orientational (<P2>) order parameters as a function of temperature shows that, above a temperature of 318 K, the simulations evolve into an isotropic liquid; below this, <P2> is consistent with the nematic order. The value at 318 K is a borderline case, and is on the cusp of being nematic (or isotropic, depending on perspective), and we suggest that this is the clearing point of our simulation. It should be noted that the present simulations overestimate the clearing point; recall that the experimental value for UUQU-4-N is 293 K.
The polar order parameter (<P1>) remains large and near-saturated in simulations at and below the clearing point. We do not observe transformation from polar to apolar nematic at any point, which indicates that the head-to-tail flipping of molecules is largely arrested. In all cases, the biaxial order parameter (<B>) is negligible. There is a subtle increase in density at the Iso–NF transition which results from the enhanced packing in the polar nematic configuration. Lastly, the large values of <P1> coupled with a high density and large molecular electric dipole moment conspire to generate giant values of spontaneous polarisation which are comparable in magnitude to RM734, both experimental and in silico. We consider that these simulations are a reasonable approximation of the experimental reality of the NF phase of UUQU-4-N.
Cylindrical Pair Correlation Functions
The cylindrical pair correlation function (CDF) is related to the commonly encountered radial distribution function, differing in its use of cylindrical rather than spherical shells. The CDF gives information on anisotropic positional correlations between molecules, and can be used for ‘inverse design’ by revealing specific intermolecular interactions which may be of interest. Briefly, the CDF is computed by finding adjacent molecular centres of mass in cylindrical bins. This analysis is conducted over some range of cylinder length (denoted as h) and radius (denoted as r), for all time steps in the simulation. At each time step, the cylinder length is reoriented to be parallel to the nematic director.
We computed the CDF for polar nematic simulations in the temperature range 258 K to 338 K, i.e., from deep into the NF phase (T < 318 K) to close to the NF-Iso transition (T = 318 K) and finally into the isotropic liquid (T > 318 K).
We start by considering the NF phase, the CDF of which presents as a concentric set of arc-like feature which result from preferred pairing modes. As can be seen in Figure 3, there are two major overlapping arc-like features located on the axis (i.e., r~0 Å) at h = ±~18–22 Å, which result from head-to-tail pairing. The major off-axis feature is a pair of lobes at r~5 Å and h~±5 Å, indicating a preference for staggered parallel pairs of molecules; additional off-axis arcs centred on r~5 Å (at h~±10 Å and h~±13 Å) result from analogous pairing modes with increased longitudinal intermolecular separation. As the temperature is increased, the features become less well-defined; for example, at a temperature of 288 K, we find two lobes at r~5.5 Å and h~± 5 Å, which converge to a single feature by 318 K.
Contrast this with the isotropic phase, where the only observed feature is a diffuse circle centred at h = r = 0 with radius ~8 Å, which results from the spatial proximity of the nearest neighbours. In both isotropic and polar nematic configurations, we find a region of zero probability centred at h = r = 0 Å, which results from steric repulsion.
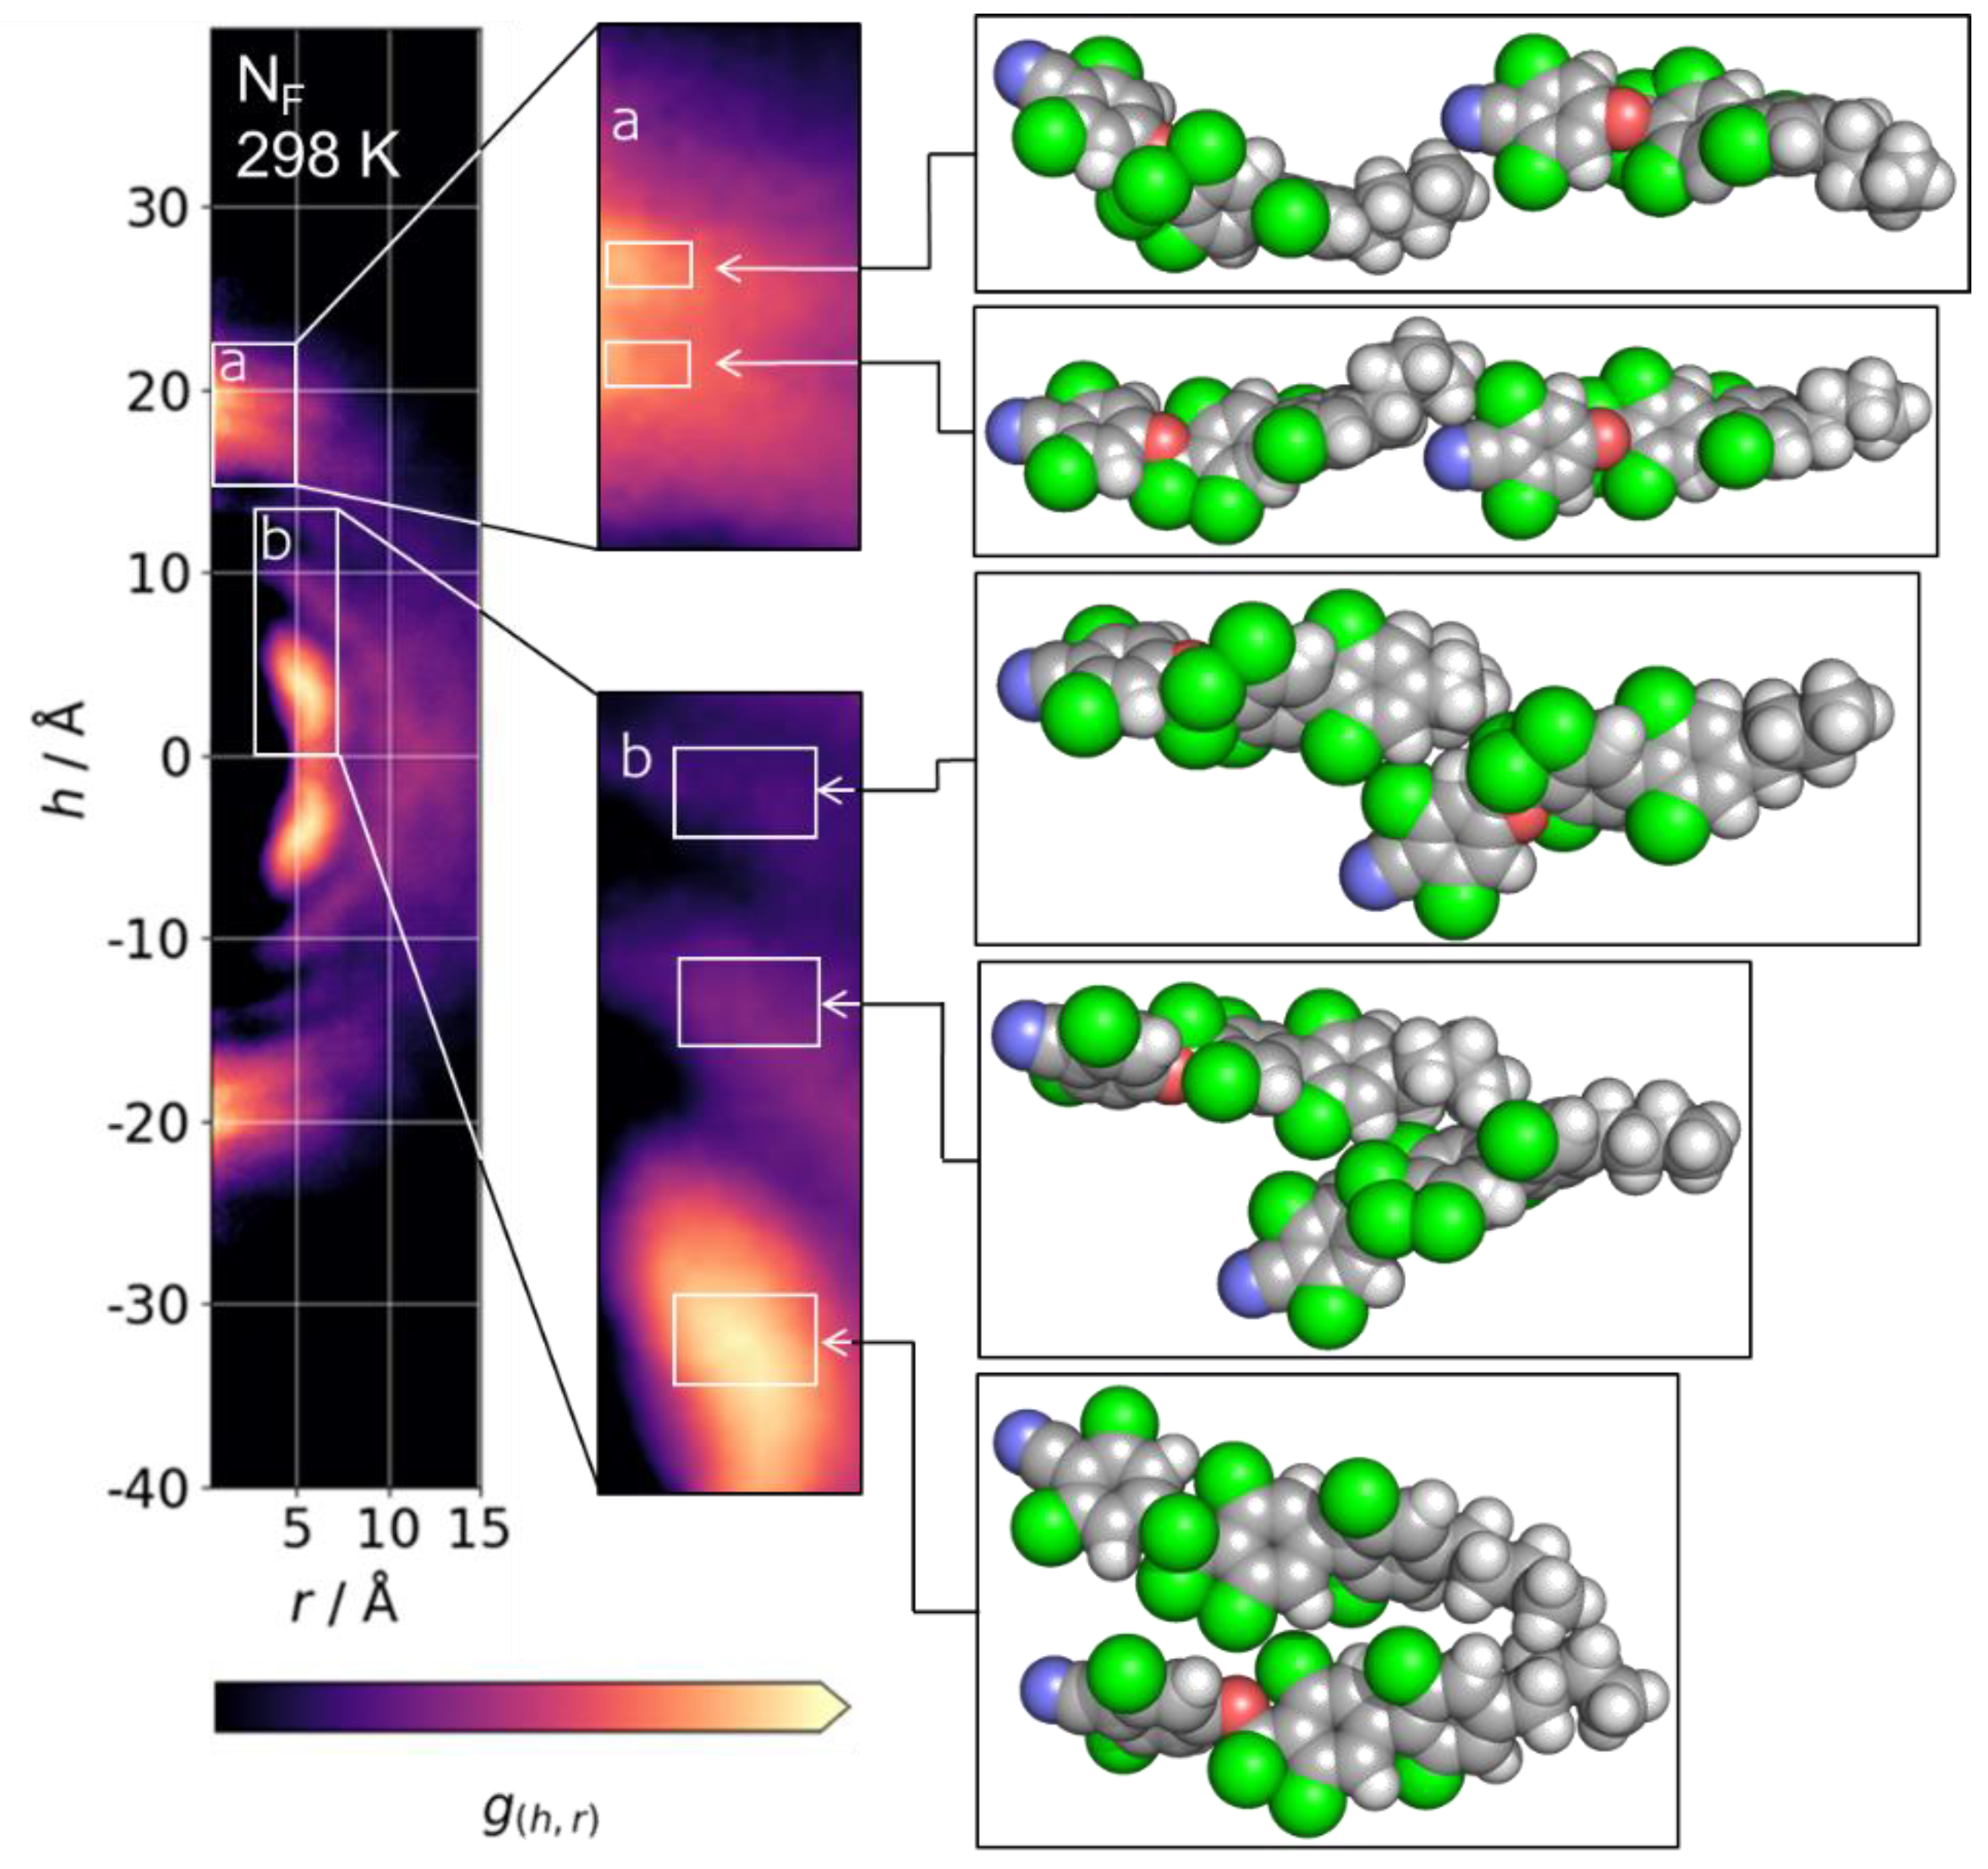
Next, we extract the molecular indices and time steps for a given feature present in the CDF at some spatial region, enabling us to visualise representative instantaneous configurations for a given CDF region (Figure 4). Starting with the on-axis peaks located at h = ±~18–22 Å, we find that the multiplicity of features that result from head-to-tail pairs has its origins in the conformation of the terminal chain. For h = ±21–22 Å, the butyl chain is predominantly in its all-trans form, whereas there is, predominantly, a single gauche conformer for the second major peak at h = ±18–19 Å.
In the case of h = ±21–22 Å, the head/tail of the mesogenic units of the interacting molecules are ~1.1 nm apart (distance between any non-alkyl atoms, averaged over all pairs in selection). At this separation, we can calculate that, with a dipole moment of circa 11 Debye (the average over the entire simulation) and an average angle between molecules of 30° (calculated from <P2> = 0.622 at 298 K), the dipole–dipole interaction strength is small (~4.8 kJ mol−1) and not much larger than KBT. The presence of a single gauche conformer allows the mesogenic units of the pair to be closer; at h = ±18–19 Å, the separation between cores is just 0.7 nm on average which, using the same values as above, gives a dipole–dipole interaction strength of ~18.5 kJ mol−1.
The presence of alkyl chains in UUQU-4-N causes longitudinal separation, weakening the dipole–dipole interactions. This is partly overcome by conformational effects, with a single gauche conformer enabling a proximal head-to-tail interaction which enables a polar order to take hold. For chains longer than butyl, the alkyl chain is akin to a spacer between molecules, separating to the point that the dipole–dipole interactions that generate a polar order cannot manifest. Experiments demonstrated that increased terminal chain length suppresses the incidence of the NF phase some time ago, and our results here provide an explanation for this behaviour.
With regard to off-axis arcs, there are three prominent features centred at r~5 Å and with h in the range (±) 5–15 Å; these result from staggered side-by-side pairs of molecules, with the major feature being the lobes at ~±5 Å. Weaker features are seen at h~±10 and ±14. Each of these side-by-side configurations results from the electrostatic interaction of ArF atoms with ArH.
For RM734 (and related materials), intermolecular interactions between carboxylate esters appear to be a driver of polar order [2,3], with the loss of this group generally eliminating the NF phase [11]. UUQU-4-N bears a difluoromethyleneoxy (CF2O) linker; however, we do not see features in the CDF that result from analogous interactions between CF2O groups. The replacementof the CF2O group in UUQU-4-N with a carboxylate ester might therefore give a modest increase in the onset temperature of the NF phase by introducing an additional intermolecular interaction capable of supporting a polar order, with this presumably being at the cost of an increased melting point.
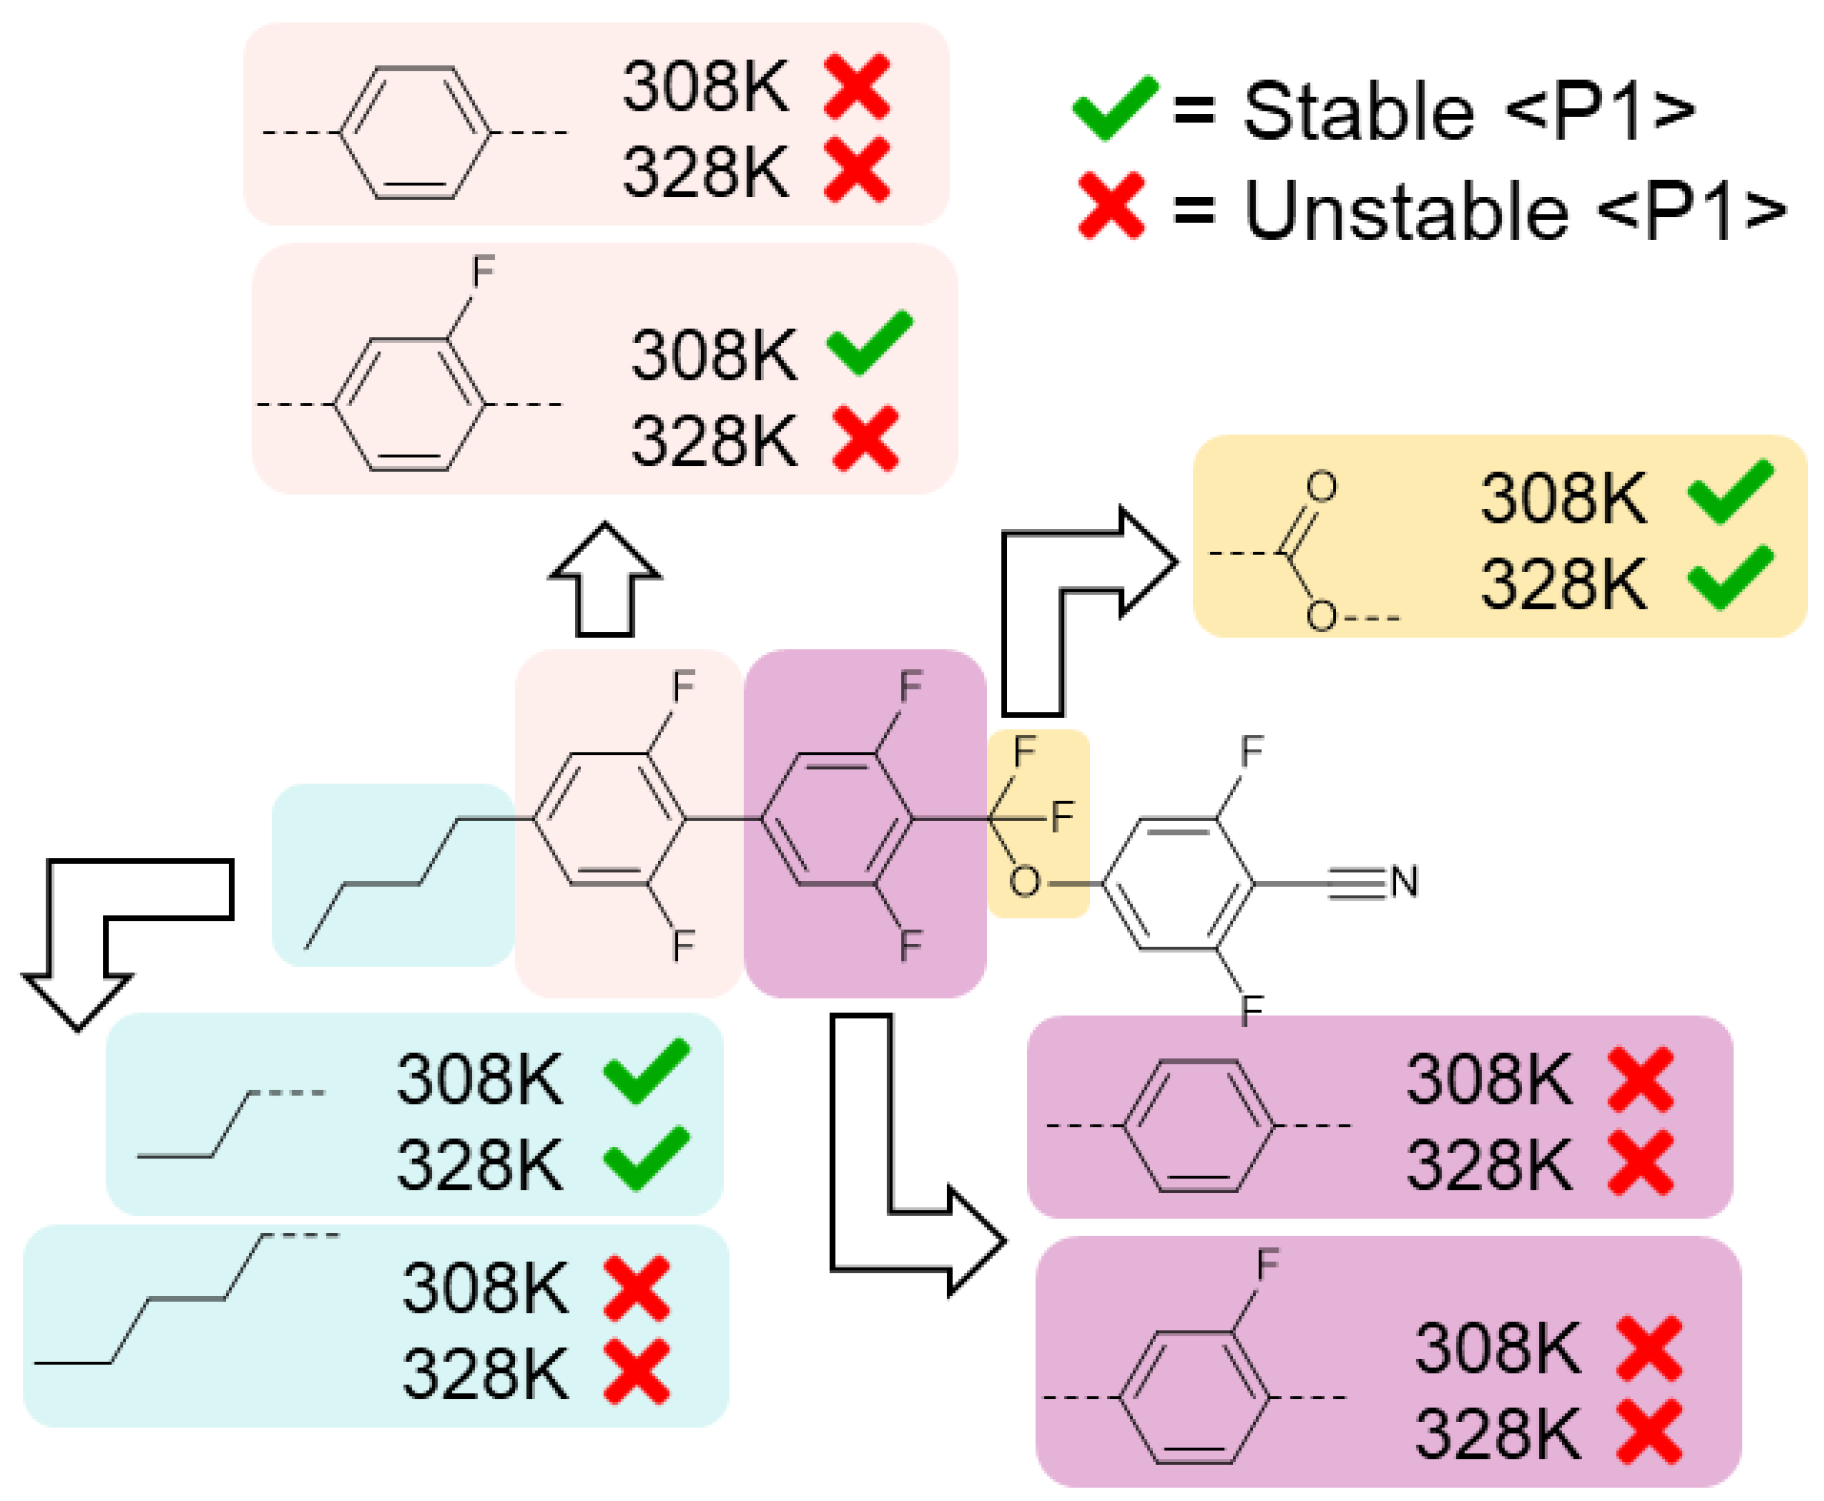
Next, we simulated variants of UUQU-4-N in which we make changes to explore how these alter the relative stability of the polar nematic ordering. Specifically, we sought to investigate: the effects of altering the alkyl chain length; the effect of replacing the CF2O group with CO2; and the effect on altering the fluorination pattern on the mesogenic core (Figure 5).
Firstly, we replaced one of the difluorobenzene rings of the biphenyl fragment of UUQU-4-N with either fluorobenzene or benzene, giving four variant materials (GUQU-4-N, PUQU-4-N, UGQU-4-N, and UPQU-4-N). We also generated a variant in which we replaced the difluoromethoxy linker with a carboxylate ester (a.k.a. UUZU-4-N), and two variants with either a propyl or pentyl chain in lieu of the butyl chain of the parent material (UUQU-3-N and UUQU-5-N, respectively). For each structure, we generated GAFF parameters with RESP charges as described for UUQU-4-N, with the initial MD configurations of 500 molecules then subjected to the same energy minimisation and equilibration protocols. We obtain polar nematic configurations by applying a static electric field. Finally, we perform a 250 ns production MD simulation at temperatures of 308 K and 328 K, i.e., 10 K above and below the simulated NF–Iso point in the parent material. If the variant exhibits a stable polar nematic order at 328 K, it has an enhanced propensity to generate an NF phase relative to the parent, with the inverse argument being true of variants whose polar nematic ordering decays to an isotropic liquid at 308 K. We judge a phase as stable when its polar order parameter (<P1>) does not vary by more than 10% from its initial value (which was >0.9 in all cases).
For virtually all variants, the polar nematic order was found to decay to an isotropic liquid within the first 50 ns of the simulation. The replacement of the CF2O group with an ester appears to increase the clearing point; i.e., the thermal stability of the NF phase is enhanced. Similarly, shortening the terminal chain from butyl to propyl also increases the clearing point, with the 328 K simulation retaining its polar order; however, the corresponding increase to pentyl eliminates polar ordering. Altering the fluorination pattern on the core eliminated the NF phase in all but one case; the loss of a fluorine atom from the first ring appears to be tolerated, albeit with a reduction in clearing point.
4. Conclusions
UUQU-4-N is a remarkable material with a monotropic room-temperature NF phase. Atomistic MD simulations can competently reproduce a stable polar nematic configuration, albeit with a slight overestimation in the isotropisation temperature. An analysis of the anisotropic cylindrical correlation function reveals how polar-pair formation persists in spite of the longer-than-optimal terminal chain length, and largely results from the interaction between regions of opposite electrostatic potential. It is found that, in silico, it is possible to boost the NF transition temperature and give materials which might be somewhat more practical for experimental work. However, the simulations as performed here give no indication of the likely melting point of these materials, which may render them less practical than the parent material. Ordinarily, the extension of the alkyl chain length would be a convenient way to engineer the melting and clearing points of a liquid crystal; however, we have shown that the propensity of alkyl chains of even modest length to disrupt the polar ordering of the NF phase suggests this approach is futile in the present case.
Supplementary Materials
The following supporting information can be downloaded at: https://www.mdpi.com/article/10.3390/cryst13060857/s1, Figure S1: Plot of <P2> as a function of simulation time (ps) for an MD simulation of UUQU-4-N beginning from a pseudo-nematic starting configuration at a temperature of 288 K; Figure S2: Schematic overview of the CDF process; Figure S3: Evolution of the CDF over time; Table S1: Orientational order parameter (<P2>) and simulation density (g cm3) as a function of temperature for simulations beginning from an isotropic initial configuration. Regardless of the temperature employed, nematic order fails to spontaneously emerge; Table S2: Tabulated data for key properties of atomistic simulations of UUQU-4-N beginning in a polar nematic configuration.
Funding
UK Research and Innovation (UKRI) via a Future Leaders Fellowship, grant no. MR/W006391/1.
Data Availability Statement
The data associated with this paper are openly available from the University of Leeds Data Repository at https://doi.org/10.5518/1355 (accessed on 22 May 2023).
Acknowledgments
R.J.M. gratefully acknowledges funding from UK Research and Innovation (UKRI) via a Future Leaders Fellowship, grant no. MR/W006391/1, and from the University of Leeds via a University Academic Fellowship. Computational work was undertaken on ARC4, part of the high-performance computing facilities at the University of Leeds, UK.
Conflicts of Interest
The authors declare no conflict of interest.
References
- Mertelj, A.; Cmok, L.; Sebastian, N.; Mandle, R.J.; Parker, R.R.; Whitwood, A.C.; Goodby, J.W.; Copic, M. Splay nematic phase. Phys. Rev. X 2018, 8, 041025. [Google Scholar] [CrossRef]
- Chen, X.; Korblova, E.; Dong, D.; Wei, X.; Shao, R.; Radzihovsky, L.; Glaser, M.A.; Maclennan, J.E.; Bedrov, D.; Walba, D.M.; et al. First-principles experimental demonstration of ferroelectricity in a thermotropic nematic liquid crystal: Polar domains and striking electro-optics. Proc. Natl. Acad. Sci. USA 2020, 117, 14021–14031. [Google Scholar] [CrossRef] [PubMed]
- Mandle, R.J.; Sebastián, N.; Martinez-Perdiguero, J.; Mertelj, A. On the molecular origins of the ferroelectric splay nematic phase. Nat. Commun. 2021, 12, 4962. [Google Scholar] [CrossRef]
- Kikuchi, H.; Matsukizono, H.; Iwamatsu, K.; Endo, S.; Anan, S.; Okumura, Y. Fluid layered ferroelectrics with global c∞v symmetry. Adv. Sci. 2022, 9, 2202048. [Google Scholar] [CrossRef]
- Chen, X.; Martinez, V.; Nacke, P.; Korblova, E.; Manabe, A.; Klasen-Memmer, M.; Freychet, G.; Zhernenkov, M.; Glaser, M.A.; Radzihovsky, L. Observation of a uniaxial ferroelectric smectic a phase. arXiv 2022, arXiv:2206.12965. [Google Scholar] [CrossRef] [PubMed]
- Sebastian, N.; Cmok, L.; Mandle, R.J.; de la Fuente, M.R.; Drevensek Olenik, I.; Copic, M.; Mertelj, A. Ferroelectric-ferroelastic phase transition in a nematic liquid crystal. Phys. Rev. Lett. 2020, 124, 037801. [Google Scholar] [CrossRef] [PubMed]
- Folcia, C.L.; Ortega, J.; Vidal, R.; Sierra, T.; Etxebarria, J. The ferroelectric nematic phase: An optimum liquid crystal candidate for nonlinear optics. Liq. Cryst. 2022, 49, 899–906. [Google Scholar] [CrossRef]
- Sebastian, N.; Mandle, R.J.; Petelin, A.; Eremin, A.; Mertelj, A. Electrooptics of mm-scale polar domains in ferroelectric nematic phase. Liq. Cryst. 2021, 48, 2055–2071. [Google Scholar] [CrossRef]
- Máthé, M.T.; Buka, Á.; Jákli, A.; Salamon, P. Ferroelectric nematic liquid crystal thermo-motor. arXiv 2022, arXiv:2201.07556. [Google Scholar]
- Mandle, R.J.; Cowling, S.J.; Goodby, J.W. A nematic to nematic transformation exhibited by a rod-like liquid crystal. Phys. Chem. Chem. Phys. 2017, 19, 11429–11435. [Google Scholar] [CrossRef]
- Mandle, R.J.; Cowling, S.J.; Goodby, J.W. Rational design of rod-like liquid crystals exhibiting two nematic phases. Chem. Eur. J. 2017, 23, 14554–14562. [Google Scholar] [CrossRef] [PubMed]
- Mandle, R.J.; Cowling, S.J.; Goodby, J.W. Structural variants of rm734 in the design of splay nematic materials. Liq. Cryst. 2021, 48, 1780–1790. [Google Scholar] [CrossRef]
- Li, J.; Nishikawa, H.; Kougo, J.; Zhou, J.; Dai, S.; Tang, W.; Zhao, X.; Hisai, Y.; Huang, M.; Aya, S. Development of ferroelectric nematic fluids with giant-ε dielectricity and nonlinear optical properties. Sci. Adv. 2021, 7, eabf5047. [Google Scholar] [CrossRef]
- Zhao, X.; Zhou, J.; Li, J.; Kougo, J.; Wan, Z.; Huang, M.; Aya, S. Spontaneous helielectric nematic liquid crystals: Electric analog to helimagnets. Proc. Natl. Acad. Sci. USA 2021, 118, e2111101118. [Google Scholar] [CrossRef] [PubMed]
- Pociecha, D.; Walker, R.; Cruickshank, E.; Szydlowska, J.; Rybak, P.; Makal, A.; Matraszek, J.; Wolska, J.M.; Storey, J.M.D.; Imrie, C.T.; et al. Intrinsically chiral ferronematic liquid crystals. arXiv 2021, arXiv:2112.11887. [Google Scholar]
- Saha, R.; Nepal, P.; Feng, C.; Sakhawat Hossein, M.; Gleeson, J.T.; Sprunt, S.; Twieg, R.J.; Jakli, A. Multiple ferroelectric nematic phases of a highly polar liquid crystal compound. arXiv 2021, arXiv:2104.06520. [Google Scholar] [CrossRef]
- Brown, S.; Cruickshank, E.; Storey, J.M.D.; Imrie, C.T.; Pociecha, D.; Majewska, M.; Makal, A.; Gorecka, E. Multiple polar and non-polar nematic phases. ChemPhysChem 2021, 22, 2506–2510. [Google Scholar] [CrossRef]
- Li, J.; Wang, Z.; Deng, M.; Zhu, Y.; Zhang, X.; Xia, R.; Song, Y.; Hisai, Y.; Aya, S.; Huang, M. General phase-structure relationship in polar rod-shaped liquid crystals: Importance of shape anisotropy and dipolar strength. Giant 2022, 11, 100109. [Google Scholar] [CrossRef]
- Song, Y.; Li, J.; Xia, R.; Xu, H.; Zhang, X.; Lei, H.; Peng, W.; Dai, S.; Aya, S.; Huang, M. Development of emergent ferroelectric nematic liquid crystals with highly fluorinated and rigid mesogens. Phys. Chem. Chem. Phys. 2022, 24, 11536–11543. [Google Scholar] [CrossRef]
- Dai, S.; Li, J.; Kougo, J.; Lei, H.; Aya, S.; Huang, M. Polar liquid crystalline polymers bearing mesogenic side chains with large dipole moment. Macromolecules 2021, 54, 6045–6051. [Google Scholar] [CrossRef]
- Cruickshank, E.; Walker, R.; Storey, J.M.D.; Imrie, C.T. The effect of a lateral alkyloxy chain on the ferroelectric nematic phase. RSC Adv. 2022, 12, 29482–29490. [Google Scholar] [CrossRef]
- Cigl, M.; Podoliak, N.; Landovský, T.; Repček, D.; Kužel, P.; Novotná, V. Dimethylamino terminated ferroelectric nematogens revealing high permittivity. arXiv 2023, arXiv:2301.04865. [Google Scholar]
- Mandle, R.J. Supramolecular ferroelectric nematic materials. Liq. Cryst. 2022, 49, 2019–2026. [Google Scholar] [CrossRef]
- Nishikawa, H.; Shiroshita, K.; Higuchi, H.; Okumura, Y.; Haseba, Y.; Yamamoto, S.I.; Sago, K.; Kikuchi, H. A fluid liquid-crystal material with highly polar order. Adv. Mater. 2017, 29, 1702354. [Google Scholar] [CrossRef]
- Manabe, A.; Bremer, M.; Kraska, M. Ferroelectric nematic phase at and below room temperature. Liq. Cryst. 2021, 48, 1079–1086. [Google Scholar] [CrossRef]
- Berendsen, H.J.C.; van der Spoel, D.; van Drunen, R. Gromacs: A message-passing parallel molecular dynamics implementation. Comput. Phys. Commun. 1995, 91, 43–56. [Google Scholar] [CrossRef]
- Lindahl, E.; Hess, B.; van der Spoel, D. Gromacs 3.0: A package for molecular simulation and trajectory analysis. Mol. Model. Annu. 2001, 7, 306–317. [Google Scholar] [CrossRef]
- Van Der Spoel, D.; Lindahl, E.; Hess, B.; Groenhof, G.; Mark, A.E.; Berendsen, H.J. Gromacs: Fast, flexible, and free. J. Comput. Chem. 2005, 26, 1701–1718. [Google Scholar] [CrossRef]
- Hess, B.; Kutzner, C.; van der Spoel, D.; Lindahl, E. Gromacs 4: Algorithms for highly efficient, load-balanced, and scalable molecular simulation. J. Chem. Theory Comput. 2008, 4, 435–447. [Google Scholar] [CrossRef]
- Pronk, S.; Páll, S.; Schulz, R.; Larsson, P.; Bjelkmar, P.; Apostolov, R.; Shirts, M.R.; Smith, J.C.; Kasson, P.M.; van der Spoel, D.; et al. Gromacs 4.5: A high-throughput and highly parallel open source molecular simulation toolkit. Bioinformatics 2013, 29, 845–854. [Google Scholar] [CrossRef] [PubMed]
- Abraham, M.J.; Murtola, T.; Schulz, R.; Páll, S.; Smith, J.C.; Hess, B.; Lindahl, E. Gromacs: High performance molecular simulations through multi-level parallelism from laptops to supercomputers. SoftwareX 2015, 1–2, 19–25. [Google Scholar] [CrossRef]
- Páll, S.; Abraham, M.J.; Kutzner, C.; Hess, B.; Lindahl, E. Tackling exascale software challenges in molecular dynamics simulations with gromacs. In Solving Software Challenges for Exascale; Markidis, S., Laure, E., Eds.; Springer International Publishing: Cham, Switzerland, 2015; pp. 3–27. [Google Scholar]
- Wang, J.; Wolf, R.M.; Caldwell, J.W.; Kollman, P.A.; Case, D.A. Development and testing of a general amber force field. J. Comput. Chem. 2004, 25, 1157–1174. [Google Scholar] [CrossRef] [PubMed]
- Bayly, C.I.; Cieplak, P.; Cornell, W.; Kollman, P.A. A well-behaved electrostatic potential based method using charge restraints for deriving atomic charges: The resp model. J. Phys. Chem. 1993, 97, 10269–10280. [Google Scholar] [CrossRef]
- Lee, C.; Yang, W.; Parr, R.G. Development of the colle-salvetti correlation-energy formula into a functional of the electron density. Phys. Rev. B 1988, 37, 785–789. [Google Scholar] [CrossRef]
- Becke, A.D. Density-functional thermochemistry. III. The role of exact exchange. J. Chem. Phys. 1993, 98, 5648–5652. [Google Scholar] [CrossRef]
- Frisch, M.J.; Trucks, G.W.; Schlegel, H.B.; Scuseria, G.E.; Robb, M.A.; Cheeseman, J.R.; Scalmani, G.; Barone, V.; Mennucci, B.; Petersson, G.A.; et al. Gaussian G09 Revision d01; Gaussian, Inc.: Wallingford, CT, USA, 2016. [Google Scholar]
- Case, D.A.; Cheatham, T.E., III; Darden, T.; Gohlke, H.; Luo, R.; Merz, K.M., Jr.; Onufriev, A.; Simmerling, C.; Wang, B.; Woods, R.J. The amber biomolecular simulation programs. J. Comput. Chem. 2005, 26, 1668–1688. [Google Scholar] [CrossRef]
- Wang, J.; Wang, W.; Kollman, P.A.; Case, D.A. Automatic atom type and bond type perception in molecular mechanical calculations. J. Mol. Graph. Model. 2006, 25, 247–260. [Google Scholar] [CrossRef]
- Sousa da Silva, A.W.; Vranken, W.F. Acpype—Antechamber python parser interface. BMC Res. Notes 2012, 5, 367. [Google Scholar] [CrossRef]
- Hess, B.; Bekker, H.; Berendsen, H.J.C.; Fraaije, J.G.E.M. Lincs: A linear constraint solver for molecular simulations. J. Comput. Chem. 1997, 18, 1463–1472. [Google Scholar] [CrossRef]
- Parrinello, M.; Rahman, A. Polymorphic transitions in single crystals: A new molecular dynamics method. J. Appl. Phys. 1981, 52, 7182–7190. [Google Scholar] [CrossRef]
- Nosé, S.; Klein, M.L. Constant pressure molecular dynamics for molecular systems. Mol. Phys. 1983, 50, 1055–1076. [Google Scholar] [CrossRef]
- Nosé, S. A molecular dynamics method for simulations in the canonical ensemble. Mol. Phys. 1984, 52, 255–268. [Google Scholar] [CrossRef]
- Hoover, W.G. Canonical dynamics: Equilibrium phase-space distributions. Phys. Rev. A 1985, 31, 1695–1697. [Google Scholar] [CrossRef] [PubMed]
- McGibbon, R.T.; Beauchamp, K.A.; Harrigan, M.P.; Klein, C.; Swails, J.M.; Hernández, C.X.; Schwantes, C.R.; Wang, L.P.; Lane, T.J.; Pande, V.S. Mdtraj: A modern open library for the analysis of molecular dynamics trajectories. Biophys. J. 2015, 109, 1528–1532. [Google Scholar] [CrossRef]
- Mandle, R.J. Implementation of a cylindrical distribution function for the analysis of anisotropic molecular dynamics simulations. PLoS ONE 2022, 17, e0279679. [Google Scholar] [CrossRef]
Figure 1.
Molecular structure of UUQU-4-N, with transition temperatures (°C) taken from ref [25]. The up and down arrows indicate reported phase transitions on heating and cooling, respectively. Depiction of replacement of difluorobenzene (“U”) with either benzene (“P”) or fluorobenzene (“G”).
Figure 1.
Molecular structure of UUQU-4-N, with transition temperatures (°C) taken from ref [25]. The up and down arrows indicate reported phase transitions on heating and cooling, respectively. Depiction of replacement of difluorobenzene (“U”) with either benzene (“P”) or fluorobenzene (“G”).

Figure 2.
From top to bottom: simulation properties as a function of temperature: order parameters (<P1>, <P2>, and <B>); density, kg m3; and spontaneous polarisation, C·m2. Average values are given as data points, error bars show one standard deviation from the mean, and dashed lines are fits to the data which are presented as a guide to the eye. Fits take the form A + (B − A)/(1 + exp(−4 ∗ log(3) ∗ (x − c)/D)).

Figure 3.
(a) Instantaneous configuration of an MD simulation of UUQU-4-N in the polar nematic configuration at a temperature of 298 K and at a time of 697 ns. To aid visualisation, only a small number of molecules are shown as space filling, with the rest rendered as wire. (b) Schematic of the cylindrical binning process used to generate the cylindrical distribution plots; the nematic director (n), cylinder length (h), and radius (r) are all indicated. (c) Evolution of the CDF computed for MD simulations of UUQU-4-N at the indicated temperatures.

Figure 4.
CDF for the NF phase of UUQU-4-N at 298 K with logarithmic colour scale to aid visualisation of CDF features; expansions (a) and (b) show preferred pairing modes for head-to-tail and side-to-side pairs, respectively. White boxes in the expansions (a) and (b) show the spatial cut-offs used to look up pairs of molecules which were then selected randomly.

Figure 5.
Effect of indicated structural variations on the stability of the NF phase at a given temperature. A green tick indicates the polar nematic order is retained at this temperature, while a red cross indicates it is eliminated.
Figure 5.
Effect of indicated structural variations on the stability of the NF phase at a given temperature. A green tick indicates the polar nematic order is retained at this temperature, while a red cross indicates it is eliminated.

Disclaimer/Publisher’s Note: The statements, opinions and data contained in all publications are solely those of the individual author(s) and contributor(s) and not of MDPI and/or the editor(s). MDPI and/or the editor(s) disclaim responsibility for any injury to people or property resulting from any ideas, methods, instructions or products referred to in the content. |
© 2023 by the author. Licensee MDPI, Basel, Switzerland. This article is an open access article distributed under the terms and conditions of the Creative Commons Attribution (CC BY) license (https://creativecommons.org/licenses/by/4.0/).
Share and Cite
MDPI and ACS Style
Mandle, R.J. In Silico Interactome of a Room-Temperature Ferroelectric Nematic Material. Crystals 2023, 13, 857. https://doi.org/10.3390/cryst13060857
AMA Style
Mandle RJ. In Silico Interactome of a Room-Temperature Ferroelectric Nematic Material. Crystals. 2023; 13(6):857. https://doi.org/10.3390/cryst13060857
Chicago/Turabian StyleMandle, Richard J. 2023. "In Silico Interactome of a Room-Temperature Ferroelectric Nematic Material" Crystals 13, no. 6: 857. https://doi.org/10.3390/cryst13060857
Note that from the first issue of 2016, this journal uses article numbers instead of page numbers. See further details here.