
Grain Size Distribution of DP 600 Steel Using Single-Pass Asymmetrical Wedge Test
by
 , , and
Urška Klančnik
1,*,
Peter Fajfar
2,
Jan Foder
3,
Heinz Palkowski
4,
Jaka Burja
5 and
Grega Klančnik
6,* 1
Valji d.o.o., Železarska Cesta 3, SI-3220 Štore, Slovenia
2
Department of Materials and Metallurgy, Faculty of Natural Sciences and Engineering, University of Ljubljana, Aškerčeva Cesta 12, SI-1000 Ljubljana, Slovenia
3
SIJ Acroni d.o.o., C. Borisa Kidriča 44, SI-4271 Jesenice, Slovenia
4
Institute of Metallurgy, Technical University of Clausthal, Robert-Koch-Straße 42, D-38678 Clausthal-Zellerfeld, Germany
5
Institute of Metals and Technology, Lepi Pot 11, SI-1000 Ljubljana, Slovenia
6
Pro Labor d.o.o., Podvin 20, SI-3310 Žalec, Slovenia
*
Authors to whom correspondence should be addressed.
Crystals 2023, 13(7), 1055; https://doi.org/10.3390/cryst13071055
Submission received: 10 June 2023
/
Revised: 22 June 2023
/
Accepted: 24 June 2023
/
Published: 4 July 2023
(This article belongs to the Special Issue Advanced Crystalline Materials, Mechanical Properties and Innovative Production Systems)
Abstract
:Grain size distribution after the completion of a phase transformation was studied through the laboratory-controlled hot-plastic deformation of dual phase 600 (DP 600) steel using a specially prepared asymmetric single-pass hot-rolling wedge test with a refined reheating grain size instead of the usual coarse-grained starting microstructure observed in practice. The experiment was performed to reduce generally needed experimental trials to observe the microstructure development at elevated temperatures, where stable and unstable conditions could be observed as in the industrial hot-rolling practice. For this purpose, experimental stress–strain curves and softening behaviors were used concerning FEM simulations to reproduce in situ hot-rolling conditions to interpret the grain size distribution. The presented study revealed that the usual approach found in the literature for microstructure investigation and evolution with a hot-rolling wedge test was deficient concerning the observed field of interest. The degree of potential error concerning the implemented deformation per notch position, as well as the stress–strain rate and related mean flow stresses, were highly related to the geometry of the specimen and the material behavior itself, which could be defined by the actual hardening and softening kinetics (recrystallization and grain growth at elevated temperatures and longer interpass times). The grain size distribution at 1100–1070 °C was observed up to a 3.45 s−1 strain rate and, based on its stable forming behavior according to the FEM simulations and the optimal refined grain size, the optimal deformation was positioned between e = 0.2 and e = 0.5.
1. Introduction
1.1. Dual Phase Steels
Dual-phase (DP) steel is highly interesting and is intended for many demanding applications, such as the automobile industry. Its high strength-to-weight ratio can be related to fuel economy as a part of the green transformation promoted by the EU. These compositions are similar to lean qualities, making them interesting for further study. The use of the wedge test for obtaining data on grain size evolution under various rolling parameters is demonstrated in this paper.
DP steels are considered common representatives of advanced high-strength steels (AHSS) for advanced safety components in the automotive industry due to their high tensile strength. The high strength is obtained by (higher carbon) martensite (M) content, and the optimal yield stress is provided by the ferrite (F) content. Therefore, their good cold-formability properties can be exploited for rather complex shapes. A complex microstructure was obtained during sheet processing; bainite (B), retained austenite, and carbides could also be identified alongside F and M. Usually, the martensite fraction is from 10 to 30 %. In the case of high-strength DP 1200 steel up to 38 vol.% or higher [1,2,3,4].
AHSS sheets are mainly delivered after cold rolling and are covered with metal coatings to protect the steel surface against corrosion [4,5,6]. They are also available in a hot-rolled state. For ultrafine (UF) refinement, two on-line methods are generally used: modern thermomechanical processing (which involves controlling the cooling rate during the γ → α transformation, strain (–deformation)-induced ferrite nucleation (DIFT), etc.) and severe plastic deformation strategies at elevated temperatures, introducing low-temperature regimes, etc. [7]. An example of these two methods is when one part of the deformation is carried out in the roughing stage (R) for full austenite recrystallization, and the other part is carried out in the low-temperature regime with several large strain deformations. They are followed by inter-critical annealing (IA) and quenching for the production of ultrafine-grained DP steel [1]. Ultrafine ferrite grain (ULFG) can be produced by a single- or multi-pass deformation at IA temperatures by promoting the dynamic-strain-induced transformation of austenite to ferrite [8]. Under ordinary hot-rolling procedures, the DP steel’s microstructure is composed of F and pearlite (P) bands, while microalloying additions (such as Nb) may cause additional B formation. Classical microstructure development using off-line reheating, for example, in thin strips, can be carried out by heating the products within the IA region between Ar1 and Ar3, followed by quenching [3]. These rolling schedules and heat treatments can, therefore, be adapted to the chemical composition, secondary precipitation, and potential influence of the solid drag (SD). In this study, a single laboratory “roughing pass” was conducted at a reasonably low roughing temperature of 1100 °C, which is close to the conditions of the final roughing passes used in the industry.
1.2. The Wedge Test
Non-standardized wedge-shaped specimens are used for research regarding metal forming, the workability of specific alloys, and to evaluate microstructure evolution. The tests of wedge specimen deformations can be used for hot forging, pressing, as well as (hot-) rolling tests. The rolling tests of wedge-shaped specimens (henceforth called wedge rolling tests) deform their former tapered geometry with a single pass into a thin sheet of equal thickness; however, different deformation conditions are applied regardless of the rolled length of the material under investigation. The direction of rolling begins from the lower height to fulfill the bite condition and gradually progresses toward the higher end. The wedge specimen can be designed to include a narrow part at the beginning (the so-called tongue) with a height smaller than the rolling gap. This in itself provides a good control sample, given that the tongue is not submitted to any material deformation. The wedge specimen must end with a parallel plane length of at least 1/3 of the total specimen’s length to ensure a stable finish [9].
The wedge rolling test can be used to obtain information on the slab-to-plate or plate-to-strip reduction ratio, specifically concerning the grain size and microstructure evolution during deformation [10,11,12,13,14]. It can also be used for technological formability studies, such as observing crack formations under different technological parameters of melt preparation, casting, and hot rolling. This was demonstrated in the case of 25CrMo4 steel by extracting samples from different positions of blanks, blooms, and slabs. The height strain, e (or ε), the force, and the strain rate () were close to linear with increasing values along the rolled length [15]. A possible mathematical solution for the evaluation of rolled wedge samples was proposed by Kubina et al. [16], where a macro image of the rolled sample was evaluated with a computer algorithm. The output was the mean strains (both true and relative), the mean strain rates, and the broadening of the sample along the sample’s length. However, due to the dynamic nature of the wedge rolling test and its high dependency on the sample geometry, rolling stand, etc., the instructions for sampling and microstructural investigation should be given in a precise manner to ensure good comparability and repeatability.
In this study, the wedge rolling test was performed using DP 600 steel. The nature of the grain size evolution in grain refining and grain growth was studied at an elevated temperature and different length positions to ensure different thickness reductions with the corresponding strain rates (). The main issue in the wedge-rolling tests was in the comparability of individual tests in terms of the sampling location significance and possible deformation-related influences that could affect the result.
2. Materials and Methods
2.1. Materials
The steel charge was melted using an open induction furnace. The steel (with Tliq = 1520 °C) was cast into ingots at approx. 50 K of superheat and left to cool. No stress relieving was necessary due to the lean composition with poor hardenability. Ingots were used to prepare a tapered wedge sample with the dimensions shown in Figure 1a. The wedge sample consisted of three distinct areas: first, the thinnest starting part, referred to as the tongue (which also served as the reference point for microstructural evaluation), ensured a smoother start to the rolling; second, the tapered rising part enabled the dynamic test of varying strains and strain rates. Finally, the finishing thick area served to stabilize the rolling process and prevented dimensional post-rolling abnormalities [9]. Furthermore, notches were mechanically cut into the side of the wedge to signify the selected computed deformations (given in Table 1) for easier observation after rolling. A schematic representation of hot-deformation and cooling regimes to prevent excessive primary austenite grain (PAG) coarsening is shown in Figure 1b. Cooling was similar to offline heat treatments for DP steels. The cooling started from the full austenite region, crossing the (α + γ) region by adjusting the cooling rate, and finally, with the intense transformation of undercooled (remaining) austenite (A) into a-thermal martensite (M), the test was completed [5].
2.2. Experimental Testing
The final rolled sheet was revealed to be rather flat, with no excessive edge waves or flatness issues. This could be an indication that due to a rather low rolling speed (and consequently ), the final microstructure along the sample length was cross-sectionally uniform (not isotropic) despite it being an asymmetric wedge test [17]. Figure 1c shows the location of the notch positions where with each increased number (from e1 to e9), an increase in the stored energy during rolling was expected. This means that, by increasing the deformation, the driving force for recrystallization also continuously increases [18].
The maximum ratio , where h0 signified the starting thickness and h1 the final thickness, was set to 4:1. The ratio 3:1 was estimated to be the lowest ratio per notch position of the highest reduction for the given study and the wedge geometry setup. The wedge maximum thickness was sufficient due to the maximum allowable bite angle αo concerning the friction coefficient. The steel wedge sample was reheated to the temperature of 1100 °C. The temperature of the sample after rolling was measured to be, on average, 1070 °C. For a single-run hot-rolling test, a laboratory two-high rolling mill with roll diameters (2R) of 294 mm each was used. The work rolls were also preheated to minimize heat extraction during rolling (a drop of 30 K was measured). The preheating of the rolls was conducted for 3 hours before the actual test was run to achieve quite a homogeneous surface temperature of approx. 80 °C. Based on the work roll’s rotation frequency of n = 8 rpm, the average rolling speed v was calculated as:
where ω is the angular velocity. Therewith, the average rolling speed was calculated to be 0.12 m/s. The mean strain rate, , based on the contact time of 2.5 s, was calculated to be up to 4.1 s−1, and when estimated with the length of the deformation zone Ld, the maximum values were up to 3.98 s−1 (Equations (2)–(4)) [19].
The first part of the moderate cooling of the nominally 3 mm thick sheets after rolling was conducted to promote ferrite nucleation in the (α + γ) region down to approx. 750 °C, which was close to the usual IA. Further intense cooling was performed to promote γ → M transformation, similar to step quenching [4].
The samples were extracted for a light optical microstructure observation (OM, Zeiss Axio Imager 2, Francoforte, Germany) and field-emission scanning electron microscope investigation (FE-SEM, Zeiss Supra VP55, Francoforte, Germany), as seen in Figure 1c. They were viewed in the transverse direction according to the rolling direction. After grinding and polishing, the microstructure was observed after etching with 2% Nital. FE-SEM observations were performed on non-etched samples. Secondary electron (SE) images were used for grain size evaluation and were analyzed using the commercial ImageJ software (1.53k, open-source software, NIH, Bethesda, MD, USA) and by analyzing Feret’s diameter.
Table 1 reveals the target and actually achieved engineering deformation per notch position for the performed wedge rolling test. The target deformations were chosen based on roll mill stiffness, safety during sheet production, and allowable roll mill displacement. The achieved true strain was in a range between ε = 0.05 and 0.96. The per-notch position deformation could be considered as having a cumulative (residual) deformation representing multiple passes with an insufficient delay between passes for softening (or achieving t50). For example, in usual recrystallization rolling, at least 0.5 of the cumulative engineering strain was targeted for proper uniform grain size evolution. This was consistent up to notch e7 regarding the achieved strain e. Here, we already had an obvious discrepancy between the target and achieved deformation based solely on the geometry of the hot-rolled flat sheet.
The per-notch positions for engineering strains e1 to e3 were regarded as limited regarding the metallurgical pass needed for the full cross-section PAG evolution. Additionally, secondary recrystallization was expected during post-rolling cooling. The latter was closer to broad sizing as seen in industrial practice, with weak first ε passes, and were not considered as actual roughing or effective metallurgical passes [20]. Above e3 and up to e5/e6 was the region where the last roughing pass before finishing in plates was considered in actual practice, and post-deformation SRX is regarded as the main softening kinetic. Above e5/e6, the εT was already above the usual per pass engineering strain for the last roughing phase of most of the thin plate rolling productions’ practice. This meant that the main softening mechanism in the last positions (between e6 and e9) on the wedge if εc or εp were also considered (latter as grain size dependent), was among the dynamic, static recovery (DRV, SRV) also fast post-deformation meta-dynamic recrystallization (MDRX). SRX could also be activated. The maximum peak obtained from the σ-ε curve was evaluated at approximately ε = 0.3–0.4 with the softening above ε = 0.4 for 1100 °C at 1 s−1 and 3 s−1. The σ-ε curves indicated a DRX phenomenon (T > Tnrx), as shown later in the manuscript. This was observed with the hot compression curve; reheating to 1200 °C → cooling → deformation at 1100 °C and εT = 0.7, quench. This meant that with and above e7, the effect of starting PAG was complex, depending on the DRX kinetics. It also indicated that at least part of the production/reheating grain size history of the wedge should be minimized concerning the achieved final (originally preserved) PAG; it was known that under DRX, the recrystallization kinetics were independent of the starting (initial) PAG if σsteady was achieved. However, the post-deformed softening on nucleated DRX grains and grain size evolution was complex and depended on the status of individual grains concerning the preserved dislocation density and actual grain mobility.
Based on the results shown further in this paper, this also meant that a different PAG evolution per notch position was expected in the activated post-deformation process [21]. After deformation and based on the predicted CCT calculated using JMatPro, the approximate cooling rate that was needed to prevent pearlite formation was approx. 10 K/s, which is in agreement with [2] for similar compositions used for DP microstructure formation using the deformational dilatometry test.
2.3. Computer Modeling
Two commercial thermodynamic tools were used, namely Thermo-Calc (Thermo-Calc 2022a, TCFE11: Steels/Fe-Alloys v11.0, Thermo-Calc Software AB, Solna, Sweden) and JMatPro 6.1 (General Steel database). JMatPro 6.1 (Sente Software Ltd., Guildford, UK) was also used for the estimation of approximate cooling rates for γ → α transformation before intense quenching in the cold water of approx. 18 °C. Additionally, the non-commercial model from Bhadeshia, Mucg83, was used for basic temperature determinations [22].
For a more detailed understanding of the hot working process when using a tapered wedge test, finite element (FEM) simulations were conducted using Abaqus software. The model was calculated as a 3D stress Dynamic/Explicit problem with the wedge being deformably extruded solid, and both rolls were 3D discrete rigid objects. The mesh of the wedge sample consisted of 2904 standard C3D8R linear brick elements, while each of the rolls was meshed with 1111 R3D4 and R3D3 quadrilateral and triangular elements, respectively. The mesh of the wedge sample was constructed with a bias and element seeds ranging from 4 mm to 2 mm. Figure 2 shows the mesh sensitivity analysis of the wedge sample, revealing that decreasing the element size below 4 mm gains produced neglectable little accuracy at the expense of a much longer computing time.
In the setting of the simulation, the heat transfer between the wedge and the rolls was neglected, similar to the work of Parsa et al. [10]. The temperature effect was taken into account by employing the mechanical properties of the wedge as being temperature dependent. The data used for the temperature-dependent mechanical properties (Young’s modulus, density, Poisson ratio) were obtained with the thermodynamic prediction software described above and the data shown in Table 2. The stress–strain curves used were taken from actual measurements performed on the Gleeble thermo-mechanical simulator, as an example shown in Figure 3. Kinematic sliding with the penalty was used as an interaction property; a friction coefficient of 0.3 was used based on the work of Edberg et al. [23] to calculate the flow stresses with the friction-hill model for a hot strip mill [18]
3. Results and Discussion
3.1. Chemical Composition
A basic composition, typical for lean (C-Mn) structural steels, was set (with low carbon, high manganese grade) where manganese defined the proportion of ferrite and pearlite under ordinary air-cooled conditions [24,25]. No precipitation-strengthening carbide or nitride-forming elements were intentionally added to the given study to allow full softening kinetics (for close to equiaxed austenite shape formation) concerning the kinematic parameters of wedge rolling. Additionally, due to the very thin sheet material, there was no need for Cu, Mo, or Ni to enhance hardenability. A similar basic composition could also be used for S690QL thin plate grades (<8 mm) using thermo-mechanical controlled processes (TMCP) and DP steels which were intended for bake hardening [2,17]. The added Al produced no precipitation hardening [24]. In Table 3, showing the measured chemical composition, it was obvious that a rather high nitrogen content was achieved due to the open induction melting procedures and the used pre-alloyed material. Soluble nitrogen influences the impact transition temperature; for this test, this was considered allowable. Therefore, the soluble nitrogen was not controlled, and grain refinement by HAGB and coarsening were observed concerning the rolling parameters. The alloys used in this case were highly pure, resulting in a low oligo-element content and cleanliness concerning non-metallic inclusions (NMI). Sulfur and phosphorous were both under 0.0015% and 0.01%, respectively. The material was prepared using remelts for the synthesis of low carbon, which was close to C-Mn type steel [26]. No boron or other microalloying additions were introduced for this purpose. The metal melt was deoxidized using SiMn and Al. The calculated carbon equivalent, based on the measured compositions of an ingot using the CEV (IIW) equation, was 0.42. This indicated that the material was weldable.
Based on the chemical composition, Tnrx was estimated to be at 841 and 864 °C based on the Boratto–Barbosa equation [27] and modified equation [28], respectively. Having a similar composition and microalloying additions, the Tnrx was properly increased as in the work of Song et al. [8]. The Tnrx was considered as a recrystallization stop temperature (RST). The recrystallization low temperature (RLT), despite the minimum solid drag and Zener force, if any, was considered to be 934 °C, which was close yet still approx. 140 °C under the used single-pass temperature. The Ae3 was predicted by Thermo-Calc and JMatPro 6.1 to be 834 °C and 830 °C, respectively. This meant that R and FRT were conducted in the full austenitic recrystallization range (Type-I, static recrystallization) according to Irvin et al. [24], and no substantial pancaking could be visible, even by direct online water quench.
The Ms was predicted by JMatPro to be 438 °C, while the CCT diagram using KIN was predicted to be 477 °C (Figure 4). Additionally, based on the Bhadeshia model [22], the Ms was predicted to be 463 °C. All information about the starting Ms position revealed the possible self-tempering effect of prior M upon continuous cooling. The predicted [28] Ar3 was 764 °C and, based on KIN, Ac3 = 828 °C. The intense cooling should already be partially performed inside the IA region based on Ae3 and also Ar3 conditions. The delay time from FRT to the beginning of the water quench was sufficient for proper polygonal ferrite development under Ae3 [8]. In this case, the formed ferrite was not impinged after nucleation due to the lack of pinning particles and their subsequent deformation. Due to the rather fast cooling from FRT to the region of Ar3, the overall PAG coarsening was limited.
3.2. FEM Simulations and Calculations
The wedge rolling test in itself is considered to be a dynamic test as every geometrically dependent rolling parameter (ε, , αo) is both time and location dependent. Based on Equations (2)–(4), the different calculated mean parameters of the rolling in dependence of the per notch position are shown in Figure 5. Expectedly, an increasing trend can be noticed for all three parameters.
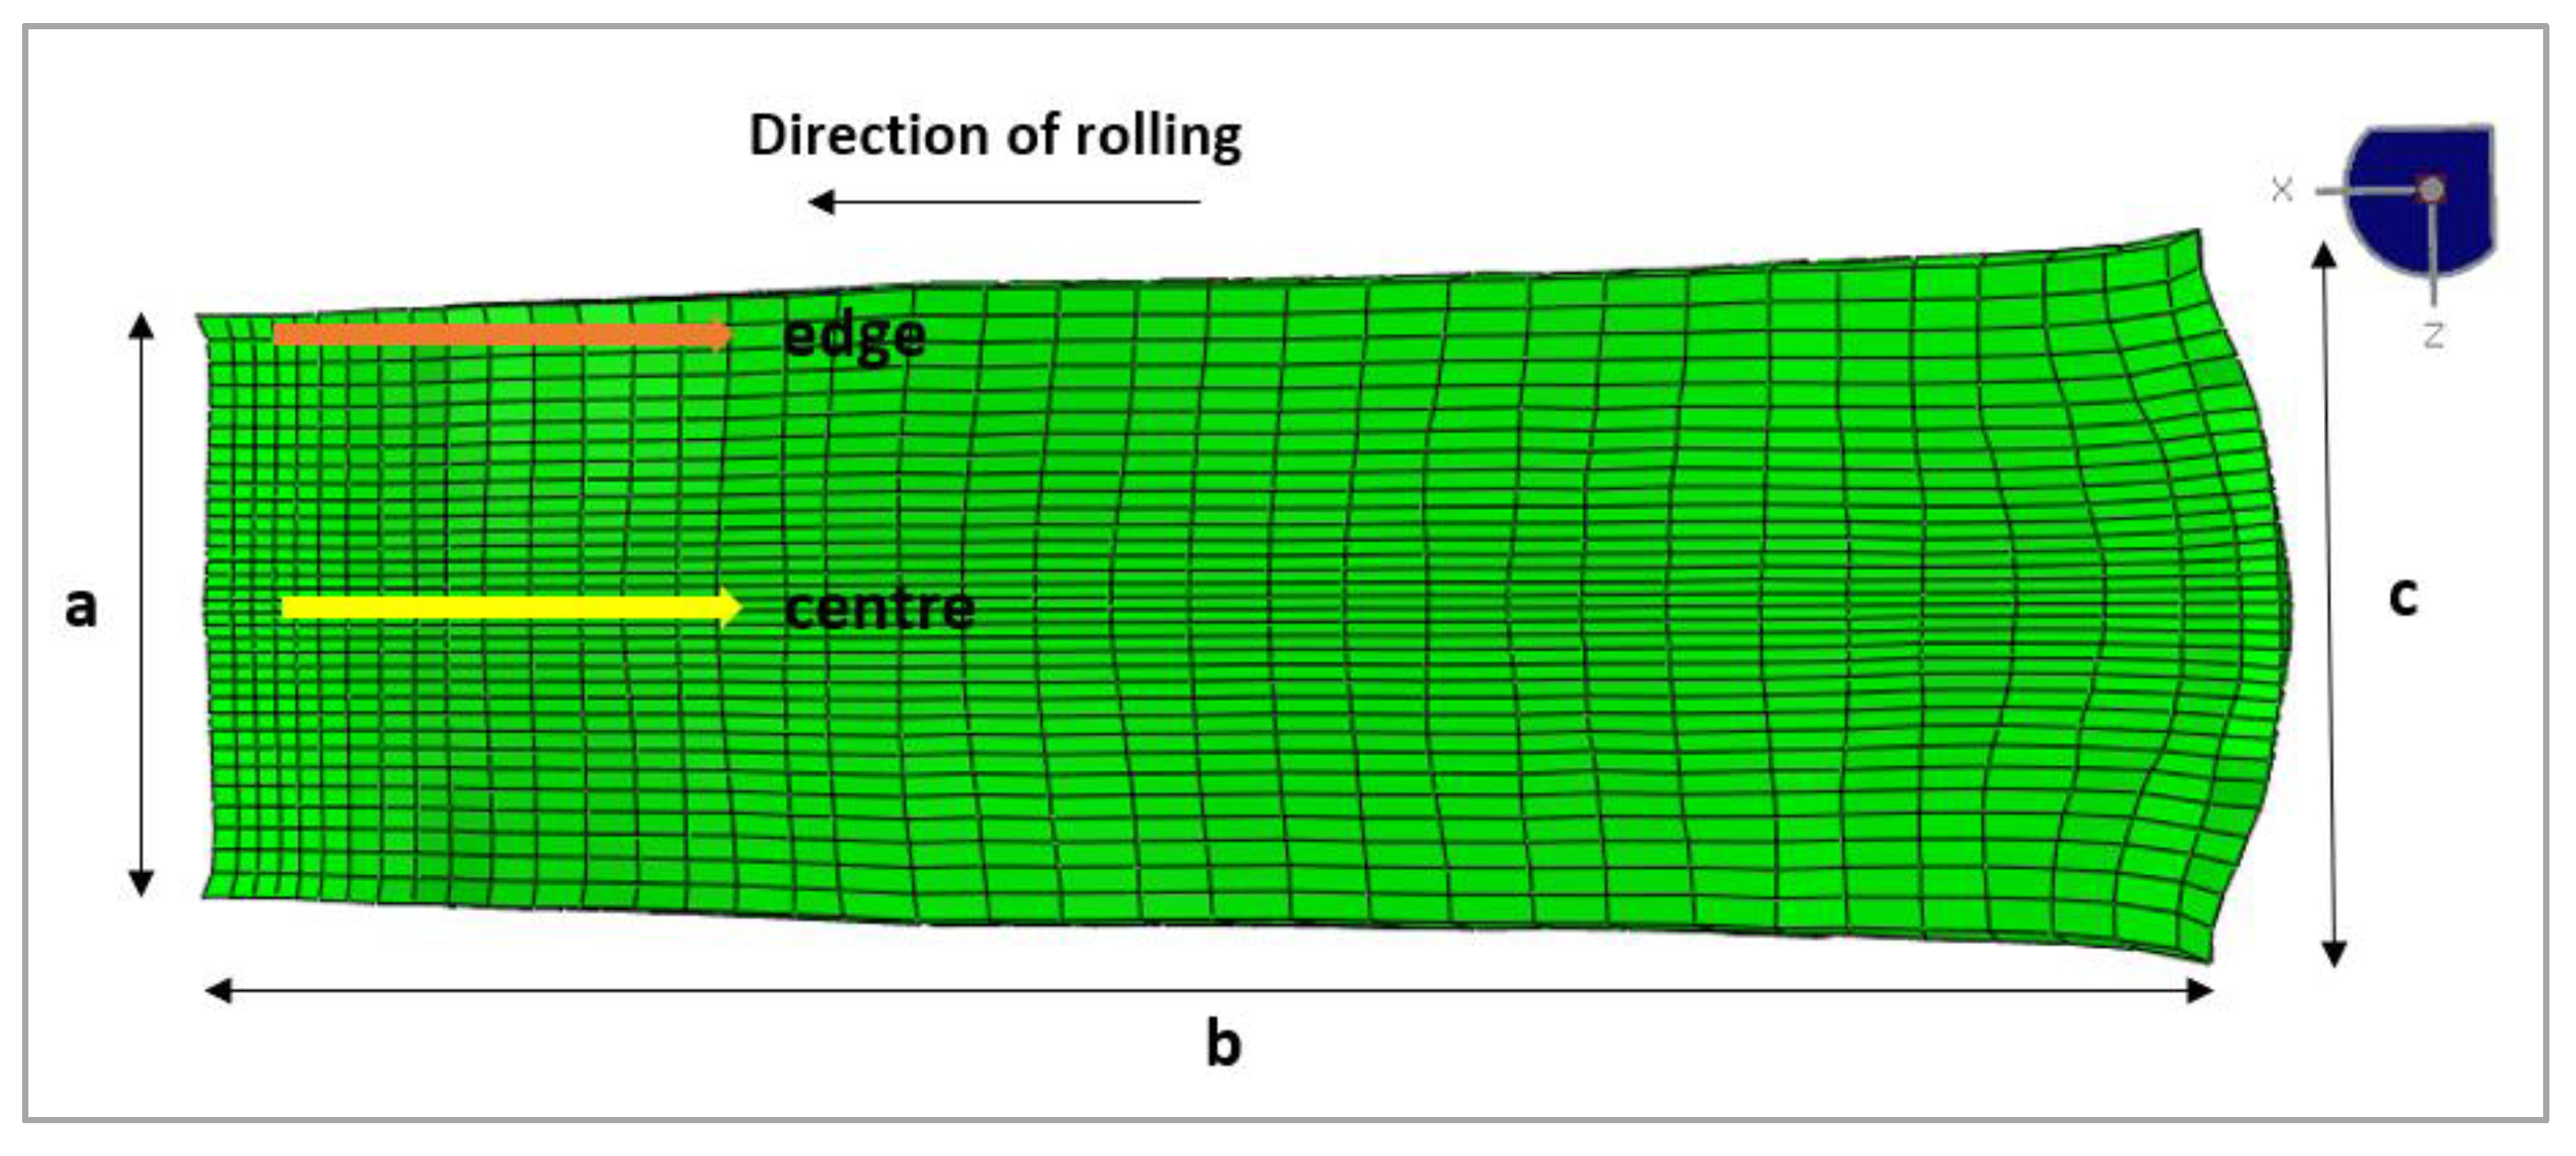
Figure 6 represents the deformed wedge sample after rolling. The parameters, as described in the previous section, were taken from measurements during the actual test (i.e., the rotational speed of the rolls, velocity of the wedge sample, the rolling gap, etc.). When comparing the dimensions of the simulated sample to the actual one, it was observed that the simulation resulted in larger dimensions, even though the overall projection of the simulated sample was visually almost identical to the actual one (see Figure 1c). When comparing the simulation results to real experiments, a certain deviation was to be expected. In our case, the geometrical deviation most likely stemmed from the fact that shrinking during cooling was not included. Furthermore, the simulation was stopped after the sample left the rolling gap; therefore, the temperature drop and stress relaxation was not incorporated. The second reason was most likely linked to the fact that the simulation kept the end thickness fixed at 3 mm, while in reality, the thickness slightly increased toward the end of the wedge sample due to roll displacement (also evident from the actual ratio in Table 1).
The dimensions of the wedge sample were marked with letters from a to c; a comparison between the simulation and the actual test is given in Table 4. The center and edge directions are marked in the image with arrows (Figure 6) highlighting the two different areas for the strain and strain rate evaluation of the wedge sample.
The simulation of the true strain, ε, on the deformed wedge sample (Figure 7) showed an unequal distribution of the strain over the wedge’s planar projection. The simulated strain was, as expected, lowest at the tongue part of the wedge sample and started increasing toward the thicker end. At first, the strain increased almost linearly over the entire width and localized with higher strain zones that started appearing in the middle of the wedge’s width around notch e7. This phenomenon continued throughout the rest of the wedge’s length; lines of equal strain transformed from straight into almost parabolic (also visible by the deformation of elements), as seen in Figure 8a. The inequality of the predicted strain at the edge and in the center of the wedge sample was more emphasized, where the values calculated on the edge were increasingly lower compared to the values predicted in the center. This indicated a certain loss of strain and strain rate control during rolling.
All the simulated strain values were predicted to be higher than the mean values from individual notch positions, according to Figure 8a. The simulation computation took into account the mutual interaction of individual elements representing the partial volume of the sample, which the theoretical calculation could not account for. Most likely, for this same reason, the strain in the center of the sample in the simulation was calculated to be higher than on the edge. The strain rate, calculated from the software’s output strain ε per notch position (simply as for individual elements corresponding to a specific notch position), also showed a different rate between the edge and the center of the sample, see Figure 8b. Compared to the calculated mean strain rate, the simulated values were lower: the maximum simulated levels of the strain rate were 3.45 s−1 and 2.93 s−1 (center of the sample, notch e8 and edge of the sample, notch e8, respectively) while the maximum mean strain rate was calculated as 3.98 s−1 (notch e9).
The result of the predicted unequal strain across the planar projection as well as the differences predicted between the edge and the center of the wedge suggest that caution must be taken on how to sample the rolled wedge. The predicted notch positions might not be a sufficient marker for the achieved strain during the test, especially if the samples for metallographic investigation are taken from the center of the wedge. This, of course, depends on the chosen geometry of the wedge sample, as the result is highly dependent on the dimensions. Further tests are being performed to evaluate the impact of geometry variability on the changes in the strain and the strain rate distribution of the wedge sample.
3.3. Grain Size Evolution
Under similar hot rolling schedules and different starting PAGs, the starting difference in grain size evolution was expected if the per pass and total reduction with recrystallization were considered. Some mills produced coils of similar compositions, as used for DP, with cumulative e = 0.82–0.88 to obtain proper final microstructure regardless of the starting PAG [18]. The importance of the starting grain size was already observed when comparing the shapes of single stress–strain curves with fine or coarse starting PAG at elevated temperatures obtained by torsion and hot compression tests [3]. The microstructure control over the wedge sample during intense reheating resulted in a fine starting grain size, which was achieved by cold charging. Intense reheating is also performed in the industry (where possible) for IA to take advantage of the uniform distribution of cementite. The cementite acts as a potential nucleation site of austenite [29]. When partial SRX is activated at sufficiently high temperatures, the starting new PAG can easily grow due to high HAGB mobility until sufficient roughing passes are introduced to limit/stop the HAGB mobility, and the continuous refining of PAG can again be observed with further passes [17,25]. By using a wedge rolling test, the notch positions are usually observed where sufficient ε (or e) is introduced for an effective through-section deformation, achieving the uniform cross-section dislocation density and promoting a repeatable dislocation-free grain formation to minimize any microstructural cross-section variation (microstructural non-uniformity). However, unstable grain refining processes are also highly interesting, and other (presumably the starting notch) positions have also been considered. The grain size in this study was considered only by the high-angle boundaries.
The average measured values of anisotropy usually increase per position concerning temperature and, based on Figure 9a, are within the values of 1.3 for DP 600; these values are calculated as an average between the grain sizes determined in the longitudinal (L.G.) and transverse (T.G.) direction. If the ratio between L.G. and T.G. is unity or close to unity, then no anisotropy (transverse to rolling) is present after the completion of the test. Based on these results, the microstructure can be regarded as mainly equiaxed. Based on L.G./T.G., only modest anisotropy was expectedly interpreted, potentially due to the individual deformed coarser grains observed in the metallographic samples. It was concluded that recrystallization rolling was obtained and went well with the predicted Tnrx. Some texturing appeared very modest and more emphasized in the region of highest compressions, as expected in hot-rolled sheets or strips [5].
Mixed grains were counted (partly as the fraction variation in phases is rather low): martensite (M), self-tempered martensite (SM), lower Bainite (LB), and ferrite (F) were included. Figure 9 shows that the final average grain size (F + M/self-tempered M/low B) observed on the finally cooled and transformed microstructure of the as-rolled sheet, regardless of the observed position, was in a range between 5 and 12 μm. This meant that we were achieving conventional to coarser grain sizes (CG) with F sizes on average of approx. 9–7 μm, yet no fine grains or ultra-fine grains were gained for DP steels (2–5 μm and <2 μm, respectively) as the process itself did not involve multi-forming operations, thermal cycling, etc. If these results are compared with classical high-temperature reheat and hot-rolled C-Mn steels, cooled under air with similar compositions, a rather refined structure was obtained in this work, indicating the importance of a proper low-temperature reheating temperature (of an ingot, slab, etc.), and a holding time adjustment in respect of the pre-existing state (quality of as-cast, pre-deformed state) to promote a fine transformed structure due to the initial fine and homogeneous PAG. The described fine-grained structure was observed from the first to the last notch position. This was achieved without using costly elements such as Nb, Mo, and similar. The degree of PAG evolution and a related transformed microstructure was successfully controlled by the reheat, roughing, and final rolling temperature, which introduced intense cooling as basic metallurgical tools for the minimization of grain coarsening [24,30]. Based on the coarsest observed transformed PAG within bi- and multi-modal peaks in Figure 9b, an estimation of the maximum PAG was set to be under 40 μm, which was consistent with similar values expected for the recrystallized grains of austenite in commercial grades [20].
Figure 9b reveals that, despite the relatively fine structure obtained on average, most grains were located between 3 and 20 μm. Locally rather coarse grains were also obtained, indicative of the anisotropy ratio. The localized coarse grains could exceed sizes of 40 μm up to 70 μm (related to transformed PAG into M/SM/B as an indicator). The local coarse grains were far from the fine-grain steel grade observed on average. The excessive transformed PAG size affected the ductility, as shown in [31]. Additionally, bi- or multimodality was enhanced at lower deformations (e up to 0.22). This indicated the unstable recrystallization process in early per-notch positions in relation to deformation among the phase-related modality. The intensity of multimodality was, however, low and the curve resembled the asymmetric Gauss distribution regardless of the deformation.
PAG coarsening was observed on the last notch positions and at the maximum deformations achieved for the given test. The thickness of the final sheet was not completely equal along the entire length and thicker exit thickness was achieved on the last notch positions despite achieving a higher as shown in Table 1. Therefore, slower cooling (longer times for grain growth) of the as-rolled structure was possible for these positions, partially due to the sheet manipulation and/or higher achieved thickness. However, based on the FEM simulations and material characteristics of DP 600, additional phenomena should be considered. Due to the starting fine structure, sufficiently high roughing temperature, sufficiently low strain rates, and achieved cumulative ε based on the stress–strain curves, DRX could be activated on the last positions. Therefore, grain growth was possible during cooling based on the low (strain-related) incubation time, high HAGB mobility already under SRX, and the related lack of pinning particles to retard secondary recrystallization. Sudden grain growth was often observed in hot strip rolling when MDRX was activated below 6 mm of the exit thicknesses (based on [31]). As discussed, Figure 7 (based on FEM simulations) shows strain localizations above e = 0.6; hence, most representative sample positions for grain size interpretations should be under e = 0.6 by considering the constant temperature of the sample and the limited range of .
In practice, contrary to a well-defined temperature regime under hot compression tests, the temperature uniformity using the wedge sample was more demanding, and the intensity of SRX, MDR/MDRX was, in some cases, also possibly related to non-uniform temperature distribution before and after completion of the test (as a part of adiabatic heating, variation in the roll chill per notch position, etc.).
Based on the results shown in Figure 9b and the laboratory setup of up to 3.45 s−1, the optimum deformations for temperatures of 1100–1070 °C were obtained between e = 0.2 and e = 0.5 and went well with the overall strain uniformity achieved after the rolling test. Engineering strains e were given from industrial practicality.
The characteristic of the grain-size curve visible in Figure 9a included only SRX (as PAG dependent) with no grain growth as a part of the secondary recrystallization at a close to constant temperature and, disregarding the obvious changes in , the nature of this curve could be described based on the Beynon and Sellars type of equation [32], where ε was considered from Table 1 for each notch position with the same starting PAG, which was written as :
where A and B should be experimentally determined to calculate the achieved SRX grain, DSRX. The maximum transformed PAG (evaluated with the mode transition from IV to II, Figure 10) based on Equation (5) was at e = 0.05 of the deformation and was in relatively good agreement with the measured grain size distribution seen in Figure 9a.
The schematic representation of a potential PAG microstructure evolution (conditioning), as shown in Figure 10, was observed during a single pass by hot wedge rolling and was given for plain C-Mn-type steels, including low alloyed grades (as DP steels) as well as abrasion-resistant, high strength low alloyed steels (HSLA). This scheme showed a different PAG evolution above and under Tnrx when various deformations per position at elevated reheating and rolling temperatures, cooling rates, and the overall changed hot-rolling schedules were implemented. The effects of the higher reheating (soaking) temperatures resulting in coarse starting PAG (mode I) or local PAG growth (mode IV and mode V) were also indicated, the latter due to the starting refined PAG and/or sufficiently high temperature for grain boundary mobility or post-rolling normal grain growth. Mode V was also related to the actual rolling speed as the flow curve (stress–strain) was related to temperature and the strain rate affecting the values of the Zener-Hollomon parameters and the hardening/softening of the material. It is visible that based on the scheme, we were able to produce the DP 600 response within modes IV, II, and partially V due to the overall rather low , and still observe an overall fine-grained structure per notch position. The modes of the grain size evolution presented in Figure 10 are shown to better understand the nature of refining and/or coarsening through a simple descriptive information methodology. Based on the results in Figure 9a and Figure 10, the overall trend was observed and widely accepted; the total reduction that increased the overall refining was observed under SRX regardless of the starting PAG.
In Figure 11, only ferrite grains were determined for the grain size evolution study. Ferrite was considered a ductility holder and revealed a similar trend in the grain size evolution per notch position to the mixed grains shown previously in the text. The results show that controlling the final PAG also controlled the ferrite grains. Overall, no preferential orientation of ferrite was recognized due to a single pass run at an elevated temperature for the given test. The starting temperature for intense quenching was, however, under Ae3. Considering the equilibrium (lever) predictions conducted by using Thermo-Calc and JMatPro 6.1 and the results in Figure 11f, the temperature of the quench start was set to be between 770 °C and 780 °C. The measured surface temperature was, on average, 750 °C (under Tnrx) and had a reasonable agreement. The areal fraction of (self-tempered) martensite blocks and/or LB revealed that the per notch position and increased deformation reveal minor variations in martensite and ferrite content (VF = 1 − VM). It was recognized that if hard M/SM was considered a measure of tensile strength, with the increasing ratio of the original to final thickness for different wedge geometries under relatively low strain rates, the mechanical tensile properties were weakly changing for the current rolling schedule. Based on the increasing deformations of the hot-rolled wedge, ferrite fraction also changed moderately, indicating weak yet still measurable increased nucleation sites for F formation per e. The various F fractions could be obtained by manipulating the number of passes concerning the actual temperature of the deformations and IA temperature, etc. [4,8]. In this case, only polygonal ferrite was obtained. If the quench temperature of the sheet was in the region outside the formation of polygonal ferrite (PF), acicular ferrite (AF) could also be promoted. As VM varied with the chemical composition, the austenite grain size, the actual time available for the phase transformation of austenite into ferrite, the cooling rate (VM increases with cooling (quench) rate), etc., no considerable changes per position for the variation in the highly dislocated M content was considered for the wedge results [3,4]. The dislocation density of austenite was also estimated before the phase transformation due to the variation in ε (e) and affecting the stress and force during rolling. The estimated dislocation density values were estimated from 1.0 × 10¹⁰ m−2 for under e1 to 1.25 × 10¹⁵ m−2 for the last e9 position (using the approach as in previous work [25]).
4. Conclusions
The non-standardized wedge rolling test of DP600, based on the above-presented results, was used in this case study for a single-pass schedule under isothermal conditions and could also be used for a multi-pass rolling schedule to observe the degree of grain refinement and grain growth in a post-cooled transformed microstructure by including the temperature profile. Based on the results, and regardless of the position, the main transformed microstructure consisted of martensite/self-tempered martensite and ferrite as a part of polygonal ferrite. No excessive formation of acicular ferrite was observed.
A single pass wedge rolling test at 1100–1070 °C was recognized to have similar asymmetric Gaussian grain size distributions between all per notch positions. A single pass could provide bi- or multi-modality, as seen in this study, despite it being modest. Partially the multi-modality originated from having a multi-phase microstructure; phase-related modality was also due to the unstable recrystallization on the first per notch positions. Local excessive coarse grains were observed up to mean e = 0.4.
The FEM simulation revealed a discrepancy between the rolled edge and the mid-width positions studied in this case. This indicated that sample extraction should be carefully designed to correlate the grain size evolution to the correct local ε. These achieved true deformations were seemingly highly affected by the chosen material as well as by the wedge geometry and the used rolling parameters (roll displacement). This indicated that simply observing the positions of intentionally (mechanically) formed notches before and after rolling could add uncertainty concerning the target deformations and potentially increase the measurement error for the grades with a higher solid drag and/or pinning pressure on HAGB (this was avoided in this study due to the lean chemical composition). By controlling the rolling speed at a fixed wedge geometry, as in this study, the strain and strain rate distributions could be, to a certain degree, controlled satisfactorily in a way to obtain the grain size evolution for different strains per notch position at a rather minor variation in the strain rates per notch position (by considering the dynamic nature of the test). This meant that the experimental data obtained from the wedge were potentially more comparable to more regular and standardized methods for material hot behavior studies and the investigation obtained from Gleeble tests, etc. Single wedge tests could be used successfully for quantitative analysis closer to other methods instead of being solely qualitative, but only by introducing some of the aspects shown in the presented paper.
Based on the conclusion made on DP 600 steel, a rather refined structure (within 5 to 12 µm) was obtained starting from the intense reheating for fine initial PAG control in all the performed rolling variations along the wedge length. However, the aim was to observe and determine the optimal strain needed for stable grain size evolution at a single roughing temperature as a single-step deformation process to produce the finest possible microstructure instead of introducing additional rolling passes, adding special heat treatments, thermal cycling, etc., which are basic techniques to provide even finer grain sizes in all the phase constituents involved [4,35,36]. Based on the overall rolling parameters and cooling schedule, the optimum deformations per notch positions for the roughing stage of a 3 mm thick sheet between the temperature interval of 1100–1070 °C and up to 3.45 s−1 strain rate were obtained between e = 0.2 and e = 0.5 as optimum grain size refining for balanced ductility and strength. The latter is the main target during DP production. The interval e = 0.2 and e = 0.5 agreed well based on FEM simulations, with the plastic deformation region of improved deformation stability. The FEM simulation therefore revealed, and this was considered relevant, that not all per-notch positions were used for the material study; this was based on the enhanced appearance of strain localization at higher starting thicknesses, as in this case. The work presented here sets a basic foundation for the potential further development of wedge geometry using C-Mn-type steels, including DP steels and others, for basic kinematic and material investigations.
Author Contributions
Conceptualization, G.K. and U.K.; methodology, G.K., U.K., P.F. and H.P.; software, U.K., G.K. and J.F.; validation, G.K., U.K. and P.F.; formal analysis, G.K., P.F. and U.K.; investigation, G.K. and J.F.; data curation, U.K. and G.K.; writing—original draft preparation, G.K. and U.K.; writing—review and editing, P.F., H.P., J.B. and J.F. All authors have read and agreed to the published version of the manuscript.
Funding
This research received no external funding.
Data Availability Statement
Data sharing is not applicable.
Acknowledgments
The authors would like to acknowledge Douglas Stalheim from DGS Metallurgical Solutions Inc. and Paul Lalley from CBMM for overall productive discussions about lean alloy steel grade topics. The authors would also like to acknowledge TU Clausthal for the execution of laboratory rolling and for helping with the numerical simulations.
Conflicts of Interest
The authors declare no conflict of interest.
References
- Calcagnotto, M.; Ponge, D.; Demir, E.; Raabe, D. Orientation gradients and geometrically necessary dislocations in ultrafine grained dual-phase steels studied by 2D and 3D EBSD. Mater. Sci. Eng. A 2010, 527, 2738–2746. [Google Scholar] [CrossRef]
- Asadi, M.; Soliman, M.; Palkowski, H. Advanced High-Strength Steels: Bake Hardening. In Encyclopedia of Iron, Steel, and Their Alloys; Routledge: London, UK, 2016; pp. 16–45. [Google Scholar] [CrossRef]
- Gladman, T. The Physical Metallurgy of Microalloyed Steels; The University of Leeds: Leeds, UK, 1997. [Google Scholar]
- Nikkhah, S.; Mirzadeh, H.; Zamani, M. Fine tuning the mechanical properties of dual phase steel via thermomechanical processing of cold rolling and intercritical annealing. Mater. Chem. Phys. 2019, 230, 1–8. [Google Scholar] [CrossRef]
- Tasan, C.C.; Diehl, M.; Yan, D.; Bechtold, M.; Roters, F.; Schemmann, L.; Zheng, C.; Peranio, N.; Ponge, D.; Koyama, M.; et al. An Overview of Dual-Phase Steels: Advances in Microstructure-Oriented Processing and Micromechanically Guided Design. Annu. Rev. Mater. Res. 2015, 45, 391–431. [Google Scholar] [CrossRef]
- Available online: https://www.ssab.com/en/brands-and-products/docol/automotive-steel-grades/dual-phase-steel (accessed on 10 April 2023).
- Song, R.; Ponge, D.; Raabe, D.; Speer, J.G.; Matlock, D.K. Overview of processing, microstructure and mechanical properties of ultrafine grained bcc steels. Mater. Sci. Eng. A 2006, 441, 1–17. [Google Scholar] [CrossRef]
- Mandal, M.; Patra, S.; Anand, K.A.; Chakrabarti, D. An experimental and mathematical study on the evolution of ultrafine ferrite structure during isothermal deformation of metastable austenite. Mater. Sci. Eng. A 2018, 731, 423–437. [Google Scholar] [CrossRef]
- Klug, M. Optimization of the Specimen Geometry for the Wedge Rolling Test. Bachelor’s Thesis, Faculty of Natural Sciences and Technology, University of Ljubljana, Ljubljana, Slovenia, 2013. (In Slovene). [Google Scholar]
- Parsa, M.H.; Ahmadabadi, M.N.; Shirazi, H.; Poorganji, B.; Pournia, P. Evaluation of microstructure change and hot workability of high nickel high strength steel using wedge test. J. Mater. Process. Technol. 2008, 199, 304–313. [Google Scholar] [CrossRef]
- Beladi, H.; Kelly, G.L.; Hodgson, P.D. Formation of ultrafine grained structure in plain carbon steels through thermomechanical processing. Mater. Trans. 2004, 45, 2214–2218. [Google Scholar] [CrossRef] [Green Version]
- Vodopivec, F.; Kosec, L.; Godec, M. Hot ductility of austenite stainless steel with a solidification structure. Mater. Technol. 2006, 40, 129–137. [Google Scholar]
- Rusz, S.; Schindler, I.; Suchánek, P.; Turoňová, P.; Kubečka, P.; Heger, M.; Hlisníkovský, M.; Liška, M. Utilization of the hot wedge test in research of hot formability of free-cutting stainless steels. Acta Metall. Slovaca 2007, 13, 577–582. [Google Scholar]
- Čížek, L.; Greger, M.; Kocich, R.; Rusz, S.; Juřička, I.; Dobrzański, L.A.; Tański, T. Structure characteristics after rolling of magnesium alloys. In Proceedings of the 13th International Conference on Achievements in Mechanical and Materials Engineering, Gliwice-Wisla, Poland, 16–19 May 2005. [Google Scholar]
- Kvíčala, M.; Klimek, M.; Schindler, I. Study of Technological Formability of Low-Alloyed Steel 25CrMo4. Hutnické Listy 2009, 6, 13–15. [Google Scholar]
- Kubina, T.; Schindler, I.; Turoňova, P.; Heger, M.; Franz, J.; Liška, M.; Hlisníkovsky, M. Mathematic simulation of the wedge rolling test and computer processing of laboratory results. Acta Metall. Slovaca 2006, 12, 469–476. [Google Scholar]
- Stalheim, D. Metallurgical strategy for optimized production of QT high-strength and abrasion-resistant plate steels. In Proceedings of the AISTech2019 Iron and Steel Technology Conference, Pittsburgh, PA, USA, 6–9 May 2019; pp. 1881–1892. [Google Scholar]
- Lissel, L. Modeling the Microstructural Evolution during Hot Working of C-Mn and of Nb Microalloyed Steels Using a Physically Based Model. Ph.D. Thesis, Royal Institute of Technology, School of Industrial Engineering and Management, Material Science and Engineering, Division of Mechanical Metallurgy, Stockholm, Sweden, 2006. [Google Scholar]
- Fajfar, P. Predelava Materialov; Department of Materials and Metallurgy, Faculty of Natural Sciences and Technology, University of Ljubljana: Ljubljana, Slovenia, 2016. (In Slovene) [Google Scholar]
- Stalheim, D.; Glodowski, R. Fundamentals of the generation of fine grain as-rolled structural steels. In Proceedings of the AIST International Symposium on the Recent Developments in Plate Steels, Winter Park, CO, USA, 19–22 June 2011; pp. 25–32. [Google Scholar]
- Zenga, R.; Huanga, L.; Lia, J.; Lib, H.; Zhua, H.; Zhang, X. Quantification of multiple softening processes occurring during multi-stage thermoforming of high-strength steel. Int. J. Plast. 2019, 120, 64–87. [Google Scholar] [CrossRef]
- Mucg83 Program. Available online: https://www.phase-trans.msm.cam.ac.uk/map/steel/programs/mucg83.html (accessed on 10 April 2023).
- Edberg, J.; Lindgren, L.E.; Jarl, M. The wedge rolling test. J. Mater. Process. Technol. 1994, 42, 227–238. [Google Scholar] [CrossRef]
- Irvin, K.J. Strong Structural Steels, Symposium Low Alloy High Strength Steels, the Metallurg Companies; Frese-Druck: Düsseldorf, Germany, 1970. [Google Scholar]
- Klančnik, G.; Foder, J.; Bradaškja, B.; Kralj, M.; Klančnik, U.; Lalley, P.; Stalheim, D. Hot Deformation Behavior of C-Mn Steel with Incomplete Recrystallization during Roughing Phase with and without Nb Addition. Metals 2022, 12, 1597. [Google Scholar] [CrossRef]
- EN 10025-2; Hot Rolled Products of Structural Steels-Part 2, Technical Delivery Conditions for Non-Alloy Structural Steels. European Committee for Standardization: Brussels, Belgium, 2019.
- Barbosa, R.; Boratto, F.; Yue, S.; Jonas, J.J. Processing, Microstructure and Properties of HSLA Steels; DeArdo, A.J., Ed.; The Minerals, Metals & Materials Society AIME: Warrendale, PA, USA, 1988; p. 51. [Google Scholar]
- Stalheim, D.; Wright, M.R. Fundamentals of developing fine grained structures in “as rolled” long products. In Proceedings of the 51th Rolling Seminar—Processes, Rolled and Coated Products, Foz do Iguaçu, Brazil, 28–31 October 2014. [Google Scholar]
- Azizi-Alizamini, H.; Militzer, M.; Poole, W.J. Formation of Ultrafine Grained Dual Phase Steels through Rapid Heating. ISIJ Int. 2011, 51, 958–964. [Google Scholar] [CrossRef] [Green Version]
- Wang, J.; Kang, Y.; Yang, C.; Wang, Y. Effect of Heating Temperature on the Grain Size and Titanium Solid-Solution of Titanium Microalloyed Steels. Mater. Sci. Appl. 2019, 10, 558–567. [Google Scholar] [CrossRef] [Green Version]
- Stalheim, D.G.; Barbosa, R.A.N.M.; de Moura Bastos, F.M.M.; Gorni, A.A.; Rebellato, M.A. Basic Metallurgy/Processing Design concepts for optimized hot strip structural steel in yield strengths from 300–700 MPa. In Proceedings of the 53th Rolling Seminar, ABM Week, Rio de Janeiro, Brazil, 27–29 September 2016. [Google Scholar] [CrossRef] [Green Version]
- Beynon, J.H.; Sellars, C.M. Modelling Microstructure and Its Effects during Multipass Hot Rolling. ISIJ Int. 1992, 32, 359–367. [Google Scholar] [CrossRef] [Green Version]
- Siwecki, T. Modelling of Microstructure Evolution during Recrystallization Controlled Rolling. ISIJ Int. 1992, 32, 368–376. [Google Scholar] [CrossRef] [Green Version]
- Bombac, D.; Peet, M.J.; Zenitani, S.; Kimura, S.; Kurimura, T.; Bhadeshia, H.K.D.H. An integrated hot rolling and microstructure model for dual-phase steels. Model. Simul. Mater. Sci. Eng. 2014, 22, 045005. [Google Scholar] [CrossRef]
- Calcagnotto, M.; Ponge, D.; Raabe, D. Microstructure Control during Fabrication of Ultrafine Grained Dual-phase Steel: Characterization and Effect of Intercritical Annealing Parameters. ISIJ Int. 2012, 52, 874–883. [Google Scholar] [CrossRef] [Green Version]
- Calcagnotto, M.; Ponge, D.; Raabe, D. Effect of grain refinement to 1 μm on strength and toughness of dual-phase steels. Mater. Sci. Eng. 2010, A527, 7832–7840. [Google Scholar] [CrossRef]
Figure 1.
(a) Geometry of the test sample (sketch taken from the FEM simulation), (b) Test schedule, and (c) Final sample with locations selected for investigation (marked A to E). The arrows represent the position of the grain size evolution study (through the thickness cross-section). The edge integrity in rolling length is well preserved—the material acts ductile during rolling.

Figure 2.
Mesh sensitivity analysis of the wedge sample mesh (C3D8R elements); a decreasing element size below 4 mm gained neglectable little accuracy at the expense of a significantly longer computing time.
Figure 2.
Mesh sensitivity analysis of the wedge sample mesh (C3D8R elements); a decreasing element size below 4 mm gained neglectable little accuracy at the expense of a significantly longer computing time.

Figure 3.
An example of experimental and fitted Gleeble hot compression true stress-true strain (σ-ε) diagram: DRX flow curves for both deformation rates (1 and 3 s−1) at 1100 °C are presented for the C-Mn type of composition and were also used for DP 600 in this study. The estimated absolute error is +/−10 MPa (based on the Sellars constitutive equation, adapted after [3]). For the highest rate, a simplified hypothetical saturation stress limit () was added (dotted line) to observe the softening due to DRX.

Figure 4.
(a) Predicted CCT using JMatPro and (b) KIN with the internal material database.

Figure 5.
Calculated mean values of (a) the bite angle, deformation zone, and (b) strain rate with the per notch position of increasing mean strain, e. Each point on the diagram represents an increasing notch position (see Table 1 for reference).
Figure 5.
Calculated mean values of (a) the bite angle, deformation zone, and (b) strain rate with the per notch position of increasing mean strain, e. Each point on the diagram represents an increasing notch position (see Table 1 for reference).

Figure 6.
Image of the deformed wedge sample after post-rolling according to the simulation.

Figure 7.
Simulated true strain, ε, of the deformed wedge sample.

Figure 8.
(a) Simulated relative strain e (calculated from the software’s output ε) to the mean relative strain based on the notches on the wedge sample (Table 1). (b) Simulated strain rate (given as an average trend) in correlation to the mean relative strain based on the notches on the wedge sample (dotted line—edge, solid line—center). Both simulated values are shown for the edge and the center of the wedge sample in the longitudinal direction, see Figure 6.

Figure 9.
(a) Average grain size in correlation with the calculated mean strain, e, per specific notch position; measured on the metallographic samples taken from the rolled wedge sample. The secondary axis represents the ratio between the average grain size in the longitudinal direction (L.G.) and the transverse direction (T.G.) for the given deformation as an indication of modest (if any) pancaking at high e. (b) Mixed grain distribution using Feret’s diameter and visible grain size multimodality with only a single pass. The results are based on SE micro-photographs taken at 2500× magnification.

Figure 10.
Based on the example of the literature review [3,17,20,25,33,34] and the current work, a schematic representation of grain size evolution was proposed concerning PAG, rolling schedule (geometry and related , temperature, and cooling regime considering the metallurgical per pass reduction. Here, Mode I represents continuous grain refining at higher starting roughing temperatures (coarse starting PAG); Mode II represents continuous grain refining at lower roughing temperatures and/or finer starting PAG; Mode III represents deformations usually conducted under Tnrx; Mode IV represents grain growth due to insufficient deformation during roughing, the pre-existing high density of HAGB and a lack of pinning particles; Mode V represents post-deformation grain growth after completion of SRX (with low t50) or activated fast MDRX with the available post-deformation cooling rate and lack of second phase particles/SD or synergetic effect of decreased roll chill and adiabatic heating on the last notch positions in dependence on the roll length.

Figure 11.
(a–d): An example of the graphical representation using the exploded distribution of the coarse grain (CG) to fine grain microstructure with a representation using solely the ferrite grain (FG) size. Enlargement: 2500×. ND and RD represent normal and rolling directions, respectively. (e) An example of OM with weak banding with M enrichment. Here, M and B also stand for SM and LB. Enlargement: 500×. (f) Minor deviation of M percentage on finally cooled per notch positions.


Table 1.
Engineering (relative) deformation per notch position (/) using a 3 mm rolling gap.
| Position | e1 | e2 | e3 | e4 | e5 | e6 | e7 | e8 | e9 * |
|---|---|---|---|---|---|---|---|---|---|
| Target | 0.04 | 0.12 | 0.21 | 0.32 | 0.41 | 0.50 | 0.60 | 0.70 | 0.75 |
| Actual | 0.05 | 0.08 | 0.12 | 0.21 | 0.32 | 0.39 | 0.51 | 0.62 | 0.68 |
| Actual ratio ** | 1.05 | 1.08 | 1.13 | 1.27 | 1.46 | 1.64 | 2.04 | 2.62 | 3.12 |
* Notch position e9 marks the final flat end of the wedge sample. ** Measured on actual starting and achieved exit thickness per notch position. (Calculation of true strain from relative follows: ).
Table 2.
Material properties used in the FEM calculation.
| Density (g/cm3) | Young’s Modulus (GPa) | Poisson’s Ratio |
|---|---|---|
| 7.485 | 98.85 | 0.36 |
Table 3.
Chemical composition of the as-cast ingot (in wt.%).
| C | Si | Mn | Cr | Ni | Mo | Al * | Cu | Ntot | Ti + Nb + V | Fe | CEV [26] |
|---|---|---|---|---|---|---|---|---|---|---|---|
| 0.072 | 0.19 | 1.38 | 0.56 | <0.01 | <0.01 | 0.031 | <0.01 | 0.018 | 0.0125 | Bal. | 0.42 |
* Minimum 0.02 wt.% Al was considered for a fully killed grade. The ratio Al: N < 2.0 indicates the potential availability of soluble nitrogen in the austenitic matrix as no other nitrogen-binding elements were introduced.
Table 4.
Wedge sample dimensions post-rolling: comparison between the actual test and the simulation (in mm).
Table 4.
Wedge sample dimensions post-rolling: comparison between the actual test and the simulation (in mm).
| a | b | c | End Thickness | |
|---|---|---|---|---|
| Actual test | 95.15 | 281.52 | 101.28 | 2.98–3.86 |
| Simulation | 95.86 | 322.58 | 112.80 | 3.00 |
Disclaimer/Publisher’s Note: The statements, opinions and data contained in all publications are solely those of the individual author(s) and contributor(s) and not of MDPI and/or the editor(s). MDPI and/or the editor(s) disclaim responsibility for any injury to people or property resulting from any ideas, methods, instructions or products referred to in the content. |
© 2023 by the authors. Licensee MDPI, Basel, Switzerland. This article is an open access article distributed under the terms and conditions of the Creative Commons Attribution (CC BY) license (https://creativecommons.org/licenses/by/4.0/).
Share and Cite
MDPI and ACS Style
Klančnik, U.; Fajfar, P.; Foder, J.; Palkowski, H.; Burja, J.; Klančnik, G. Grain Size Distribution of DP 600 Steel Using Single-Pass Asymmetrical Wedge Test. Crystals 2023, 13, 1055. https://doi.org/10.3390/cryst13071055
AMA Style
Klančnik U, Fajfar P, Foder J, Palkowski H, Burja J, Klančnik G. Grain Size Distribution of DP 600 Steel Using Single-Pass Asymmetrical Wedge Test. Crystals. 2023; 13(7):1055. https://doi.org/10.3390/cryst13071055
Chicago/Turabian StyleKlančnik, Urška, Peter Fajfar, Jan Foder, Heinz Palkowski, Jaka Burja, and Grega Klančnik. 2023. "Grain Size Distribution of DP 600 Steel Using Single-Pass Asymmetrical Wedge Test" Crystals 13, no. 7: 1055. https://doi.org/10.3390/cryst13071055
Note that from the first issue of 2016, this journal uses article numbers instead of page numbers. See further details here.