
Microstructural and Hall–Petch Analysis of Additively Manufactured Ferritic Alloy Using 2507 Duplex Stainless Steel Powder

1
Department of Materials Science and Engineering, University of Michigan, Ann Arbor, MI 48105, USA
2
Department of Mechanical Engineering, University of Michigan, Ann Arbor, MI 48105, USA
3
Department of Mechanical Engineering, Texas A&M University, College Station, TX 77843, USA
*
Author to whom correspondence should be addressed.
Crystals 2024, 14(1), 81; https://doi.org/10.3390/cryst14010081
Submission received: 8 December 2023
/
Revised: 28 December 2023
/
Accepted: 8 January 2024
/
Published: 15 January 2024
(This article belongs to the Section Crystalline Metals and Alloys)
Abstract
:The powder bed fusion–laser beam (PBF-LB) process, a method of additive manufacturing (AM), was used to print duplex stainless steel (DSS) using commercial-grade 2507 powders. While conventionally processed DSS has a two-phase microstructure consisting of 50% austenite and 50% ferrite, the PBF-LB-printed 2507 alloy was nearly 100% ferrite. Optimal processing conditions that minimized porosity were determined to be 290 W laser power and 1000 mm/s scan speed, and grain size, texture, and phases were characterized as a function of laser power and scan speed. Grain size increased with increasing laser power but decreased with increasing scan speed. A <100> texture diminished with increasing scan speed from 1000 mm/s to 1400 mm/s. No austenite phase was detected. Transmission electron microscopy (TEM) and scanning transmission electron microscopy (STEM) characterization revealed nanoscale chromium nitride precipitates in the ferritic matrix (incoherent hexagonal close-packed (HCP) precipitates at grain boundaries and coherent body-centered cubic (BCC) precipitates within the grains) and a high density of tangled dislocations. Tensile tests of as-printed alloys showed a yield strength of 570 MPa, an ultimate tensile strength of 756 MPa, and an elongation to failure of 10%. The tensile properties were analyzed based on the observed microstructure considering grain size, nanoscale precipitates, and the high density of dislocations.
1. Introduction
Duplex stainless steel with a two-phase microstructure, typically 50% body-centered cubic (BCC) ferrite and 50% face-centered cubic (FCC) austenite [1], exhibits higher strength than a fully austenitic stainless steel while still maintaining better ductility than a fully ferritic stainless steel [2]. To achieve such a phase ratio, a substantial Cr content is needed, which also imparts high corrosion resistance to the DSS alloy [3]. The precise Cr percentage can vary from 20 wt.% to 25 wt.% depending on whether it is lean grade, super grade, or hyper grade [4]. As a result, DSS finds extensive application in environments requiring both high strength and exceptional corrosion resistance, such as undersea structures, petrochemical and petroleum applications, pulp and paper manufacturing, and seawater desalination [2].
Additive manufacturing (AM) is a method that has gained popularity for its potential to easily and quickly manufacture complex parts for use in a variety of load-bearing applications. Specifically, the powder bed fusion–laser beam (PBF-LB) process has demonstrated the capability of creating small-scale, intricate designs more easily than traditional machining [5]. While many traditional metallic alloys, such as austenitic stainless steels [6,7], aluminum alloys [8,9], and copper alloys [10,11], have been extensively studied in terms of their processing through PBF-LB printing, the fabrication of DSS through PBF-LB printing remains less explored.
The limited literature on PBF-LB-processed DSS alloys [12,13,14,15,16,17,18,19,20] is primarily focused on documenting the effects of processing parameters on the porosity, with relatively less attention devoted to microstructural analysis and understanding of microstructure–mechanical behavior relationships. For example, Davidson and Singamneni [14,15] conducted two investigations to examine the impact of processing conditions on the build quality of DSS, specifically focusing on porosity and certain microstructural features. However, the analysis solely relied on microhardness testing instead of tension testing to study the mechanical behavior, and the effects of processing parameters on texture and grain size were not reported. On the other hand, Nigon et al. [16] carried out a thorough study on how processing affected the porosity in their samples but did not investigate other potential microstructural changes that might have occurred.
This investigation attempts to fill that gap and provide a comprehensive study on how the processing conditions affect the microstructure, build quality, and tensile properties of as-built PBF-LB alloy using commercial-grade DSS powders. The effect of processing conditions, specifically laser scan speed and laser power, along with the input energy density volume, were examined, to see not only how it affects the density of the final build but also the grain size, texture, and dislocation microstructure. Furthermore, room temperature tensile testing was performed on the sample with the least porosity, and Hall–Petch analysis was conducted to compare the results with those found in the existing literature. Through these analyses, the tensile properties of PBF-LB-printed DSS alloy 2507 are correlated with the defect microstructures.
2. Materials and Methods
For this study, 12 samples of DSS 2507 alloy were fabricated through the PBF-LB process using the Open Additive PANDA™ 2.0 Metal 3D Printing System, varying the laser power from 280 W to 310 W and laser scan speed from 1000 mm/s to 1400 mm/s while maintaining the hatch spacing at 90 μm and deposited layer thickness at 40 μm for all samples. The exact value used for each sample is listed in Table 1. Additionally, the laser scan strategy was the same across all samples and involved a bidirectional scan with a 60° rotation after each layer. The sample made with processing conditions of 280 W laser power and 1400 mm/s scan speed did not print properly during the print run and was omitted from the study.
After fabrication, each sample was cut normal to the build direction and metallographically polished for subsequent examination. For electron backscatter diffraction (EBSD) preparation, the samples were ground with 600–1200 grit SiC paper, followed by polishing with 1 μm diamond suspension and 0.04 μm colloidal silica. The scan strategy and area examined are depicted in Figure 1.
Commercial-grade alloy 2507 DSS powder supplied by GKN Additive Inc. was used. Scanning electron microscopy (SEM) and energy-dispersive spectroscopy (EDS) were conducted on the as-received powders using the TESCAN Mira 3 FEG SEM, and the composition was measured to be the following, by weight: 64.34% Fe, 27.44% Cr, 5.72% Ni, 1.57% Mo, 1.36% Mn, and 0.28% Si. An SEM image and EBSD scan of the powder are shown in Figure 2. The powders were spherical with average diameter of 25 μm, and the microstructure is ferrite-rich with ≈96.8 vol.% BCC ferrite and ≈3.2 vol.% FCC austenite. Separate chemical analysis of the as-built parts was not performed but is planned for follow-up works.
The Nikon Eclipse LV100D Upright Microscope was used to observe the porosity found in an inner layer of each sample. To verify the optical microscopy (OM) measurements, X-ray microCT scans, using the Zeiss Xradia Versa 520 3D X-ray Microscope, were performed on 3 separate samples that were fabricated using the best and worst performing processing parameters. These samples were made through PBF-LB printing with dimensions of 500 μm × 500 μm × 2 mm. Lastly, EDS scans were carried out on one sample to confirm that the pores seen under OM were actual pores and not other phases such as oxide inclusions or trapped particles from polishing.
Along with the build quality, the microstructure was examined using EBSD to determine the phase formation, average grain size, and texture. For EBSD, a scan area of 2 mm × 2 mm and step size of 3 μm was used for each sample. Analysis of the scans was carried out through the EDAX OIM Analysis™ version 7.0 software.
Transmission electron microscopy (TEM) as well as scanning transmission electron microscopy (STEM) characterization were conducted using a Thermo Fisher Talos F200X G2 S/TEM to characterize nanoscale phases within the grains, grain boundary of the as-built samples that were not resolved using SEM/EBSD, and dislocation microstructure formed within the grains from processing. TEM specimens were prepared by focused ion beam (FIB) milling using a Nova 200 Nanolab and a Helios G4 Plasma FIB UXe SEM/FIB for foil lift-out and thinning to electron transparency, respectively.
The tensile properties of the as-built samples were tested using the INSTRON 3382A with a 6 mm Epsilon extensometer. Separate tensile samples, with dimensions of 10 mm gage length × 2 mm gage width × 2 mm thickness, were fabricated using the same processing conditions and were tested in the as-built condition after being ground with 1200-grit SiC paper. The samples were loaded normal to the build direction, and the tests were conducted with a constant displacement rate of 0.3 mm/min, resulting in an initial strain rate of 0.0005/s.
3. Results
3.1. Optimal Processing Parameters
The build quality of each sample was determined by the area fraction of pores measured from OM examination of polished surfaces and is shown in Figure 3. Here, the measured area fraction is assumed to be equal to the volume fraction of porosity and is plotted against the volumetric energy density (Figure 3a) and the individual scan speeds for different laser powers used (Figure 3b). The volumetric energy density (J/mm3) was calculated using the equation:
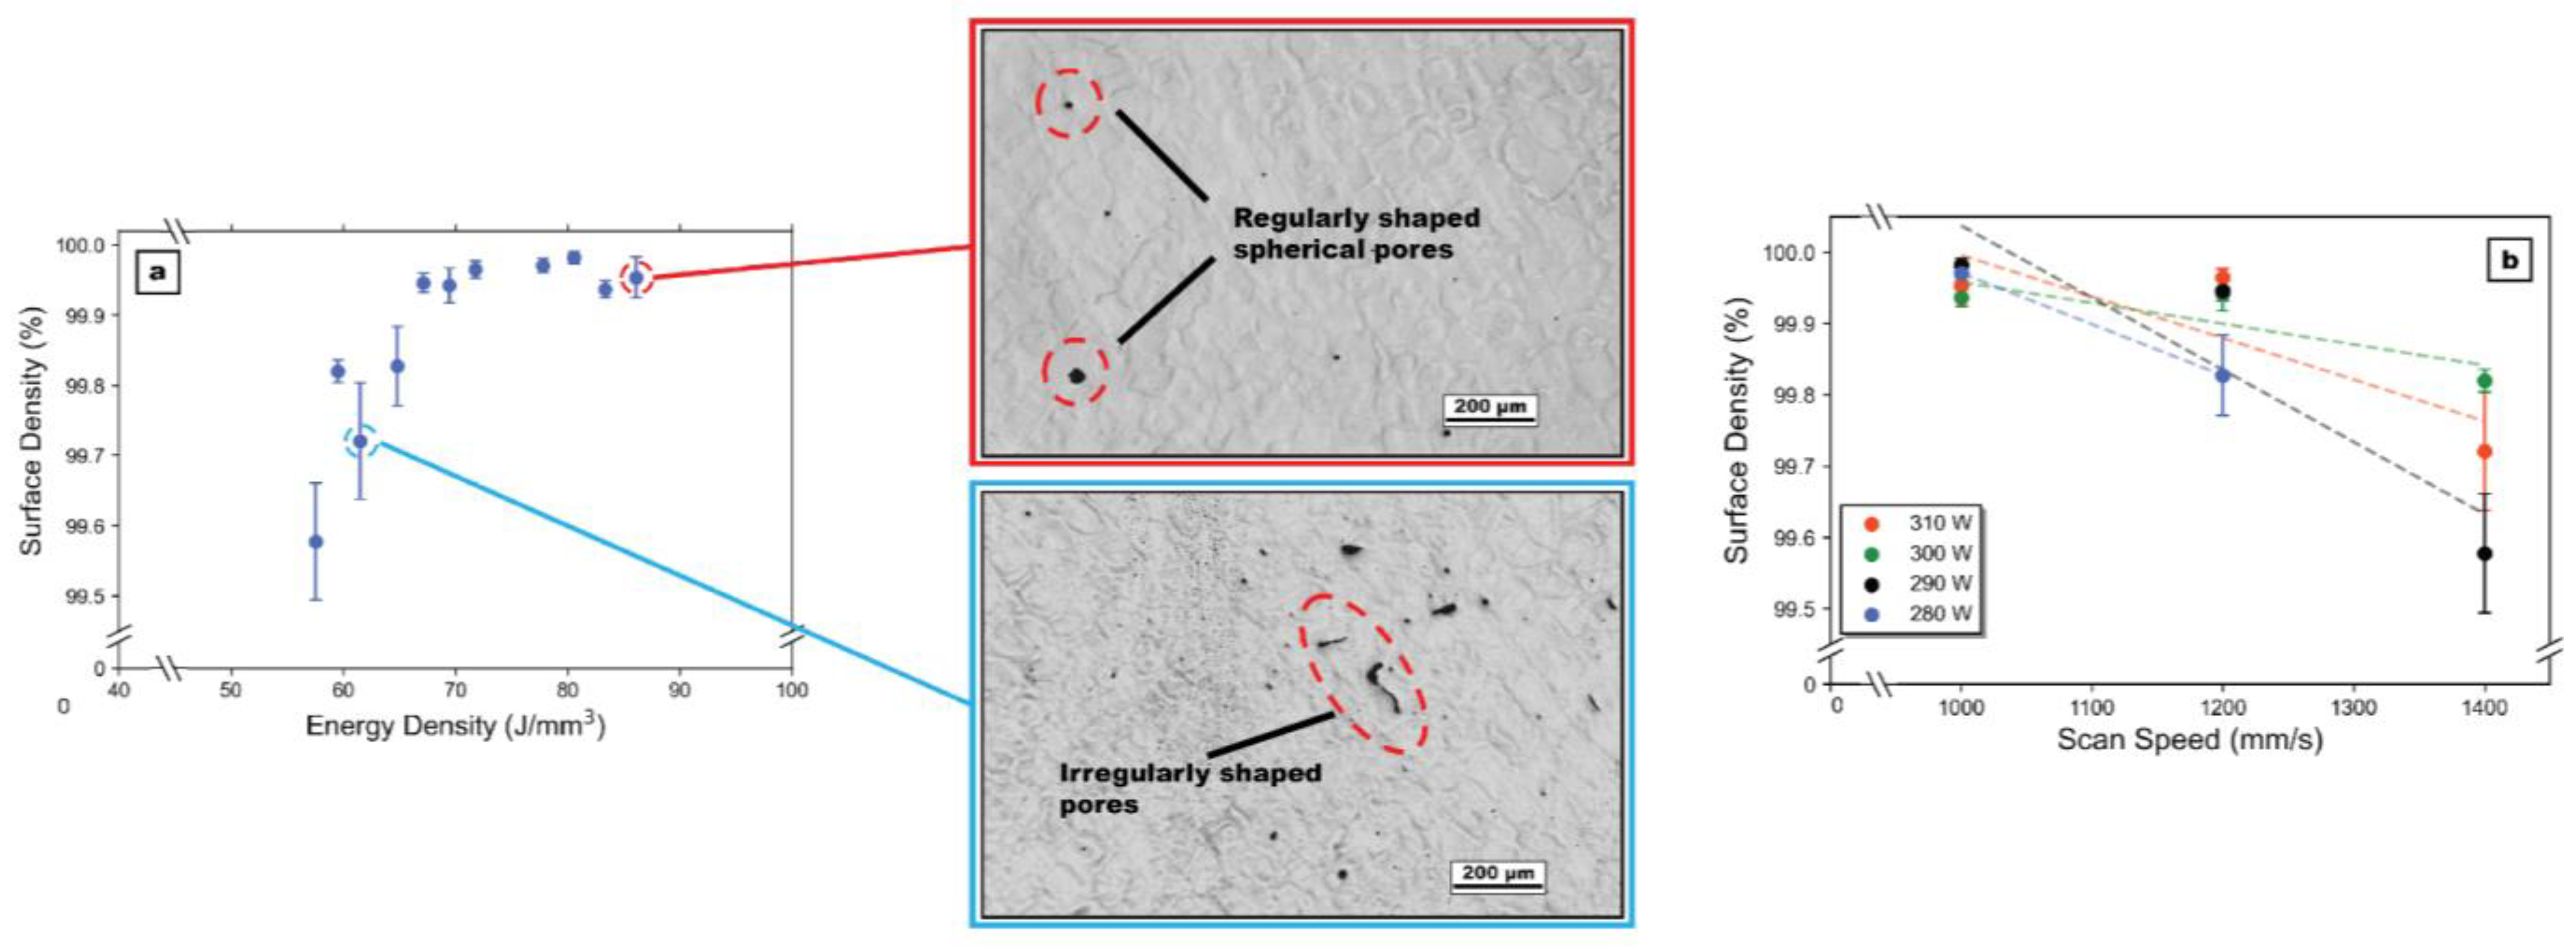
where P is the laser power, v is the laser scan speed, h is the hatch spacing, and t is the deposited layer thickness. Figure 3a shows that the density of the printed alloy increases with input energy density, reaching a peak around 78 J/mm3, then falls. Additionally, the pore morphology differs at low and high energy density, with Figure 3a showing more elongated, irregularly shaped pores in a sample printed with low energy density, and more regularly shaped, spherical pores in a sample printed with high energy density. In Figure 3b, a different trend, with increasing laser power depending on the laser scan speed, can be observed. At 1200 mm/s, there is a monotonic increase in surface density with laser power, but at 1400 mm/s, the surface density peaks then decreases with increasing laser power. Additionally, at 1000 mm/s, a different trend is seen, with the surface density first falling then rising with increased laser power. Furthermore, the same is seen if individual laser powers are isolated while varying the scan speed, as at 310 W and 300 W, the density increases when changing speed from 1000 mm/s to 1200 mm/s but decreases when the speed is changed to 1400 mm/s. However, at 280 W and 290 W, the density monotonically increases with increasing scan speed.
To verify the porosity found through OM, EDS scans of sample 6 were obtained and are shown in Figure 4. The lack of signal of Fe, O, and Si indicates that the defects are pores and not particles embedded during polishing or oxide inclusions from manufacturing.
To confirm the porosity trends inferred from OM, X-ray microCT scans were performed, on two samples with low porosity (#7 and #10) and one with high porosity (#3), instead of on an individual slice, to examine the pores developed in 3D. Due to the high attenuation of X-rays from Fe, separate thin samples with width and thickness of 500 μm were fabricated using the same processing conditions of samples 7, 10, and 3. The samples were not subjected to any post-processing conditions and were scanned in the as-built condition. Figure 5 shows the porosity of the inner portion of each sample to ensure no surface effects are seen. These scans display the same trend seen through OM, with samples 7 and 10 possessing significantly less pores than sample 3. Further, it is noteworthy that the pores in samples 7 and 10 exhibit a more spherical shape, whereas those in sample 3 appear more irregular. This observation aligns with the trend in pore morphology observed through OM.
3.2. Microstructure Characterization
The microstructure of each sample was examined through EBSD. Figure 6 shows the IPF maps for each sample, which were used to extract the grain size and texture information. The results are reported in Figure 7 and Figure 8, respectively. The average grain diameter is plotted against the energy density, scan speed, and laser power, and clear trends for all three parameters are observed. Figure 7 shows that the grain size increases with increasing energy density (Figure 7a) and laser power (Figure 7b) but decreases with increasing scan speed (Figure 7c). The IPF maps in Figure 6 show the grain morphology with low scan speed samples (Figure 6d,g,j) demonstrating clear growth along scan lines and high scan speed samples (Figure 6c,f,i) not demonstrating clear grain growth along scan lines.
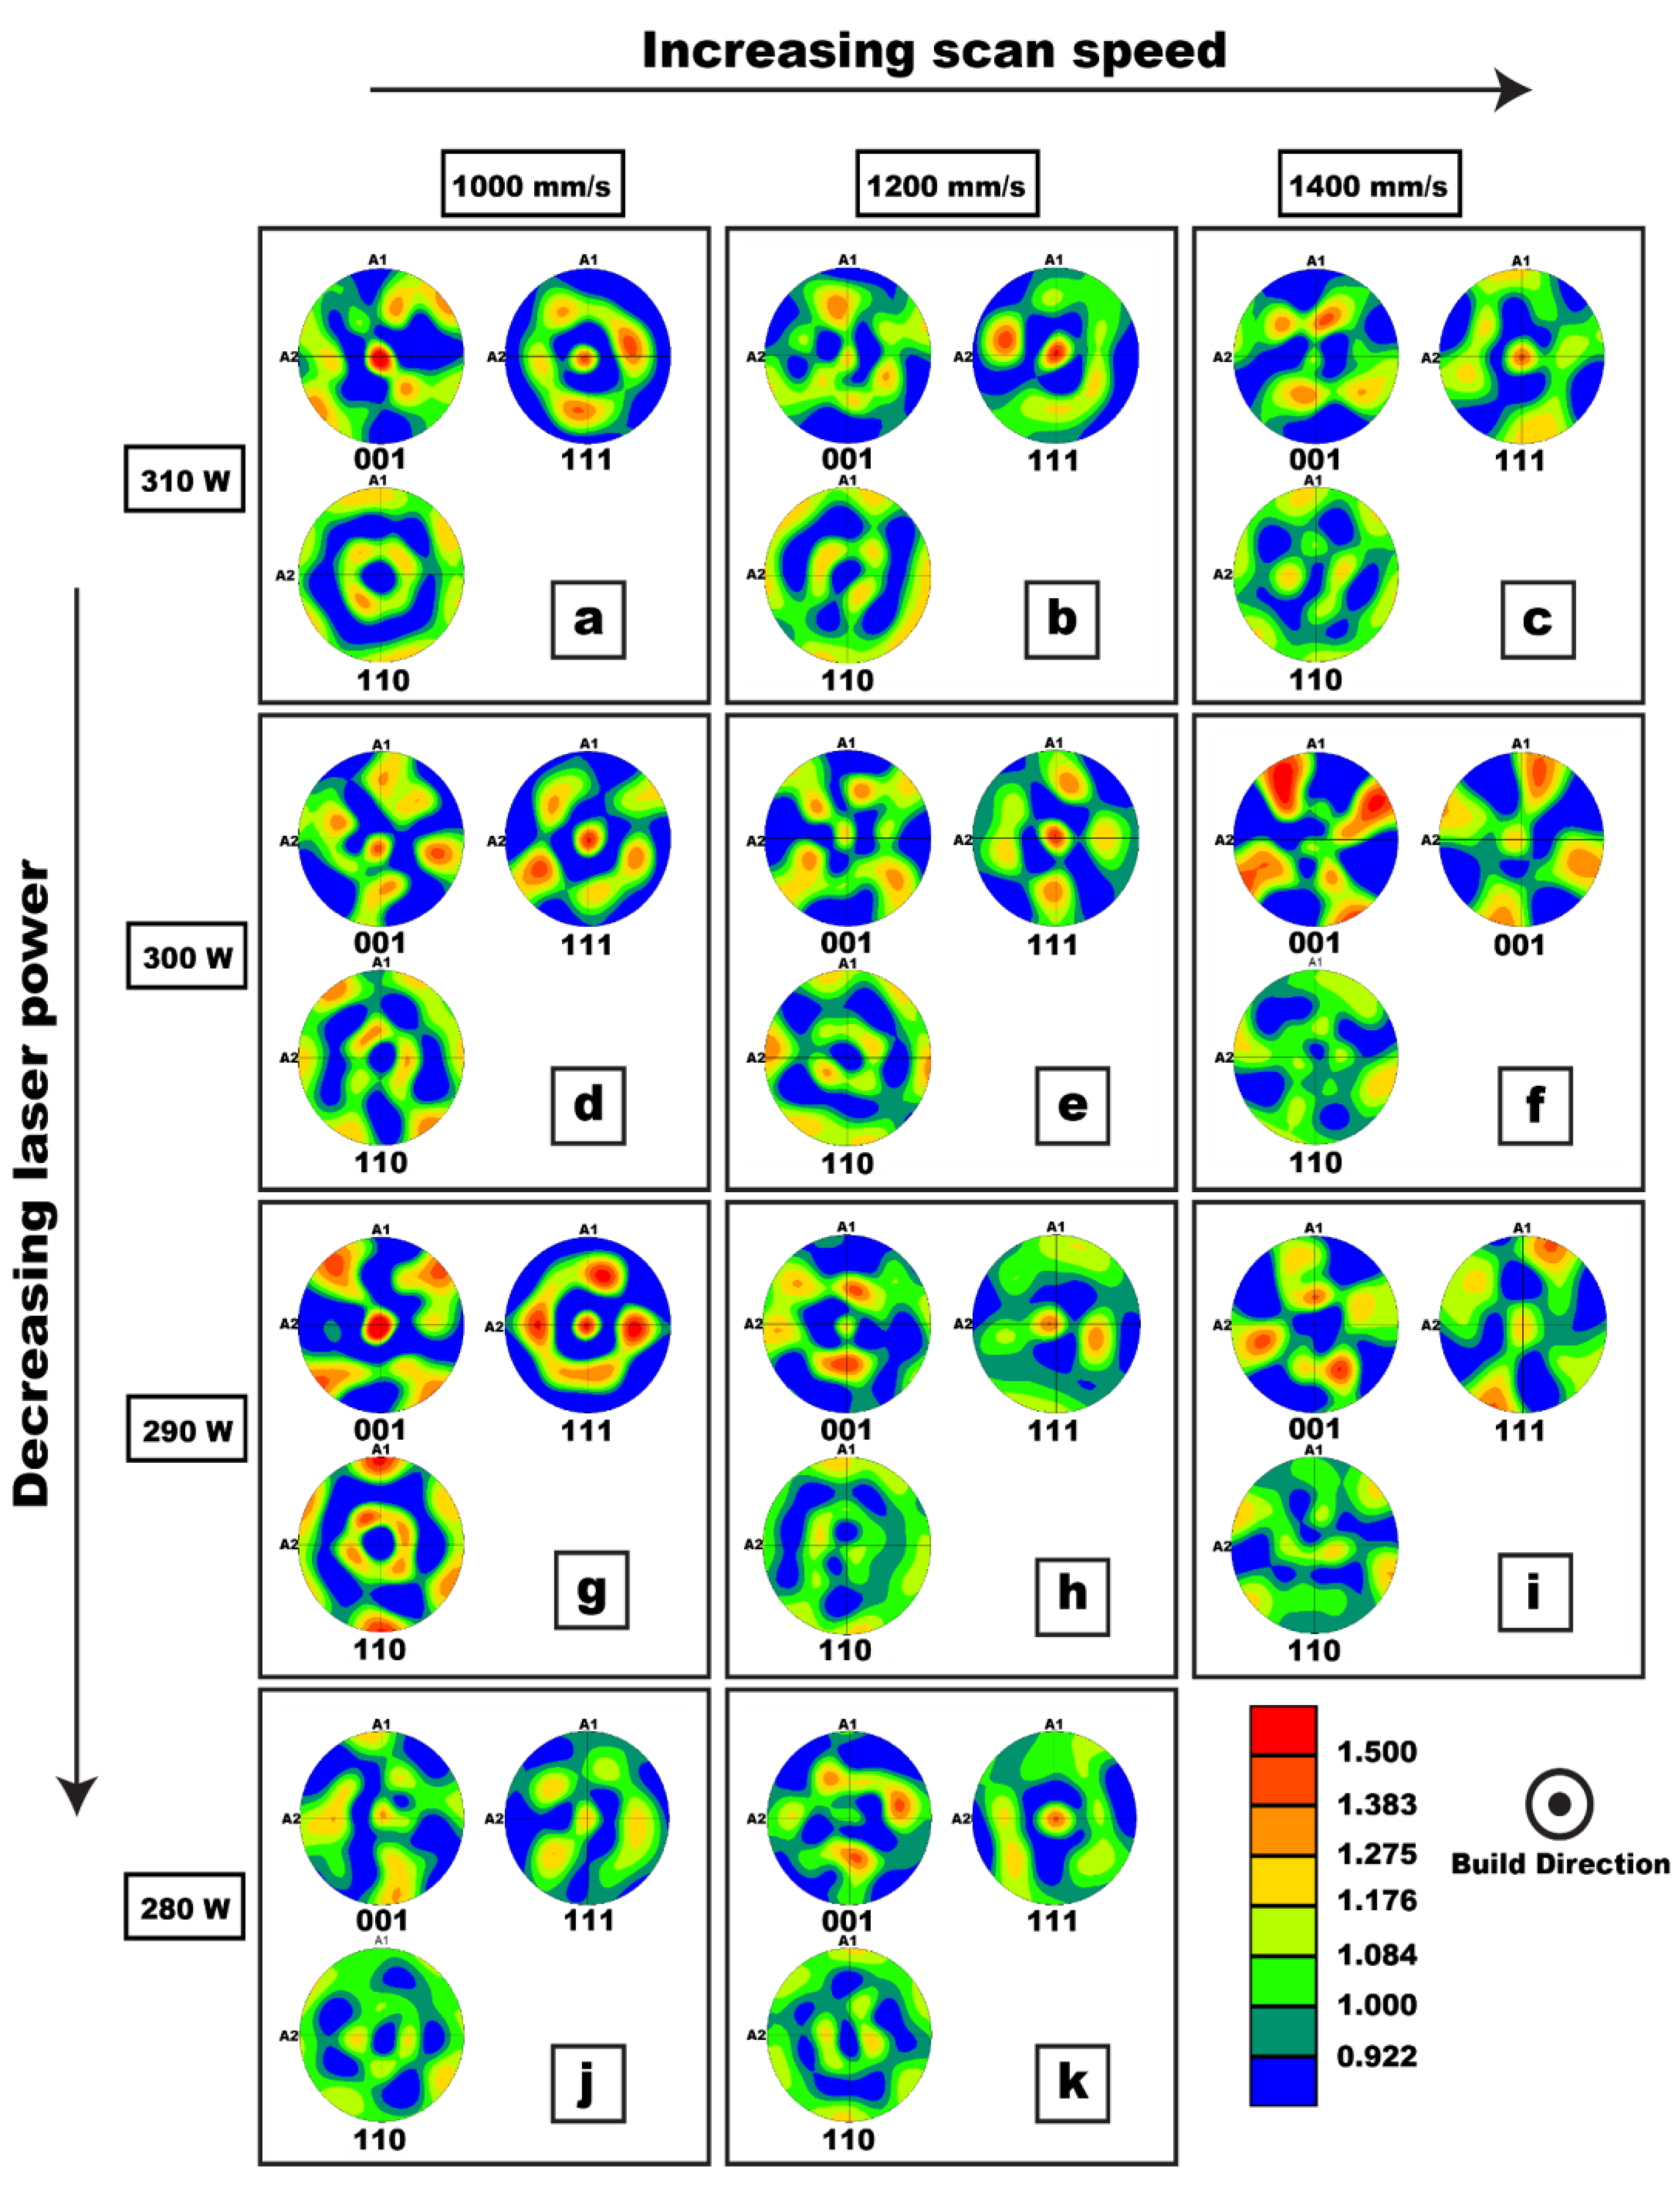
The texture of each sample is shown in Figure 8. A clear trend is seen with scan speed as, at low scan speeds, a preferred <001> grain orientation can be observed along the build direction; however, at higher scan speeds, the texture is lost. No clear trend, however, is seen with the changing laser powers.
The phases in each sample were identified to understand the role of the process parameters on the duplex phase formation in DSS alloys. The results are presented in Figure 9, and it can be observed that the processing conditions are unable to affect the phase formation, as each sample displayed a purely BCC, or ferrite, phase structure, whereas a two-phase BCC+FCC microstructure is normally reported for this composition under conventional casting and heat treatment.
Since EBSD does not resolve fine-scale precipitates, scanning transmission electron microscopy (STEM) analysis was performed on sample 10 to confirm if the microstructure was 100% ferrite, as implied from Figure 9, and the results are presented in Figure 10 and Figure 11. In Figure 10a, cylindrical precipitates with width <20 nm and length ~60–70 nm are seen distributed randomly in the ferrite grains. Energy-dispersive X-ray spectroscopy (EDXS) reveals the depletion of Fe with the enrichment of Cr and N within the precipitates. Additionally, Figure 10c,d display high-resolution scanning transmission electron microscope (HR-STEM) images from a precipitate, revealing the coherency between the precipitate and the ferrite grain. Figure 10e,f depict the corresponding fast Fourier transform (FFT) pattern of the ferrite and precipitate that are consistent with the <> zone of the body-centered cubic (BCC) crystal structure of ferrite and CrN [21], showcasing that the precipitate is coherent with the ferrite matrix.
In contrast, Figure 11a depicts a cluster of nanoscale precipitates with diameters of ~25–30 nm observed at the grain boundary of the two neighboring ferritic grains, which are also confirmed to be Cr2N [21] precipitates based on EDXS mapping. Detailed analysis of the precipitates forming within the grain boundary was further investigated by HR-STEM imaging. Figure 11b illustrates the HR-STEM image of one such precipitate, while Figure 11c indicates the incoherent interface of the ferrite grain and the precipitate. The corresponding FFT pattern along with the zone axis of <2110> shown in Figure 11d indicates that these precipitates have a hexagonal close-packed (HCP) structure that is incoherent with the ferrite grain. Interestingly, our STEM analysis did not reveal any austenite precipitates in the sample, confirming the accurate identification of the samples as ferritic by the EBSD scans.
The processing-induced dislocation structure formed in sample 10 was also examined through TEM, and these results are shown in Figure 12. Figure 12a shows a BF-STEM image of the ferrite grain after tilting to the <> zone axis of BCC (inset shows the diffraction pattern along the BCC <> zone axis) precipitates, which confirms the evidence of a high density of dislocations that have formed through the L-PBF process within the ferrite grain. Figure 12b shows a two-beam BF-STEM image of the ferrite matrix, indicating the dislocation structure only in the (110) plane of the BCC precipitates, while the inset represents the diffraction pattern under a two-beam diffraction condition with the strong reflection of the (110) spot marked by the red circle. Furthermore, the dislocations do not form a cell structure as has been seen in PBF-LB-printed austenitic 316L [5]. The dislocation density introduced by processing can influence the tensile stress–strain response of the printed alloy, as shown in the following section.
3.3. Tensile Behavior
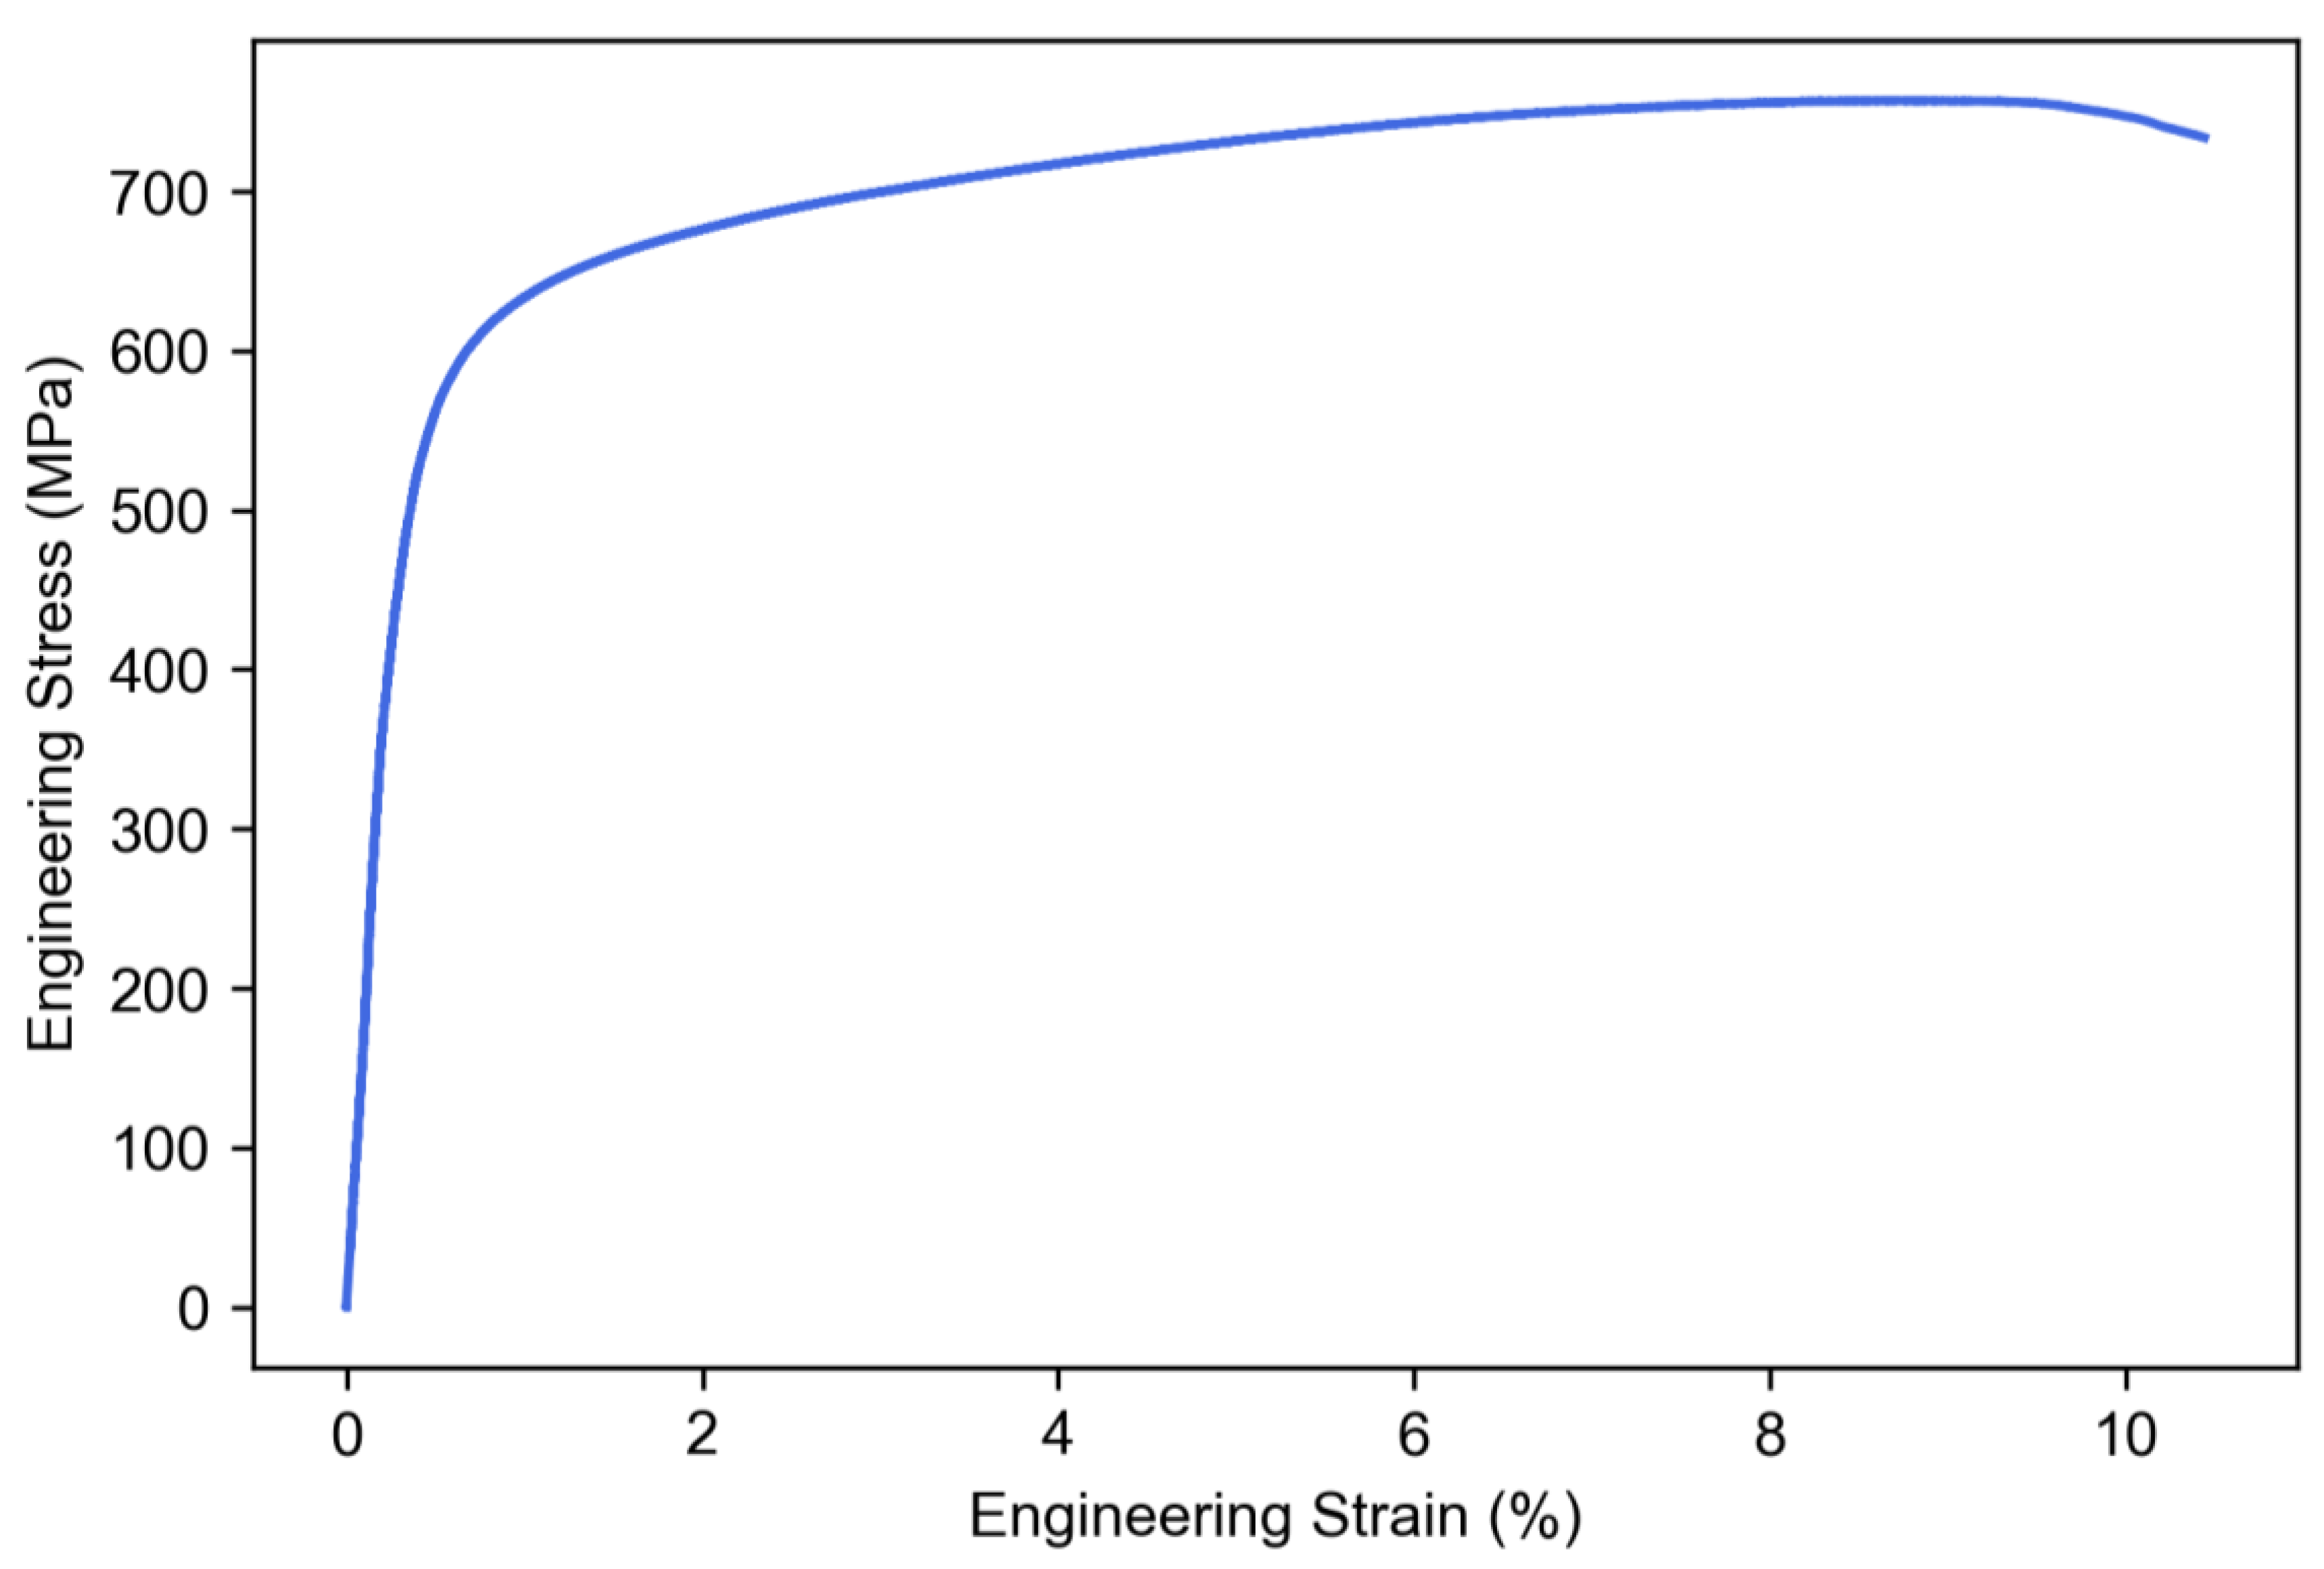
Tensile tests were performed on printed alloys with minimal porosity (sample 10). The sample was printed and tested in the as-built condition, and the engineering stress–strain curve is shown in Figure 13 The 0.2% offset yield strength and ultimate tensile strength (UTS) were measured to be 564 ± 6 MPa and 748 ± 9 MPa, respectively, with a ductility of ~10 ± 1%. In comparison to other studies, Nigon et al. [16] and Haghadadi et al. [13] reported yield strengths of 826 MPa and 651 MPa, UTSs of 872 MPa and 844 MPa, and elongations to failure of 11.2% and 18%, respectively.
4. Discussion
4.1. Optimal Processing Parameters
The trend of porosity increasing at both high energy densities (~85 J/mm3) and low energy densities (~60–70 J/mm3) can be explained by the formation of keyhole porosity at high energy densities and the lack of fusion defects at low energy densities. Lack of fusion is a type of defect that occurs when there is insufficient melting of the powder, preventing it from properly welding to adjacent melt pools and previous layers. The pores that develop from this are typically elongated and irregularly shaped [22,23]. On the other hand, keyhole porosity occurs due to the instability of the keyhole that forms during the scanning process, which leads bubbles of metal vapor or entrapped shield gas to spin off and become trapped in the solidifying layer [5,24]. This is evidenced by Figure 3a: as in the low energy density sample, the pores are more elongated and irregularly shaped compared to the more regular spherical shape of the pores present in the high energy density sample.
This trend in porosity and input energy density of additively manufactured metals is, in general, consistent with literature [9,16,25]. However, in one of the more comprehensive examinations of the processing conditions on the build quality of DSS by Davidson and Singamneni [15], a different trend in energy density and porosity was observed with porosity first decreasing with increasing energy density then reaching a minimum and increasing with energy density. However, this was seen when the scan speed was held constant and only the laser power was varied. This can be explained by looking at the underlying processing conditions used to determine the energy density value, namely, the scan speed and laser power. As mentioned previously, depending on which scan speed or laser power is chosen, a different trend will occur as the other parameter is increased. This means that simply correlating the density of the printed part with the laser input energy density is not enough, and the underlying values of power and scan speeds are necessary. Additionally, it has been shown by Gu et al. [26] that for a different stainless steel alloy, the porosity will vary significantly, even if the same energy density is used, if the scan speed and laser power are different, furthering the notion that energy density should not be used as the sole parameter to predict build quality, at least not in this simplistic form.
4.2. Microstructure Characterization
4.2.1. Grain Size and Morphology
The clear trend seen with grain size, energy density, laser power, and scan speed can be explained by the changes in cooling rate caused by changes in each of these parameters. Cooling rate is measured using the following equation [27]:
where G is the temperature gradient within the melt pool, and R is the solidification rate. It has been shown for various material systems that the feature size during solidification decreases with increasing cooling rate; this is demonstrated quantitatively through the following empirical relationship [5,27]:
where d is the secondary dendritic arm spacing of the columnar and equiaxed dendrites, εC is the cooling rate, and n and b are material specific constants. The relationship between the processing parameters and cooling rate has also been empirically established, with cooling rate following the proportionality:
where P is the laser power, and v is the scan speed. This proportionality is the same as energy density in relation to laser power and scan speed, meaning cooling rate is directly proportional to energy density. Therefore, it is expected that grain size should increase with increasing energy density and laser power but decrease with laser scan speed, which is observed in Figure 4.
Cooling rate = G × R
d = b(εC)−n
The differences seen in grain morphology can also be explained by the solidification processing map [27], as the scan speed is directly proportional to the solidification rate since the solidification front is the boundary of the melt pool. As a result, when the scan speed is increased, the grain morphology transitions from columnar to equiaxed. Despite not observing the cross section of the samples, the low scan speed samples (Figure 6a,d,g,j) with grains forming in line with the scan direction indicate a more columnar growth morphology compared to the more random grain formation seen in the high scan speed samples (Figure 6c,f,i).
4.2.2. Texture Formation
The trend seen in the texture with scan speed is likely due to changes in the melt pool geometry when changing the scan speed. At low scan speeds, the melt pool will penetrate deep into the previous layers and will form more elliptically aligned grains with the build direction [11]. As a result, the thermal gradient will form parallel to the surface for a large portion of the melt pool. Further, it has been established that for cubic systems, the grains will form in the <001> direction along the thermal gradient. The reason is that during solidification, there is competitive growth between different growth directions, and the direction that dominates is based on which has the highest growth velocity. The growth velocity is based on the following equation [28,29,30]:
where Vb is the beam velocity (scan speed), Ψ is the angle between the normal to the solidification interface and the preferred crystallographic direction, and θ is the angle between the heart flow direction and scanning direction. Therefore, the <100> direction will have the largest velocity and will outcompete the growth of the other growth directions in growth normal to the melt pool boundary. As a result, at low scan speeds, if more of the thermal gradients are parallel to each other, then more of the growth will occur in the same orientation. On the other hand, as the scan speed increases, the melt pool elongates along the scanning direction and has a higher curvature, so less of the thermal gradients become parallel to each other [11]. This results in the <001>-direction grains forming neither parallel nor perpendicular to each other, disrupting the preferred grain orientation along build direction. This has also been shown to occur, by Jadhave et al., in pure copper under the PBF-LB process [11].
4.2.3. Phase Formation
As established through EBSD and TEM, the phase formation was unchanged with increasing scan speed and laser power with a fully ferritic phase structure. Under traditional manufacturing methods, such as casting, it is expected that the chemical composition of 2507 DSS would result in both austenite and ferrite phase formation [31]. However, as has been shown in other studies [12,16], the high cooling rate in L-PBF suppresses the formation of austenite. As shown in Figure 9, this remains true even for different laser powers and scan speeds, which implies that, despite altering the cooling rate by adjusting the scan parameters, the changes were insufficient to impact the phase formation significantly. To quantify how much the cooling rate was affected by the scan parameters, an empirical relationship established by Bertoli et al. [32] for 316L can be used to estimate cooling rate:
The cooling rates for each pair of processing parameters are listed in Table 2 and show that the range in cooling rates is roughly 2–3 × 10⁶ K/s. This means that changing the cooling rate within this specific range cannot access the trapped austenite phase that would typically be present in a 50:50 ratio of the material, given its chemical composition. A wider range of cooling rates can be further tested but will likely require changes in hatch spacing and layer thickness so as to not cause excessive porosity. It is important to note that the powder used itself does not have a 50:50 ratio of ferrite to austenite; instead, it is composed of ≈96 vol.% ferrite, as depicted in Figure 2. This is likely attributed to the high cooling rate during the gas atomization process used to form the powder [33]. As a result, the starting point of the PBF-LB process might not have the equilibrium 50:50 phase ratio. If the cooling rate in gas atomization is high enough to reduce austenite to ≈3 vol.%, then the even higher cooling rates in the PBF-LB process can completely suppress austenite in the microstructure and result in significantly different microstructure than conventional processing of the same alloy composition.
4.3. Tensile Behavior
4.3.1. Conventional versus PBF-LB
In evaluating the mechanical performance of the sample made through PBF-LB, first a comparison to a conventionally manufactured ferritic stainless steel is needed. Takaki [34] established that an interstitial free (IF) ferritic steel has a Hall–Petch coefficient of 0.15 MPam1/2 and a friction stress of ~50 MPa. The IF ferritic steel was chosen as a comparison, as the chemical composition of the powder used in this study had a negligible amount of carbon, meaning it can be considered IF. In addition, Cr, Ni, Mo, Mn, and Si content present in the DSS 2507 alloy will provide solid solution strengthening, which has been found to increase the yield strength by 5.6 MPa/wt%Cr, by Funakawa and Ujiro [35], 25.8 MPa/at% Si, 15.9 MPa/at%Mo, 16.9 MPa/at%Mn, and 19.2 MPa/at%Ni by Pickering. The relationship for Cr was found empirically for ferritic steels with Cr content up to 23%. While this may not necessarily hold true for higher Cr content, it can still act as a good estimate for the increase in strength from the 27% Cr content in the 2507 alloy. Using the Hall–Petch equation:
where kh is the Hall–Petch coefficient, d is the average grain diameter, and is the friction stress, the yield strength of a 40 μm IF ferrtic steel with 27 wt% Cr is predicted to be 170 MPa, which is significantly lower than what was measured for the PBF-LB sample. Including the other alloying elements, the predicted yield strength increases to ≈325 MPa, which is still significantly lower than what was measured. It is therefore clear that other strengthening mechanisms play a significant role in the yield strength of the sample. From the TEM analysis, fine scale chromium nitride precipitates and a high dislocation density of 4.83 × 10¹⁴ m−2 were observed that will contribute to additional strengthening. To calculate the contributions of each, the precipitate strengthening can be determined by the Ashby-Orowan relationship [36], as the precipitates are large enough to cause dislocations to bow around the precipitates rather than shear them:
where M is the Taylor factor (~2.75 in polycrystalline BCC materials [37]), G is the shear modulus (81.6 GPa for BCC Fe [38]), b is the Burgers vector (0.248 nm for BCC Fe [39]), v is Poisson’s ratio (0.293 for BCC Fe [38]), LVC is the average inter-particle spacing, and x is the average particle diameter on the slip planes. LVC and x are given by the following equations:
where f is the volume fraction of precipitates and rVC is the average precipitate radius. The volume fraction of precipitates and average particle radius were measured by image analysis of Figure 11b, and estimated to be ~0.09 and ~35 nm. Therefore the estimated strength increase is ≈358 MPa. For dislocation strengthening, the Bailey-Hirsh relationship [40] can be used:
where is the dislocation density and is a constant (0.38 for BCC Fe [41]). From this, the strength increase is estimated to be ≈443 MPa. The total calculated yield strength can be determined by the following equation:
where is the grain boundary strengthening given by the Hall–Petch relationship and is the solid solution strengthening given by the empirical relationship with Cr. The estimated yield strength is therefore: 50 MPa(σ0) + (24 MPa (σgb) + 325 MPa (σss) + 443 MPa (σdis) + 358 MPa (σppt) = ≈1201 MPa, which significantly overestimates the yield strength measured. One potential reason for the overestimate is with the Taylor factor used. The Taylor factor for a randomly oriented polycrystalline BCC Fe is ~2.75. However, as shown in Figure 7, a strong <100> texture is seen for sample 10, which suggests that utilizing the Taylor factor of a randomly textured BCC metal may not be appropriate for this case. Instead, Rosenberg and Piehler [37] showed that for BCC metals, the Taylor factor decreases to a minimum of 2.1 for grains oriented in the <100> direction [37]. Therefore, it is more reasonable to use a Taylor factor of 2.2–2.3 for the dislocation and precipitate strengthening. To confirm this, the average Taylor factor was calculated from the EBSD scan using MTEX and determined to be 2.31. Additionally, another reason for the strength over estimation may be due to the high dislocation density, solute concentration and small inter-particle spacing. The average dislocation spacing can be estimated by ptotal−½ giving an average of ~45 nm, with the average precipitate spacing being ~100 nm. With such a high concentration, it has been suggested that the strength should be calculated as a sum of squares rather than normal addition [39,42,43]:
this comes from the fact that solutes, precipitates and dislocations act as obstacles preventing dislocation glide, and so when they are present in high concentrations the effective spacing between them is not a simple addition of each, but a sum of squares relationship [42,44]. As a result, the strengthening effect follows the same relationship. Taking these into account gives an estimated yield strength of 50 MPa(σ0) + 24 MPa (σgb) + [(325 MPa (σss))2 + (372 MPa (σdis))2 + (300 MPa (σppt))2 ]½ ≈ 652 MPa, which is in much better agreement with the yield strength measured from sample 10.
Traditionally manufactured 2507 DSS made through casting and hot-rolling have been reported with yield strengths ≈480–500 MPa [45,46], and elongations of >25%. Compared to sample 13, the yield strength is lower, while the ductility is higher. The lower yield strength is likely due to the increased dislocation density that forms from the L-PBF process, as well as the higher austenite content in the casted samples. This is also the reason for the higher ductility in the casted sample, as the presence of a significant austenite phase fraction (≈50%) allows for higher ductility than the purely ferritic samples reported here.
Samples made with other processing conditions were not tested so as to avoid excessive porosity from affecting the mechanical behavior of the as-printed samples. Davidson and Singamneni [15] have reported hardness tests with samples of 2507DSS made with different processing conditions, and found a decrease in hardness with an increase in austenite content from lower energy densities. Since the correlation was found between a change in austenite content, but no change in austenite content with processing conditions was found here, it is likely that this effect would not be found. The grain size was observed to change with changing processing parameters, but given that the minimum grain size was ~35 μm, as shown by the analysis above, it would have minimal impact on the yield strength. However, other properties, such as dislocation density and nitride precipitation could be affected, and is planned to be examined in future works.
4.3.2. Hall–Petch Analysis of PBF-LB-Made Samples
To compare the mechanical behavior to other samples printed by PBF-LB, a Hall–Petch plot was constructed using data from the literature of mostly ferritic DSS alloys made through PBF-LB, and is shown in Figure 14. Values from the literature were used, as changing the grain size would require altering the processing conditions, which would result in higher porosity, or applying post-processing heat treatments, but the purpose is to understand the Hall–Petch relationship in the as-built condition. Each yield strength, ultimate tensile strength, and grain size were taken from the as-built condition samples as reported in each study. Each of the samples in the other studies were made with 2205 DSS instead of 2507 DSS, and reported some amount of austenite (~0.5–2%) precipitated in the as-built condition. From the Hall–Petch plot, a Hall–Petch coefficient of 0.183 MPam1/2 for yield strength and 0.219 MPam1/2 for ultimate tensile strength are calculated. The Hall–Petch coefficient, therefore, is in good agreement with that of the IF ferritic steel which was conventionally processed. It is important to note, however, that some of the other alloy compositions taken from the literature have a relatively higher carbon concentration, with the sample made by Haghdadi et al. [13] for example, having 0.02wt%. Furthermore, Takeda et al. [47] found that slight increases in carbon, such as 0.006wt% can lead to large increases in the Hall–Petch coefficient (from 0.1 to 0.55 MPam1/2). One reason for why this large Hall–Petch coefficient may not be seen is due to the high cooling rate preventing carbon from fully diffusing to the grain boundaries, and staying within a solid solution. Wilson [48] found that increasing the cooling rate by only a few K/s can lessen the effect of carbon on the Hall–Petch coefficient, and so it is likely that the significantly higher cooling rate from PBF-LB printing compared to conventionally manufacturing will have a significant effect in reducing the Hall–Petch to values similar to IF steels.
From the Hall–Petch plot, it is also shown that the yield strength relation to grain size has significantly more scatter than that of the ultimate tensile strength. One reason for the increased scatter is likely related to variations in the initial dislocation density that forms during printing. As discussed previously, the high dislocation density plays a major role in the strengthening of the printed part. This dislocation density likely arises from the high internal stresses that form during printing, due to the contraction that occurs during the melt pool solidification stressing the previous solidified layer enough to cause yielding. For example, Yadroitsev and Yadroitsava [49] showed that during the printing of 316L, the thermal stress due the contraction of the melt pool during solidification can exceed the yield strength of 316L up to 150 μm in depth of the part. However, the areas affected by the high thermal stress and the magnitude of the stress depend on the scanning parameters [50] as well as the height of the build, with the stress decreasing with increased build height.
Compared to the yield strength, the ultimate tensile strength does not have as much scatter in the Hall–Petch plot and is likely due to the decrease in variance of the dislocation density after yielding. The work hardening rate is inversely proportional to the dislocation density and is quantified through Taylor’s law [51]:
where is the plastic strain. As a result, the dislocation density will likely balance between samples as they are strained, leaving the grain boundary strengthening to have a more dominant effect on the ultimate tensile strength than the initial dislocation density.
Figure 14.
Hall–Petch plot using (a) yield strength and (b) ultimate tensile strength. Data taken from reported values in each work and from sample 10 reported here [13,16,46,52,53].

The yield strength and ultimate tensile strength of sample 10 were measured to be lower than those of the other samples made through the PBF-LB process [13,16,46,52,53], even after accounting for the grain size differences. In other studies [13,16,46,52,53], austenite precipitates were reported and could be an additional source of precipitation strengthening depending on the size and distribution of the precipitates.
5. Conclusions
From this examination of how the L-PBF processing conditions affect the build quality, microstructure, and mechanical properties of DSS, the following important observations were made:
- 1.
- The simple energy density formula alone may not effectively capture the underlying processes that affect the porosity formation during the L-PBF process. Instead, it is better to use it in conjunction with the underlying processing parameters to attain a more accurate prediction of the build quality. Additionally, DSS displays similar trends to other metals in terms of how the energy density, scanning speed, and laser power affect the build quality, and the optimal processing conditions observed are shown.
- 2.
- Both the scan speed and laser power have a noticeable effect on the grain size, while only scan speed seems to strongly affect the texture. These can be important factors to consider when deciding on scan parameters, as they may affect the mechanical performance of the as-built samples.
- 3.
- The phase formation appears to be unaffected within this range of scan parameters; these parameters are unable to unlock the trapped austenite phase due to the high cooling rate of the L-PBF process.
- 4.
- Chromium nitride precipitates were observed in the microstructure exhibiting HCP and BCC crystal structures when formed at the grain boundaries and within ferrite grains, respectively.
- 5.
- The measured yield and ultimate tensile strengths can be explained using a combination of strengthening mechanisms: grain boundary strengthening (Hall–Petch), initial dislocation density, and fine-scale chromium nitride precipitates.
As a result, our study provides a comprehensive look at how the processing conditions used in L-PBF affect the formation of DSS and can help act as a base for further examinations of the material in additive manufacturing. This includes our future planned work on examining the hardness and residual stress relationship in as-built L-PBF samples.
Author Contributions
Investigation, M.T., M.T.A. and B.P.S.; Writing—Original Draft, M.T.; Conceptualization, M.T. and M.T.A.; Supervision, A.M. All authors have read and agreed to the published version of the manuscript.
Funding
This research was funded by the Center for Research Excellence on Dynamically Deformed Solids sponsored by the Department of Energy-National Nuclear Security Administration, Stewardship Science Academic Program under Award No. DE-NA0003857.
Data Availability Statement
The raw data supporting the conclusions of this article will be made available by the authors on request.
Acknowledgments
This research was supported, in part, by the Center for Research Excellence on Dynamically Deformed Solids sponsored by the Department of Energy-National Nuclear Security Administration, Stewardship Science Academic Program under Award No. DE-NA0003857. We also acknowledge the University of Michigan College of Engineering for financial support and the Michigan Center for Materials Characterization for use of the instruments and staff assistance.
Conflicts of Interest
The authors declare no conflicts of interest.
References
- Gunn, R.N. (Ed.) Duplex Stainless Steels: Microstructure, Properties and Applications; Abington Publishing: Cambridge, UK, 1997. [Google Scholar]
- Francis, R.; Byrne, G. Duplex Stainless Steels—Alloys for the 21st Century. Metals 2021, 11, 836. [Google Scholar] [CrossRef]
- Chail, G.; Kangas, P. Super and hyper duplex stainless steels: Structures, properties and applications. Procedia Struct. Integr. 2016, 2, 1755–1762. [Google Scholar] [CrossRef]
- Zhang, D.; Liu, A.; Yin, B.; Wen, P. Additive manufacturing of duplex stainless steels—A critical review. J. Manuf. Process. 2022, 73, 496–517. [Google Scholar] [CrossRef]
- DebRoy, T.; Wei, H.L.; Zuback, J.S.; Mukherjee, T.; Elmer, J.W.; Milewski, J.O.; Beese, A.M.; Wilson-Heid, A.; De, A.; Zhang, W. Additive manufacturing of metallic components—Process, structure and properties. Prog. Mater. Sci. 2018, 92, 112–224. [Google Scholar] [CrossRef]
- Krakhmalev, P.; Fredriksson, G.; Svensson, K.; Yadroitsev, I.; Yadroitsava, I.; Thuvander, M.; Peng, R. Microstructure, Solidification Texture, and Thermal Stability of 316 L Stainless Steel Manufactured by Laser Powder Bed Fusion. Metals 2018, 8, 643. [Google Scholar] [CrossRef]
- Riemer, A.; Leuders, S.; Thöne, M.; Richard, H.A.; Tröster, T.; Niendorf, T. On the fatigue crack growth behavior in 316L stainless steel manufactured by selective laser melting. Eng. Fract. Mech. 2014, 120, 15–25. [Google Scholar] [CrossRef]
- Rao, H.; Giet, S.; Yang, K.; Wu, X.; Davies, C.H. The influence of processing parameters on aluminium alloy A357 manufactured by Selective Laser Melting. Mater. Des. 2016, 109, 334–346. [Google Scholar] [CrossRef]
- Maamoun, A.H.; Xue, Y.F.; Elbestawi, M.A.; Veldhuis, S.C. Effect of Selective Laser Melting Process Parameters on the Quality of Al Alloy Parts: Powder Characterization, Density, Surface Roughness, and Dimensional Accuracy. Materials 2018, 11, 2343. [Google Scholar] [CrossRef]
- Popovich, A.; Sufiiarov, V.; Polozov, I.; Borisov, E.; Masaylo, D.; Orlov, A. Microstructure and mechanical properties of additive manufactured copper alloy. Mater. Lett. 2016, 179, 38–41. [Google Scholar] [CrossRef]
- Jadhav, S.; Dadbakhsh, S.; Goossens, L.; Kruth, J.-P.; Van Humbeeck, J.; Vanmeensel, K. Influence of selective laser melting process parameters on texture evolution in pure copper. J. Am. Acad. Dermatol. 2019, 270, 47–58. [Google Scholar] [CrossRef]
- Hengsbach, F.; Koppa, P.; Duschik, K.; Holzweissig, M.J.; Burns, M.; Nellesen, J.; Tillmann, W.; Tröster, T.; Hoyer, K.-P.; Schaper, M. Duplex stainless steel fabricated by selective laser melting—Microstructural and mechanical properties. Mater. Des. 2017, 133, 136–142. [Google Scholar] [CrossRef]
- Haghdadi, N.; Ledermueller, C.; Chen, H.; Chen, Z.; Liu, Q.; Li, X.; Rohrer, G.; Liao, X.; Ringer, S.; Primig, S. Evolution of microstructure and mechanical properties in 2205 duplex stainless steels during additive manufacturing and heat treatment. Mater. Sci. Eng. A 2022, 835, 142695. [Google Scholar] [CrossRef]
- Davidson, K.; Singamneni, S. Selective Laser Melting of Duplex Stainless Steel Powders: An Investigation. Mater. Manuf. Process. 2016, 31, 1543–1555. [Google Scholar] [CrossRef]
- Davidson, K.P.; Singamneni, S.B. Metallographic evaluation of duplex stainless steel powders processed by selective laser melting. Rapid Prototyp. J. 2017, 23, 1146–1163. [Google Scholar] [CrossRef]
- Nigon, G.N.; Isgor, O.B.; Pasebani, S. The effect of annealing on the selective laser melting of 2205 duplex stainless steel: Microstructure, grain orientation, and manufacturing challenges. Opt. Laser Technol. 2021, 134, 106643. [Google Scholar] [CrossRef]
- Mulhi, A.; Dehgahi, S.; Waghmare, P.; Qureshi, A.J. Process Parameter Optimization of 2507 Super Duplex Stainless Steel Additively Manufactured by the Laser Powder Bed Fusion Technique. Metals 2023, 13, 725. [Google Scholar] [CrossRef]
- Becker, L.; Boes, J.; Lentz, J.; Cui, C.; Steinbacher, M.; Li, Y.; Fechte-Heinen, R.; Theisen, W.; Weber, S. Influence of annealing time on the microstructure and properties of additively manufactured X2CrNiMoN25–7–4 duplex stainless steel: Experiment and simulation. Materialia 2023, 28, 101720. [Google Scholar] [CrossRef]
- Piras, M.; Hor, A.; Charkaluk, E. Control of the Microstructure and Mechanical Properties of a Super Duplex SAF 2507 Steel Produced by Additive Manufacturing. In Advances in Additive Manufacturing: Materials, Processes and Applications; Mabrouki, T., Sahlaoui, H., Sallem, H., Ghanem, F., Benyahya, N., Eds.; Lecture Notes in Mechanical Engineering; Springer Nature: Cham, Switzerland, 2024; pp. 1–9. [Google Scholar] [CrossRef]
- Gargalis, L.; Karavias, L.; Graff, J.S.; Diplas, S.; Koumoulos, E.P.; Karaxi, E.K. A Comparative Investigation of Duplex and Super Duplex Stainless Steels Processed through Laser Powder Bed Fusion. Metals 2023, 13, 1897. [Google Scholar] [CrossRef]
- Hones, P.; Martin, N.; Regula, M.; Vy, F.L. Structural and mechanical properties of chromium nitride, molybdenum nitride, and tungsten nitride thin films. J. Phys. D Appl. Phys. 2003, 36, 1023–1029. [Google Scholar] [CrossRef]
- Yang, X.; Li, Y.; Li, B. Formation mechanisms of lack of fusion and keyhole-induced pore defects in laser powder bed fusion process: A numerical study. Int. J. Therm. Sci. 2023, 188, 108221. [Google Scholar] [CrossRef]
- Darvish, K.; Chen, Z.; Pasang, T. Reducing lack of fusion during selective laser melting of CoCrMo alloy: Effect of laser power on geometrical features of tracks. Mater. Des. 2016, 112, 357–366. [Google Scholar] [CrossRef]
- Cunningham, R.; Zhao, C.; Parab, N.; Kantzos, C.; Pauza, J.; Fezzaa, K.; Sun, T.; Rollett, A.D. Keyhole threshold and morphology in laser melting revealed by ultrahigh-speed X-ray imaging. Science 2019, 363, 849–852. [Google Scholar] [CrossRef]
- Kasperovich, G.; Haubrich, J.; Gussone, J.; Requena, G. Correlation between porosity and processing parameters in TiAl6V4 produced by selective laser melting. Mater. Des. 2016, 105, 160–170. [Google Scholar] [CrossRef]
- Gu, H.; Gong, H.; Pal, D.; Rafi, K.; Starr, T.; Stucker, B. Influences of Energy Density on Porosity and Microstructure of Selective Laser Melted 17- 4PH Stainless Steel. In Proceedings of the 2013 International Solid Freeform Fabrication Symposium, Austin, TX, USA, 12–14 August 2013. [Google Scholar] [CrossRef]
- Kou, S. Welding Metallurgy, 2nd ed.; John Wiley & Sons, Inc.: Hoboken, NJ, USA, 2002. [Google Scholar] [CrossRef]
- Wei, H.L.; Mazumder, J.; DebRoy, T. Evolution of solidification texture during additive manufacturing. Sci. Rep. 2015, 5, 16446. [Google Scholar] [CrossRef] [PubMed]
- Liu, W.; DuPont, J. Effects of melt-pool geometry on crystal growth and microstructure development in laser surface-melted superalloy single crystals: Mathematical modeling of single-crystal growth in a melt pool (part I). Acta Mater. 2004, 52, 4833–4847. [Google Scholar] [CrossRef]
- Liu, Z.; Qi, H. Effects of substrate crystallographic orientations on crystal growth and microstructure formation in laser powder deposition of nickel-based superalloy. Acta Mater. 2015, 87, 248–258. [Google Scholar] [CrossRef]
- Wen, S. Metallurgical Evaluation of Cast Duplex Stainless Steels and Their Weldments. Master’s Thesis, University of Tennessee, Knoxville, TX, USA, 2001. [Google Scholar]
- Bertoli, U.S.; MacDonald, B.E.; Schoenung, J.M. Stability of cellular microstructure in laser powder bed fusion of 316L stainless steel. Mater. Sci. Eng. A 2019, 739, 109–117. [Google Scholar] [CrossRef]
- Mullis, A.M.; Farrell, L.; Cochrane, R.F.; Adkins, N.J. Estimation of Cooling Rates During Close-Coupled Gas Atomization Using Secondary Dendrite Arm Spacing Measurement. Met. Mater. Trans. B 2013, 44, 992–999. [Google Scholar] [CrossRef]
- Takaki, S. Influence of Alloying Elements on the Hall-Petch Coefficient in Ferritic Steel. Mater. Sci. Forum 2012, 706–709, 181–185. [Google Scholar] [CrossRef]
- Funakawa, Y.; Ujiro, T. Tensile Properties of Chromium-bearing Extra Low Carbon Steel Sheets. ISIJ Int. 2010, 50, 1488–1495. [Google Scholar] [CrossRef]
- Argon, A.S.; Orowan, E. Physics of Strength and Plasticity; Lightning Source: Milton Keynes, UK, 2003. [Google Scholar]
- Rosenberg, J.M.; Piehler, H.R. Calculation of the taylor factor and lattice rotations for bcc metals deforming by pencil glide. Met. Trans. 1971, 2, 257–259. [Google Scholar] [CrossRef]
- Partington, J.R. Tables of Physical and Chemical Constants and Some Mathematical Functions. By Kaye, G.W.C. and Laby, T.H. J. Phys. Chem. 1936, 40, 938. [Google Scholar] [CrossRef]
- Kamikawa, N.; Sato, K.; Miyamoto, G.; Murayama, M.; Sekido, N.; Tsuzaki, K.; Furuhara, T. Stress–strain behavior of ferrite and bainite with nano-precipitation in low carbon steels. Acta Mater. 2015, 83, 383–396. [Google Scholar] [CrossRef]
- Bailey, J.E.; Hirsch, P.B. The dislocation distribution, flow stress, and stored energy in cold-worked polycrystalline silver. Philos. Mag. 1960, 5, 485–497. [Google Scholar] [CrossRef]
- Keh, A.S. Work hardening and deformation sub-structure in iron single crystals deformed in tension at 298 °K. Philos. Mag. 1965, 12, 9–30. [Google Scholar] [CrossRef]
- Hornbogen, E.; Starke, E. Overview no. 102 Theory assisted design of high strength low alloy aluminum. Acta Met. Mater. 1993, 41, 1–16. [Google Scholar] [CrossRef]
- Foreman, A.J.E.; Makin, M.J. Dislocation movement through random arrays of obstacles. Can. J. Phys. 1967, 45, 511–517. [Google Scholar] [CrossRef]
- Li, Q. Modeling the microstructure–mechanical property relationship for a 12Cr–2W–V–Mo–Ni power plant steel. Mater. Sci. Eng. A 2003, 361, 385–391. [Google Scholar] [CrossRef]
- Chen, M.; He, J.; Wang, M.; Li, J.; Xing, S.; Gui, K.; Wang, G.; Liu, Q. Effects of deep cold rolling on the evolution of microstructure, microtexture, and mechanical properties of 2507 duplex stainless steel. Mater. Sci. Eng. A 2022, 845, 143224. [Google Scholar] [CrossRef]
- Kunz, J.; Boontanom, A.; Herzog, S.; Suwanpinij, P.; Kaletsch, A.; Broeckmann, C. Influence of hot isostatic pressing post-treatment on the microstructure and mechanical behavior of standard and super duplex stainless steel produced by laser powder bed fusion. Mater. Sci. Eng. A 2020, 794, 139806. [Google Scholar] [CrossRef]
- Takeda, K.; Nakada, N.; Tsuchiyama, T.; Takaki, S. Effect of Interstitial Elements on Hall–Petch Coefficient of Ferritic Iron. ISIJ Int. 2008, 48, 1122–1125. [Google Scholar] [CrossRef]
- Wilson, D.V. Role of Grain Boundaries in the Discontinuous Yielding of Low-Carbon Steels. Met. Sci. J. 1967, 1, 40–47. [Google Scholar] [CrossRef]
- Yadroitsev, I.; Yadroitsava, I. Evaluation of residual stress in stainless steel 316L and Ti6Al4V samples produced by selective laser melting. Virtual Phys. Prototyp. 2015, 10, 67–76. [Google Scholar] [CrossRef]
- Levkulich, N.; Semiatin, S.; Gockel, J.; Middendorf, J.; DeWald, A.; Klingbeil, N. The effect of process parameters on residual stress evolution and distortion in the laser powder bed fusion of Ti-6Al-4V. Addit. Manuf. 2019, 28, 475–484. [Google Scholar] [CrossRef]
- Shi, R.; Nie, Z.; Fan, Q.; Wang, F.; Zhou, Y.; Liu, X. Correlation between dislocation-density-based strain hardening and microstructural evolution in dual phase TC6 titanium alloy. Mater. Sci. Eng. A 2018, 715, 101–107. [Google Scholar] [CrossRef]
- Xiang, H.; Chen, G.; Zhao, W.; Wu, C. Densification Behavior and Build Quality of Duplex Stainless Steel Fabricated by Laser Powder Bed Fusion. Metals 2023, 13, 741. [Google Scholar] [CrossRef]
- Zhao, W.; Xiang, H.; Yu, R.; Mou, G. Effects of laser scanning speed on the microstructure and mechanical properties of 2205 duplex stainless steel fabricated by selective laser melting. J. Manuf. Process. 2023, 94, 1–9. [Google Scholar] [CrossRef]
Figure 1.
Schematic diagram of L-PBF process, including the scan strategy used and the surface that was examined for each sample.
Figure 1.
Schematic diagram of L-PBF process, including the scan strategy used and the surface that was examined for each sample.
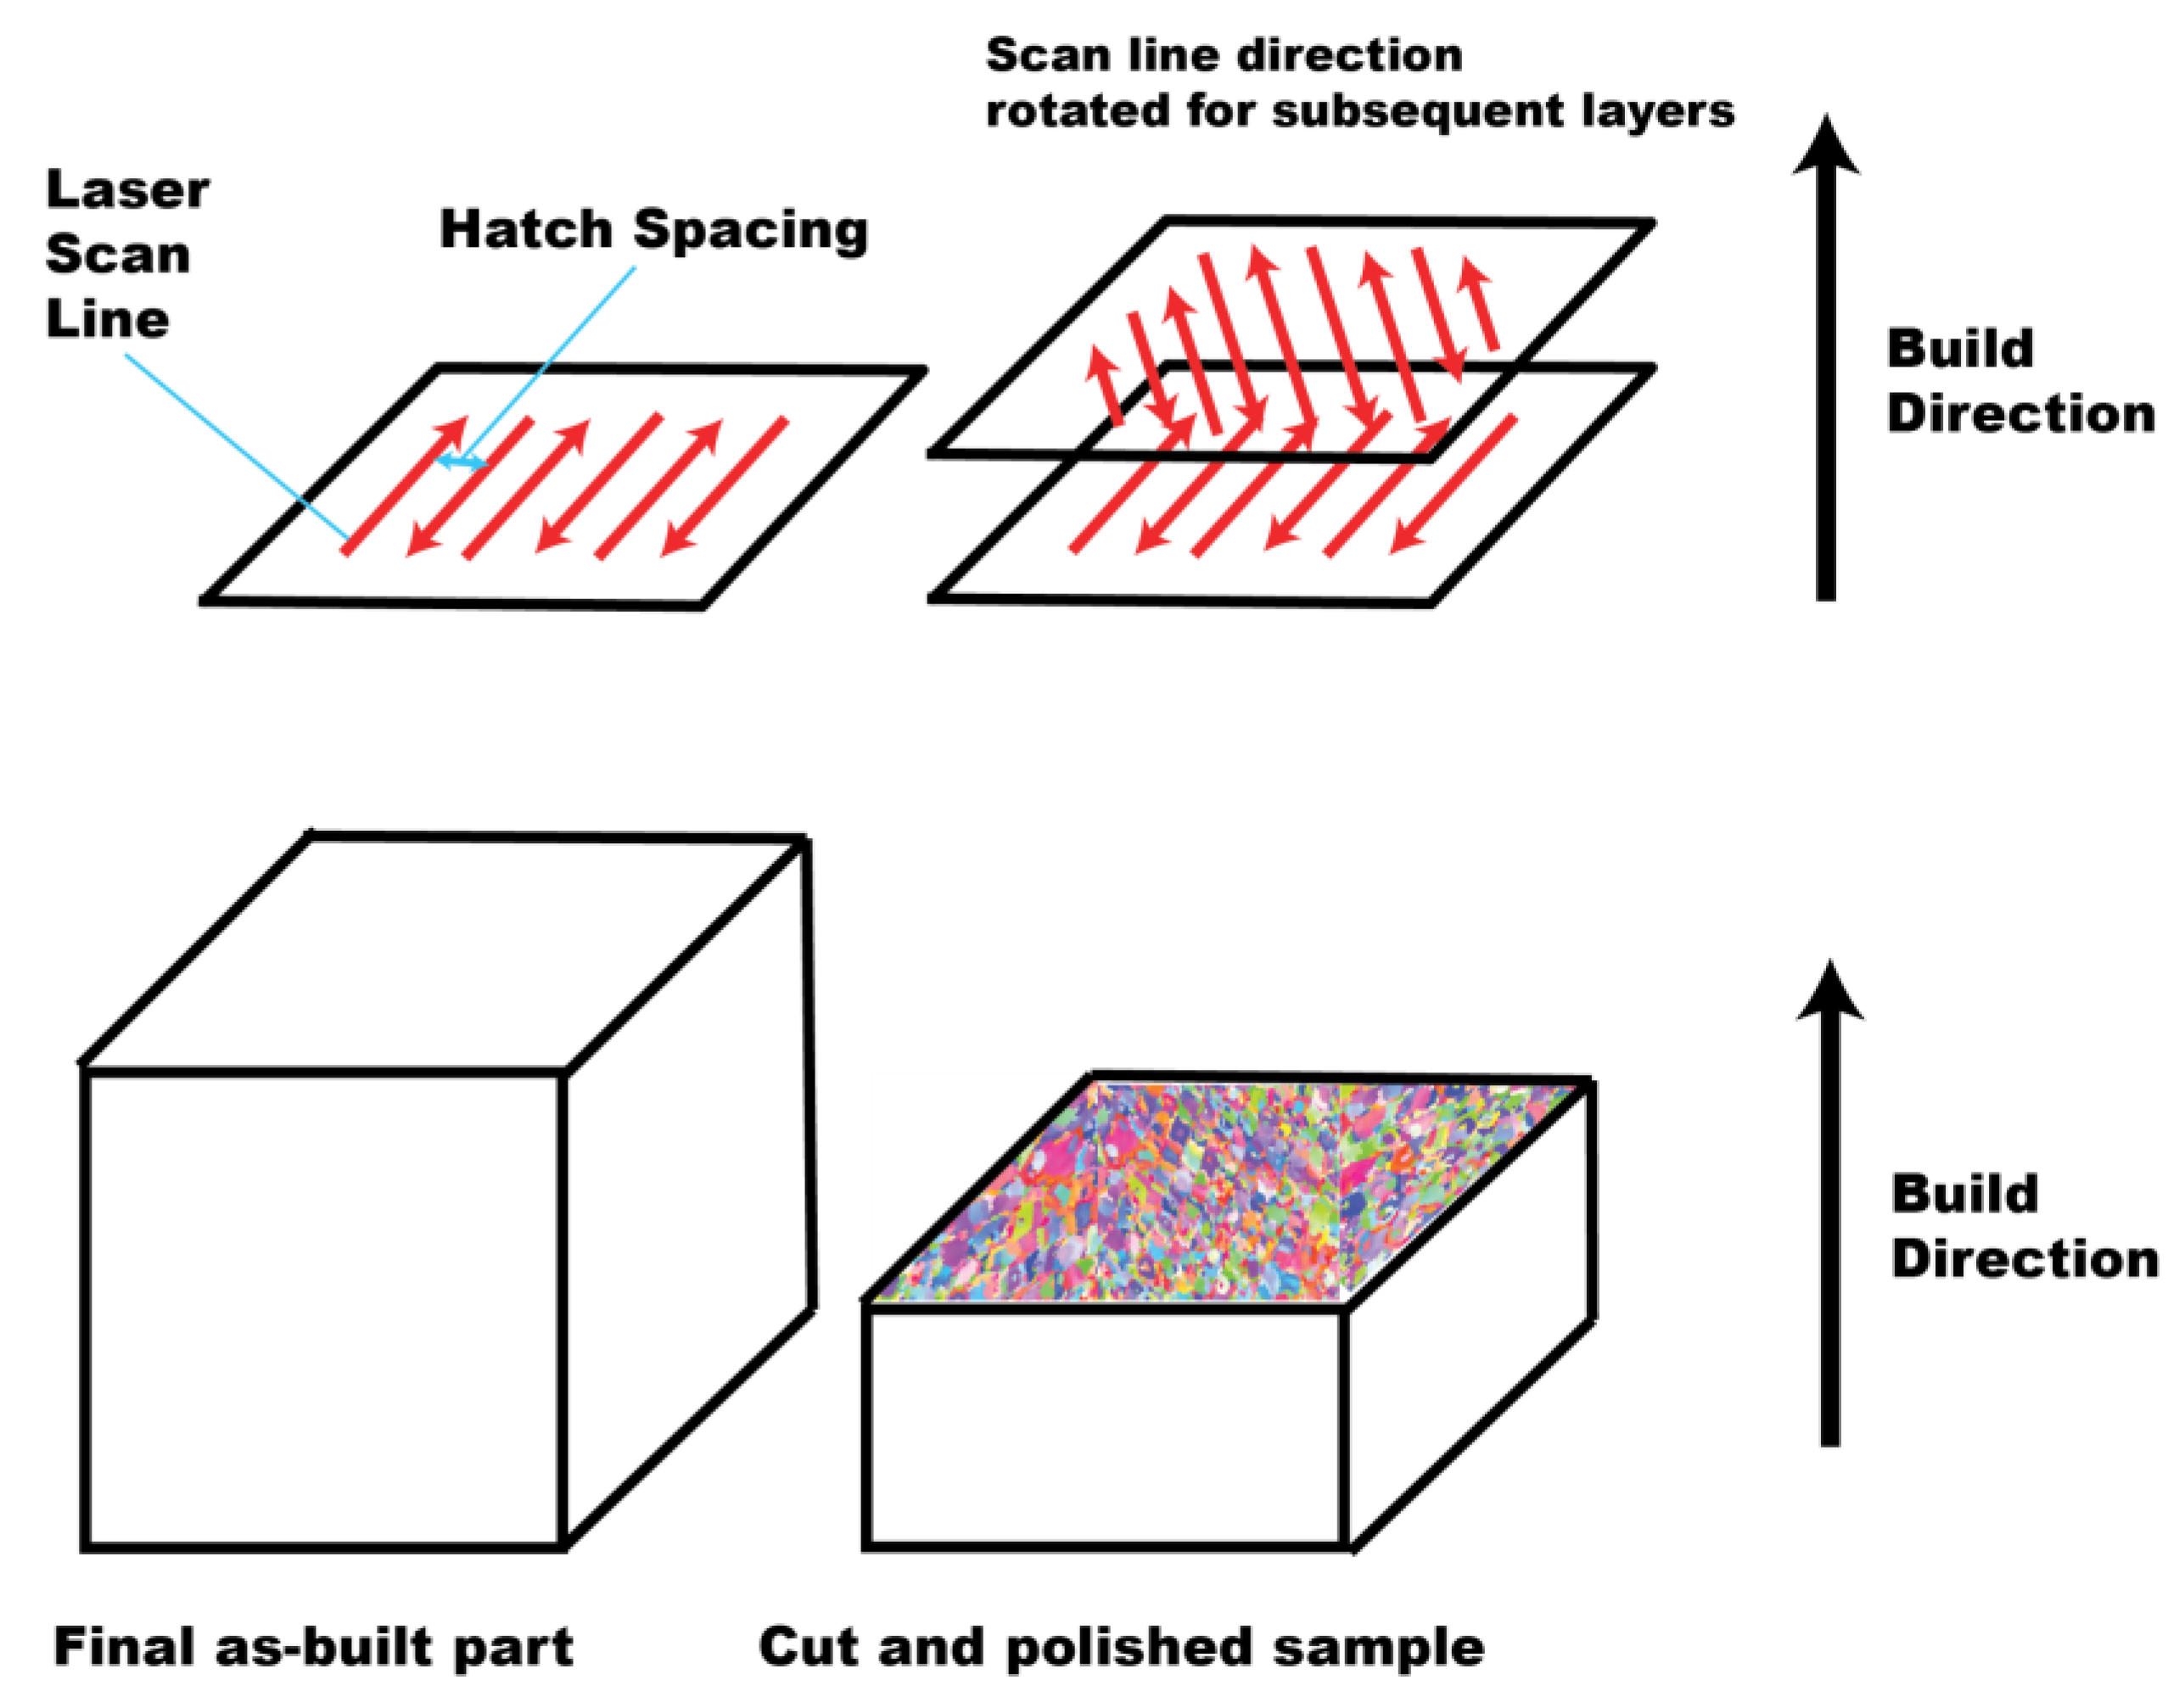
Figure 2.
(a) SEM image of raw DSS powder along with (b) IPF map and (c) phase map overlaid on IQ map of a single particle measured through EBSD. The phase ratio was measured to be 96.8% BCC, and 3.2% FCC.
Figure 2.
(a) SEM image of raw DSS powder along with (b) IPF map and (c) phase map overlaid on IQ map of a single particle measured through EBSD. The phase ratio was measured to be 96.8% BCC, and 3.2% FCC.
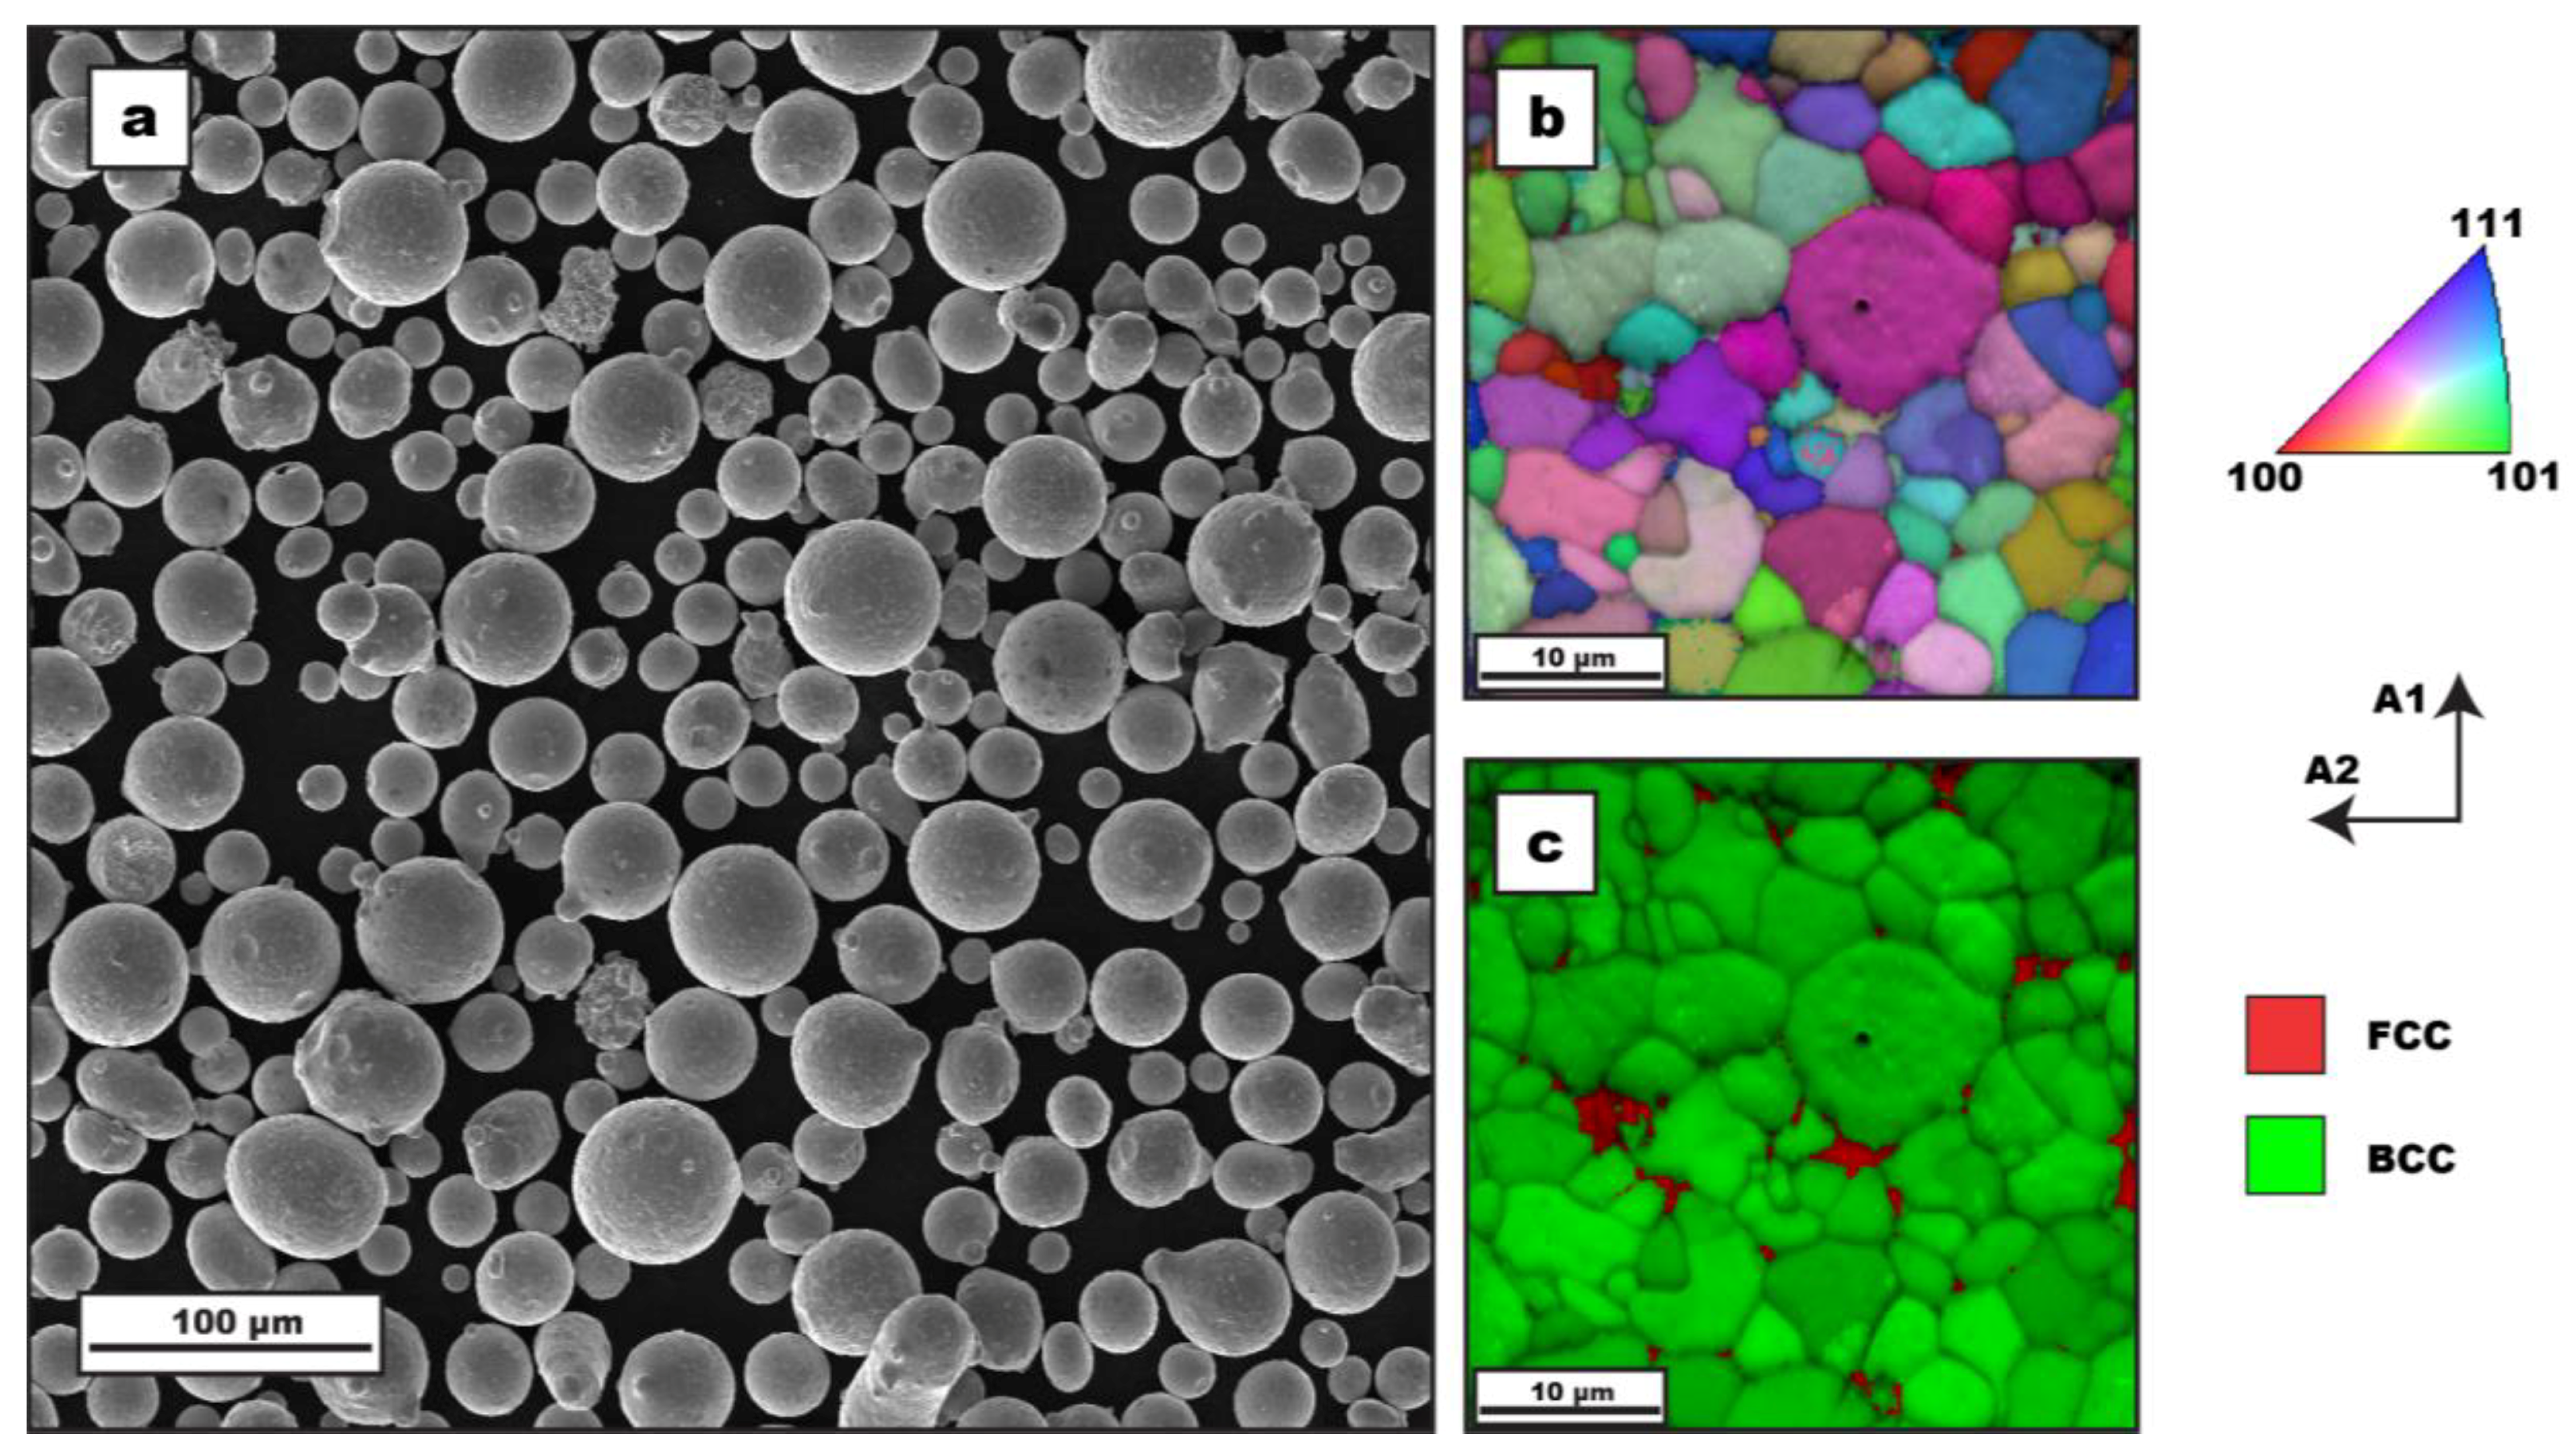
Figure 3.
Porosity measurements of each sample obtained from optical microscopy and plotted versus (a) input energy density and (b) laser scan speed for different laser powers. The data points represent average values from 3 different areas on the surface.
Figure 3.
Porosity measurements of each sample obtained from optical microscopy and plotted versus (a) input energy density and (b) laser scan speed for different laser powers. The data points represent average values from 3 different areas on the surface.

Figure 4.
(a–c) EDS X-ray maps of elements Fe, Si, and O, respectively, from the regions identified as pores on the surface (image shown here is from sample 6). Lack of signal from the dark region indicates that it is a pore and not oxide inclusion or embedded particle on the surface.
Figure 4.
(a–c) EDS X-ray maps of elements Fe, Si, and O, respectively, from the regions identified as pores on the surface (image shown here is from sample 6). Lack of signal from the dark region indicates that it is a pore and not oxide inclusion or embedded particle on the surface.
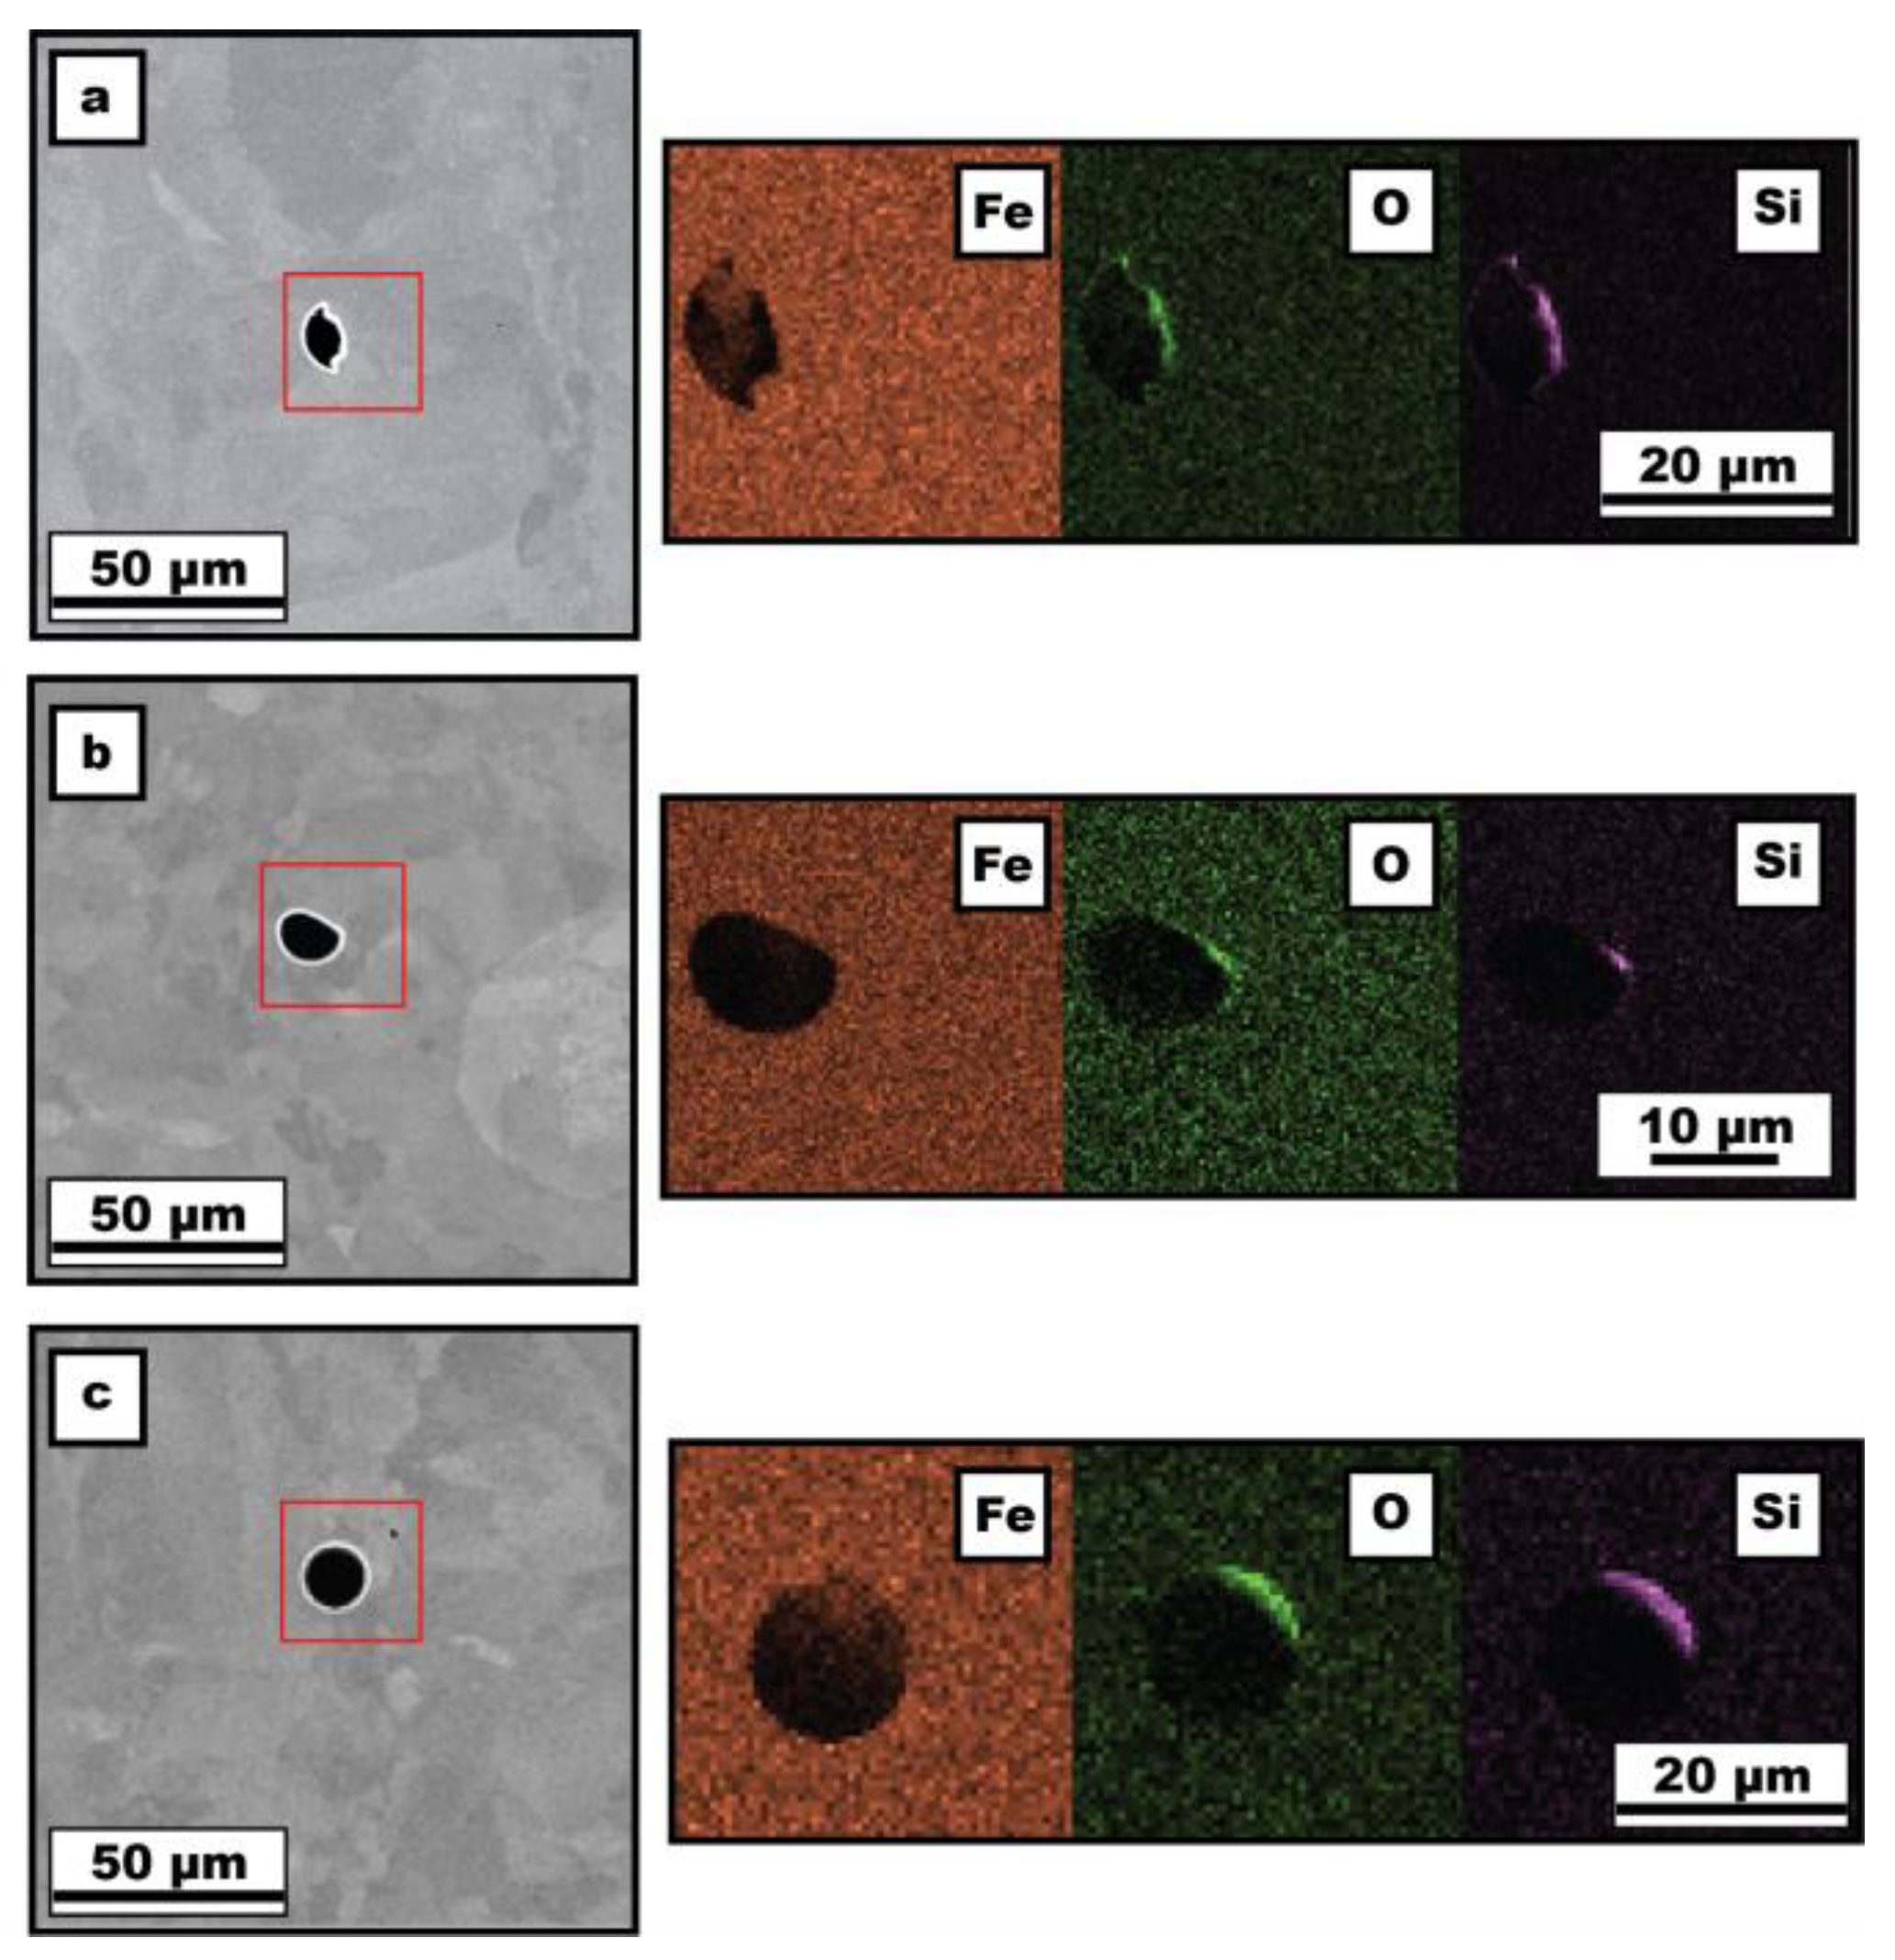
Figure 5.
X-ray MicroCT scans of (a) sample 7, (b) sample 10, and (c) sample 3. The pores are colored by their volume, and the cylinder outline represents the total volume used for the analysis. The volume analyzed is the center of the overall fabricated part.
Figure 5.
X-ray MicroCT scans of (a) sample 7, (b) sample 10, and (c) sample 3. The pores are colored by their volume, and the cylinder outline represents the total volume used for the analysis. The volume analyzed is the center of the overall fabricated part.

Figure 6.
IPF maps of (a) sample 1, (b) sample 2, (c) sample 3, (d) sample 4, (e) sample 5, (f) sample 6, (g) sample 7, (h) sample 8, (i) sample 9, (j) sample 10, and (k) sample 11. The build direction is normal to the surface shown.
Figure 6.
IPF maps of (a) sample 1, (b) sample 2, (c) sample 3, (d) sample 4, (e) sample 5, (f) sample 6, (g) sample 7, (h) sample 8, (i) sample 9, (j) sample 10, and (k) sample 11. The build direction is normal to the surface shown.

Figure 7.
Average grain diameter as measured from EBSD plotted versus (a) energy density, (b) laser scan speed, and (c) laser power.
Figure 7.
Average grain diameter as measured from EBSD plotted versus (a) energy density, (b) laser scan speed, and (c) laser power.

Figure 8.
Texture plots of (a) sample 1, (b) sample 2, (c) sample 3, (d) sample 4, (e) sample 5, (f) sample 6, (g) sample 7, (h) sample 8, (i) sample 9, (j) sample 10, and (k) sample 11. The build direction is normal to the surface shown.
Figure 8.
Texture plots of (a) sample 1, (b) sample 2, (c) sample 3, (d) sample 4, (e) sample 5, (f) sample 6, (g) sample 7, (h) sample 8, (i) sample 9, (j) sample 10, and (k) sample 11. The build direction is normal to the surface shown.

Figure 9.
Phase maps of (a) sample 1, (b) sample 2, (c) sample 3, (d) sample 4, (e) sample 5, (f) sample 6, (g) sample 7, (h) sample 8, (i) sample 9, (j) sample 10, and (k) sample 11. The build direction is normal to the surface shown.
Figure 9.
Phase maps of (a) sample 1, (b) sample 2, (c) sample 3, (d) sample 4, (e) sample 5, (f) sample 6, (g) sample 7, (h) sample 8, (i) sample 9, (j) sample 10, and (k) sample 11. The build direction is normal to the surface shown.
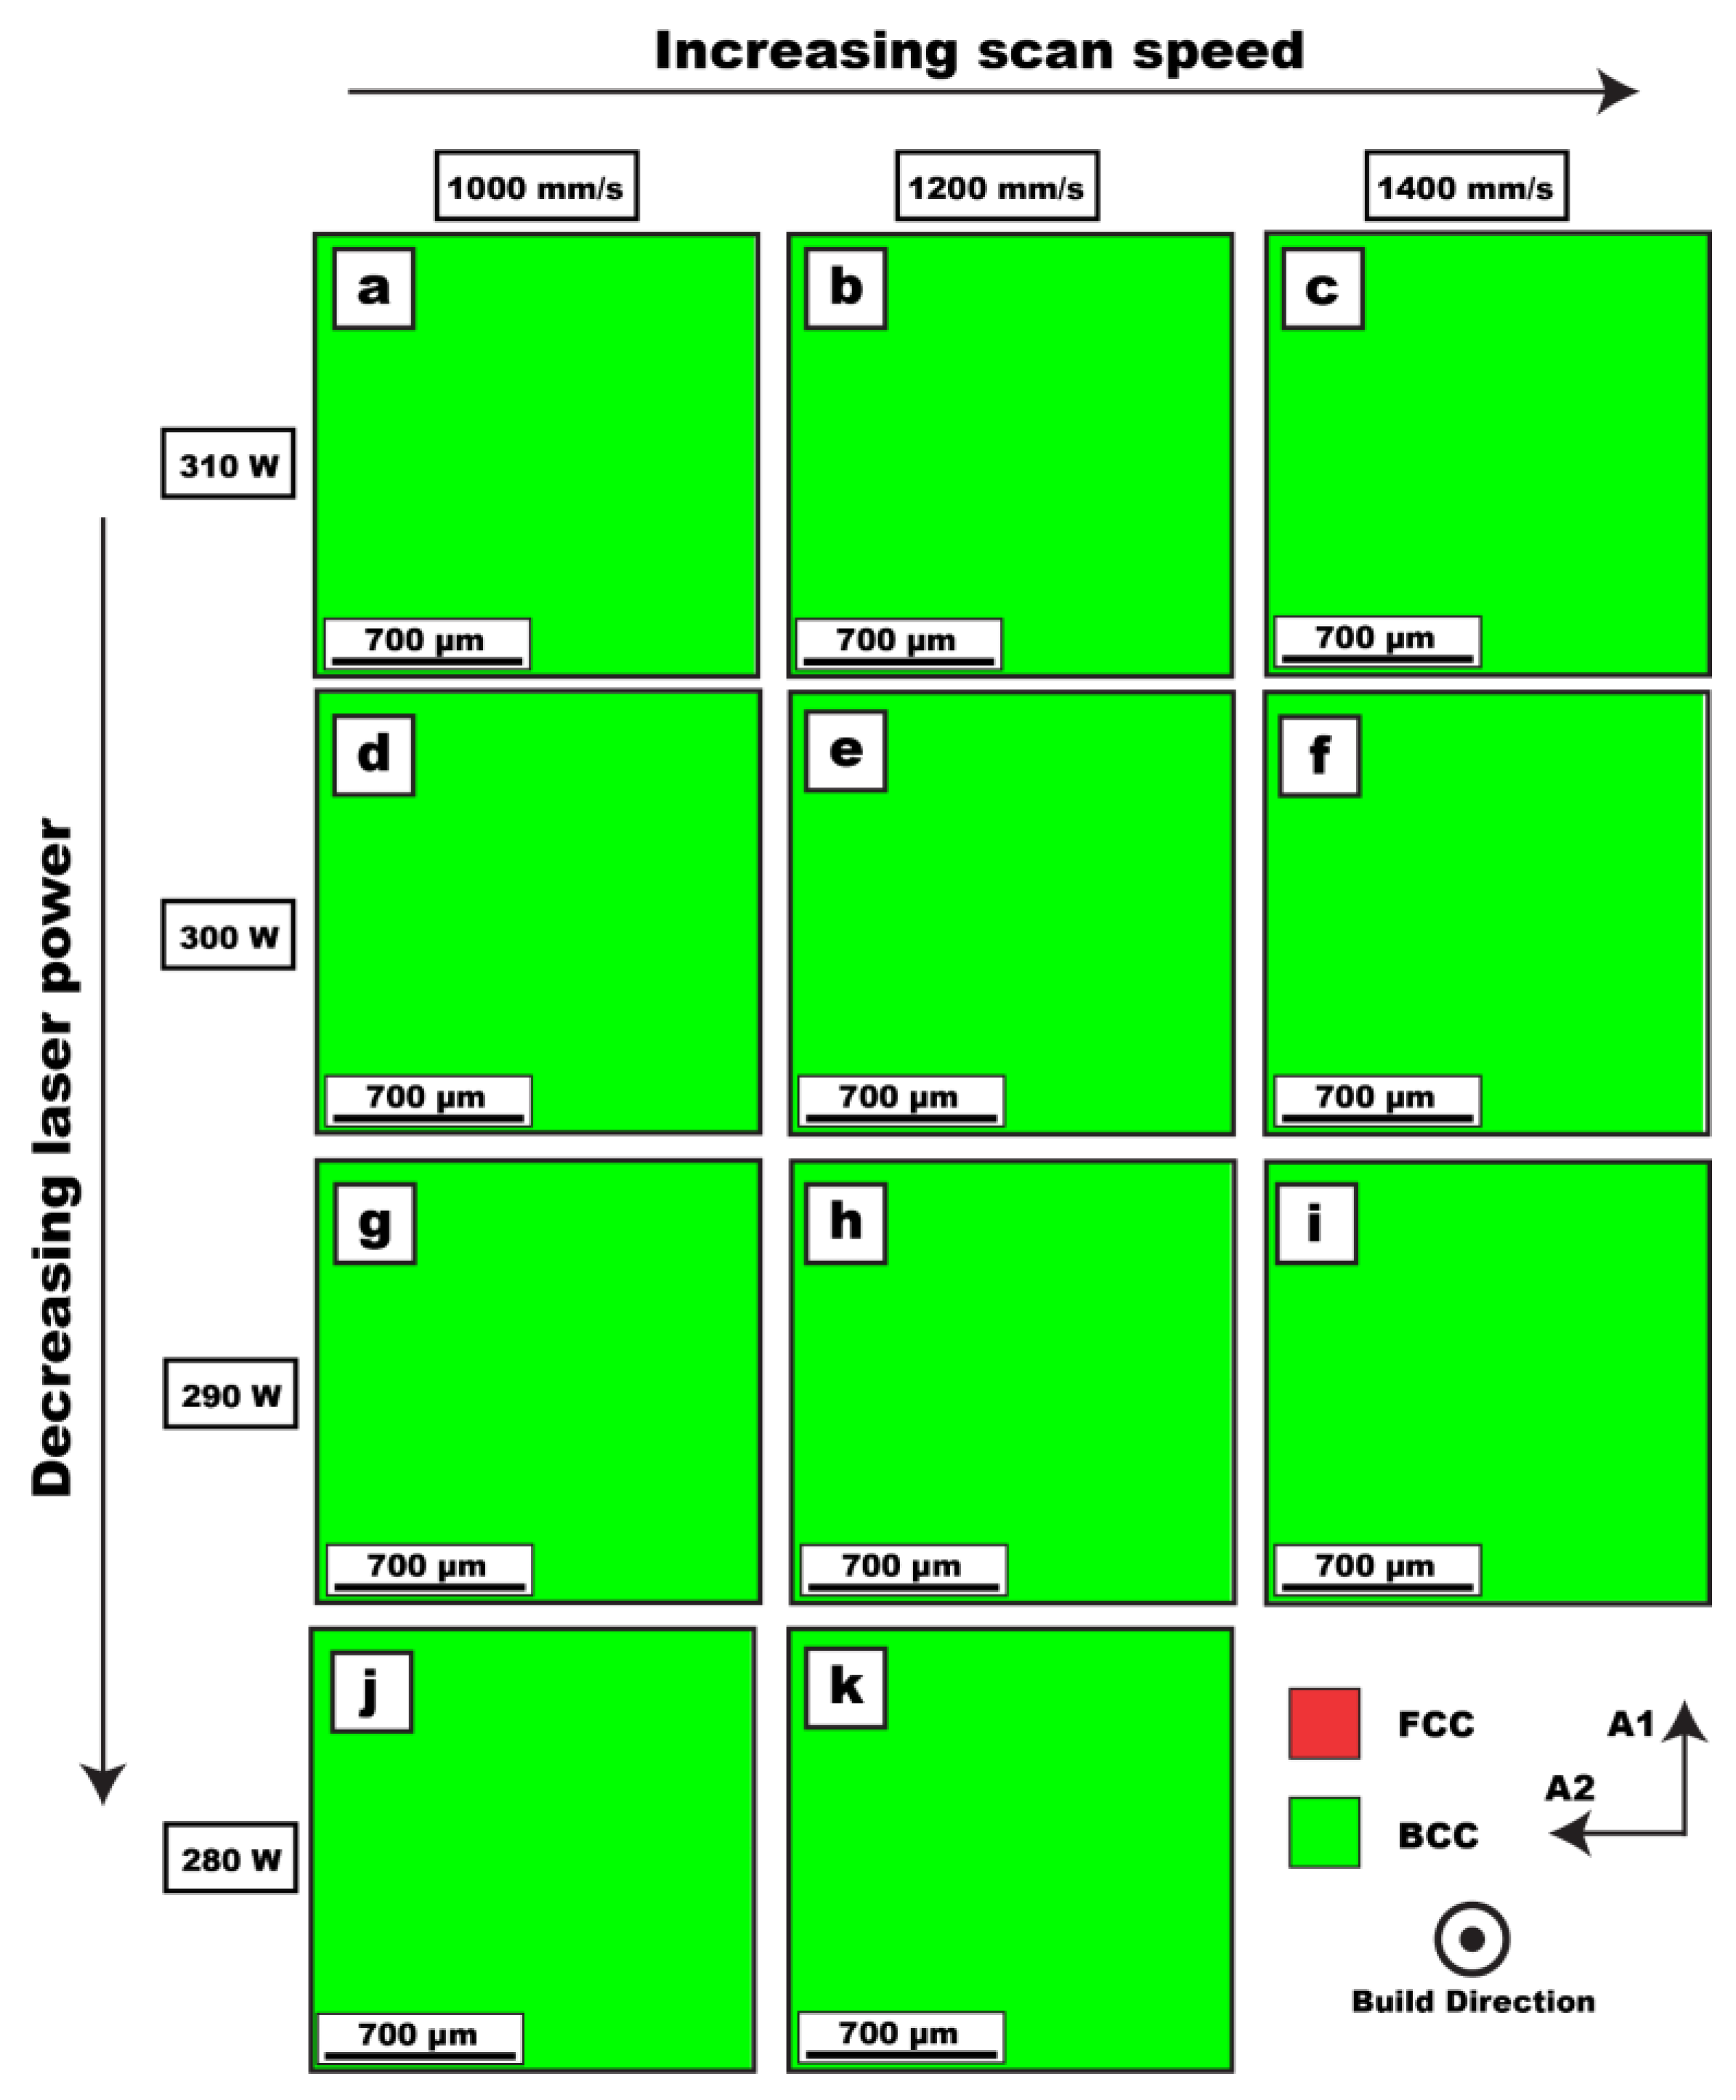
Figure 10.
(a,b) Bright-field (BF) STEM image of precipitate found in ferrite grain of sample 10 along with EDS mapping of the precipitates. (c) HR-STEM images of precipitate. (d) Magnified HR-STEM image of precipitate from area highlighted in (b,c). (e) FFT of the ferrite matrix and (f) FFT of the precipitate.
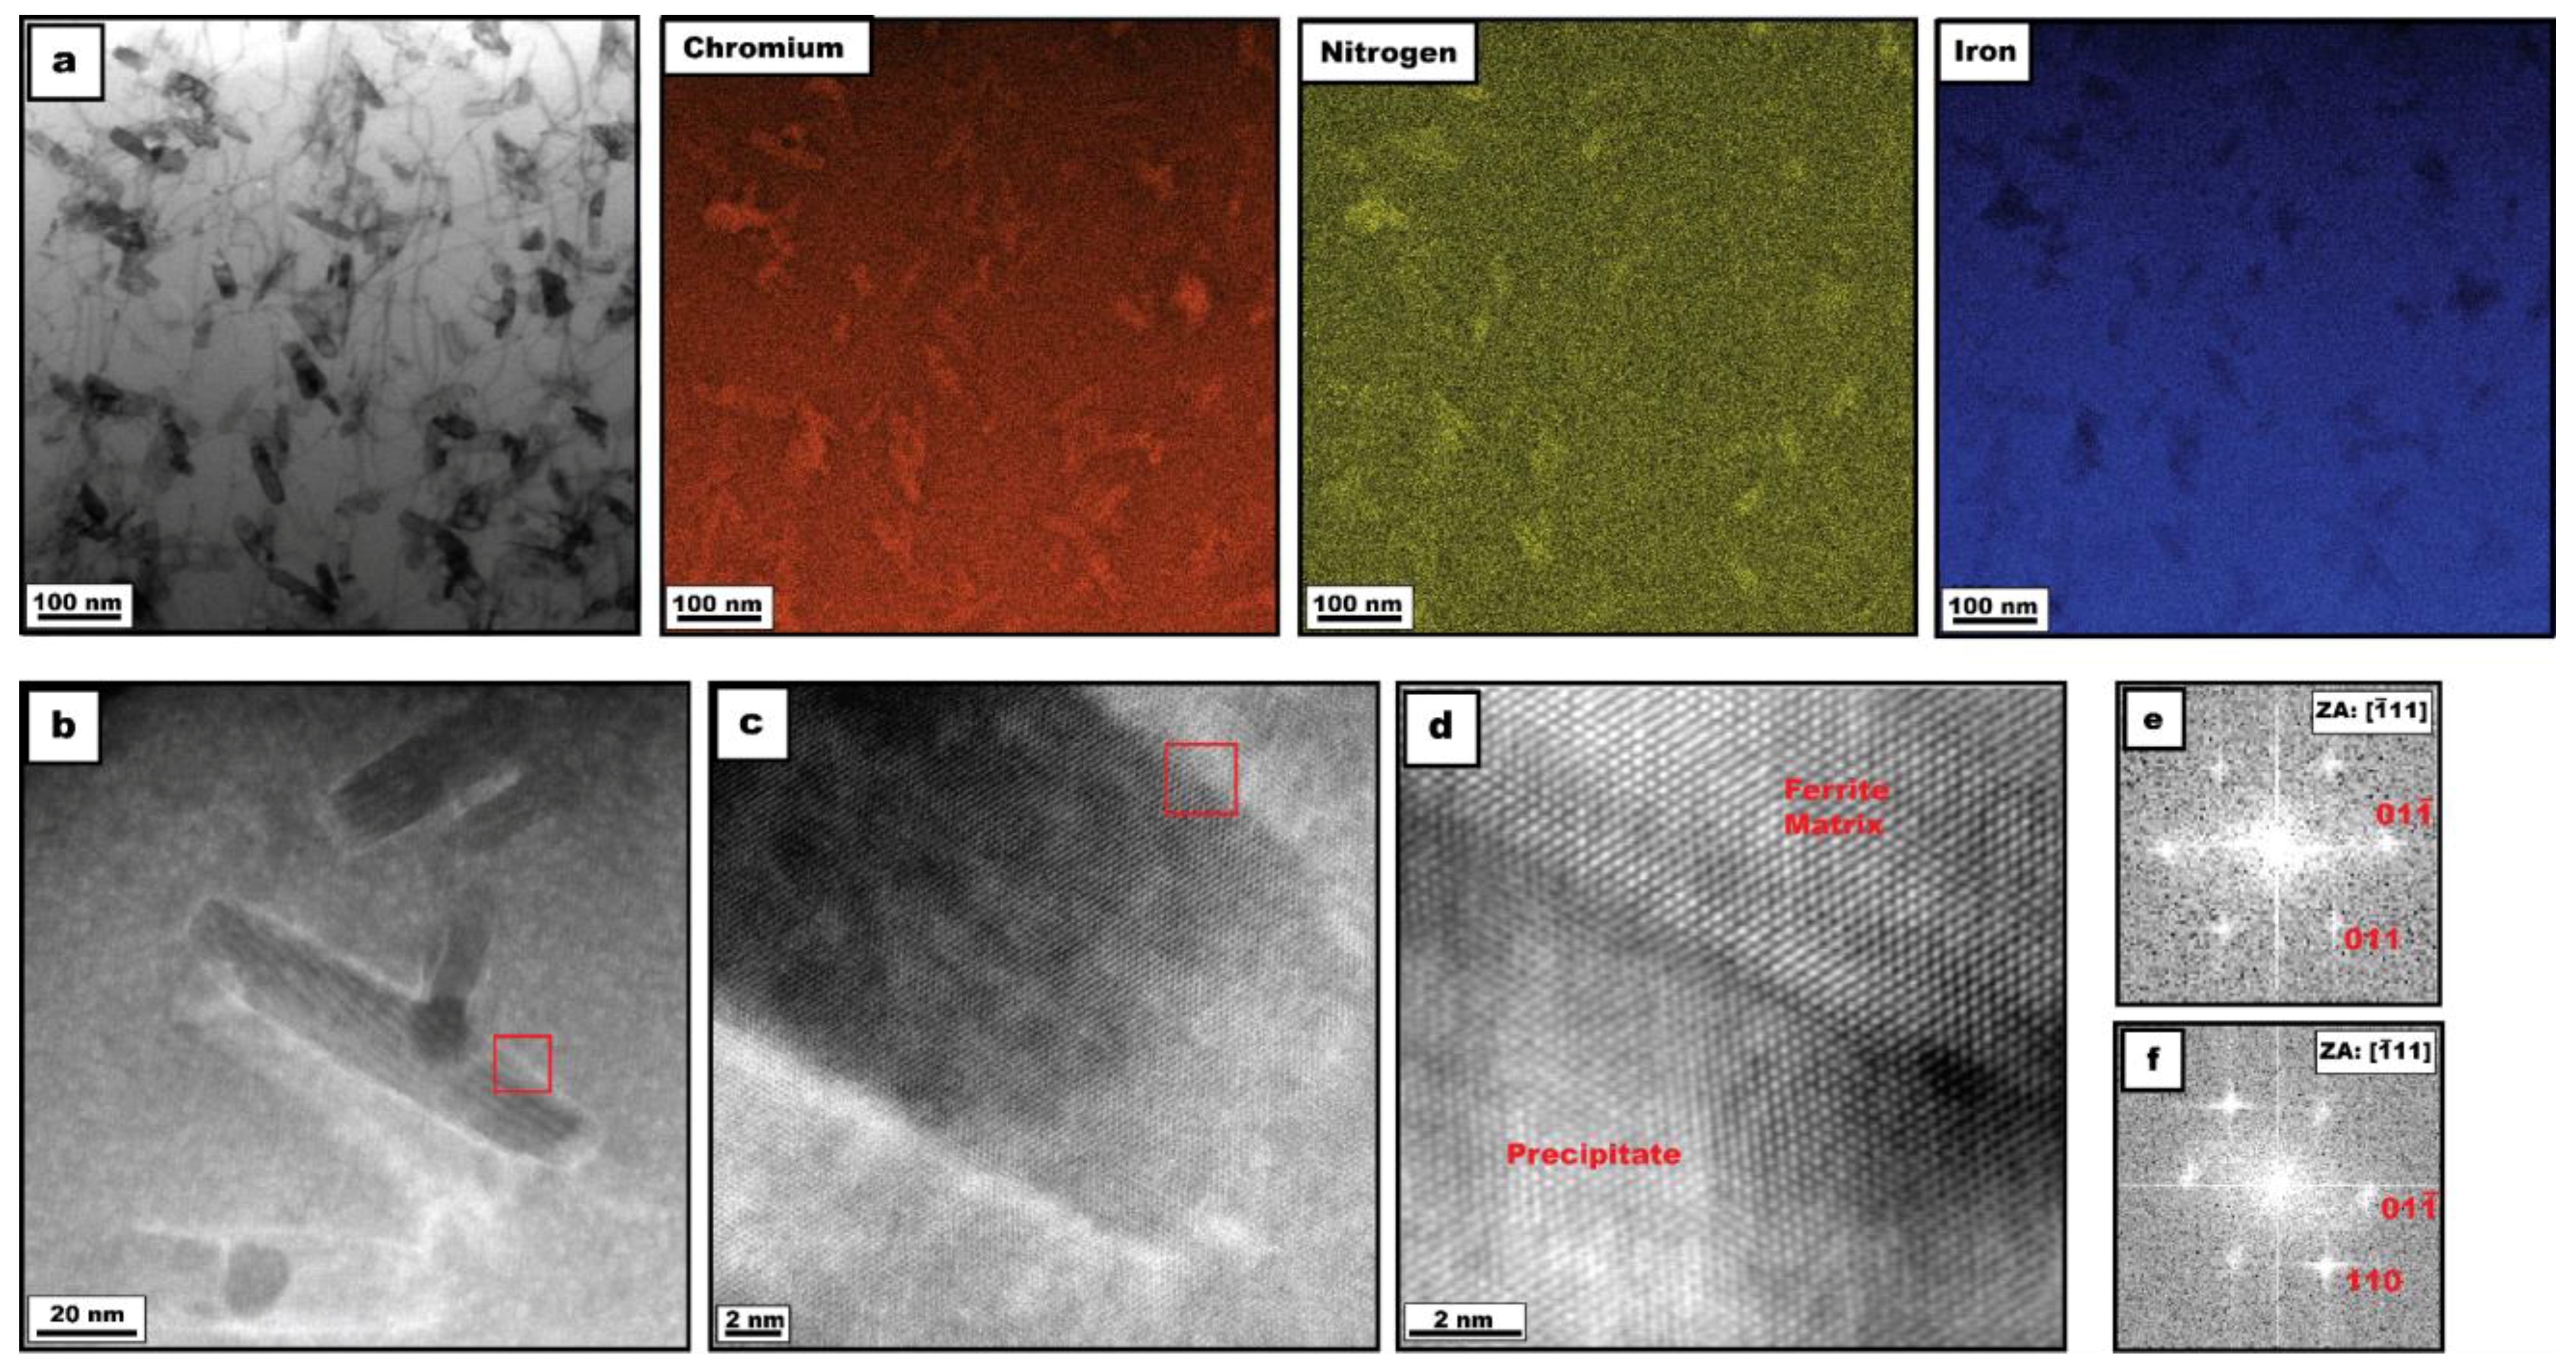
Figure 11.
(a,b) Bright-field (BF) STEM image, EDS X-ray maps of precipitates at a ferrite grain boundary in sample 10, and EDS mapping of the precipitates. (c) HR-STEM images of precipitate from area highlighted in (b) with (d) FFT of the precipitate.
Figure 11.
(a,b) Bright-field (BF) STEM image, EDS X-ray maps of precipitates at a ferrite grain boundary in sample 10, and EDS mapping of the precipitates. (c) HR-STEM images of precipitate from area highlighted in (b) with (d) FFT of the precipitate.
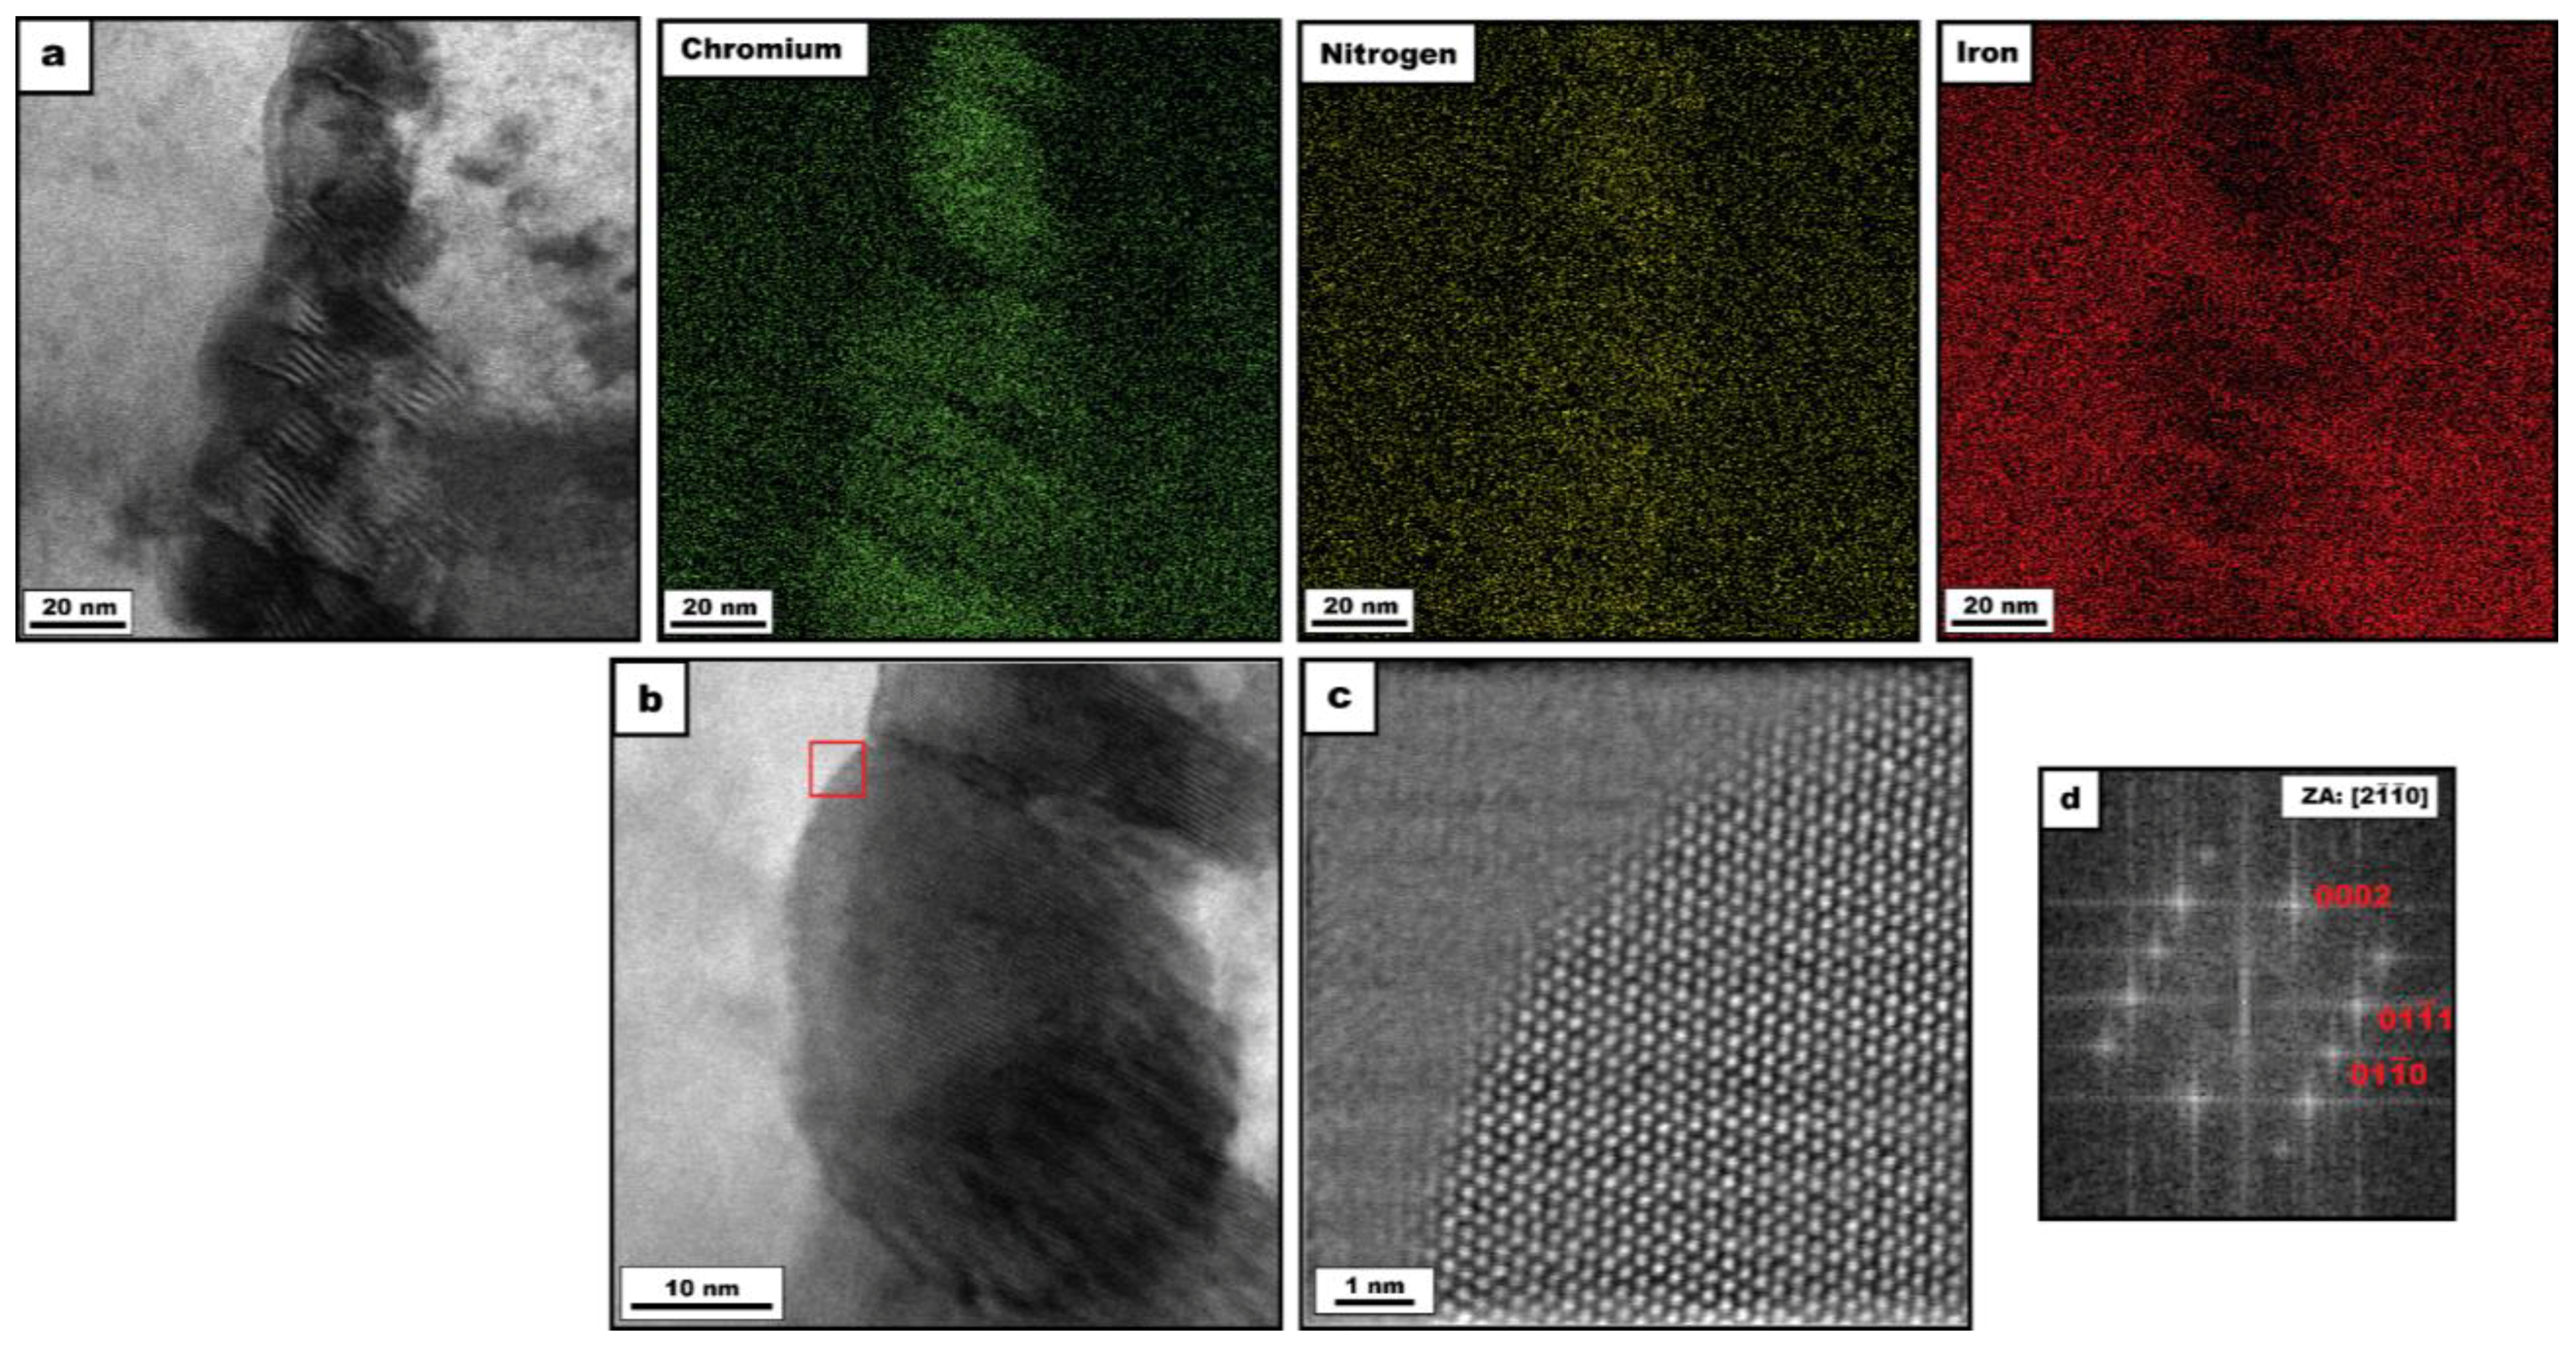
Figure 12.
(a) BF-STEM image showing dislocations found within ferrite matrix of sample 10. Sample tilted to [111] zone axis with the diffraction pattern shown in the inset. (b) BF-STEM image showing dislocations seen under two-beam condition tilted to g = 110, as shown in inset.
Figure 12.
(a) BF-STEM image showing dislocations found within ferrite matrix of sample 10. Sample tilted to [111] zone axis with the diffraction pattern shown in the inset. (b) BF-STEM image showing dislocations seen under two-beam condition tilted to g = 110, as shown in inset.
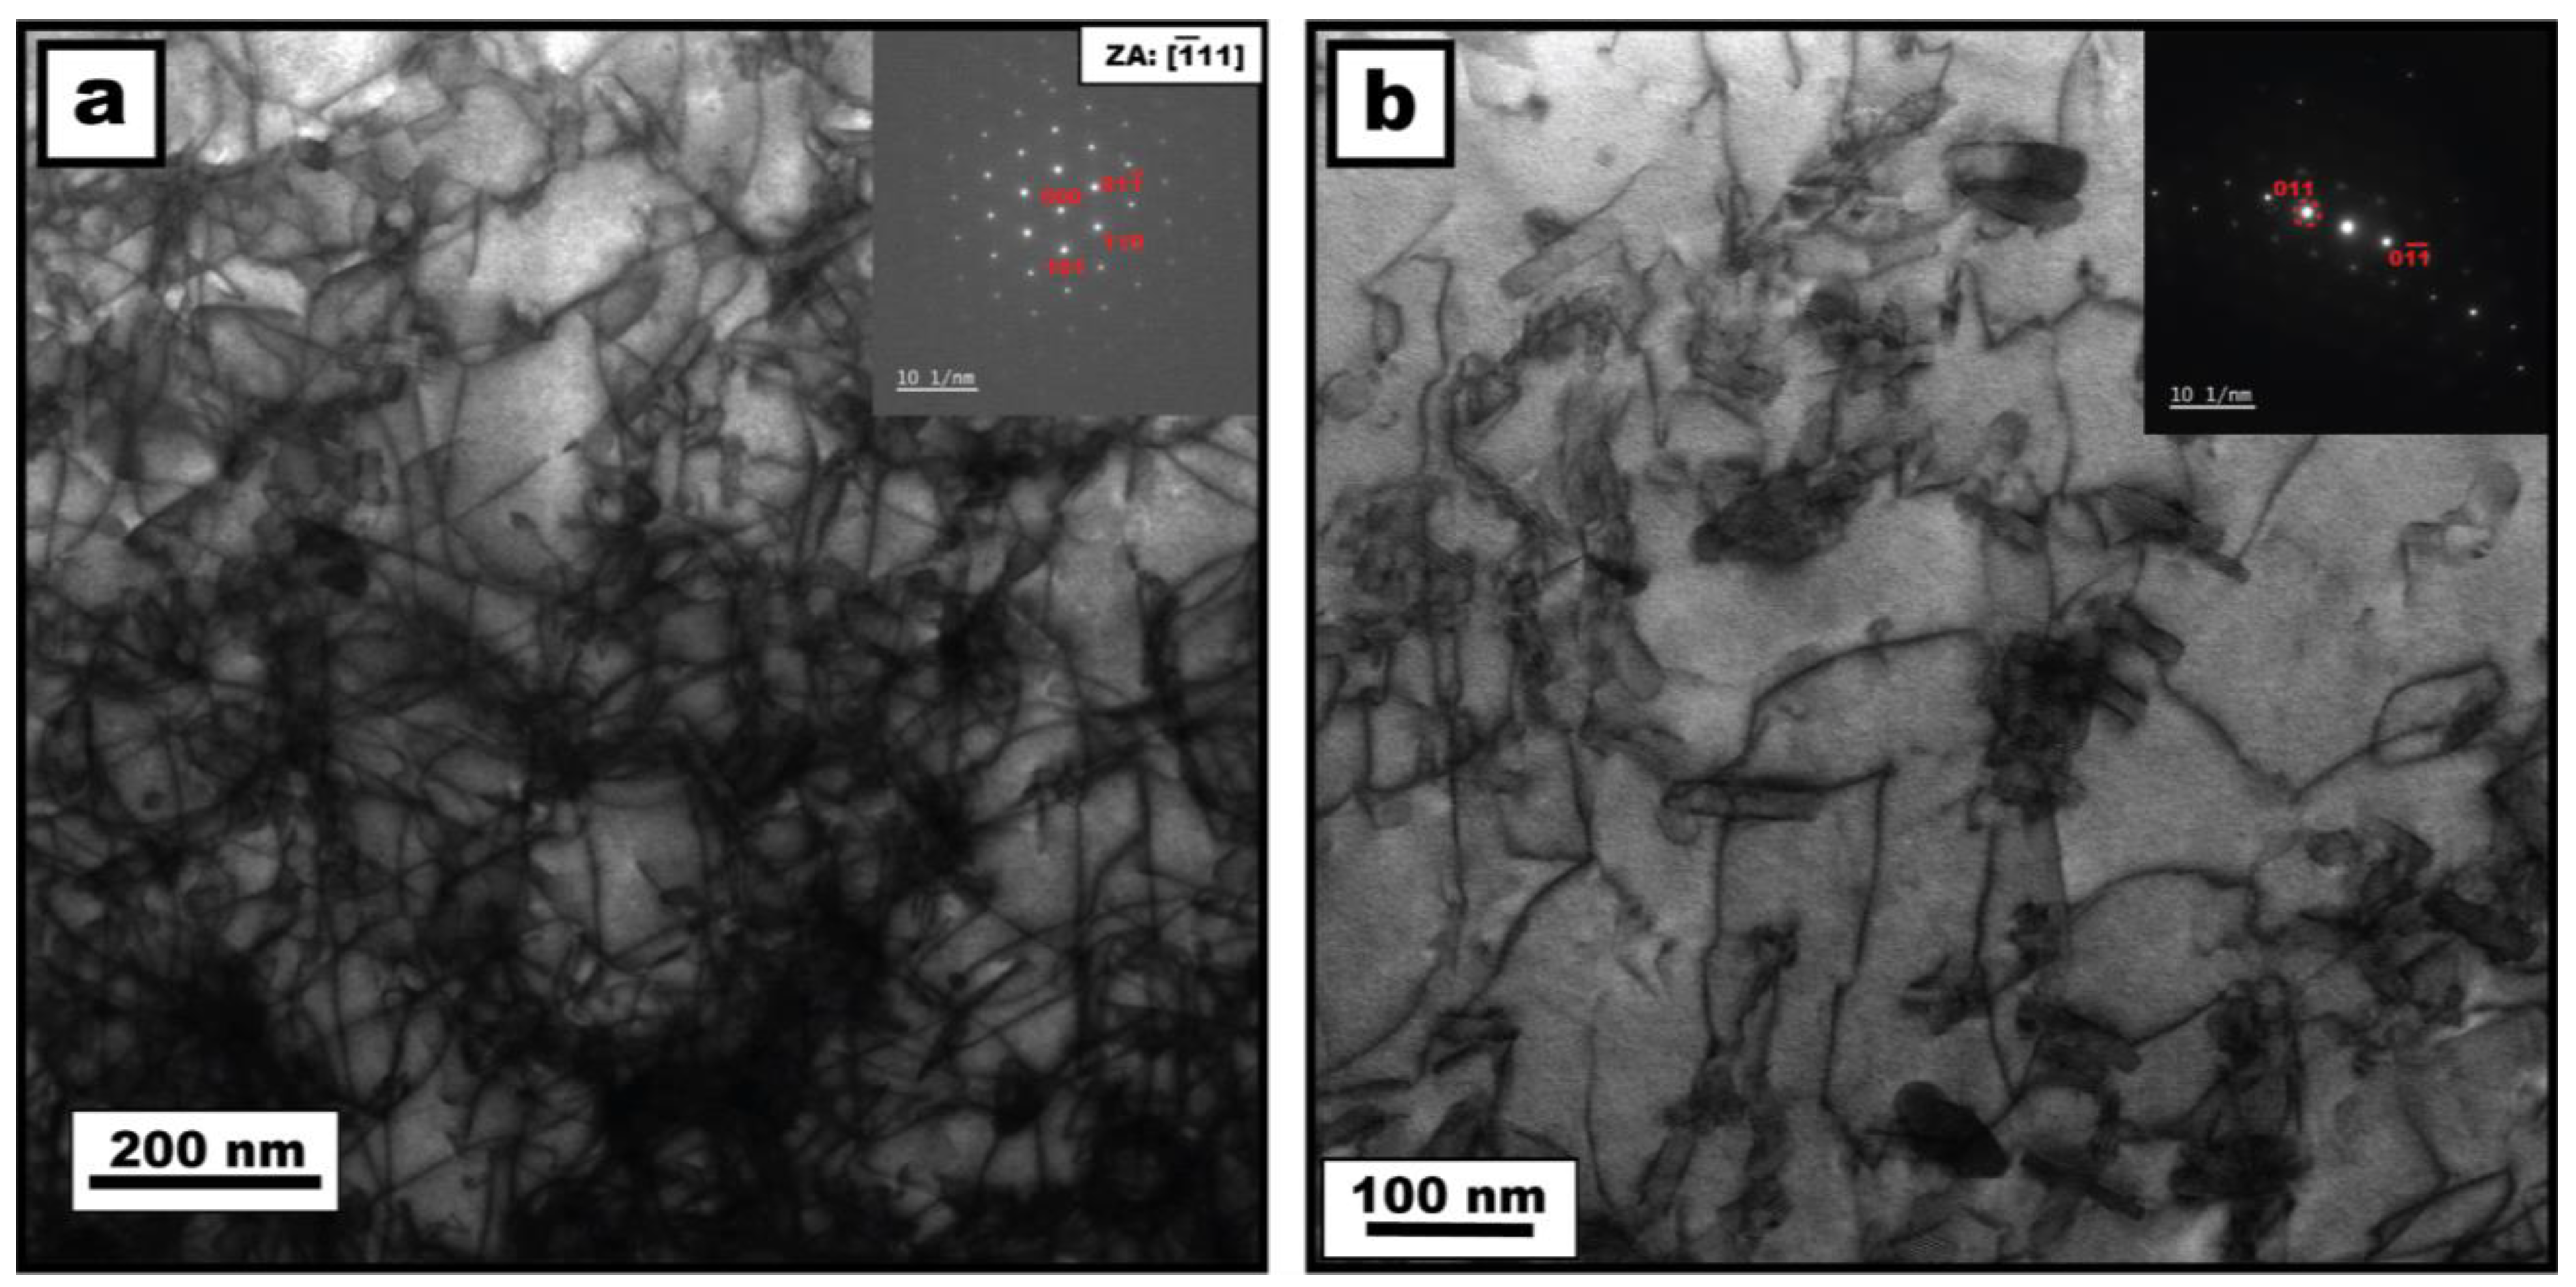
Figure 13.
Engineering stress–strain curve measured from tension test conducted on sample fabricated using the same processing conditions as sample 10 (1000 mm/s scan speed, 280 W laser power).
Figure 13.
Engineering stress–strain curve measured from tension test conducted on sample fabricated using the same processing conditions as sample 10 (1000 mm/s scan speed, 280 W laser power).


Table 1.
PBF-LB processing parameters used in this study for printing 2507 DSS.
| Sample # | Scan Speed | Laser Power |
|---|---|---|
| 1 | 1000 mm/s | 310 W |
| 2 | 1200 mm/s | 310 W |
| 3 | 1400 mm/s | 310 W |
| 4 | 1000 mm/s | 300 W |
| 5 | 1200 mm/s | 300 W |
| 6 | 1400 mm/s | 300 W |
| 7 | 1000 mm/s | 290 W |
| 8 | 1200 mm/s | 290 W |
| 9 | 1400 mm/s | 290 W |
| 10 | 1000 mm/s | 280 W |
| 11 | 1200 mm/s | 280 W |
Table 2.
PBF-LB Processing Parameters and Estimated Cooling Rates.
| Sample # | Scan Speed | Laser Power | Estimated Cooling Rate |
|---|---|---|---|
| 1 | 1000 mm/s | 310 W | 2.05 × 10⁶ K/s |
| 2 | 1200 mm/s | 310 W | 2.46 × 10⁶ K/s |
| 3 | 1400 mm/s | 310 W | 2.88 × 10⁶ K/s |
| 4 | 1000 mm/s | 300 W | 2.12 × 10⁶ K/s |
| 5 | 1200 mm/s | 300 W | 2.54 × 10⁶ K/s |
| 6 | 1400 mm/s | 300 W | 2.97 × 10⁶ K/s |
| 7 | 1000 mm/s | 290 W | 2.19 × 10⁶ K/s |
| 8 | 1200 mm/s | 290 W | 2.64 × 10⁶ K/s |
| 9 | 1400 mm/s | 290 W | 3.08 × 10⁶ K/s |
| 10 | 1000 mm/s | 280 W | 2.27 × 10⁶ K/s |
| 11 | 1200 mm/s | 280 W | 2.73 × 10⁶ K/s |
Disclaimer/Publisher’s Note: The statements, opinions and data contained in all publications are solely those of the individual author(s) and contributor(s) and not of MDPI and/or the editor(s). MDPI and/or the editor(s) disclaim responsibility for any injury to people or property resulting from any ideas, methods, instructions or products referred to in the content. |
© 2024 by the authors. Licensee MDPI, Basel, Switzerland. This article is an open access article distributed under the terms and conditions of the Creative Commons Attribution (CC BY) license (https://creativecommons.org/licenses/by/4.0/).
Share and Cite
MDPI and ACS Style
Tobah, M.; Andani, M.T.; Sahu, B.P.; Misra, A. Microstructural and Hall–Petch Analysis of Additively Manufactured Ferritic Alloy Using 2507 Duplex Stainless Steel Powder. Crystals 2024, 14, 81. https://doi.org/10.3390/cryst14010081
AMA Style
Tobah M, Andani MT, Sahu BP, Misra A. Microstructural and Hall–Petch Analysis of Additively Manufactured Ferritic Alloy Using 2507 Duplex Stainless Steel Powder. Crystals. 2024; 14(1):81. https://doi.org/10.3390/cryst14010081
Chicago/Turabian StyleTobah, Mustafa, Mohsen T. Andani, Bibhu P. Sahu, and Amit Misra. 2024. "Microstructural and Hall–Petch Analysis of Additively Manufactured Ferritic Alloy Using 2507 Duplex Stainless Steel Powder" Crystals 14, no. 1: 81. https://doi.org/10.3390/cryst14010081
Note that from the first issue of 2016, this journal uses article numbers instead of page numbers. See further details here.