Article

Particle Size Effect on Optical and Gas-Sensing Properties of La0.67Ca0.2Ba0.13Fe0.97M0.03O3 (M = Ti4+, Mn3+, and Cr3+) Compounds

1
CFisUC, Physics Department, University of Coimbra, Rua Larga, 3004-516 Coimbra, Portugal
2
Laboratoire de Physique Appliquée, Faculté des Sciences, Université de Sfax, B.P. 1171, Sfax 3000, Tunisia
3
I3N and Physics Department, University of Aveiro, 3810-193 Aveiro, Portugal
4
Laboratoire des Matériaux Multifonctionnels et Applications, Faculté des Sciences, Université de Sfax, Sfax 3000, Tunisia
5
College of Chemistry and Materials Science, Sichuan Normal University, Chengdu 610068, China
6
CQC-IMS, Department of Chemistry, University of Coimbra, Rua Larga, 3004-535 Coimbra, Portugal
*
Author to whom correspondence should be addressed.
Crystals 2024, 14(2), 173; https://doi.org/10.3390/cryst14020173
Submission received: 16 December 2023 / Revised: 20 January 2024 / Accepted: 5 February 2024 / Published: 8 February 2024

Abstract

:
In the present work, the morphological, optical, and gas-sensing properties of La0.67Ca0.2Ba0.13Fe0.97M0.03O3 (M = Ti, Cr, and Mn) nano-powders prepared via the auto-combustion route, were investigated. TEM images prove the nanoscale particle size of all the samples. Optical studies confirm the semiconductor behavior of the studied materials. The response of the prepared nano-powders towards the presence of two gas-reducing agents (ethanol and acetone) was investigated. From the resistance ratio under air and gas, it was possible to determine the response to different gases and deduce that La0.67Ca0.2Ba0.13Fe0.97Ti0.03O3 presents the highest responses to ethanol and acetone. Likewise, we deduced that the prepared materials were able to detect low concentrations of ethanol and acetone gases.

1. Introduction

The huge increase in released pollutants and toxic gases, especially from industries and automobiles, has adverse effects on the environment as well as on human health. This explains the increase in the research interest in developing new reliable gas sensor devices to be used in a wide application area [1,2]. It is also known that the principle of detection defines the gas sensor type, such as electrochemical [3], catalytic [4], metal oxide [5], or infrared [6]. Moreover, calorimetric, spectroscopic, and chromatography methods have been used for gas sensor manufacturing, which are highly expensive, and their uses are restricted due to their miniaturization difficulties for portable uses [7,8,9].
On the other hand, acetone (C3H6O) is known as a volatile, colorless, flammable liquid with a pungent aroma. It is majorly used as a solvent but is also used in laboratories, the medical and cosmetics industries, etc. It evaporates quickly in the air; therefore, acetone vapor can destroy the mucous membrane of the eyes, causing irritation when exposed. The inhalation of vapors can cause headaches, drowsiness, or dizziness. Importantly, acetone has been recently used as a potential breath marker for clinical diagnosis of abnormal blood sugar levels [10,11]. On the other side, ethanol (C2H5OH) is a flammable gas with an explosion range of 3.3–19%, which is used in various fields, especially for breath analysis and traffic safety (the alcohol breath concentration of car drivers) [12,13,14]. Therefore, controlling the concentration of ethanol and acetone in an exhaled gas environment is of significant importance.
Accordingly, the development of efficient and inexpensive gas sensors is of paramount importance. Semiconductor nanomaterials (such as CuO, Fe2O3, Co3O4, NiO, etc.) were considered the best solutions for gas-sensing applications due to their outstanding merits of low cost, a wide detection range and easy fabrication and integration [15,16,17,18,19,20]. Recently, some new and efficient semiconductor oxide material-based sensors were commercially used to detect numerous dangerous gases [21,22,23].
As an effect of this strong demand, in the last decade, many efforts have been made to identify new and more efficient sensitive materials suitable for monitoring acetone and ethanol gases at lower optimum working temperatures. H. Xu et al. [24] confirmed that Sr-doped BiFeO3 reduced the optimum working temperature to 208 °C for acetone and ethanol gas detection, compared to the undoped iron bismuth material. Also, the optimum working temperatures for acetone and ethanol gas detection found by S. R. Jamnani et al. [25] are higher than 208 °C. Moreover, SnO2-ZnO nanomaterials exhibit an optimum working temperature equal to 250 °C and 300 °C to detect ethanol and acetone gases, respectively [26].
Importantly, among p-type semiconductor materials, Lanthanum ferrites (LaFeO3) attract continuous attention for their gas-sensing properties, while the synthesis methods, the substitution on one or both sites, plays a crucial role in enhancing these properties [27,28,29,30,31,32].
In the literature, it was confirmed that partial substitution of Lanthanum ions by divalent ones (such as Pb2+, Ca2+, Ba2+…) enhances the response and selectivity to different gases [33,34,35]. This is also the case when substituting Fe3+ ions with Mg2+, Co2+, or Mn3+ ones [31,36,37,38]. Accordingly, in this paper, we synthesized the La0.67Ca0.2Ba0.13Fe0.97M0.03O3 (M = Ti4+, Cr3+, and Mn3+) compounds via the auto-combustion method and described a comprehensive study for the 3% Ti4+, Mn3+, and Cr3+ ion insertion effects on particle size and gas-sensing properties.

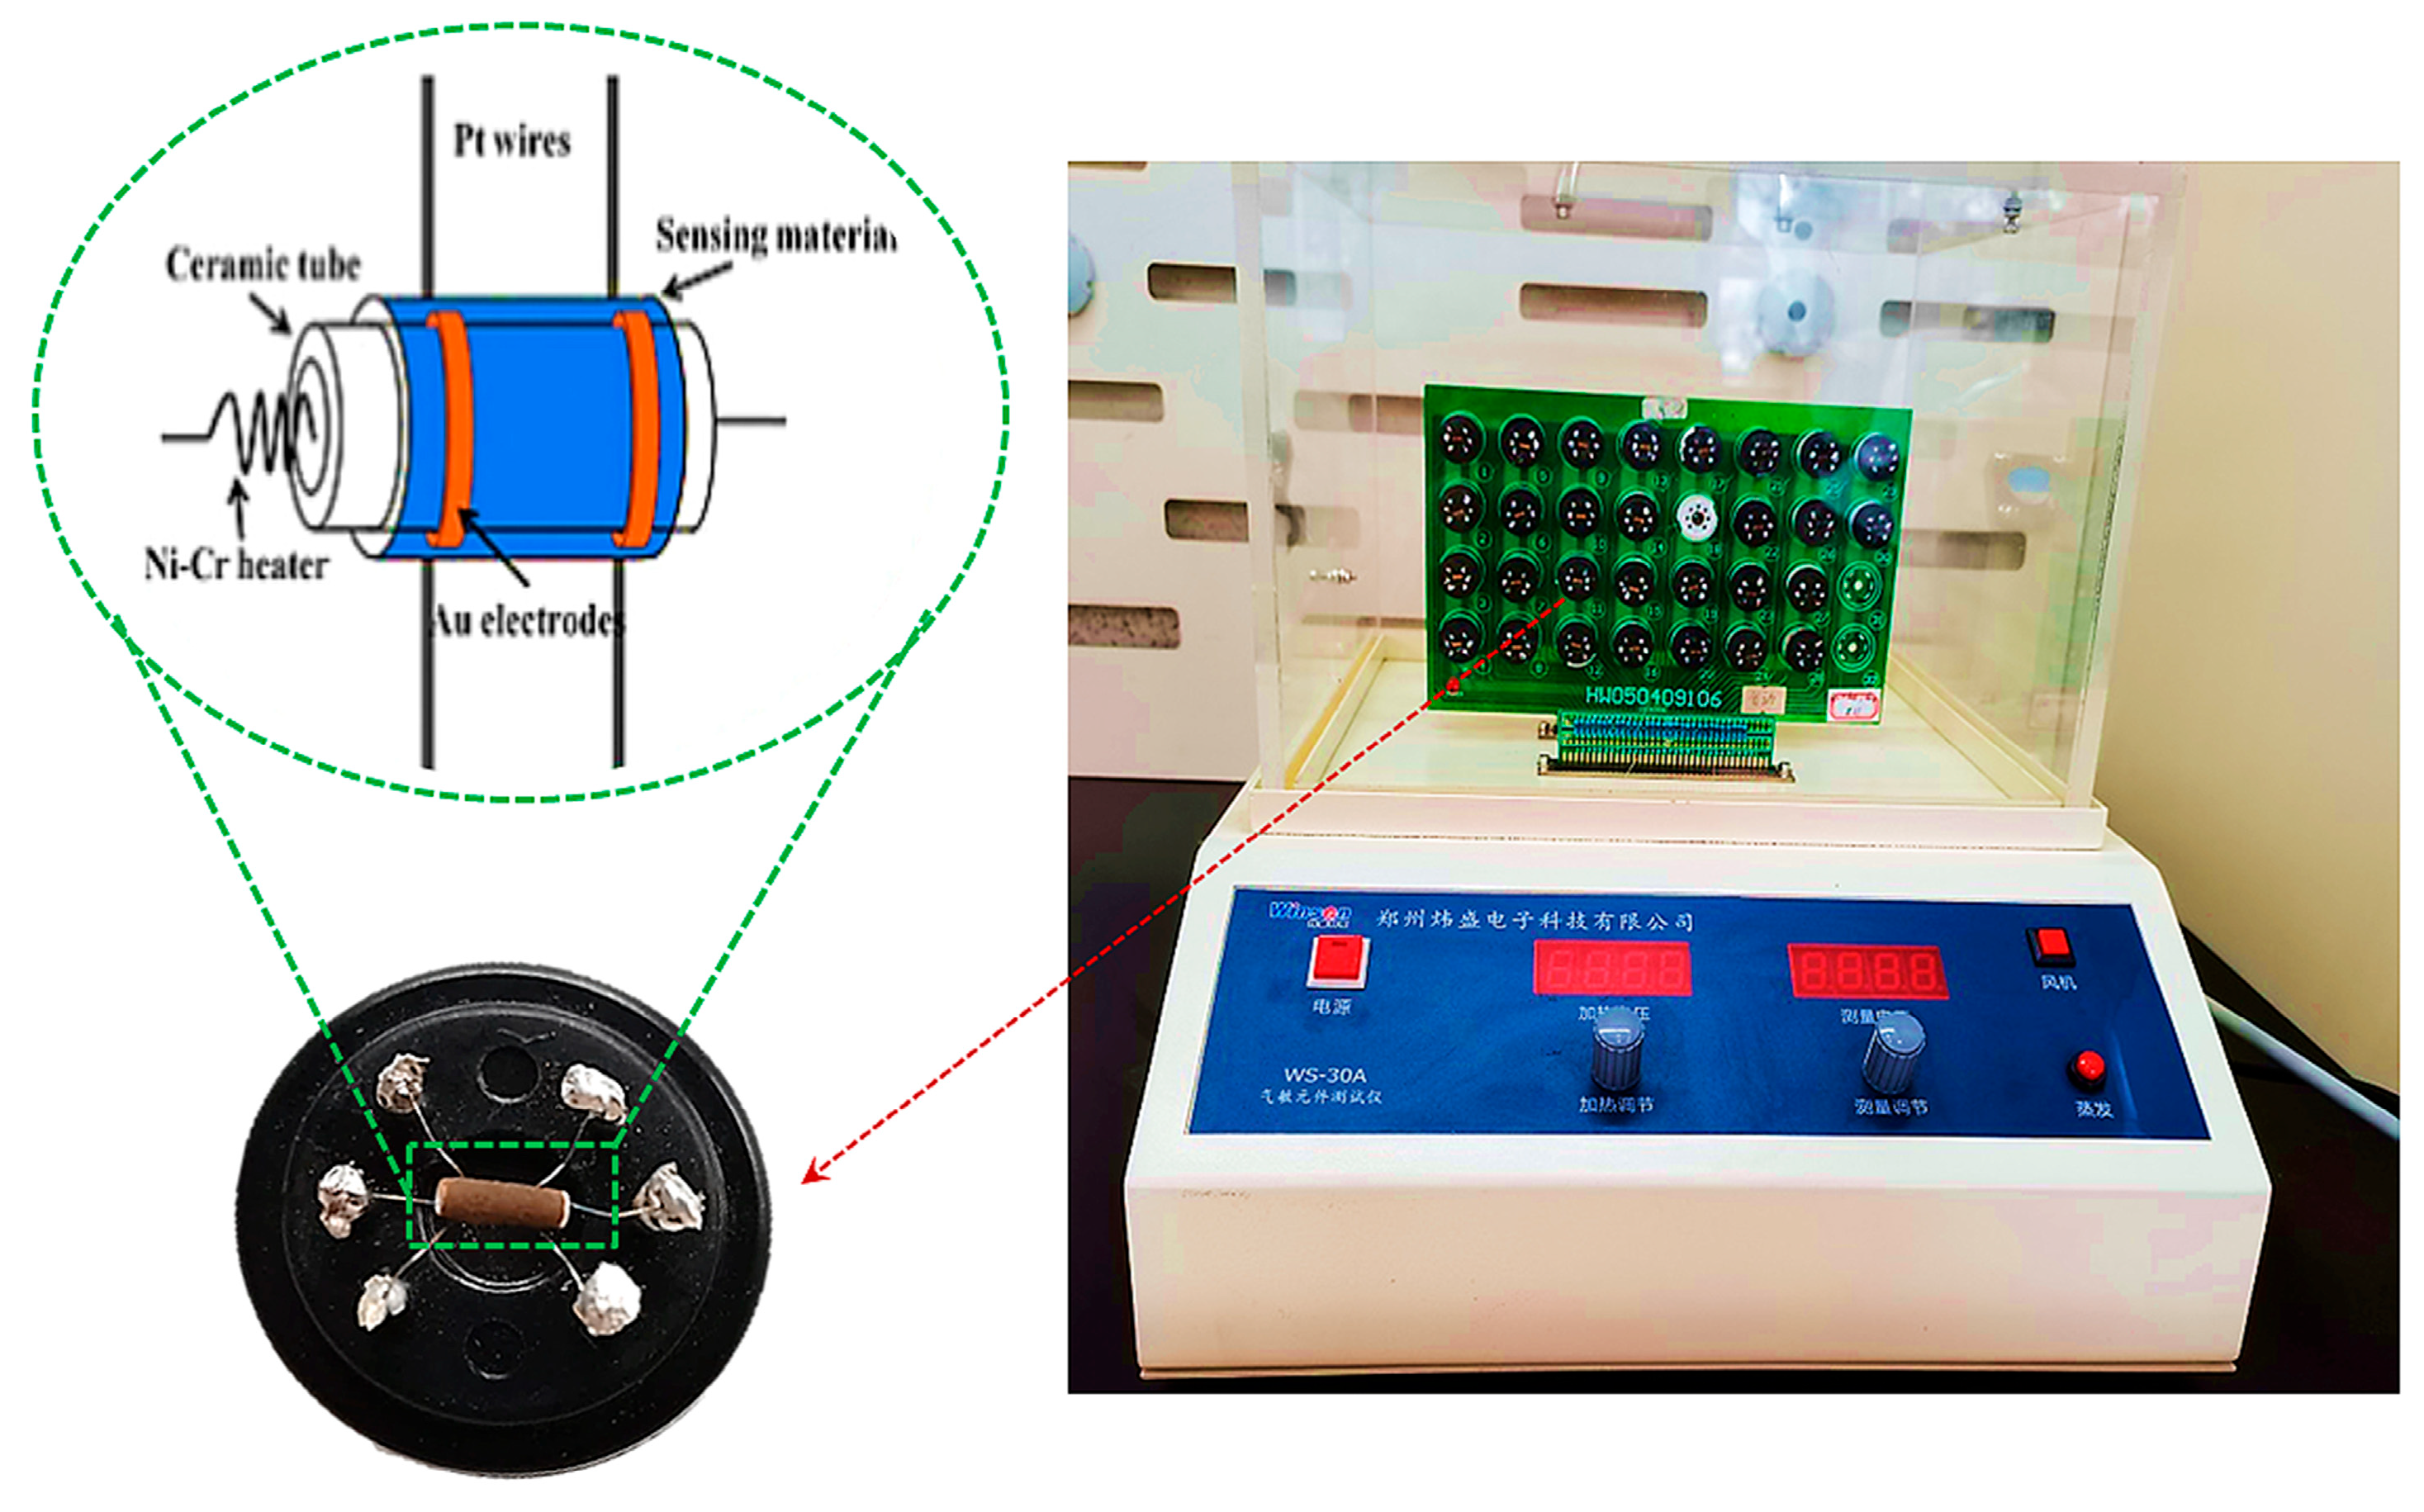
2. Materials and Methods

Nanosized La0.67Ca0.2Ba0.13Fe0.97M0.03O3 (M = Ti4+, Cr3+, and Mn3+) were prepared using the auto-combustion method. In our previous work, the details are presented [39]. Stoichiometric amounts of Lanthanum nitrate La(NO3)3.6H2O, iron nitrate Fe(NO3)3.9H2O, barium nitrate Ba(NO3)2, calcium nitrate Ca(NO3)2 and titanium/manganese/chromium nitrates were the precursors, and glycine (C2H5NO2) the fuel agent.
The prepared compounds were characterized via powder X-ray diffraction using a Bruker D8 Advance (Karlsruhe, Germany) diffractometer with Cu-Kα radiation (λ = 1.5406 Å). XRD data were recorded over a range of 2θ = 10° to 100°. Transmission electron microscopy (Hitachi H-800- Tokyo, Japan) was used to study the morphology of the powders.
To prepare the gas sensors, the powder was drop-casted on a gold-patterned alumina substrate crossed by Ni-Cr heating wires. This method was previously reported in the literature [29,30] (Figure 1). To improve its performance (stability and repeatability), the sensors were kept at 300 °C for 2 days. The measurements were performed on a WS-30A system (China). Several steps were followed in order to measure the sensors at identical temperatures, as reported previously [40,41].
The relation S = Rg/Ra, where Rg and Ra represent the resistance of the sensor in the gas and in the air, respectively, was used to calculate the gas response.
The solid-state absorption spectra (UV-Vis) of the powders were recorded by collecting the total reflectance using a Cary 5000 UV-Vis-NIR NIR (Agilent Technologies, Santa Clara, CA, USA) spectrophotometer equipped with an integrating sphere (200–2500 nm range). Background correction was performed by collecting the baseline with 100% and 0% reflectance (using a Polytetrafluoroethylene, PTFE, reference sample, and the blocked beam, respectively) prior to the determination of the spectra of the solid samples. Conversion to absorption was performed assuming the Kubelka–Munk function, F(R) [42].
Raman spectra were acquired, making use of a Jobin Yvon HR800 spectrometer (Horiba, Vénissieux, France). A backscattering configuration was used with a 532 nm laser excitation.

3. Results and Discussion

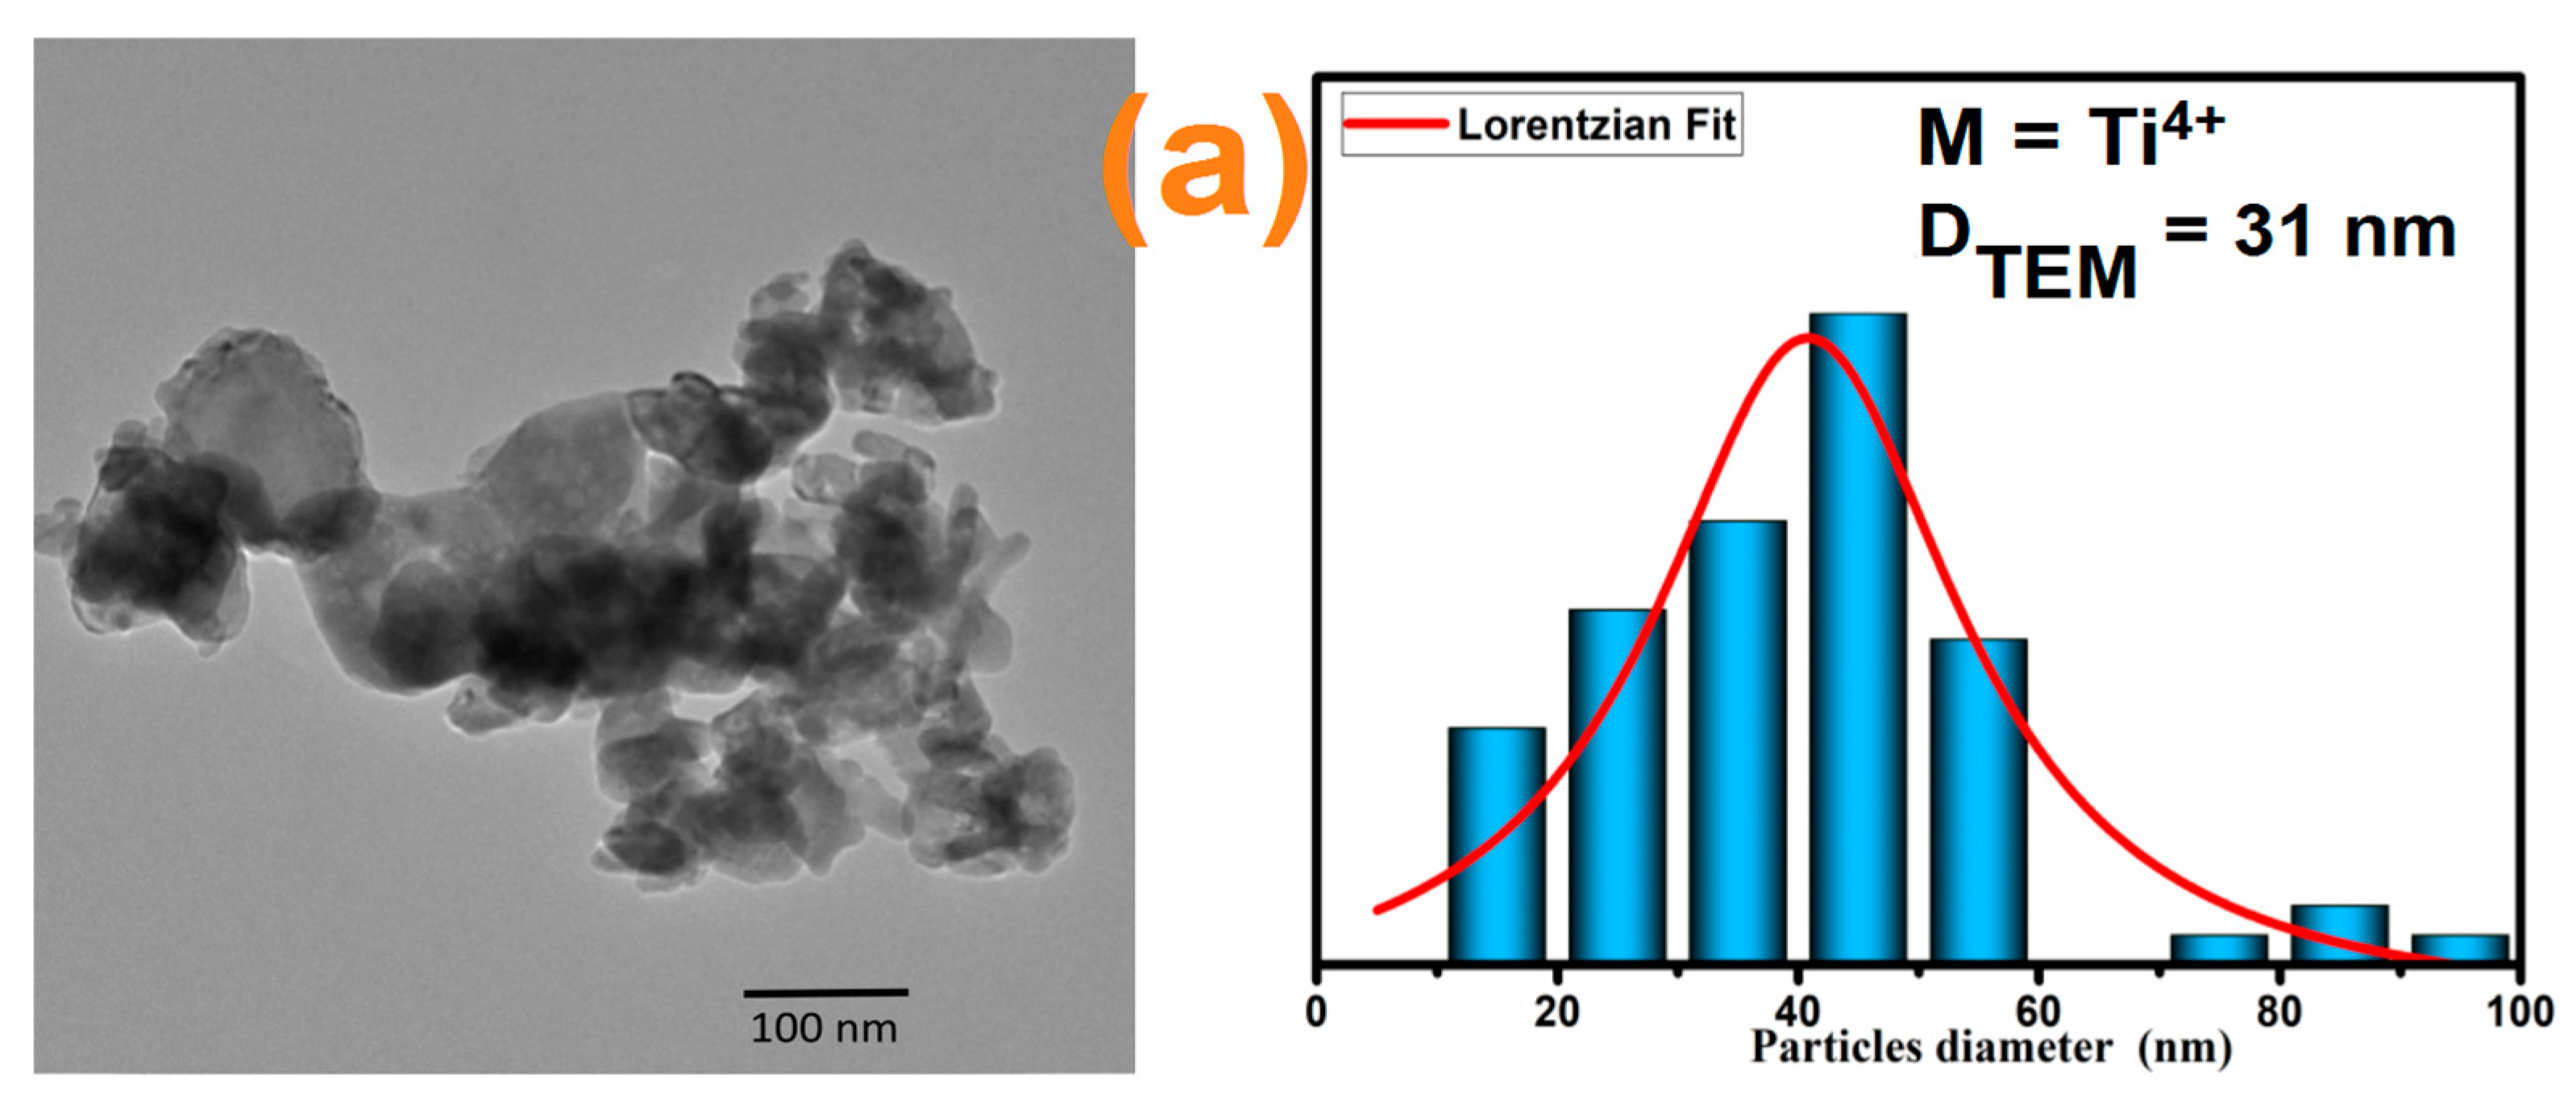
3.1. Morphological Study

The particle size and shape of the prepared La0.67Ca0.2Ba0.13Fe0.97M0.03O3 (M = Ti4+, Cr3+, and Mn3+) compounds were investigated using transmission electron microscopy (TEM). The TEM images are presented in Figure 2a–c, from which we deduce that all compounds present grains with different spherical, cubic, and polygonal shapes. It is shown that the La0.67Ca0.2Ba0.13Fe0.97Ti0.03O3 compound shows more regularity in the particle shapes. The Image-J 1.52a software was used to calculate the particle size of the studied compounds by adjusting the particle size distribution with the Lorentzian formalism, as shown in Figure 2. The adjustment results confirm that the insertion of the Ti4+ ions in the M-site of the La0.67Ca0.2Ba0.13Fe0.97Ti0.03O3 compound decreases the particle size values. It is important to mention that the particle size has a crucial effect on the gas-sensing properties. Accordingly, we expected a higher gas response for the La0.67Ca0.2Ba0.13Fe0.97Ti0.03O3 compound.

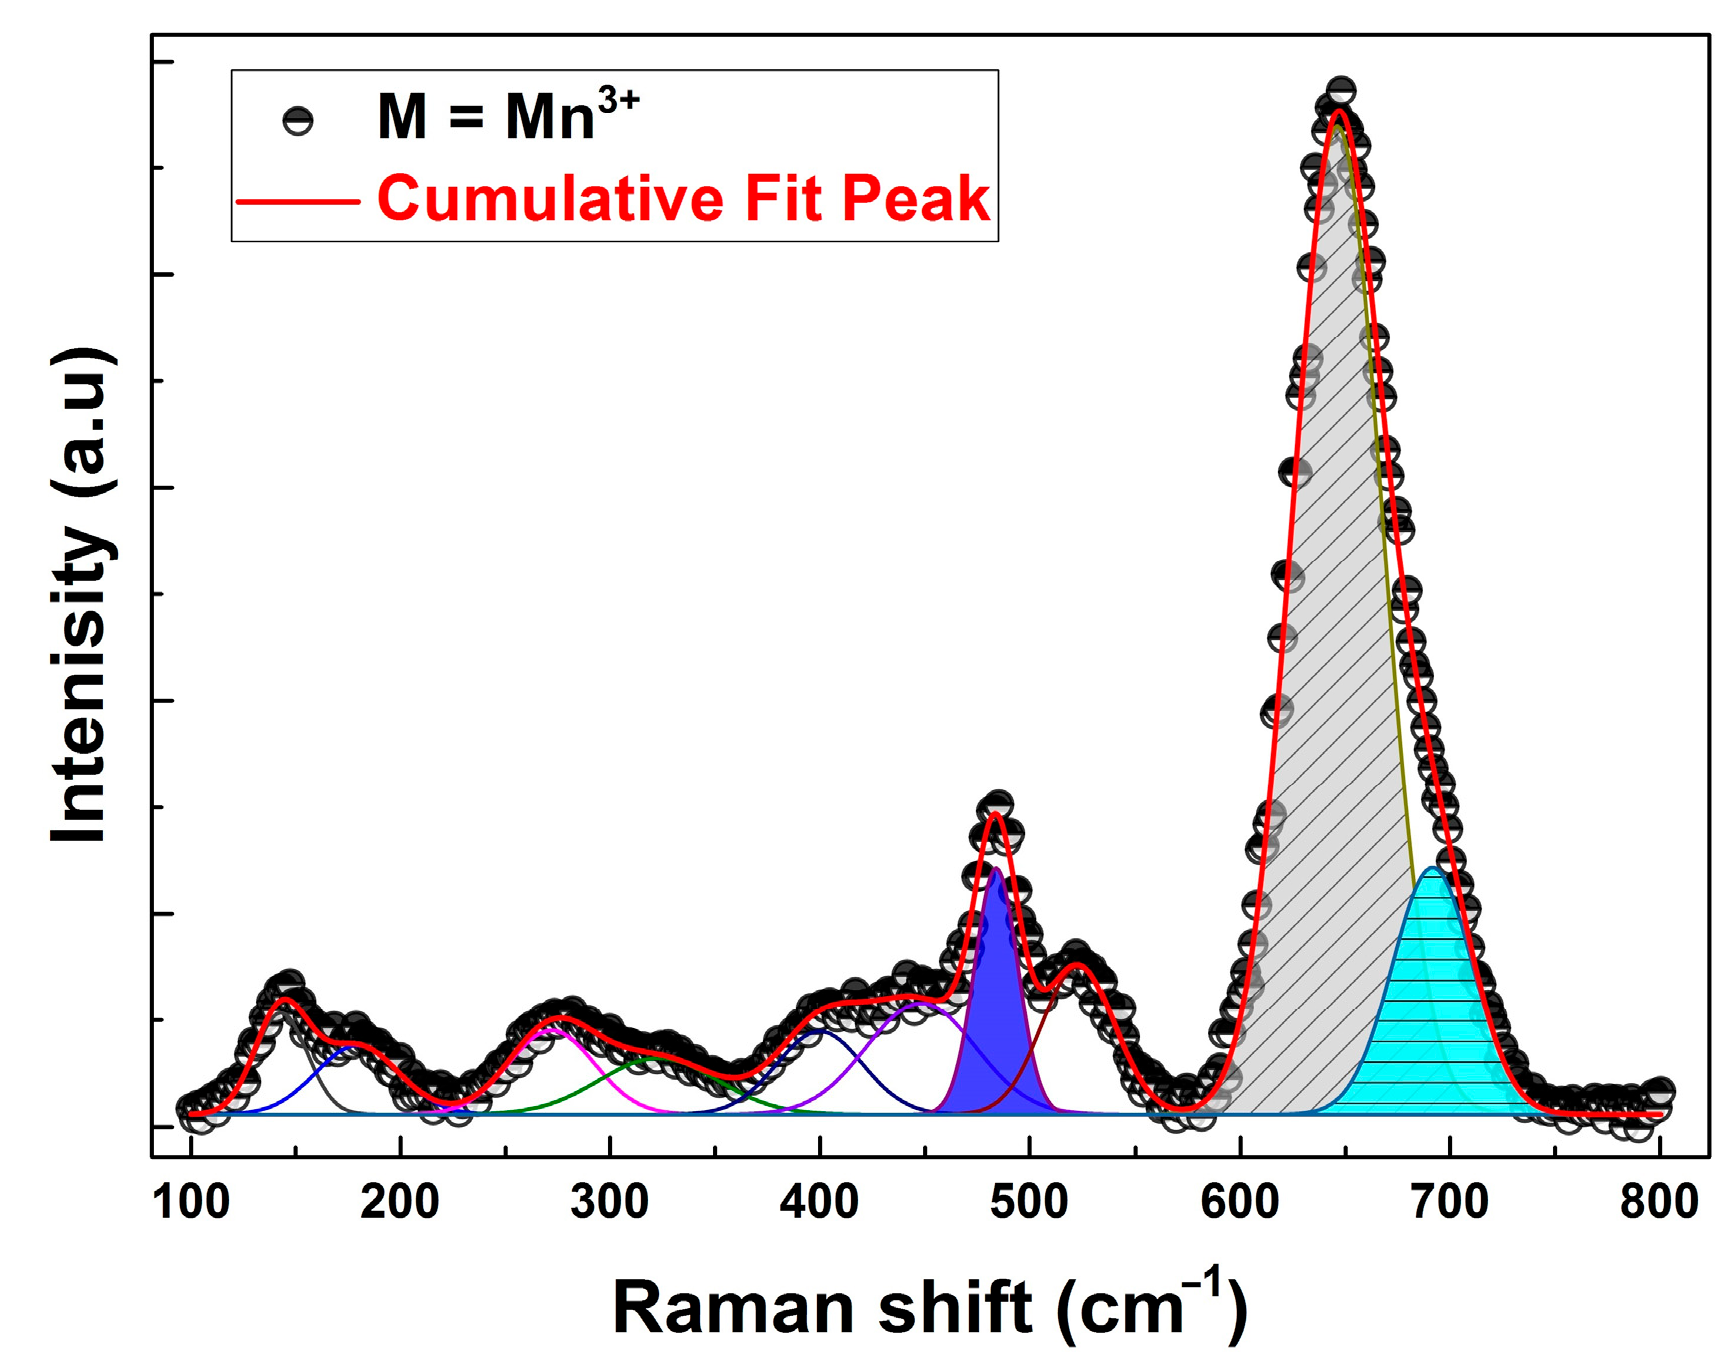
3.2. Raman Scattering Studies

To further the structural study, Raman spectroscopy was used since it is more sensitive than XRD because its excitation energy is less penetrating than an X-ray [43].
The Raman spectra of the La0.67Ca0.2Ba0.13Fe0.97M0.03O3 (M = Ti4+, Cr3+, and Mn3+) compounds are shown in Figure 3 for structural comparison. We previously studied the Raman vibrational modes of the La0.67Ca0.2Ba0.13Fe0.97Ti0.03O3 compound [44], which showed only 11 active vibrational modes. Furthermore, as previously confirmed in the literature, almost-doped LaFeO3 ceramics crystalize in an orthorhombic structure that presents twenty-four active Raman modes, as described by the following equation [45]:
Γ = 7 Ag + 7 B1g + 5 B2g + 5 B3g
According to the literature, below 200 cm−1, the Raman-active modes of doped LaFeO3 compounds are essentially a result of the A-site ion vibrations and known as (A) modes. Between 200 and 300 cm−1, modes are associated with the oxygen octahedral tilt known as (T) modes, while modes present between 400 cm−1 and 450 cm−1 are attributed to the oxygen octahedral bending vibrations (B). Finally, the modes above 500 cm−1 are identified by the oxygen stretching vibrations (S) [46].
At a very first look, the room temperature Raman spectra of the La0.67Ca0.2Ba0.13Fe0.97M0.03O3 (M = Ti4+, Cr3+, and Mn3+) compounds appear completely in agreement with that of the parent LaFeO3 perovskite [46,47], which confirms that all the studied compounds were crystalized in the orthorhombic structure and that there was no structural phase transition when partially substituting iron ions with Ti4+, Cr3+, and Mn3+ ones.
Meanwhile, the introduction of these three ions induces a change in the intensity and width of some vibrational peaks. To better understand the insertion of Cr3+, Ti4+, and Mn3+ ions, we performed the Lorentzian deconvolution of the Raman spectra of the La0.67Ca0.2Ba0.13Fe0.97M0.03O3 (M = Cr3+, and Mn3+) compounds, as presented in Figure 4. According to the figures, one can clearly see the change in intensities and widths of Raman modes at the frequency range between 450 cm−1 and 750 cm−1, evidence of oxygen octahedral bending and vibrations. This confirms that the substitution affects the magnetic interactions, which induce the deformation of the octahedron FeO6.

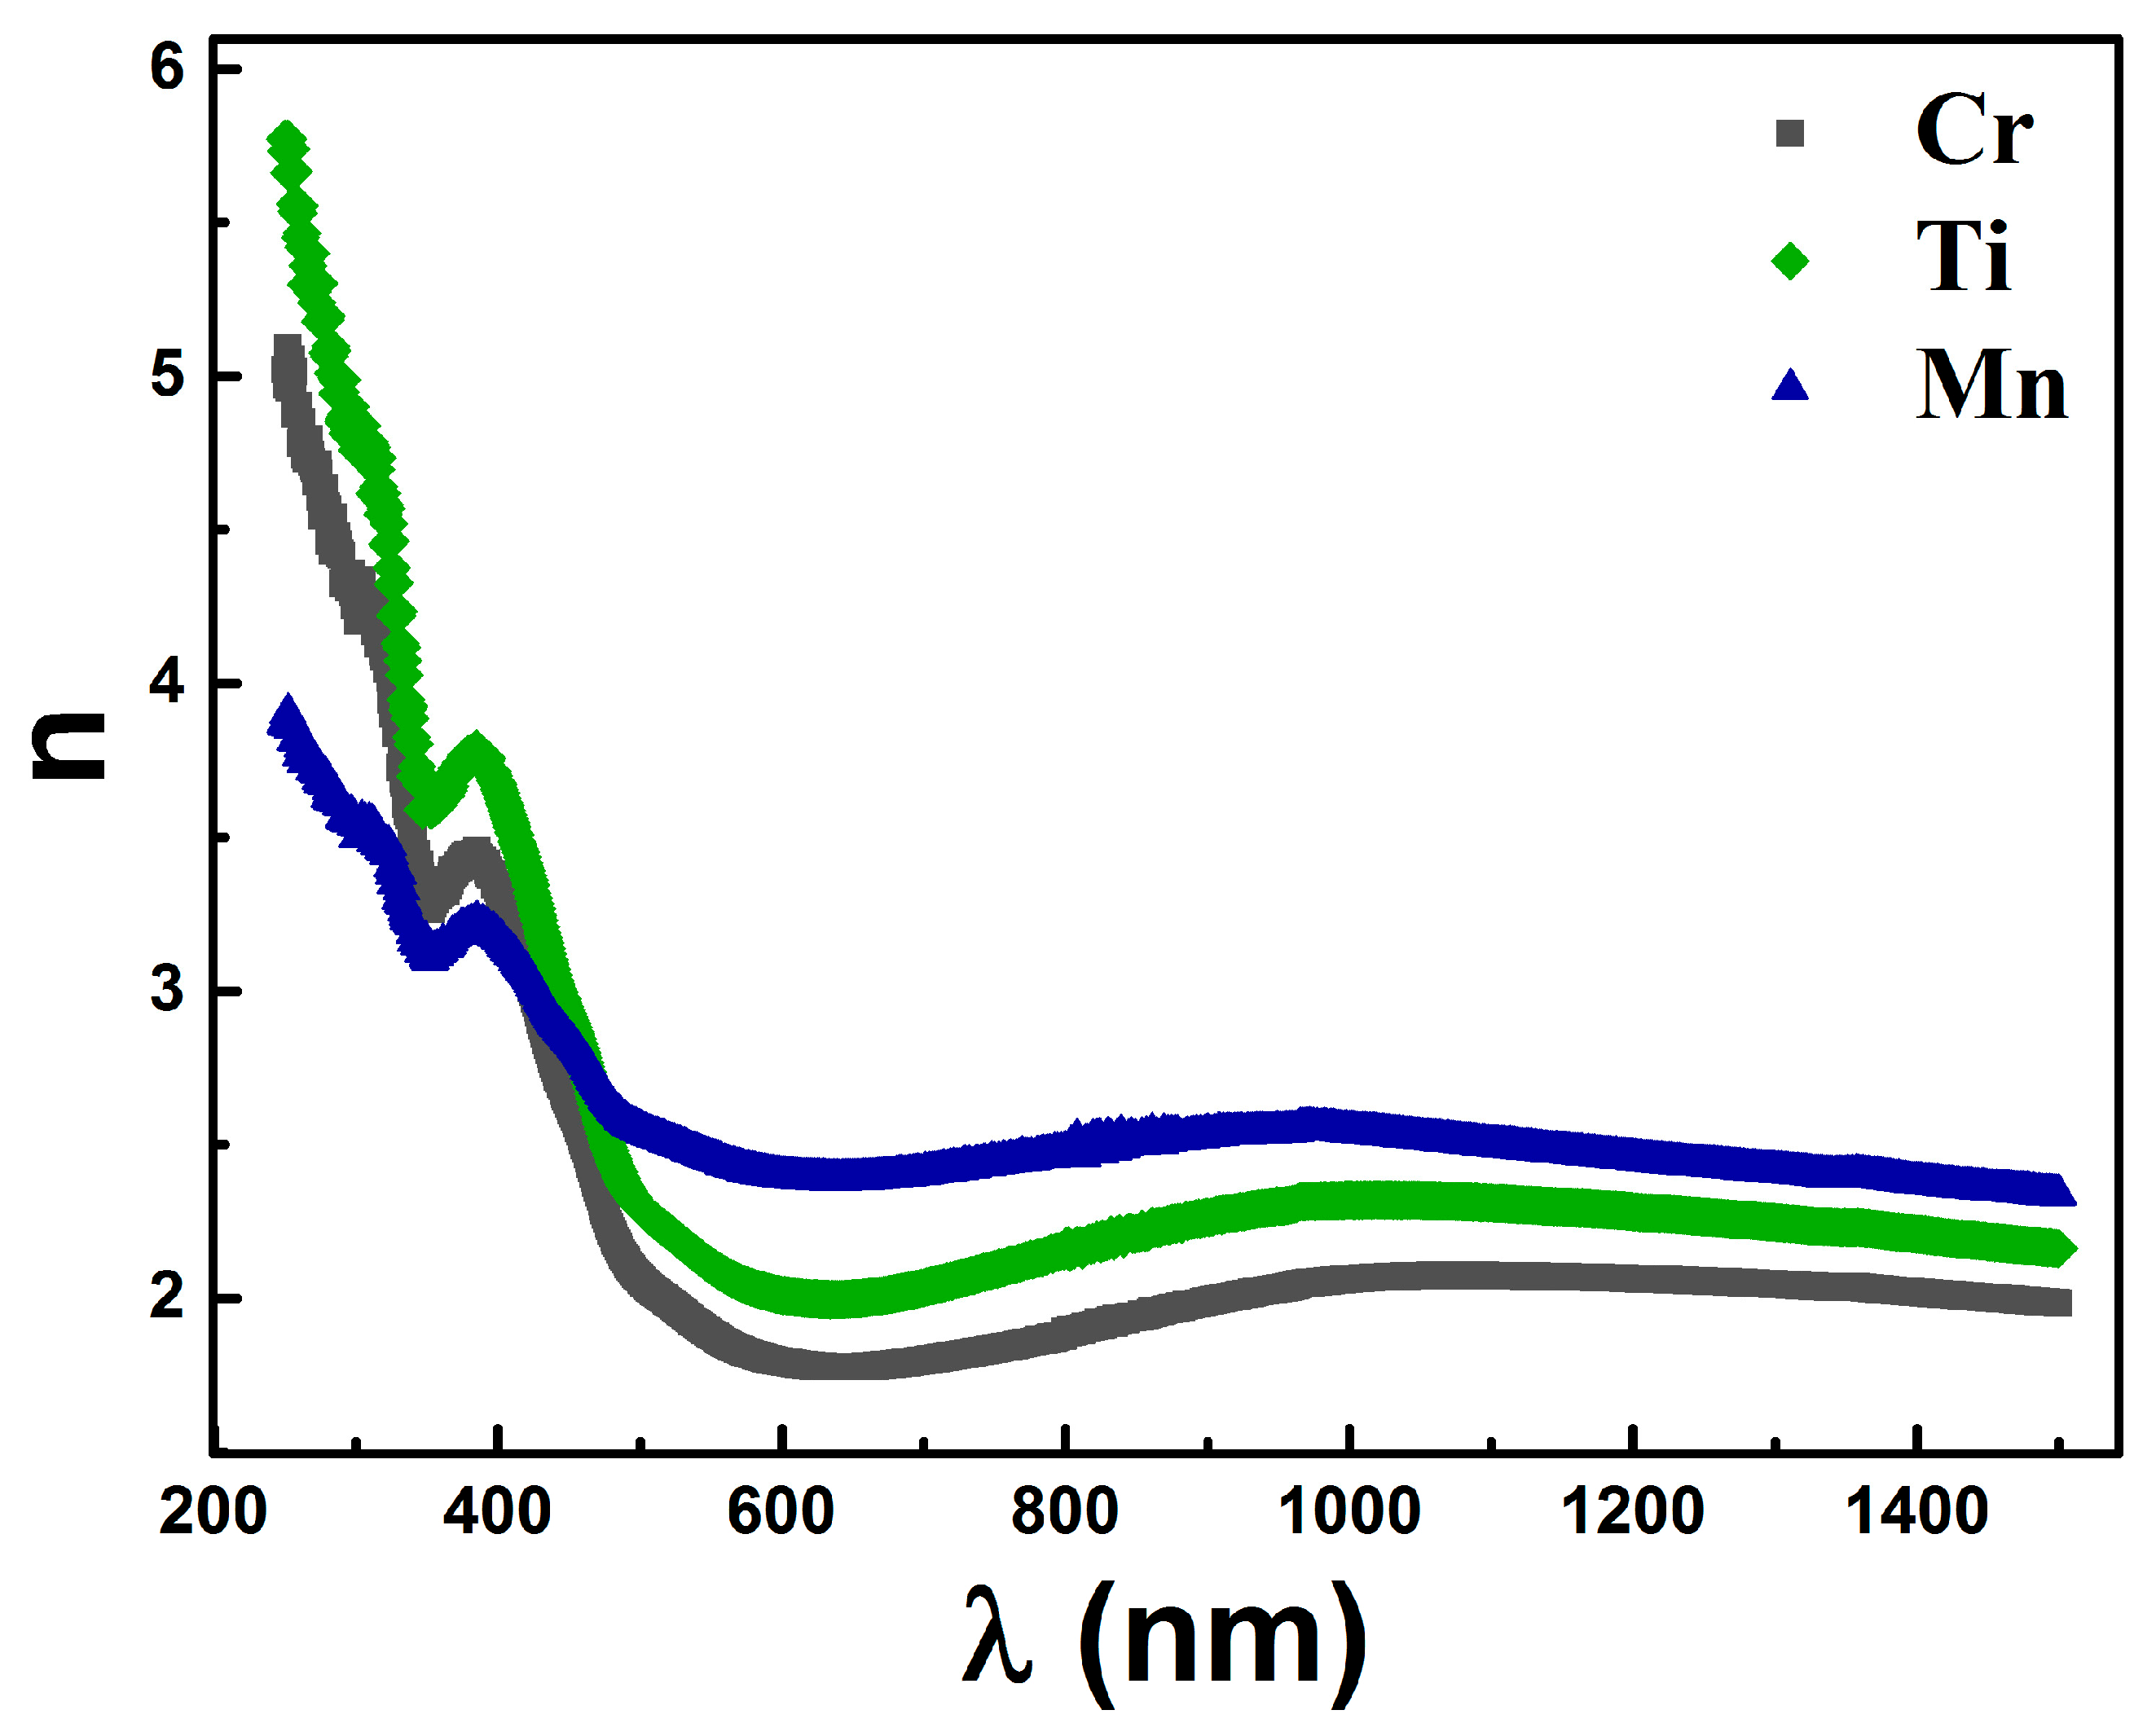
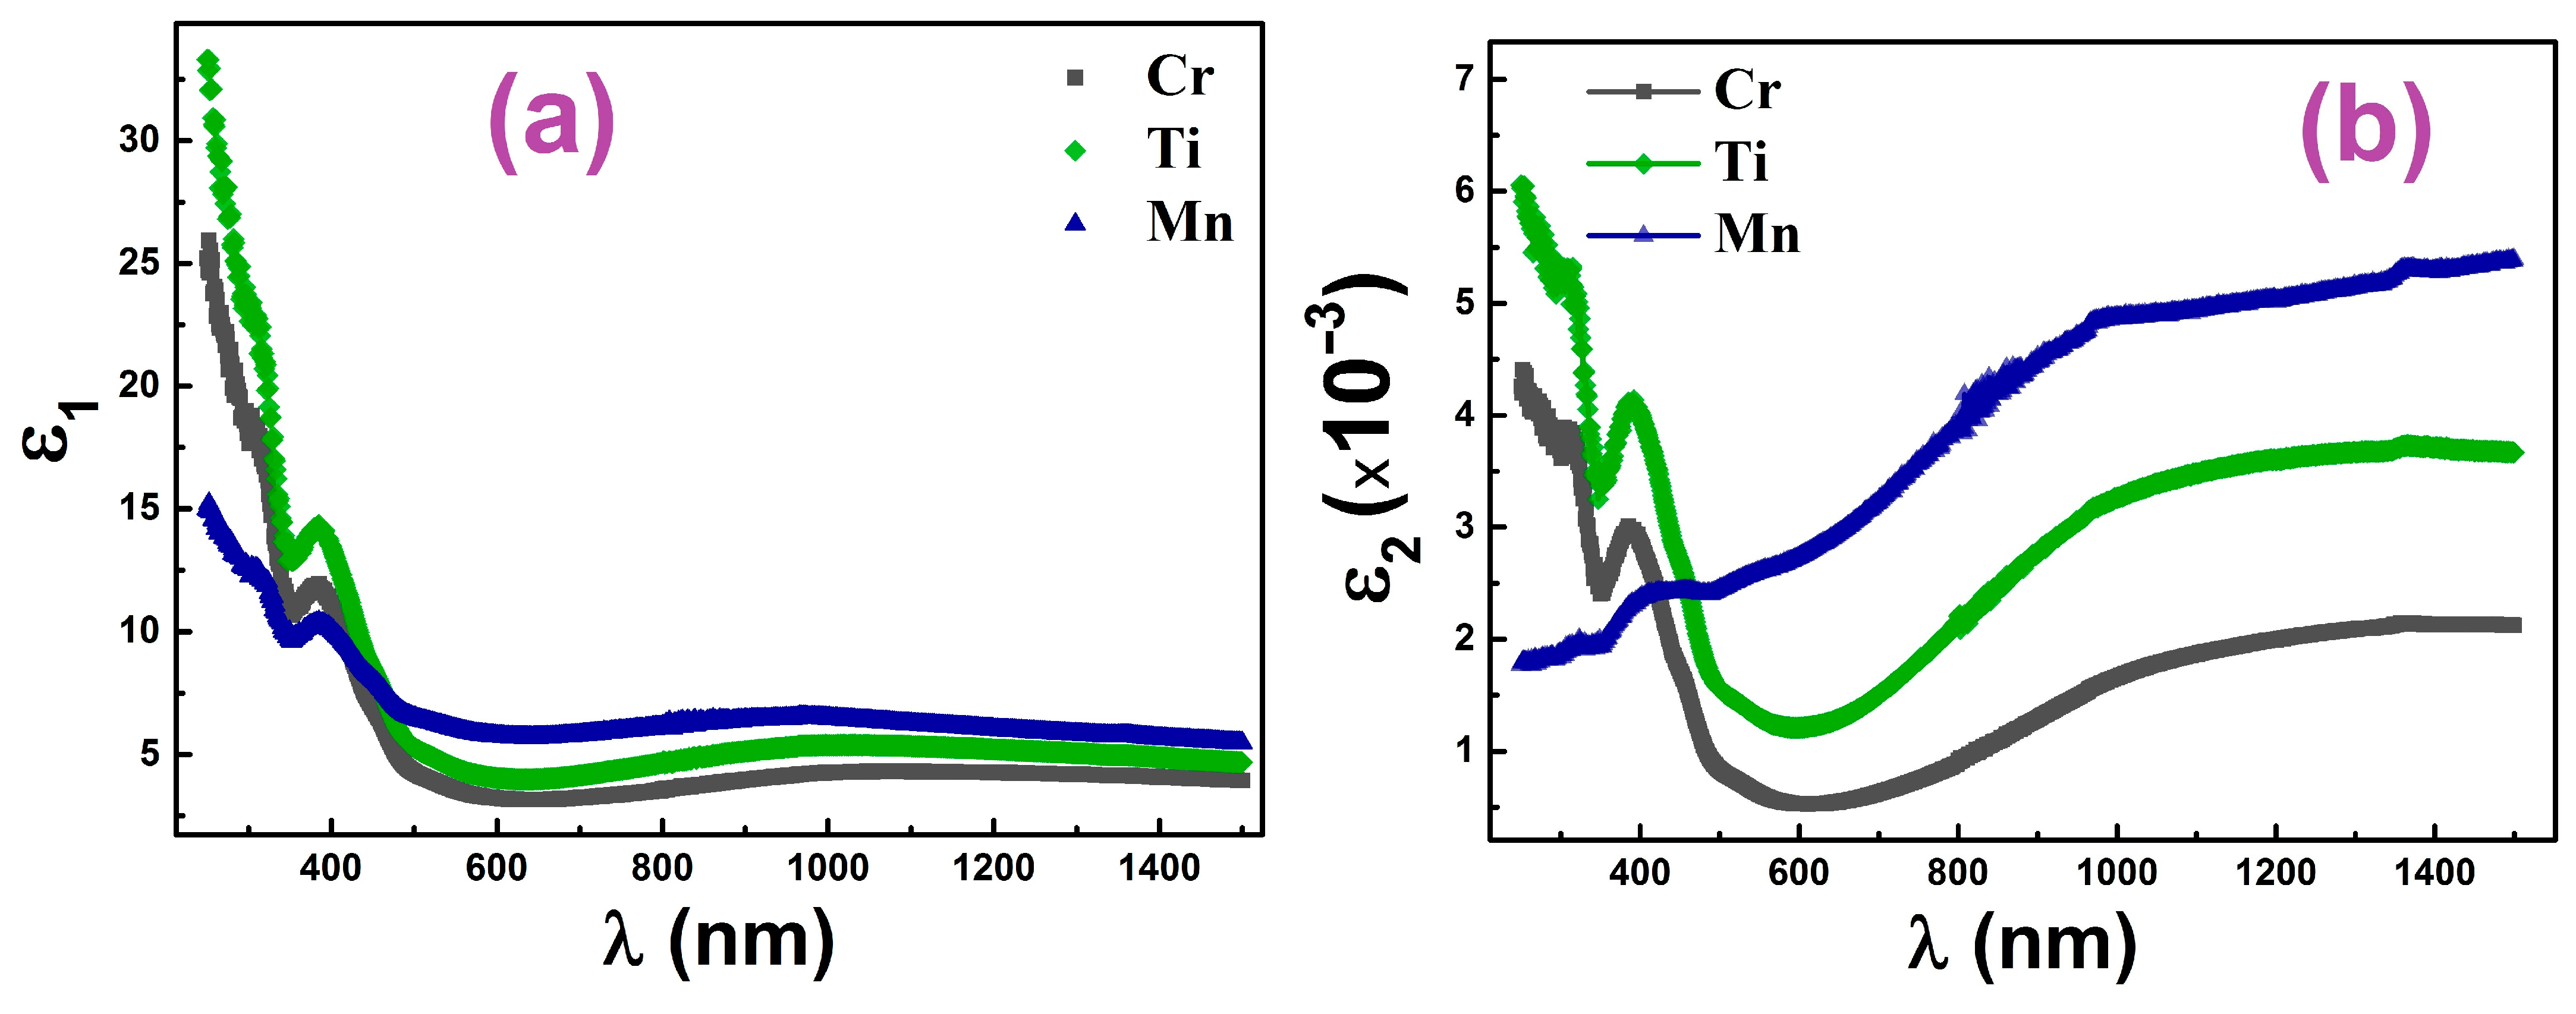
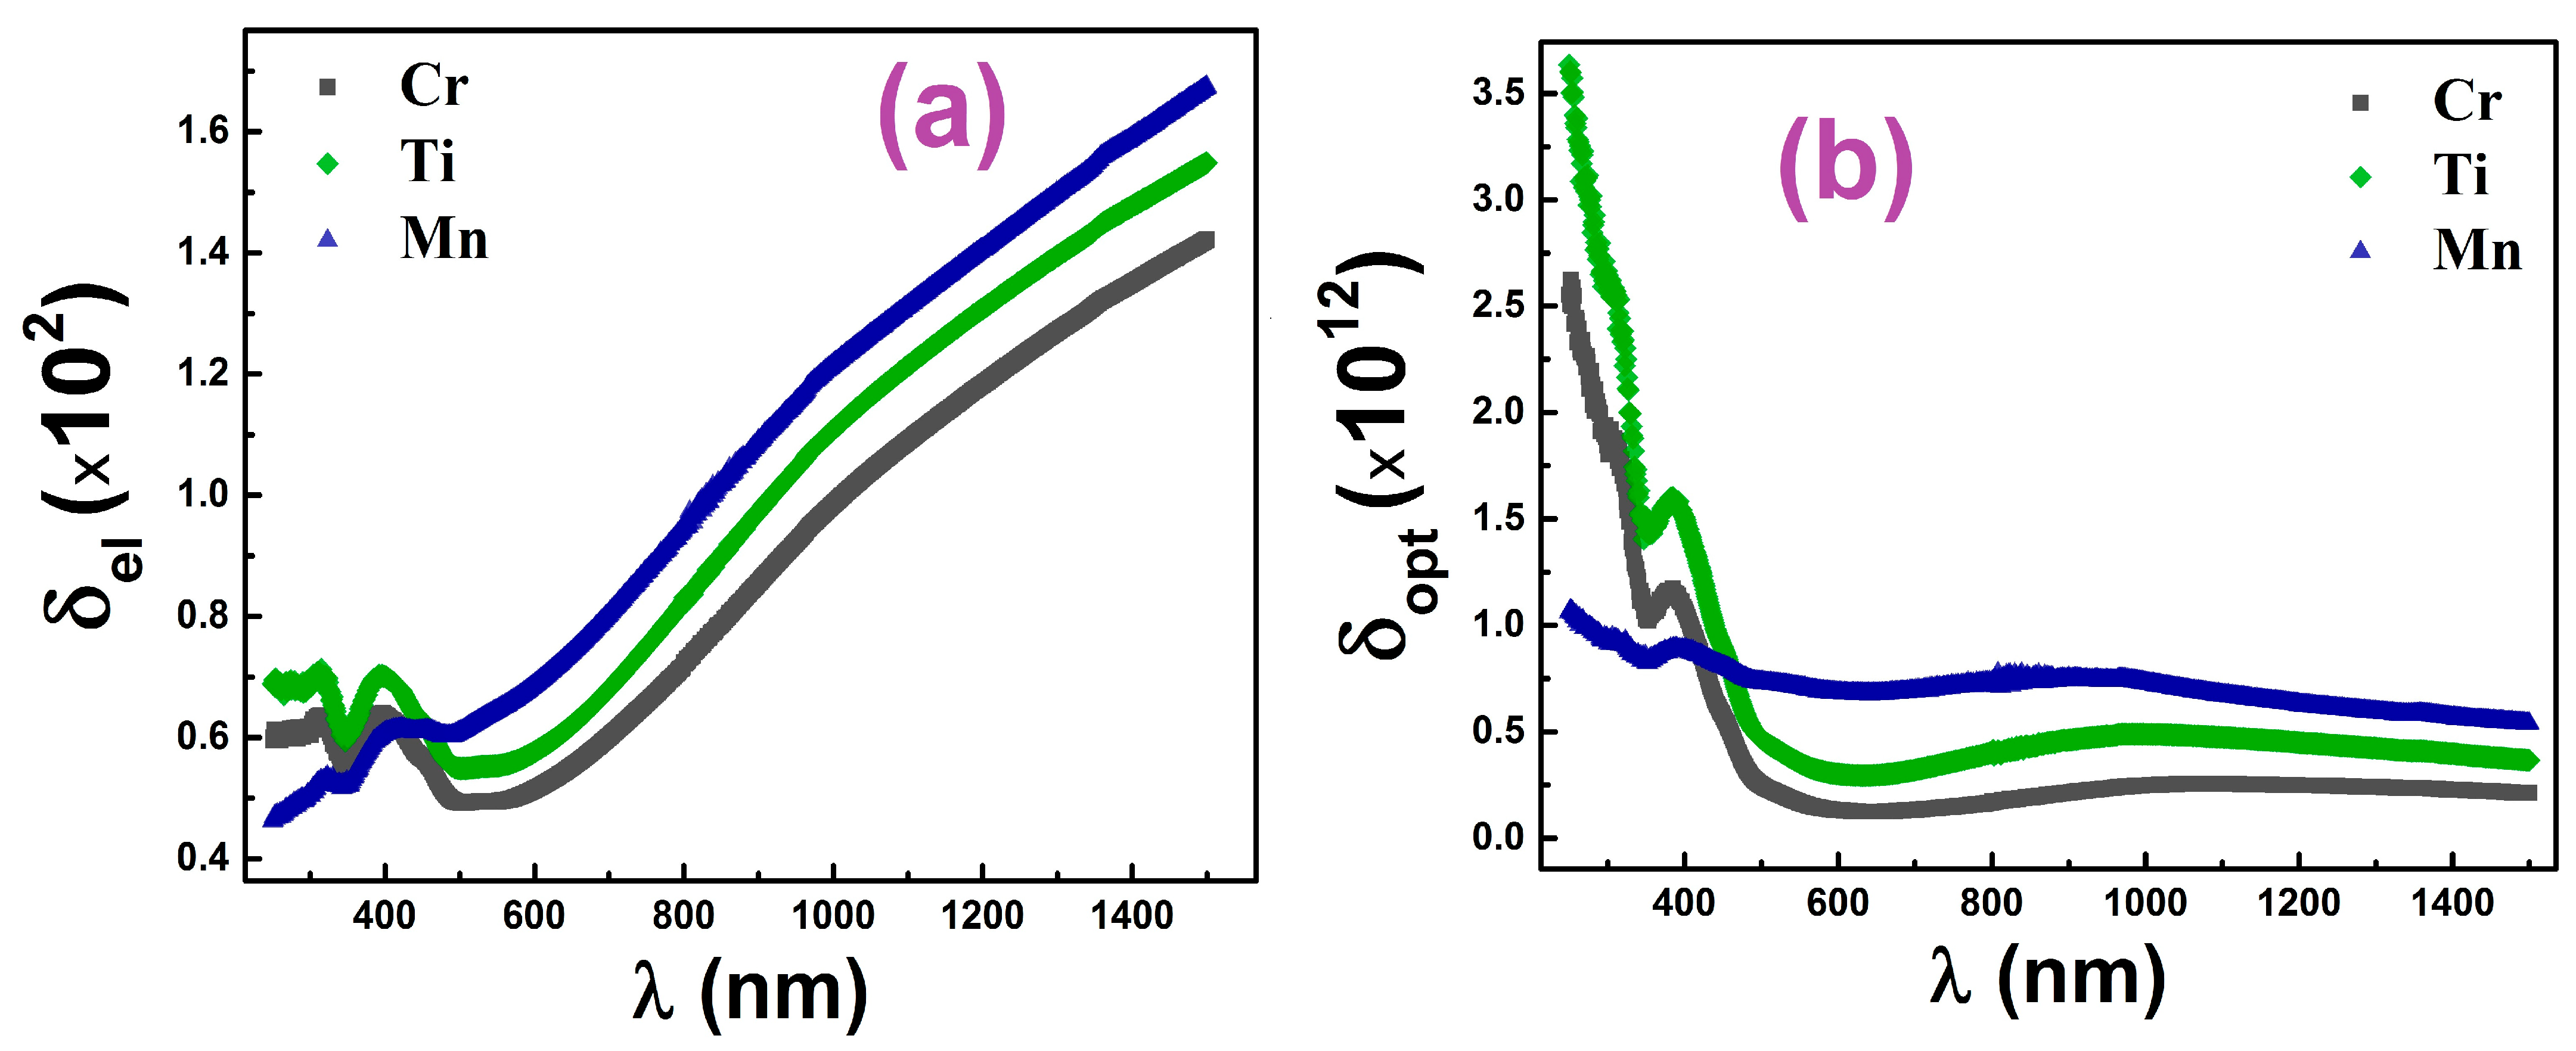
3.3. Optical Properties

The optical reflectance spectra for all samples, as shown in Figure 5a, were obtained using diffuse reflectance spectroscopy (DRS) (Figure 5). To estimate the energy band gap, Eg, the Tauc plot, (αhν)2 as a function of , was plotted in the inset of Figure 5a. The linear extrapolation of the energy plot allowed the determination of the Eg values, which were found to be equal to 2.57, 2.50, and 1.22 eV for Cr, Ti, and Mn-doped samples, respectively. Consequently, these materials are candidates for photovoltaic devices and single junction solar cell [48].
The decrease in the band gap energy value observed for the Mn-doped compound can be explained by the difference in the ionic radii, which decreases the octahedral rotation, leading to a reduction in the band gap.
Moreover, this decrease can also be attributed to existing oxygen defects in the structure. As known, the energy level of the oxygen vacancy and the Fe-eg and Fe-t2g states are between the Mn-eg and O-2p states and are the main contribution to the conduction bands and those of the valence of perovskite studied separately [49]. Impurity and defect levels behave as transitive steps to excite electrons. Thus, they could reduce the band gap.
It is known that, in the optical linear field, the complex optical refractive index is given as follows:
n ^ = n λ + i k ( λ )
Here, n is the real part, and k is the imaginary part. These parameters are the linear refractive index and the extinction coefficient, respectively, which can be calculated using the following relations [50,51,52].
k = α λ 4 π
n = ( 1 + R ) ( 1 R ) + 4 R ( 1 R ) 2 + k 2
The variation in the n(λ) refractive index for different samples as a function of the wavelength is shown in Figure 6. The value of n(λ) shows a significant decrease with an increasing wavelength. Above 900 nm, the refractive index remains almost constant.
Using the refractive index n(λ) and extinction coefficient k, we calculated the real ε1(λ) and imaginary ε2(λ) parts of the dielectric constant using the following equations [53].
ε 1 ( λ ) = n 2 k 2
ε 2 ( k ) = 2 n k
Figure 7a,b present the variation in ε1(λ) and ε2(λ) as a function of wavelength. For both ε1(λ) and ε2(λ), we notice the presence of two pics related to the high light absorption. The first is localized near 400 nm and related to the strong light absorption in the visible range, while the second large pic is related to the absorption in the IR region.
Figure 8 shows the variation in optical and electrical conductivity (δopt and δel) estimated using the following relations:
δ o p t = α n c 4 π
δ e l = λ n c 2 π
Electrical and optical conductivities are two types of contributions that can be used to express conductivity. The first is concerned with the mobility of charge carriers in the material, whereas the second is concerned with the mechanism of electron–photon interactions. The conductivity of a semiconductor is proportional to the temperature and the band gap energy, Eg. As noticed in Figure 8a, the increment in optical conductivity is related to higher absorbance at a lower wavelength range due to the excited electrons that cross the forbidden band gap due to higher photon energy. It is known that optical conductivity is mainly associated with the free charges that absorb the photon energy, and therefore, a significant increase in optical conductivity occurs [53]. Moreover, we remark that Ti-doped materials present a higher optical conductivity in the UV region, which is related principally to the higher optical absorption of this material in this region. On the other hand, Mn-doped material, which presents the agglomeration of higher particles observed using TEM, is characterized by a lower optical absorption.
The electrical conductivity results (Figure 8b) show that the values are in the range of 102 S/m, which supports the semiconducting nature of the studied material [53]. In addition, we note that the electrical conductivity is much lower than the optical conductivity (σelσop), which can be interpreted by the fact that the free charge carriers do not have sufficient energy to jump the potential barrier level [54].

3.4. Gas-Sensing Measurements

Ethanol and acetone gas-sensing measurements have been tested for La0.67Ca0.2Ba0.13Fe0.97M0.03O3 (M = Ti4+, Cr3+, and Mn3+) compounds. To further understand the metal ion insertion effect on gas-sensing properties, we highlight the following three important parameters: the response, the operating temperature, and response/recovery times. It is important to mention that the optimum working temperature should be studied first, then other parameters could be tested at this temperature. For this, we performed a series of experiments in a temperature range from 160 °C to 260 °C under 100 ppm of ethanol and acetone gases, as shown in Figure 9a and Figure 10a, respectively. For both gases, the response of the La0.67Ca0.2Ba0.13Fe0.97M0.03O3 (M = Ti4+, Cr3+, and Mn3+) compounds increase to reach a maximum value at 200 °C and then decrease for further temperature increases. Accordingly, 200 °C is considered the optimum operating temperature for all compounds at which the response of different concentrations, selectivity, and response–recovery time properties are measured for both ethanol and acetone gases. It is worth noting that this temperature is lower than those reported for pure and doped Lanthanum ferrite materials [55,56,57], which confirms the utility of this work. As presented in Table 1, the obtained optimum temperature is also lower than those reported for other semiconductor sensors.
Furthermore, one can see from Figure 9a and Figure 10a that at 200 °C, the La0.67Ca0.2Ba0.13Fe0.97Ti0.03O3 (M = Ti4+) compound showed the highest response values towards 100 ppm of ethanol and acetone gases. Its response value to ethanol gas is almost equal to that of acetone gas, confirming the high utility of this compound for ethanol and acetone gas detection. The high response results of the La0.67Ca0.2Ba0.13Fe0.97Ti0.03O3 compound may be related to its lowest particle size, as deduced from the morphological study.
For all La0.67Ca0.2Ba0.13Fe0.97M0.03O3 (M = Ti4+, Cr3+, and Mn3+) compounds, at 200 °C, the response tests under different ethanol and acetone concentrations were realized as presented, respectively, in Figure 9b and Figure 10b. These response curves were deduced from the gas-sensing resistance curves (Response = Rg/Ra). One can see that when compounds are exposed to ethanol and acetone gases, the response (the resistance) of all compounds increases, confirming the p-type semiconductor behavior of all La0.67Ca0.2Ba0.13Fe0.97M0.03O3 (M = Ti4+, Cr3+, and Mn3+) compounds. Furthermore, the response increases with increasing the ethanol and acetone gas concentration, showing an almost linear behavior. This is due to the presence of high gas-adsorbing vacancies on the surface of sensors [57]. It was reported that when the gas concentration increases, the quantity of adsorbed gas molecules on the surface increases unceasingly, leading to an increase in resistance. The increase in the sensor resistance is due to an increase in the electrons acquired by the p-type semiconductor sensor [63]. Once again, from these figures, we can deduce that the La0.67Ca0.2Ba0.13Fe0.97Ti0.03O3 compound presents the highest response values towards ethanol and acetone gases, which confirms the utility of the Titanium ion insertion for gas-sensing applications. On the other side, we plotted in Figure 9c and Figure 10c the response vs. gas concentration curves. The response values of the La0.67Ca0.2Ba0.13Fe0.97Ti0.03O3 compound to 5 ppm of ethanol and acetone gases are equal to 3.94 and 3.68, respectively. It indicates that this compound is suitable for detecting very low ethanol and acetone concentrations, which have practical applications.
The response and recovery times are key vectors for a sensor and can be defined as the time required to reach a 90% response (recovery) when gas is in (out) [64]. For gas-sensing applications, quick response and recovery is very important. For all compounds, the response and recovery times were calculated for 10 ppm of both gases, and the resulting values are presented in Figure 9d and Figure 10d (see Table 2). For the La0.67Ca0.2Ba0.13Fe0.97Ti0.03O3 compound, the response and recovery times were less than 56 s. The short response and recovery times and high response to very low ethanol and acetone gas concentrations allow this compound to be a potential candidate for gas-sensing applications.
The detection mechanism of the synthesized p-type semiconductor sensor is based on resistance behavior when exposed to gases [65,66,67]. In the air, oxygen species may be adsorbed on the nanoparticle’s surface and O 2 , O 2 , and O ions are consequently formed using the electrons captured from the conduction band of our sensor. A hole-accumulation layer is formed on the sensor’s surface, leading to a decrease in resistance. The adsorption and desorption of oxygen can be explained by the following mechanism [68]:
O 2 g a z O 2 a d s
O 2 g a z + e ¯ O 2 ( a d s )
O 2 ( a d s ) + e ¯ 2 O ( a d s )
O ( a d s ) + e ¯ O ( a d s ) 2
Here, ‘’gas’’ and ‘’ads’’ refer to the state of gas and adsorption, respectively. These reactions show an increase in the concentrations of holes, leading to a lower resistance. When the gas sensor is in contact with the detected gas, the adsorbed oxygen reacts on the surface of the sensor as follows [69]:
R + O ( a d s ) n R O + n e ¯
Accordingly, when ethanol or acetone gas is introduced, the following reaction may occur, respectively, [20,61]:
C 2 H 6 O ( g a s ) + 6 O ( a d s )   2 C O 2 + 3 H 2 O + 6 e ¯
C H 3 C O C H 3 + 8 O ( a d s ) 3 C O 2 + 3 H 2 O + 8 e ¯
During these reactions, the electrons are released back into the conduction band of the sensor. Their interaction with the holes implies a decrease in the charge carrier concentration on the surface of the sensor and, consequently, an increase in resistance [70].

4. Conclusions

In summary, this paper presents an in-depth study of the morphological, optical, and gas-sensing properties of the La0.67Ca0.2Ba0.13Fe0.97M0.03O3 (M = Ti4+, Cr3+, and Mn3+) nanoparticle oxides which were prepared using the auto-combustion method. The analysis of TEM images shows the nanoscale of all samples with particle sizes equal to 36, 31, and 41 nm for Mn, Ti, and Cr-doped compounds, respectively. The optical study shows semiconductor behavior for all studied compounds. Based on Tauc plots, the band gap values were found to be equal to 2.57, 2.50, and 1.22 eV for Cr, Ti, and Mn-doped samples, respectively. Moreover, all compounds exhibit an optimum operating temperature equal to 200 °C for ethanol and acetone gas detection, which is lower than values in the literature for p-type MOX sensors. Compared to other studied compounds, the La0.67Ca0.2Ba0.13Fe0.97Ti0.03O3 compound presents the highest response values to low concentrations of ethanol and acetone gases at 200 °C, confirming its utility for p-type MOX sensor manufacturing. Also, the La0.67Ca0.2Ba0.13Fe0.97Mn0.03O3 compound presents the lowest response and recovery time values (<37 s).

Author Contributions

Conceptualization, B.F.O.C. and A.B.; methodology, B.F.O.C.; validation, B.F.O.C., A.B., J.P., J.W., N.A. and R.D.; formal analysis, A.D., H.S. and A.B.; investigation, A.D., S.R.G., L.P. and J.P.; resources, B.F.O.C. and J.W.; writing—original draft preparation, A.D., H.S. and A.B.; writing—review and editing, A.B., J.P. and B.F.O.C.; supervision, B.F.O.C.; funding acquisition, B.F.O.C. and J.P. All authors have read and agreed to the published version of the manuscript.

Funding

This work was supported by national funds from FCT—Fundação para a Ciência e a Tecnologia, I.P.—within the projects UIDB/04564/2020 (accessed on 1 January 2020) and UIDP/04564/2020 (accessed on 1 January 2020).

Data Availability Statement

The original contributions presented in the study are included in the article, further inquiries can be directed to the corresponding author.

Acknowledgments

Access to the TAIL-UC facility funded under QREN-Mais Centro Project No. ICT_2009_02_012_1890 is gratefully acknowledged. S. R. Gavinho acknowledges FCT for the funding through the program SFRH/BD/148233/2019. J. Pina acknowledges FCT for the funding through the program CEEC-INST/00152/2018/CP1570/CT0012 (https://doi.org/10.54499/CEECINST/00152/2018/CP1570/CT0012) accessed on 15 December 2023.

Conflicts of Interest

There are no conflicts of interest.

References

  1. Clements, A.L.; Griswold, W.G.; RS, A.; Johnston, J.E.; Herting, M.M.; Thorson, J.; Collier-Oxandale, A.; Hannigan, M. Low-Cost Air Quality Monitoring Tools: From Research to Practice (A Workshop Summary). Sensors 2017, 17, 2478. [Google Scholar] [CrossRef]
  2. Willett, M. Oxygen Sensing for Industrial Safety—Evolution and New Approaches. Sensors 2014, 14, 6084. [Google Scholar] [CrossRef] [PubMed]
  3. Khan, M.A.H.; Rao, M.V.; Li, Q. Recent Advances in Electrochemical Sensors for Detecting Toxic Gases: NO2, SO2 and H2S. Sensors 2019, 19, 905. [Google Scholar] [CrossRef] [PubMed]
  4. Liu, J.; Han, T.; Sun, B.; Kong, L.; Jin, Z.; Huang, X.; Liu, J.; Meng, F. Catalysis-Based Cataluminescent and Conductometric Gas Sensors: Sensing Nanomaterials, Mechanism, Applications and Perspectives. Catalysts 2016, 6, 210. [Google Scholar] [CrossRef]
  5. Zuruzi, S.; MacDonald, N.C. Facile Fabrication and Integration of Patterned Nanostructured TiO2 for Microsystems Applications. Adv. Funct. Mater. 2005, 15, 396. [Google Scholar] [CrossRef]
  6. Gibson, D.; MacGregor, C. A Novel Solid State Non-Dispersive Infrared CO2 Gas Sensor. Sensors 2013, 13, 7079. [Google Scholar] [CrossRef] [PubMed]
  7. Pijolat, C.; Pupier, C.; Sauvan, M.; Tournier, G.; Lalauze, R. Gas detection for automotive pollution control. Sens. Actuators B Chem. 1999, 59, 195–202. [Google Scholar] [CrossRef]
  8. Degler, D.; Barz, N.; Dettinger, U.; Peisert, H.; Chasse, T.; Weimar, U.; Barsan, N. Extending the toolbox for gas sensor research: Operando UV/vis diffuse reflectance, spectroscopy on SnO2-based gas sensors. Sens. Actuators B Chem. 2016, 224, 256–259. [Google Scholar] [CrossRef]
  9. Jildeh, Z.B.; Kirchner, P.; Oberlander, J.; Kremers, A.; Wagner, T.; Wagner, P.H.; Schöning, M.J. FEM-based modeling of a calorimetric gas sensor for hydrogen peroxide monitoring. Phys. Status Solidi 2017, 214, 1600912. [Google Scholar] [CrossRef]
  10. Yoo, R.; Güntner, A.T.; Park, Y.; Rim, H.J.; Lee, H.-S.; Lee, W. Sensing of acetone by Al-doped ZnO. Sens. Actuators B Chem. 2019, 283, 107–115. [Google Scholar] [CrossRef]
  11. Farida, A.A.; Rasmita, N.; Achary, P.G.R.; Mishra, D.K.; Sahoo, S.K.; Singh, U.P.; Nanda, B. Facile synthesis of porous LaFeO3 hexagons for acetone sensing. Mater. Today Proc. 2023, 74, 993–1001. [Google Scholar] [CrossRef]
  12. Righettoni, M.; Amann, A.; Pratsinis, S.E. Breath analysis by nanostructured metal oxides as chemo-resistive gas sensors. Mater. Today 2015, 18, 163–171. [Google Scholar] [CrossRef]
  13. Sharma, B.; Karuppasamy, K.; Vikraman, D.; Jo, E.B.; Sivakumar, P.; Kim, H.S. Porous, 3D-hierarchical α-NiMoO4 rectangular nanosheets for selective conductometric ethanol gas sensors. Sens. Actuators B Chem. 2021, 347, 130615. [Google Scholar] [CrossRef]
  14. Nie, Q.; Zhang, W.; Wang, L.; Guo, Z.; Li, C.; Yao, J.; Li, M.; Wu, D.; Zhou, L. Sensitivity enhanced, stability improved ethanol gas sensor based on multi-wall carbon nanotubes functionalized with Pt-Pd nanoparticles. Sens. Actuators B Chem. 2018, 270, 140–148. [Google Scholar] [CrossRef]
  15. Chen, Y.; Zhang, Y.; Zhang, H.Y.; Chen, C. Design and evaluation of Cu-modified ZnO microspheres as a high-performance formaldehyde sensor based on density functional theory. Appl. Surf. Sci. 2020, 523, 147446. [Google Scholar] [CrossRef]
  16. Dutt, M.; Ratan, A.; Tomar, M.; Gupta, V.; Singh, V. Mesoporous metal oxide-α-Fe2O3 nanocomposites for sensing formaldehyde and ethanol at room temperature. J. Phys. Chem. Solids 2020, 145, 109536. [Google Scholar] [CrossRef]
  17. Li, Y.W.; Luo, N.; Sun, G.; Zhang, B.; Ma, G.Z.; Jin, H.H. Facile synthesis of ZnFe2O4/α-Fe2O3 porous microrods with enhanced TEA-sensing performance. J. Alloys Compd. 2018, 737, 255–262. [Google Scholar] [CrossRef]
  18. Han, B.Q.; Wang, J.H.; Yang, W.Y.; Chen, X.W.; Wang, H.R.; Chen, J.L. Hydrothermal synthesis of flower-like In2O3 as a chemiresistive isoprene sensor for breath analysis. Sens. Actuators B Chem. 2020, 309, 127788. [Google Scholar] [CrossRef]
  19. Yang, M.; Lu, J.Y.; Wang, X.; Zhang, H.; Chen, F.; Sun, J.B.; Yang, J.; Sun, Y.; Lu, G. Acetone sensors with high stability to humidity changes based on Ru-doped NiO flower-like microspheres. Sens. Actuators B Chem. 2020, 313, 127965. [Google Scholar] [CrossRef]
  20. Qiao, X.R.; Ma, C.; Chang, X.; Li, X.F.; Li, K.; Zhu, L.; Xia, F.; Xue, Q. 3D radial Co3O4 nanorod cluster derived from cobalt-based layered hydroxide metal salt for enhanced trace acetone detection. Sens. Actuators B Chem. 2021, 327, 128926. [Google Scholar] [CrossRef]
  21. Available online: https://pdf.directindustry.com/pdf/alphasense/p-type-metal-oxidesensor-overview/16860-704756.html (accessed on 15 December 2023).
  22. Moumen, A.; Kumarage, G.C.W.; Comini, E. P-Type Metal Oxide Semiconductor Thin Films: Synthesis and Chemical Sensor Applications. Sensors 2022, 22, 1359. [Google Scholar] [CrossRef] [PubMed]
  23. Barsan, N.; Weimar, U. Conduction Model of Metal Oxide Gas Sensors. J. Electroceramics 2001, 7, 143–167. [Google Scholar] [CrossRef]
  24. Xu, H.; Xu, J.; Li, H.; Zhang, W.; Zhang, Y.; Zhai, Z. Highly sensitive ethanol and acetone gas sensors with reduced working temperature based on Sr-doped BiFeO3 nanomaterial. J. Mater. Res. Technol. 2022, 17, 1955–1963. [Google Scholar] [CrossRef]
  25. Jamnani, S.R.; Moghaddam, H.M.; Leonardi, S.G.; Neri, G.; Ferlazzo, A. VOCs sensing properties of samarium oxide nanorods. Ceram. Int. 2024, 50, 403–411. [Google Scholar] [CrossRef]
  26. Jiang, B.; Zhou, T.; Zhang, L.; Yang, J.; Han, W.; Sun, Y.; Liu, F.; Sun, P.; Zhang, H.; Lu, G. Separated detection of ethanol and acetone based on SnO2-ZnO gas sensor with improved humidity tolerance. Sens. Actuators B Chem. 2023, 393, 134257. [Google Scholar] [CrossRef]
  27. Liua, T.; Xu, Y. Synthesis of nanocrystalline LaFeO3 powders via glucose sol–gel route. Mater. Chem. Phys. 2011, 129, 1047. [Google Scholar] [CrossRef]
  28. Zhu, C.; Nobuta, A.; Nakatsugawa, I.; Akiyama, T. Solution combustion synthesis of LaMO3 (M = Fe, Co, Mn) perovskite nanoparticles and the measurement of their electrocatalytic properties for air cathode. Int. J. Hydrogen Energy 2013, 38, 13238. [Google Scholar] [CrossRef]
  29. Qin, J.; Cui, Z.D.; Yang, X.J.; Zhu, S.L.; Li, Z.Y.; Liang, Y.Q. Three-dimensionally ordered macroporous La1−xMgxFeO3 as high-performance gas sensor to methanol. J. Alloys Compd. 2015, 635, 194. [Google Scholar] [CrossRef]
  30. Suhendi, E.; Ulhakim, M.T.; Setiawan, A.; Syarif, D.G. The Effect of SrO Doping on LaFeO3 using Yarosite Extraction based Ethanol Gas Sensors Performance Fabricated by Coprecipitation Method. Int. J. Nanoelectron. Mater. 2019, 12, 185. [Google Scholar]
  31. Benali, A.; Bejar, M.; Dhahri, E.; Graça, M.P.F.; Valente, M.A.; Radwan, A. High ethanol gas sensing property and modulation of magnetic and AC-conduction mechanism in 5% Mg-doped La0.8Ca0.1Pb0.1FeO3 compound. J. Mater. Sci. Mater. Electron. 2019, 30, 12389. [Google Scholar] [CrossRef]
  32. Song, P.; Qin, H.; Zhang, L.; Liu, X.; Huang, S.; Hu, J.; Jiang, M. Electrical and CO gas-sensing properties of perovskite-type La0.8Pb0.2Fe0.8Co0.2O3 semiconductive materials. Physica B Condens. Matter. 2005, 368, 204. [Google Scholar] [CrossRef]
  33. Li, L.; Qin, H.W.; Shi, C.M.; Zhang, L.; Chen, Y.P.; Hu, J.F. CO2 sensing properties of La1−xBaxFeO3 thick film and packed powder sensors. RSC Adv. 2015, 5, 103073. [Google Scholar] [CrossRef]
  34. Gu, J.; Zhang, B.; Li, Y.; Xu, X.; Sun, G.; Cao, J.; Wang, Y. Synthesis of spindle-like Co-doped LaFeO3 porous microstructure for high performance n-butanol sensor. Sens. Actuators B Chem. 2021, 343, 130125. [Google Scholar] [CrossRef]
  35. Benali, E.M.; Benali, A.; Bejar, M.; Dhahri, E.; Khomchenko, V.A.; Peng, L.; Wu, J.; Costa, B.F.O. Structural, morphological and excellent gas sensing properties of La1−2xBaxBixFeO3 (0.00 ≤ x ≤ 0.20) nanoparticles. J. Alloys Compd. 2021, 883, 160856. [Google Scholar] [CrossRef]
  36. Li, F.; Wang, Z.F.; Wang, A.; Wu, S.M.; Zhang, L.J. N-type LaFe1−xMnxO3 prepared by sol-gel method for gas sensing. J. Alloys Compd. 2020, 816, 152647. [Google Scholar] [CrossRef]
  37. Ma, L.; Ma, S.Y.; Qiang, Z.; Xu, X.L.; Chen, Q.; Yang, H.M.; Chen, H.; Ge, Q.; Zeng, Q.Z.; Wang, B.Q. Preparation of Codoped LaFeO3 nanofibers with enhanced acetic acid sensing properties. Mater. Lett. 2017, 200, 47–50. [Google Scholar] [CrossRef]
  38. Ma, Z.; Yang, K.; Xiao, C.; Jia, L. C-doped LaFeO3 Porous Nanostructures for Highly Selective Detection of Formaldehyde. Sens. Actuators B Chem. 2021, 347, 130550. [Google Scholar] [CrossRef]
  39. Benali, E.M.; Benali, A.; Bejar, M.; Dhahri, E.; Graca, M.P.F.; Valente, M.A.; Sanguino, P.; Costa, B.F.O. Effect of annealing temperature on structural, morphological and dielectric properties of La0.8Ba0.1Ce0.1FeO3 perovskite. J. Mater. Sci. Mater. Electron. 2020, 31, 16220–16234. [Google Scholar] [CrossRef]
  40. Wu, J.; Gao, D.; Sun, T.; Bi, J.; Zhao, Y.; Ning, Z.; Fan, G.; Xie, Z. Highly selective gas sensing properties of partially inversed spinel zinc ferrite towards H2S. Sens. Actuators B Chem. 2016, 235, 258. [Google Scholar] [CrossRef]
  41. Peng, S.; Ma, M.; Yang, W.; Wang, Z.; Bi, J.; Wu, J. Acetone sensing with parts-per-billion limit of detection using a BiFeO3-based solid solution sensor at the morphotropic phase boundary. Sens. Actuators B Chem. 2020, 313, 128060. [Google Scholar] [CrossRef]
  42. Law, D.P.; Blakeney, A.B.; Tkachuk, R. The Kubelka–Munk Equation: Some Practical Considerations. J. Near Infrared Spectrosc. 1996, 4, 189–193. [Google Scholar] [CrossRef]
  43. Feng, J.; Liu, T.; Xu, Y.; Zhao, J.; He, Y. Effects of PVA content on the synthesis of LaFeO3 via sol–gel route. Ceram. Int. 2011, 37, 1203–1207. [Google Scholar] [CrossRef]
  44. Dhahri, A.; Moualhi, Y.; Henchiri, C.; Benali, A.; Sanguino, P.; Graça, M.P.F.; Valente, M.A.; Abdelmoula, N.; Rahmouni, H.; Costa, B.F.O. Study of structural properties and conduction mechanisms of La0.67Ca0.2Ba0.13Fe0.97Ti0.03O3 perovskite. Inorg. Chem. Commun. 2022, 140, 109435. [Google Scholar] [CrossRef]
  45. Smirnova, I.S. Normal modes of the LaMnO3 Pnma phase: Comparison with La2CuO4 Cmca phase. Physica B 1999, 262, 247–261. [Google Scholar] [CrossRef]
  46. Romero, M.; Gomez, R.W.; Marquina, V.; Perez-Mazariego, J.L.; Escamilla, R. Synthesis by molten salt method of the AFeO3 system (A = La, Gd) and its structural, vibrational and internal hyperfine magnetic field characterization. Physica B 2014, 443, 90–94. [Google Scholar] [CrossRef]
  47. Popa, M.; Frantti, J.; Kakihana, M. Lanthanum Ferrite LaFeO3+d nanopowders obtained by the polymerizable complex method. Solid State Ion. 2002, 154–155, 437–445. [Google Scholar] [CrossRef]
  48. Rachid, F.Z.; Omari, L.H.; Lassri, H.; Lemziouka, H.; Derkaoui, S.; Haddad, M.; Lamhasni, T.; Sajieddine, M. Synthesis, structural and optical properties of LaFe1−xCrxO3 nanoparticles. Opt. Mat. 2020, 109, 110332. [Google Scholar] [CrossRef]
  49. Saha, S.; Sinha, T.; Mookerjee, A. Electronic structure, chemical bonding, and optical properties of paraelectric BaTiO3. Phys. Rev. B 2000, 62, 8828. [Google Scholar] [CrossRef]
  50. Khan, M.T.; Shkir, M.; Almohammedi, A.; AlFaify, S. Fabrication and characterization of La doped PbI2 nanostructured thin films for opto-electronic applications. Solid State Sci. 2019, 90, 95–101. [Google Scholar] [CrossRef]
  51. Omari, L.H.; Lemziouka, H.; Haddad, M.; Lamhasni, T. Structural, optical and electrical properties of 0.97(PbTiO3)-0.03(LaFeO3) solid solutions. Mater. Today Proc. 2019, 13, 1205–1214. [Google Scholar] [CrossRef]
  52. Ganesh, V.; Haritha, L.; Anis, M.; Shkir, M.; Yahia, I.S.; Singh, A.; AlFaify, S. Structural, morphological, optical and third order nonlinear optical response of spin-coated NiO thin films: An effect of N doping. Solid State Sci. 2018, 86, 98–106. [Google Scholar] [CrossRef]
  53. Millis, A.J.; Zimmers, A.; Lobo, R.P.S.M.; Bontemps, N.; Homes, C.C. Mott physics and the optical conductivity of electron-doped cuprates. Phys. Rev. B 2005, 72, 224517. [Google Scholar] [CrossRef]
  54. Omari, L.H.; Lemziouka, H.; Moubah, R.; Haddad, M.; Lassri, H. Structural and optical properties of Fe-doped Ruddlesden-Popper Ca3Ti2−xFexO7−δ nanoparticles. Mat. Chem. Phys. 2020, 246, 122810. [Google Scholar] [CrossRef]
  55. Benali, A.; Azizi, S.; Bejar, M.; Dhahri, E.; Graça, M.F.P. Structural, electrical and ethanol sensing properties of double-doping LaFeO3 perovskite oxides. Ceram. Int. 2014, 40, 14367. [Google Scholar] [CrossRef]
  56. Smiy, S.; Bejar, M.; Dhahri, E.; Fiorido, T.; Aguir, K.; Bendahan, M. Preparation of double-doping LaFeO3 thin film for ethanol sensing application. J. Mol. Struct. 2022, 1267, 133543. [Google Scholar] [CrossRef]
  57. Xiang, J.; Chen, X.; Zhang, X.; Gong, L.; Zhang, Y.; Zhang, K. Preparation and characterization of Ba-doped LaFeO3 nanofibers by electrospinning and their ethanol sensing properties. Mater. Chem. Phys. 2018, 213, 122. [Google Scholar] [CrossRef]
  58. Ambardekar, V.; Bandyopadhyay, P.P.; Majumder, S.B. Understanding on the ethanol sensing mechanism of atmospheric plasma sprayed 25 wt. % WO3-75 wt. % SnO2 coating. Sens. Actuators B Chem. 2019, 290, 414–425. [Google Scholar] [CrossRef]
  59. Li, F.; Gao, X.; Wang, R.; Zhang, T. Design of WO3-SnO2 core-shell nanofibers and their enhanced gas sensing performance based on different work function. Appl. Surf. Sci. 2018, 442, 30–37. [Google Scholar] [CrossRef]
  60. Malik, R.; Tomer, V.K.; Chaudhary, V.; Dahiya, M.S.; Nehra, S.P.; Rana, P.S.; Duhan, S. Ordered mesoporous In-(TiO2/WO3) nanohybrid: An ultrasensitive n-butanol sensor. Sens. Actuators B Chem. 2017, 239, 364–373. [Google Scholar] [CrossRef]
  61. Murade, P.A.; Sangawar, V.S.; Chaudhari, G.N.; Kapse, V.D.; Bajpeyee, A.U. Acetone gas-sensing performance of Sr-doped nanostructured LaFeO3 semiconductor prepared by citrate sol–gel route. Curr. Appl. Phys. 2011, 11, 451–456. [Google Scholar] [CrossRef]
  62. Zhang, L.; Qin, H.; Song, P.; Hu, J.; Jiang, M. Electric properties and acetone-sensing characteristics of La1−xPbxFeO3 perovskite system. Mater. Chem. Phys. 2006, 8, 358–362. [Google Scholar] [CrossRef]
  63. Zhang, Y.M.; Zhang, J.; Chen, J.L.; Zhu, Z.Q.; Liu, Q.J. Improvement of response to formaldehyde at Ag–LaFeO3 based gas sensors through incorporation of SWCNTs. Sens. Actuators B Chem. 2014, 195, 509–514. [Google Scholar] [CrossRef]
  64. Zeng, W.; Liu, T.M.; Liu, D.J. Formaldehyde gas sensing property and mechanism of TiO2–Ag nanocomposite. Physica B 2010, 405, 4235–4239. [Google Scholar] [CrossRef]
  65. Kim, H.J.; Lee, J.H. Highly sensitive and selective gas sensors using p-type oxide semiconductors: Overview. Sens. Actuators B Chem. 2014, 192, 607. [Google Scholar] [CrossRef]
  66. Ding, J.-C.; Li, H.-Y.; Cai, Z.-X.; Wang, X.-X.; Guo, X. Near room temperature CO sensing by mesoporous LaCoO3 nanowires functionalized with Pd nanodots. Sens. Actuators B Chem. 2016, 222, 517. [Google Scholar] [CrossRef]
  67. Liu, X.; Cheng, B.; Hu, J.; Qin, H.; Jiang, M. Semiconducting gas sensor for ethanol based on LaMgxFe1−xO3 nanocrystals. Sens. Actuators B Chem. 2008, 129, 53. [Google Scholar] [CrossRef]
  68. Liu, X.; Cheng, B.; Qin, H.; Song, P.; Huang, S.; Zhang, R.; Hu, J.; Jiang, M. Preparation, electrical and gas-sensing properties of perovskite-type La1−xMgxFeO3 semiconductor materials. Phys. Chem. Solids 2007, 68, 511. [Google Scholar] [CrossRef]
  69. Xiangfeng, C.; Xingqin, L.; Guangyao, M. Effects of CdO dopant on the gas sensitivity properties of ZnFe2O4 semiconductors. Sens. Actuators B Chem. 2000, 65, 64. [Google Scholar] [CrossRef]
  70. Balamurugan, C.; Lee, D.W. Perovskite hexagonal YMnO3 nanopowder as p-type semiconductor gas sensor for H2S detection. Sens. Actuators B Chem. 2015, 221, 857. [Google Scholar] [CrossRef]
Figure 1. Schematic diagram of the gas-sensing measurement system.
Crystals 14 00173 g001
Figure 2. (ac) TEM micrographs and the corresponding histogram plots with the Lorentzian fitting of the particle size distribution of the La0.67Ca0.2Ba0.13Fe0.97M0.03O3 (M = Ti4+, Mn3+, and Cr3+) compounds, respectively.
Crystals 14 00173 g002aCrystals 14 00173 g002b
Figure 3. Raman spectra of the La0.67Ca0.2Ba0.13Fe0.97M0.03O3 (M = Ti4+, Cr3+, and Mn3+) compounds.
Crystals 14 00173 g003
Figure 4. Lorentzian fitting curves of the Raman signal of the La0.67Ca0.2Ba0.13Fe0.97M0.03O3 (M = Cr3+, and Mn3+) compounds.
Crystals 14 00173 g004aCrystals 14 00173 g004b
Figure 5. (a) Diffuse reflectance spectroscopy measurements; the inset presents a Tauc plot for La0.67Ca0.2Ba0.13Fe0.97M0.03O3 (M = Ti4+, Cr3+, and Mn3+) samples; (b) the reflectance spectra of the studied samples.
Crystals 14 00173 g005
Figure 6. The variation in refractive index as a function of wavelength for La0.67Ca0.2Ba0.13Fe0.97M0.03O3 (M = Ti4+, Cr3+, and Mn3+) samples.
Crystals 14 00173 g006
Figure 7. Variation of (a) reel and (b) imaginary parts of dielectric constants as a function of wavelength for La0.67Ca0.2Ba0.13Fe0.97M0.03O3 (M = Ti4+, Cr3+, and Mn3+) samples.
Crystals 14 00173 g007
Figure 8. Variation in (a) optical and (b) electrical conductivity as a function of wavelength for La0.67Ca0.2Ba0.13Fe0.97M0.03O3 (M = Ti4+, Cr3+, and Mn3+) samples.
Crystals 14 00173 g008
Figure 9. (a) Response vs. temperature; (b) transient response of La0.67Ca0.2Ba0.13Fe0.97B0.03O3 (B = Ti4+, Mn3+, and Cr3+)-based sensors exposed to different ethanol gas concentrations at an operating temperature of 200 °C; (c) response vs. concentrations towards ethanol gas; and (d) the response and recovery time of the La0.67Ca0.2Ba0.13Fe0.97B0.03O3 (B = Ti4+, Mn3+, and Cr3+) gas sensors to 100 ppm.
Crystals 14 00173 g009
Figure 10. (a) Response vs. temperature; (b) transient response of La0.67Ca0.2Ba0.13Fe0.97B0.03O3 (B = Ti4+, Mn3+, and Cr3+)-based sensors exposed to different acetone gas concentrations at an operating temperature of 200 °C; (c) response vs. concentrations towards acetone gas; and (d) the response and recovery time of the La0.67Ca0.2Ba0.13Fe0.97B0.03O3 (B = Ti4+, Mn3+, and Cr3+) gas sensors to 100 ppm.
Crystals 14 00173 g010
Table 1. The response towards ethanol and acetone gases in the studied materials (this work) compared with the literature results.
SensorSCg (ppm)Topr (°C)Reference
WO3–SnO2 composite1.73300 (ethanol)250[58]
Core–shell WO3–SnO2 nanofibers5.0910 (ethanol)280[59]
NiO nanosheets4.09500 (ethanol)200[60]
LaFeO3 (Sol-gel)0.55500 (acetone)275[61]
La0.7Sr0.3FeO3 (Sol-gel)0.7
La0.68Pb0.32FeO3 (Sol-gel)507240[62]
La0.67Ca0.2Ba0.13Fe0.97Ti0.03O33.915 (ethanol)200This work
3.825 (acetone)250
Cg: gas concentration; S: response; Topr: optimum operating temperature.
Table 2. Recovery and response times of all La0.67Ca0.2Ba0.13Fe0.97M0.03O3 (M = Ti4+, Mn3+, and Cr3+) compounds when exposed to ethanol and acetone gases.
GasTimeM = Ti4+M = Mn3+M = Cr3+
EthanolResponse time40.7437.3928.84
Recovery time43.6726.3548.03
AcetoneResponse time50.3957.38745.549
Recovery time56.3249.34759.739
Disclaimer/Publisher’s Note: The statements, opinions and data contained in all publications are solely those of the individual author(s) and contributor(s) and not of MDPI and/or the editor(s). MDPI and/or the editor(s) disclaim responsibility for any injury to people or property resulting from any ideas, methods, instructions or products referred to in the content.

