
Thermodynamics of Iron Ammonia Synthesis Catalyst Sintering

1
Department of Inorganic Chemical Technology and Environment Engineering, Faculty of Chemical Technology and Engineering, West Pomeranian University of Technology in Szczecin, Piastów Ave. 42, 71-065 Szczecin, Poland
2
Grupa Azoty Zakłady Chemiczne “Police” S.A., 1 Kuźnicka Str., 72-010 Police, Poland
*
Author to whom correspondence should be addressed.
Crystals 2024, 14(2), 188; https://doi.org/10.3390/cryst14020188
Submission received: 14 December 2023
/
Revised: 7 February 2024
/
Accepted: 10 February 2024
/
Published: 13 February 2024
Abstract
:The sintering of iron ammonia synthesis catalysts (nanocrystalline iron promoted with: Al2O3, CaO and K2O) was studied under a hydrogen atmosphere, in a temperature range of 773 to 973 K to obtain stationary states. The catalysts were characterized by measuring the nitriding reaction rate under an ammonia atmosphere at 748 K to obtain steady states and the measurement of specific surface area. Chemical processes were conducted in a tubular differential reactor enabling thermogravimetric measurements and the chemical composition analysis of a gas phase under conditions allowing experiments to be carried out in the kinetic region of chemical reactions. An extended model of the active surface of the iron ammonia synthesis catalyst was presented, taking into account the influence of the gas phase composition and process temperature. The surface of iron nanocrystallites was wetted using promoters in an exothermic process associated with the formation of the surface Fes-O- bond and the change in the surface energy of iron nanocrystallites. Promoters formed on the surface of iron nanocrystallites with different structures of chemisorbed dipoles, depending on the composition of the gas phase. The occupied sites stabilized the structure, and the free sites were active sites in the process of adsorption of chemical reagents and in sintering. Based on the bonding energy of the promoter oxides and the difference in surface energy between the covered and uncovered surfaces, the wetting abilities of promoters, which can be arranged according to the order K2O > Fe3O4 > Al2O3 > CaO, were estimated. By increasing the temperature in the endothermic sintering process, the degree of surface coverage with dipoles of promoters decreased, and thus the catalyst underwent sintering. The size distribution of nanocrystallites did not change with decreasing temperature. Only the equilibrium between the glass phase and the surface of iron nanocrystallites was then established.
1. Introduction
Despite the expectation that nanocrystalline materials will be widely used because of their unique properties compared to coarsely crystalline materials, the use of the former is limited because it is believed that the structure of nanomaterials with a developed surface is unstable at elevated temperatures [1,2,3,4,5,6]. The theoretical foundations regarding the growth kinetics of nanocrystallites in the sintering process were presented about 70 years ago by Smith [7], Burke [8] and Burke and Turnbull [9].
The sintering of nanomaterials is a technologically important process and has been studied by both experimental researchers [10,11,12,13] and those conducting model works [14,15,16,17]. First of all, various kinetic aspects of the sintering process related to the change in the structure of nanomaterials and the growth of nanoparticles were examined [6,18,19,20,21]. To describe the sintering process, the concept of residual dispersion was introduced [22]. However, there are durable nanomaterials that retain their three-dimensional structure and developed surface for a long time (even over a dozen years), regardless of the operating conditions, including those promoting the sintering process of nanocrystallites. An industrial iron catalyst for ammonia synthesis with a developed specific surface area is an example. Long operation of this catalyst at temperatures greater than 773 K and pressure up to 20 MPa causes only a slight loss of its activity [23,24,25]. A comprehensive study containing an overview of sintering and related phenomena information published until 2017 is presented in a monograph [26].
The iron catalyst for ammonia synthesis is obtained by reducing alloys of iron oxides with hardly reducible oxides of the promoters K2O, Al2O3 and CaO. The promoters located in three-dimensional spaces constitute a glassy phase that contains disordered components in the form of oxygen and promoter metal ions. It is a solution from which components diffuse and adsorb onto the iron surface. The size of iron nanocrystallites depends on the chemical composition of the solid phase and the conditions of the reduction process (chemical composition of the gas phase, temperature) [27]. To investigate the process of sintering, measurements were performed both during the reduction at 773 K as well as annealing of catalyst above a temperature of 773 K up to 993 K until the steady states were reached [28]. An increase in temperature caused a decrease in the catalyst specific surface area, while at the same time, iron nanocrystallite mean size increased. Based on the kinetic measurements of the overheating process of this catalyst, equations describing the kinetics of iron nanocrystallite sintering were proposed, determining the activation energy and the rate constant of this process [22,28,29].
Since the development of the method of iron catalyst preparation, this substance has been studied in detail, taking into account phenomena in the field of heterogeneous catalysis [23,30,31,32,33,34,35,36,37,38,39,40]. The catalyst is also used as a model catalyst for the study of surface phenomena [32,34,35,36,37,41,42,43,44,45,46,47].
The development of research techniques in the middle of the last century enabled the use of various methods to study phenomena occurring on model, clean surfaces of metal single crystals with a particular emphasis on the processes related to the reaction of ammonia synthesis [35,36,41,42,43,44,45,48,49]. It was found that the sticking coefficient of nitrogen for different iron surfaces and the ability to reconstruct the surface of iron decreased with increasing density of iron atoms packed at the surfaces (111), (100) and (110) [37,43]. The results of Ertl’s studies [45] showed that potassium, as an activating promoter in the synthesis of ammonia, increased the activity of the iron surface regardless of its crystallographic structure.
Strongin and Somorjai suggested the possibility of (Al2O3 + H2O)-induced [50] and ammonia-induced [51] surface restructuring of iron single crystals. Surface development of the iron nanocrystallites depends upon the amount of oxygen bound with their surface. The amount of oxygen atoms varies according to the kind of promoter wetting the iron surface [52].
Studies of the phenomena occurring on the (111) surface of an iron single crystal as a model system of α-Fe/O/S/K [53,54,55] and studies on the activity of iron catalyst were also undertaken. These studies led to a model of the surface active in ammonia synthesis, where potassium atoms are stabilized at the iron surface by oxygen atoms located under potassium atoms (double layer model) [56]. In the layer of oxygen atoms, there are free adsorption sites (of redox type) capable of the chemisorption of the nitrogen molecules between potassium atoms. The presence of free iron atoms on the surface results from the geometrical reasons: a potassium ion with its large radius (219 pm) can occupy, along with an oxygen atom, only every other iron site [56]. It was shown that other oxides (structuring promoters of the catalyst) wet the total surface of the catalyst with a “double layer” [56] (2D structure) and can also form bridges between iron nanocrystallites (3D structure) [52,56]. The surface reconstruction of iron ammonia catalyst may also be proposed with the conceptual double layer model [56,57].
Already in the 1990s, it was hypothesized [52,56,57,58] that the structure of nanomaterials should be regarded as a result of setting up a thermodynamic equilibrium between the surface and volume of nanocrystallites and components located in spaces between nanocrystallites, when diffusion does not limit the mass transfer rate due to the high process temperature. Based on the above statements, the energy balance of the two-component nanocrystalline system was developed and theoretical model calculations were carried out [24,59,60]. It was shown that multi-component nanomaterials with a developed surface can be in a state of chemical equilibrium.
Based on the above statements, the phenomena related to phase transformations in the formation and reduction of iron nitrides in the ncFe/NH3/H2 system [59,60,61,62,63,64,65,66,67] were interpreted. In the nanocrystalline iron nitriding process, stationary states were identified [68], in which catalytic ammonia decomposition rate, rd = const, the rate of nitriding reaction, rn = 0 and the maximum conversion, mn, of nanocrystalline material was a function of temperature and nitriding potential, P = pNH3/pH23/2 (pNH3, pH2—partial pressures of ammonia and hydrogen), of the gas phase. The phenomenon of hysteresis was demonstrated [62] based on the example of nanocrystalline iron nitriding and iron nitride reduction reactions conducted under conditions close to chemical equilibrium. It was observed that the nitriding potential during the nitriding process was greater than during the reduction process. In both processes, nanocrystallites react in the order according to their size of active specific surfaces from small to large [59,60].
In the model of the surface double layer presented in previous works, the maximum and constant coverage of iron nanocrystallite surfaces with promoter oxides under vacuum conditions was assumed, taking into account the geometric aspects related to the sizes of the 2D structure components. The aim of the present work was to generalize the description of the thermodynamics of the sintering process of nanocrystalline metals and to modify, supplement and generalize the described model, taking into account changes in the composition of the gas phase and the degree of wetting of the nanocrystalline metal surface with promoters depending on the temperature.
2. Experiment
The iron ammonia synthesis catalyst in a pre-reduced form, KM1R (manufactured by Haldor Topsoe Company, Denmark), was studied. The catalyst’s sample chemical composition was determined using the inductively coupled plasma method (ICP-OES, spectrometer Perkin Elmer, type Optima 5300DV, Perkin Elmer, Woodbridge, Ontario, Canada). It was determined that the catalyst, apart from metallic iron, contained promoters (3.3 wt% Al2O3, 2.8 wt% CaO, 0.7 wt% K2O).
The processes that form the sample structure (heating the catalyst under reducing conditions) and the chemical reactions studied (reducing the passive layer of the catalyst, nitriding) were conducted in a tubular differential reactor enabling thermogravimetric measurements (accuracy of 1·10−4 g) and the analysis of the chemical composition of the gas phase (based on the gas-phase hydrogen concentration measurements performed with an accuracy of 0.02 vol. %) [69]. Gas samples were taken from points located in the direct surroundings of the catalyst bed and introduced to the katharometric analyzer (constructed and built using our own resources and certified by external authorities). Based on a reactor mass balance, an ammonia concentration in the gas phase was estimated. Flow rates of gaseous reactant were controlled using electronic mass flowmeters. Samples weighing approximately about 1 g characterized by grain size in the range of 1.0–1.2 mm were placed as a single layer of grains in a platinum sample holder in the form of a basket connected to the thermobalance measuring system. In such a measurement system, the conditions for the process taking place in the kinetic reaction region were met.
During the reduction of the catalyst passive layer, the temperature of the reactor was increased to 773 K at the rate of 10 °C min−1 and hydrogen flow of 150 cm3 min–1. At 773 K, the weight of the catalyst was constant (it did not change even after increasing the process temperature).
In the first series of measurements, the catalyst sample was sequentially annealed at temperatures of 823 K, 873 K, 923 K and 973 K for ca. 17 h in hydrogen and nitrided at 748 K (after annealing at each above-mentioned temperature) with ammonia (200 cm3 min−1 with 100% of ammonia at the reactor inlet) until the nitride phase γ′-Fe4N was obtained. After the last cycle and sample reduction, the specific surface area was measured using a volumetric method (using the Brunnauer–Emmet–Teller (BET) equation; automated apparatus AutoChem II 2920, Micromeritrics, Norcross, GA, USA).
In the second series of measurements, the above-mentioned processes were carried out periodically in the same way. After each annealing, nitriding and reduction of the sample, the specific surface area was measured using the BET method.
To verify the stability of the sample structure, the samples were overheated in a hydrogen atmosphere at the temperature of 973 K for 17 h and subsequently tempered for 50 h at 748 K. After analyzing the measurement results of the specific surface area, it was concluded that after establishing the structure at higher temperatures, it did not change at lower temperatures. The process of structure formation at higher temperatures was irreversible by reducing the temperature.
To assess the morphological properties of the obtained samples, transmission electron microscopy (TEM, Tecnai F30 with a field emission gun operating at 200 kV, Thermo Fisher Scientific, Waltham, MA, USA) was used.
3. Results
Figure 1 presents some exemplary results of the measurement of nitrogen concentration by volume of the catalyst sample, xNb, in the process of nitriding with ammonia at 748 K of iron catalyst reduced in hydrogen at 773 K. Vertical lines indicate the times t1 and t2, at which the α → γ′ phase transformation of iron nanocrystallites with the smallest and the largest sizes, respectively, took place.
The probability density function (PDF) distribution of the specific surface, S, of iron nanocrystallites, was determined based on the measurement of the catalyst nitriding reaction rate presented elsewhere [70]. In the case of an iron catalyst, this distribution is characterized by the sum of two Gaussian distributions.
The specific surface area measurement results regarding samples reduced and overheated at different temperatures are shown in Figure 2.
Measured specific surface area can be defined as a relation of the moles of covered, nFe(MexO)s, and uncovered, nFes, surface atoms to the sum of moles of atoms in the nanocrystallite:
where nFeb—moles of atoms in the volume of nanocrystallites, the constant, ζ = {(S/V)∙1/ρ} (ρ is the density in g∙cm−3), is dependent on the substance; for iron, ζ = 0.45 m2 g−1.
Active specific surface area, A, can be defined as a relation of the moles of uncovered surface atoms to the sum of moles of atoms in the nanocrystallite, which is approximately equal to the maximum concentration of surface iron atoms, xFes,max:
For single nanocrystallites, specific (total and active) surfaces can be represented as total surfaces and active surfaces related to the volume of single nanocrystallites, and therefore, their dimension is nm2/nm3 = nm−1.
Figure 3 shows exemplary results of microscopic tests using the TEM technique for a reference sample—reduced and annealed at a temperature of 773 K.
Measurements were performed for all tested samples. It was observed that the largest nanocrystallites did not change (they were approximately 90 nm in diameter; see Figure 3b). However, the smallest nanocrystallites changed from approximately 20 nm for the sample annealed at 773 K (Figure 3a) to almost 40 nm for the sample annealed at 973 K. A similar result was obtained in [71]. The size range of iron nanocrystallites measured for a sample of an identical catalyst reduced and heated at 773 K, determined using scanning electron microscopy, was 20–80 nm.
4. Discussion
In [28] identical samples of iron catalyst were tested. The results of measurements of the specific surface area (determined using the BET equation) and the average size of nanocrystallites (determined using the Scherrer equation) are presented in Table 1.
After converting the average nanocrystallite size values calculated using the Scherrer equation into values calculated using the Rietveld method, the following were obtained: 45.0, 48.6, 51.3, 59.4 and 64.8 nm. Based on the similarity of the current measurement results and those contained in [28], this study correlated the obtained surface area values with previous measurement results of the average size of iron nanocrystallites after their conversion. This seems justified, especially after taking into account the microscopic measurements of the size ranges of iron nanocrystallites. These measurements indicate that there is a correlation between both the specific surface areas and the average sizes of nanocrystallites for the samples tested previously and currently.
The morphology of nanomaterials may be the result of establishing the thermodynamic equilibrium between the surface and volume of nanocrystallites and the components located in the spaces between the nanocrystallites (Figure 4a) [24]. Based on studies in the nanocrystalline-Fe(Al2O3, CaO, K2O) system under ultrahigh vacuum conditions, a surface model was presented [56], according to which the surface of nanocrystalline iron is fully wetted with a double layer of atoms, where the promoter ion is bound to the surface through the oxygen ion (Figure 4(bI)). This hypothesis has been used in the interpretation of phenomena occurring on the surface of iron catalyst [24,59,60,67,71,72]. It was found in [53,73,74] that oxygen may be present on the iron surface in a hydrogen atmosphere. At 470 K under vacuum conditions, potassium desorbs from the iron surface [52,74]. The potassium ion is stably bound to the iron surface in the presence of oxygen [52,53,73,74].
In an atmosphere of hydrogen, calcium and aluminum oxides wetting the iron surface form functional groups of acidic (Fes-O-Al-(OH)2) or basic (Fes-O-Ca-O-H) nature (Figure 4(bII)).
In nanocrystalline multicomponent materials, nanocrystallites may be in a state of chemical equilibrium when the enthalpy of bond formation on the surface of these two components, ΔHwet, is equal to the enthalpy of dispersion, ΔHdisp [24]:
ΔHwet + ΔHdisp = 0
By increasing the temperature from T1 to T2, the solubility of oxygen, chemisorbed on the iron surface, in the iron volume, increases, and thus decreases the concentration of functional groups Fes-O-Me [74]. Increasing the concentration of free surface iron atoms Fes- leads to the establishment of a new equilibrium state, in which nanocrystallites increase in size (Figure 4(bIII)). Sintering of a nanocrystallite can be considered as an adiabatic, isobaric and isosteric process [24,59]. There is no nanocrystallite mass and energy exchange with the surroundings.
The wetting phenomenon of the iron surface can be regarded as the sum of the sublimation effect, H*form, from the 3D phase of the promoter oxide and its adsorption on the iron surface, Hads, taking into account the change in the surface energy of the iron nanocrystallite, (HFes − HFe(MexO)s). If we take as the reference catalyst, the iron catalyst reduced at 773 K, the change of enthalpy of the process of wetting the surface of nanocrystalline iron using promoters related to one surface bond can be written as:
ΔHwet = ΔH*form + ΔHads + (HFes − HFe(MexO)s)
The values of the surface energy of iron available in the literature show discrepancies [75]. On the basis of the experimental data included in [76], the value of the surface energy of the pure surface HFes = 90–92 kJ/mol for the temperature range 773–973 K was extrapolated. Assuming that the enthalpy of formation of the bond, Fes-O, is equal to the enthalpy of breaking the bond in Fe3O4, ΔHads = −140 kJ/mol.
The energy effects of the process of wetting the surface of iron using metal oxides can be assessed based on Equation (4), taking into account the energy balance and equations describing the thermodynamic equilibrium in the studied nanocrystalline system, the enthalpies of formation of appropriate promoter oxides and the maximum concentration of promoter dipoles on the surface of iron nanocrystallites (Table 2).
According to the estimated values of the enthalpy of wetting the iron surface using individual promoter oxides, taking into account the geometric aspects related to wetting the surface using potassium, [56] the surface promoter oxides can be ranked in the following order:
Fes-O-K > Fes-O-H > Fes-O-Al-(OH)2 > Fes-O-Ca-OH
The value of ΔHFe(MexO)s is not exactly known, but changing it will not change the order of the promoter dipoles in the series shown above.
It was stated in [58,77] that during the reduction of precursor in the preparation of the iron catalyst of ammonia synthesis, the nanostructure was first formed due to the presence of structure-forming promoters dissolved in the iron oxide phase. Then, potassium present in the intergranular spaces of the catalyst precursor [58,77] diffused to the surface of the already formed catalyst nanostructure, replacing the dipoles, containing aluminum and calcium, located there first. Thus, the series of promoter dipoles presented above justifies this mechanism of formation of the catalyst nanostructure and its active surface and explains the roles of promoters in the catalyst and its synthesis as well as their classical division.
Due to the larger size of potassium ions in relation to iron and oxygen ions, this dipole can occupy a maximum of 50% of the surface of iron nanocrystallites. The remaining iron atoms not covered by surface dipoles are active sites in the nano-Fe-N2-H2 system in the chemical reactions of ammonia synthesis and decomposition and in the sintering process.
Classically, a promoter found in the above row on the left-hand side of iron is called activating. Structure-forming promoters are located on the right-hand side of iron. The surface of iron nanocrystallites covered with potassium oxide is thermodynamically favored compared to other iron catalyst promoters. In [56,57], it was presented that promoters, considered electro-donating, also influenced the size of the specific surface area of the studied catalyst.
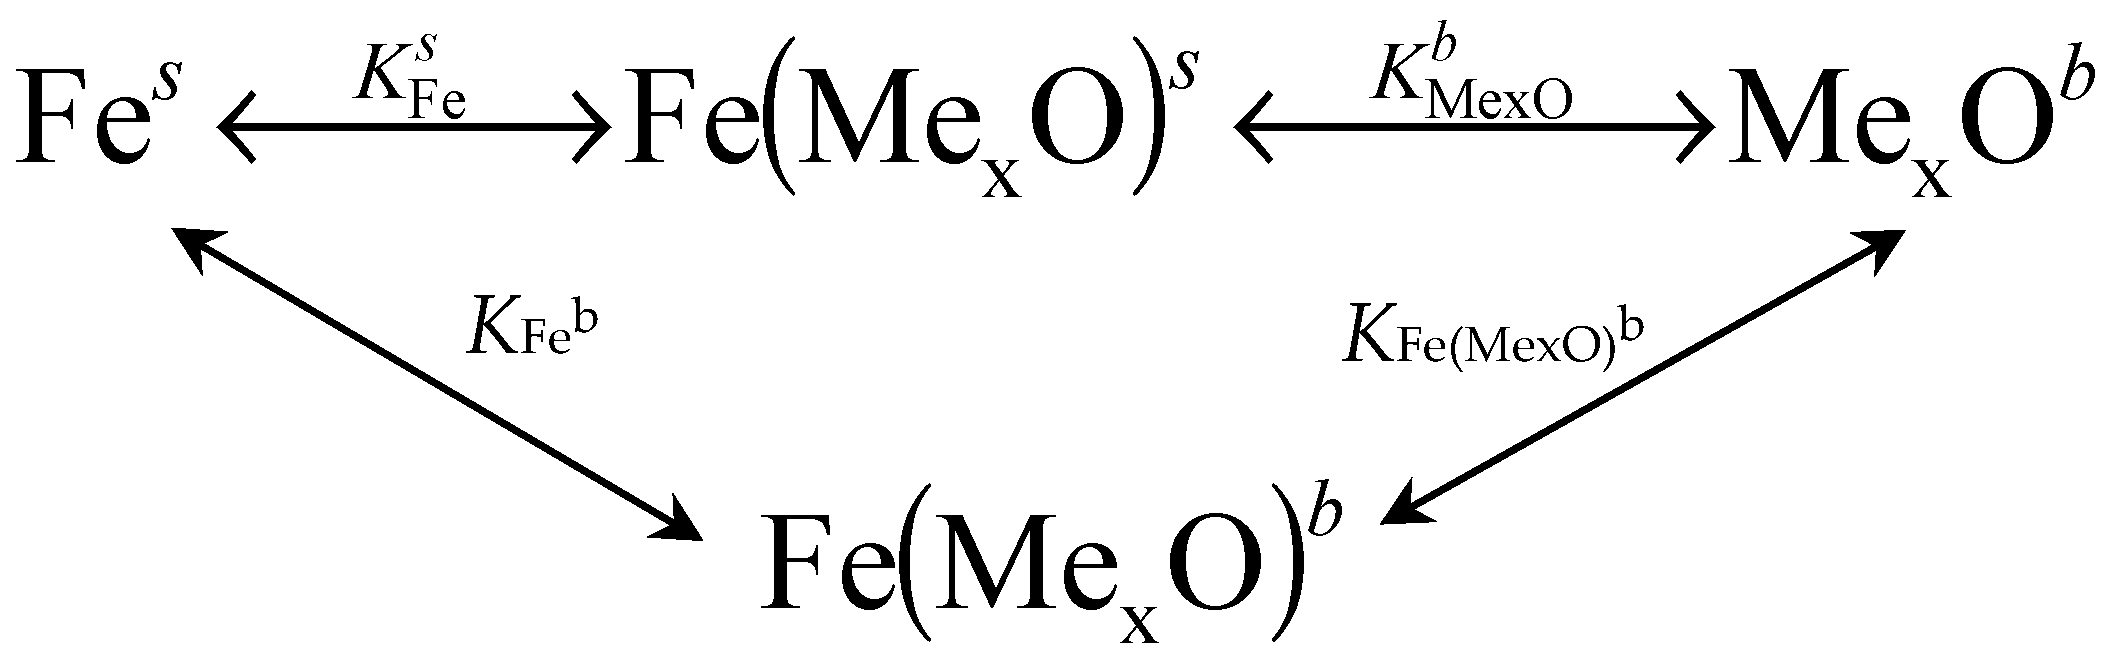
In the state of chemical equilibrium of a monodisperse system with a certain specific surface area, the following equations are satisfied [24]:
![Crystals 14 00188 i001]() where K—equilibrium constant; a—activity; subscripts: Fe—iron, Fe(MexO)—iron atoms covered with promoters, b—bulk of the nanocrystallite or glass phase which is the source of promoters, s—nanocrystallite surface.
where K—equilibrium constant; a—activity; subscripts: Fe—iron, Fe(MexO)—iron atoms covered with promoters, b—bulk of the nanocrystallite or glass phase which is the source of promoters, s—nanocrystallite surface.
In a polydisperse system, only the smallest nanocrystallite obtained at a certain temperature is in the state of chemical equilibrium at this temperature and all three Equations (5)–(7) are satisfied.
In the process of sintering, with increasing temperature, the concentration of promoters on the surface and the specific surface area of the sample decreased, while the average size of nanocrystallites increased [24]. Lowering of the temperature did not cause the reverse process [28,78], i.e., the reduction of the nanocrystallites’ sizes, and thus the nanocrystallites formed at a higher temperature were not in thermodynamic equilibrium at a lower temperature. For larger nanocrystallites, only Equations (6) and (7) are satisfied.
Taking into account the order of dipole wettability, it was assumed that the main component of the surface was a dipole containing potassium. Due to the geometrical aspect (maximum 50% of the area occupied by surface potassium oxide) and taking into account that the surface coverage degree decreased with increasing temperature, Equations (5)–(7) can be expressed as:
wherein the relationship between KFeb and KFeb* is as follows:
where P0,K2O—equilibrium potential of the potassium-containing promoter in the system studied.
Molar concentration, x, was calculated taking into account that the total number of moles of atoms, n, is a sum of the moles of surface and bulk iron atoms, nFe, in a nanocrystallite. In the case of a single nanocrystallite, surfaces containing nFes moles of atoms with unsaturated chemical bonds and nFe(K2O)s moles of atoms with saturated bonds were considered separately. The surface concentration of iron atoms occupied with promoters on the surface of nanocrystallites, , is defined as a ratio of the number of moles of iron atoms occupied by the promoters, nFe(K2O)s, to the total number of moles of iron, nFe. The surface concentration of free iron atoms on the surface of nanocrystallites, , is defined as a ratio of the number of moles of free, surface iron atoms, nFes, to the total number of moles of iron, nFe. The concentration of iron atoms in the nanocrystallite bulk, , is the ratio of the number of moles of iron atoms in the nanocrystallite bulk, nFeb, to the total number of moles of iron atoms, nFe.
The surface energies of the uncovered iron surface (GFes) and the iron surface covered by promoters (GFe(K2O)s) are defined as:
where: SFe—specific surface (uncovered), SFe(K2O)—specific surface (covered); subscript i—means that different crystallographic planes are present on the uncovered and covered surface.
A clean surface with only iron atoms (one-component system, = 0) has the highest surface energy (there are only surface atoms with free bonds). The result of partial surface coverage (0 < < 1) is the reduction in the nanocrystallite surface energy following saturation of the free bonds of some of the surface atoms (GFes > GFe(K2O)s). Total surface energy, Gs, which is as follows:
reaches a minimum in a state of equilibrium.
Based on the above balance, the area ratio in two equilibrium states, xFe,1s,max/xFe,2s,max, was determined at different surface concentrations of potassium-containing dipoles:
assuming that the iron catalyst reduced at 773 K was the reference catalyst marked with the number 1.
Model calculation results obtained using Equation (14) can be directly compared with the experimental data on the specific surface area of the tested sample thanks to the introduction of the coefficient ζ in Equation (1), which takes into account the properties of the real reaction system and finally the obtained result has the dimension m2g−1.
If nanocrystallites are formed under different potential and temperature conditions, they have different specific active surfaces and different dispersions. In real systems, nanocrystalline materials are characterized by a certain probability density function, PDF (e.g., the most abundant in the literature Gaussian distribution), according to the specific active surface, determined by the mean value of specific active surface, Am, and half width at half maximum, σ.
Nanocrystallites obtained at constant temperature and under the chemical potential of the MexO promoter within the range from PMexOI to PMexOII may, when the potential decreases to PMexOIII as a result of decreasing the potential or increasing the temperature, undergo a structural modification following sintering. The mass of sintering nanocrystallites with the most developed specific active surface area, which was unstable at a smaller potential PMexOIII, was remaining in the system. The new distribution will be narrower and characterized by a smaller average value.
Based on the measurements of the rate of nanocrystalline iron nitriding and the measurements of the specific surfaces of catalyst annealed and sintered in hydrogen in the temperature range 773–973 K to obtain steady states, the density distribution probabilities of iron nanocrystallites in the studied samples were determined elsewhere [70]. The products of the shares of individual nanocrystallite fractions and their specific surface area are presented in Figure 5 (black lines). The sum of the PDF function corresponds to the integral of the specific surfaces of the individual fractions of nanocrystallites in the catalysts.
As a result of the fitting, the model density distribution probabilities of specific surface of iron nanocrystallites were determined as the sum of two Gaussian distributions (Figure 5, red lines). It has been shown that the biggest nanocrystallite in the sintering process did not change (all lines started at the same point at ca. 0.075 nm−1, corresponding with the biggest iron nanocrystallites of the smallest specific surface area), but the size of the smallest nanocrystallites was increased with increasing sintering temperature (each line ended in a different point corresponding with the smallest iron nanocrystallites formed in a given annealing temperature). This was also confirmed by the results of TEM measurements (the largest nanocrystallites remained unchanged, and the smallest ones transformed into larger and larger ones during the sintering process).
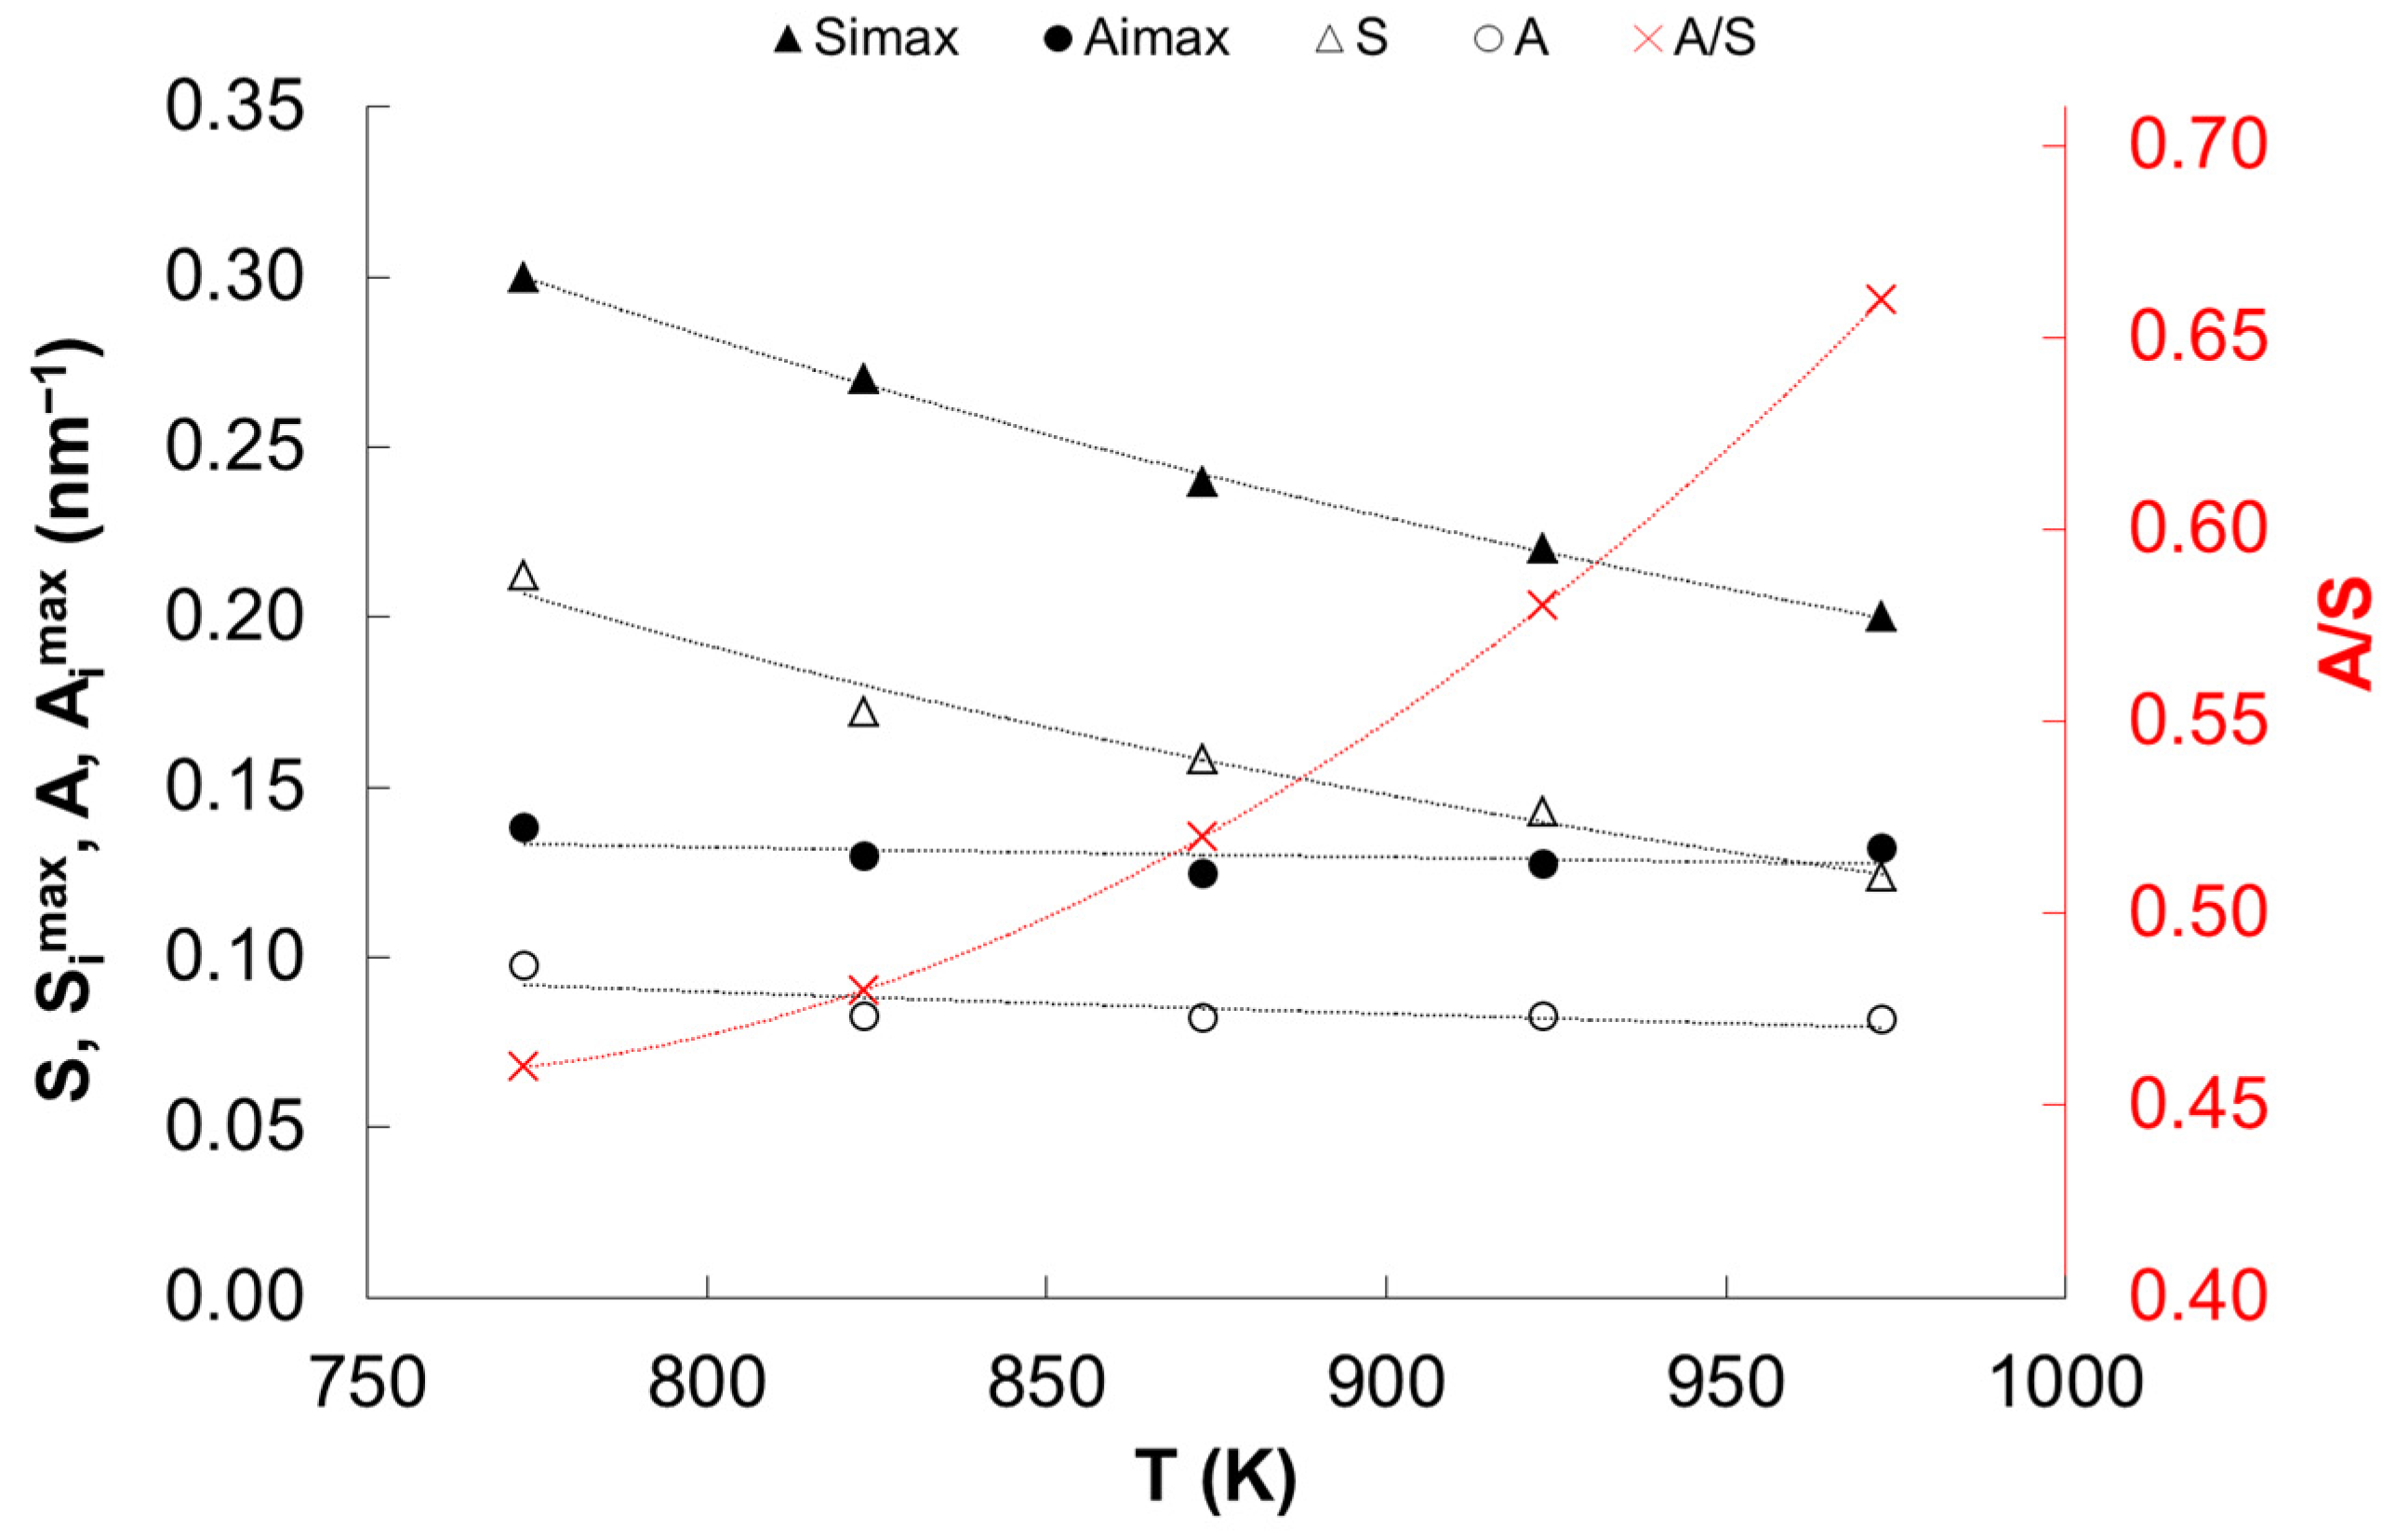
Based on the results of measurements of samples reduced in a temperature range of 773 to 973 K and quickly cooled to 298 K presented in [69,79], the values of the fraction of the active surface of iron nanocrystallites in relation to their total surface, A/S, were determined (Figure 6). Using the values of Simax for the smallest nanocrystallite in the catalyst samples read from Figure 5 and the A/S values, the active specific surfaces, Aimax, of the smallest nanocrystallites in the catalysts were calculated (Figure 6). Using the total values of S for the whole catalyst samples (read from Figure 2 and expressed in nm−1) and the A/S values, the active specific surfaces, A, of the whole of catalyst samples were calculated (Figure 6).
The maximum surface coverage degree of the potassium-containing promoter dipoles was shown to be 0.54, which is approximately in line with the theoretical assumptions of the double layer model [56].
Based on Equations (5) and (11) and the measurement results presented in Figure 6, the values of thermodynamic parameters (free enthalpy, enthalpy and entropy) characterizing the sintering process of the smallest iron nanocrystallites in catalyst samples were determined (Table 3).
In the case of two-component nanocrystalline Fe-OK systems, in the sintering process (Fes → Feb), the concentration of dipoles, -OK, on the surface was reduced (endothermic process) and the active specific surface was changed (exothermic process). Based on the results of measurements of the active specific surface area of the smallest iron nanocrystallites, the value of the enthalpy of the sintering process, ΔH(Simax) = 0.7 kJ/mol, was calculated (Table 3), which is a value much lower than the surface energy of approx. 90 kJ/mol, which is consistent with assumptions of the adopted isothermal, adiabatic and isosteric sintering model, according to which ΔH(Simax) = 0 kJ/mol (Equation (3)).
Only the smallest nanocrystallites at a given temperature remained in the chemical equilibrium satisfying all three Equations (5)–(7). In the case of larger nanocrystallites, Equation (5) was not met. Equilibrium can only be achieved between the glassy phase and the nanocrystallite surface (Equation (6)).
The values of thermodynamic parameters determined for all nanocrystallites in the catalysts (taking into account the total BET surface area) indicated that the total observed effect of the sintering process was endothermic, ΔH(Simax) = 33 kJ/mol, in which the wetting energy was greater than the change in surface energy. The wetting energy was the sum of the surface energy change and sintering energy (Fes → Feb).
The dispersion process can only take place with the supply of additional energy. However, this cannot be achieved by increasing the temperature. Thus, the sintering process is not a reversible one, and with a decrease in temperature below the formation temperature, the volume of the crystallites does not change. There is therefore no balance between process conditions and the volume of the nanocrystallite. A new equilibrium may be established between the promoters on the surface of the α-Fe(K2O) phase, xK2Os, and a glass phase.
5. Conclusions
An extended model of the active surface of the iron ammonia synthesis catalyst is presented, taking into account the influence of a gas-phase composition and process temperature. Based on this model, the roles of activating and structure-forming promoter dipoles in the formation of the catalyst structure, including the creation of active sites on the iron nanocrystallite surface, in the catalyst precursor reduction process, were interpreted. It has been shown that the surface was wetted mainly by potassium, which was assigned the role of an electron promoter, and it also acted as a structure-forming promoter.
Based on the conclusions from previous studies and experimental results, a model was presented and the values of thermodynamic parameters of the iron catalyst sintering process were determined.
Author Contributions
Conceptualization, W.A.; methodology, I.J. and R.P.; validation, W.A., Z.L.-B. and R.P.; formal analysis, I.J. and Z.L.-B.; investigation, I.J. and R.P.; data curation, W.A.; writing—original draft preparation, I.J. and R.P.; writing—review and editing, W.A., R.P. and Z.L.-B.; visualization, I.J. and R.P.; supervision, W.A.; project administration, W.A. and R.P.; funding acquisition, W.A. and R.P. All authors have read and agreed to the published version of the manuscript.
Funding
This research was funded by The National Science Centre, Poland, grant numbers 2017/27/B/ST8/02947 and 2017/27/B/ST8/02970. The APC was funded by MDPI.
Informed Consent Statement
Not applicable.
Data Availability Statement
Data are contained within the article.
Conflicts of Interest
The authors declare no conflicts of interest.
References
- Mathaudhu, S.N.; Boyce, B.L. Thermal Stability: The Next Frontier for Nanocrystalline Materials. JOM 2015, 67, 2785–2787. [Google Scholar] [CrossRef]
- Gertsman, V.Y.; Birringer, R. On the room-temperature grain growth in nanocrystalline copper. Scr. Metall. Mater. 1994, 30, 577–581. [Google Scholar] [CrossRef]
- Rupert, T.J.; Gianola, D.S.; Gan, Y.; Hemker, K.J. Experimental Observations of Stress-Driven Grain Boundary Migration. Science 2009, 326, 1686–1690. [Google Scholar] [CrossRef]
- Zhang, K.; Weertman, J.R.; Eastman, J.A. The influence of time, temperature, and grain size on indentation creep in high-purity nanocrystalline and ultrafine grain copper. Appl. Phys. Lett. 2004, 85, 5197–5199. [Google Scholar] [CrossRef]
- Weertman, J.R. Retaining the Nano in Nanocrystalline Alloys. Science 2012, 337, 921–922. [Google Scholar] [CrossRef] [PubMed]
- Natter, H.; Schmelzer, M.; Löffler, M.-S.; Krill, C.E.; Fitch, A.; Hempelmann, R. Grain-Growth Kinetics of Nanocrystalline Iron Studied in Situ by Synchrotron Real-Time X-ray Diffraction. J. Phys. Chem. B 2000, 104, 2467–2476. [Google Scholar] [CrossRef]
- Smith, C.S. Grains, phases, and interphases: An interpretation of microstructure. Trans. Metall. Soc. AIME 1948, 175, 15–51. [Google Scholar]
- Burke, J.E. Some factor affecting the rate of grain growth in metals. Trans. Metall. Soc. AIME 1949, 180, 73–91. [Google Scholar]
- Burke, J.E.; Turnbull, D. Recrystallization and grain growth. Prog. Met. Phys. 1952, 3, 220–292. [Google Scholar] [CrossRef]
- Hösel, M.; Krebs, F.C. Large-scale roll-to-roll photonic sintering of flexo printed silver nanoparticle electrodes. J. Mater. Chem. 2012, 22, 15683–15688. [Google Scholar] [CrossRef]
- Layani, M.; Magdassi, S. Flexible transparent conductive coatings by combining self-assembly with sintering of silver nanoparticles performed at room temperature. J. Mater. Chem. 2011, 21, 15378–15382. [Google Scholar] [CrossRef]
- Asoro, M.A.; Kovar, D.; Shao-Horn, Y.; Allard, L.F.; Ferreira, P. Coalescence and sintering of Pt nanoparticles: In situ observation by aberration-corrected HAADF STEM. Nanotechnology 2010, 21, 025701. [Google Scholar] [CrossRef]
- Cao, Y.; Denny, M.S., Jr.; Caspar, J.V.; Farneth, W.E.; Guo, Q.; Ionkin, A.S.; Johnson, L.K.; Lu, M.; Malajovich, I.; Radu, D.; et al. High-Efficiency Solution-Processed Cu2ZnSn(S, Se)4 Thin-Film Solar Cells Prepared from Binary and Ternary Nanoparticles. J. Am. Chem. Soc. 2012, 134, 15644–15647. [Google Scholar] [CrossRef]
- Luding, S.; Manetsberger, K.; Müllers, J. A discrete model for long time sintering. J. Mech. Phys. Solids 2005, 53, 455–491. [Google Scholar] [CrossRef]
- Braginsky, M.; Tikare, V.; Olevsky, E. Numerical simulation of solid state sintering. Int. J. Solids Struct. 2005, 42, 621–636. [Google Scholar] [CrossRef]
- Pan, J.; Huang, R. Multi-Scale Modelling of Sintering. Key Eng. Mater. 2008, 368–372, 1668–1672. [Google Scholar] [CrossRef]
- Wakai, F.; Yoshida, M.; Shinoda, Y.; Akatsu, T. Coarsening and grain growth in sintering of two particles of different sizes. Acta Mater. 2005, 53, 1361–1371. [Google Scholar] [CrossRef]
- Panigrahi, B.B. Sintering and grain growth kinetics of ball milled nanocrystalline nickel powder. Mater. Sci. Eng. A 2007, 460–461, 7–13. [Google Scholar] [CrossRef]
- Gorshkov, V.; Kuzmenko, V.; Privman, V. Nonequilibrium Kinetic Modeling of Sintering of a Layer of Dispersed Nanocrystals. CrystEngComm 2014, 16, 10395–10409. [Google Scholar] [CrossRef]
- Shkatov, V.; Mazur, I. Modeling the Dynamic Recrystallization and Flow Curves Using the Kinetics of Static Recrystallization. Materials 2019, 12, 3024. [Google Scholar] [CrossRef]
- Zhu, K.N.; Ruan, Q.; Godfrey, A. The kinetics of grain growth in near-micrometre grain size copper produced by spark plasma sintering. IOP Conf. Ser. Mater. Sci. Eng. 2015, 89, 012060. [Google Scholar] [CrossRef]
- Arabczyk, W.; Jasińska, I.; Lendzion-Bieluń, Z. Kinetics studies of recrystallization process of metallic catalysts for ammonia synthesis. Catal. Today 2011, 169, 93–96. [Google Scholar] [CrossRef]
- Nielsen, A. (Ed.) Ammonia Catalysis and Manufacture; Springer: Berlin, Germany, 1995. [Google Scholar]
- Arabczyk, W.; Pelka, R.; Jasińska, I. Extended Surface of Materials as a Result of Chemical Equilibrium. J. Nanomater. 2014, 2014, 159. [Google Scholar] [CrossRef]
- Janecki, Z.; Gołębiowski, A.; Kałucki, K.; Arabczyk, W.; Szmidt-Szałowski, K.; Kowalczyk, Z.; Śpiewak, Z.; Ludwiczak, S. The state of research on catalysts for ammonia synthesis. Przem. Chem. 1988, 67, 479. [Google Scholar]
- Humphreys, F.J.; Hatherly, M. Recrystallization and Related Annealing Phenomena; Pergamon Press: Oxford, UK, 2017. [Google Scholar]
- Barański, A.; Dziembaj, R.; Kotarba, A.; Łagan, J.M.; Łojewska, J.; Pieprzyk, E.; Mleczko, L.; Baerns, M. A new approach to kinetic study of wet atmosphere activation of fused iron catalyst. Appl. Catal. A 1997, 162, 133–148. [Google Scholar] [CrossRef]
- Jasińska, I.; Arabczyk, W. Kinetic Studies of the Recrystallization Process of Iron Catalyst for Ammonia Synthesis. Chem. Pap. 2005, 59, 496–499. [Google Scholar]
- Lendzion-Bieluń, Z.; Gleń, M. Studies on the recrystallization of nanocrystalline metals. Pol. J. Chem. Technol. 2007, 9, 5–7. [Google Scholar] [CrossRef]
- Kuznetsov, L.D.; Lachinov, S.S. The Effect Of Al2O3 And K2O Promoters on the activity of iron catalyst in the synthesis of ammonia. Zh. Fiz. Khim. 1959, 33, 2542. [Google Scholar]
- Boudart, M. Ammonia synthesis: The bellwether reaction in heterogeneous catalysis. Top. Catal. 1994, 1, 405–414. [Google Scholar] [CrossRef]
- Jennings, J.R. (Ed.) Catalytic Ammonia Synthesis, Fundamentals and Practice; Plenum Press: New York, NY, USA, 1991. [Google Scholar]
- Schlögl, R. Handbook of Heterogeneous Catalysis; WILEY-VCH Verlag GmbH & Co., KgaA: Weinheim, Germany, 2008. [Google Scholar]
- Liu, H.Z. Ammonia Synthesis Catalysts: Innovation and Practice; World Sci Publishing Co., Ltd.: Singapore, 2013. [Google Scholar]
- Nørskov, J.K. From quantum physics to heterogeneous catalysis. Top. Catal. 1994, 1, 385–403. [Google Scholar] [CrossRef]
- Somorjai, G.A. Introduction to Surface Chemistry and Catalysis; John Wiley & Sons: New York, NY, USA, 1994. [Google Scholar]
- Ozaki, A.; Aika, K. Catalysis—Science and Technology; Anderson, J.R., Boudart, M., Eds.; Springer: Berlin, Germany, 1982; Volume 1. [Google Scholar]
- Van de Voorde, M.; Sels, B. (Eds.) Nanotechnology in Catalysis: Applications in the Chemical Industry, Energy Development, and Environment Protection; Wiley-VCH: Weinheim, Germany, 2017. [Google Scholar]
- Zhou, B.; Han, S.; Raja, R.; Somorjai, G.A. Nanotechnology in Catalysis; Springer: New York, NY, USA, 2007. [Google Scholar]
- Gleiter, H. Nanostructured materials: Basic concepts and microstructure. Acta Mater. 2000, 48, 1–29. [Google Scholar] [CrossRef]
- Ertl, G. Surface Science and Catalysis—Studies on the Mechanism of Ammonia Synthesis: The P. H. Emmett Award Address. Catal. Rev. 1980, 21, 201–223. [Google Scholar] [CrossRef]
- Ertl, G. Physical characterization of industrial catalysts: The mechanism of ammonia synthesis. Stud. Surf. Sci. Catal. 1989, 44, 315–320. [Google Scholar]
- Somorjai, G.A.; Materer, N. Surface structure in ammonia synthesis. Top. Catal. 1994, 1, 215–231. [Google Scholar] [CrossRef]
- Ertl, G. Elementary Steps in Ammonia Synthesis. In Catalytic Ammonia Synthesis, Fundamentals and Practice; Jennings, J.R., Ed.; Plenum Press: New York, NY, USA, 1991. [Google Scholar]
- Paal, Z.; Ertl, G.; Lee, S.B. Interactions of potassium, oxygen and nitrogen with polycrystalline iron surfaces. Appl. Surf. Sci. 1981, 8, 231–249. [Google Scholar] [CrossRef]
- Aika, K.; Tamaru, K. Ammonia Synthesis over Non-Iron Catalysts and Related Phenomena, Ammonia Catalysis and Manufacture; Nielsen, A., Ed.; Springer: Berlin, Germany, 1995. [Google Scholar]
- Ertl, G. Reactions at Solid Surfaces; John Wiley & Sons, Inc.: Hoboken, NJ, USA, 2009. [Google Scholar]
- Arabczyk, W.; Müssig, H.J. Nitrogen bonding states on iron studied by PES and AES. Vacuum 1987, 37, 137–140. [Google Scholar] [CrossRef]
- Schlögl, R.; Schoonmaker, R.C.; Muhler, M.; Ertl, G. Bridging the “material gap” between single crystal studies and real catalysis. Catal. Lett. 1988, 1, 237–241. [Google Scholar] [CrossRef]
- Strongin, D.R.; Bare, S.R.; Somorjai, G.A. The effects of aluminum oxide in restructuring iron single crystal surfaces for ammonia synthesis. J. Catal. 1987, 103, 289–301. [Google Scholar] [CrossRef]
- Strongin, D.R.; Somorjai, G.A. Ammonia-pretreatment-induced restructuring of iron single-crystal surfaces: Its effects on ammonia synthesis and on coadsorbed aluminum oxide and potassium. J. Catal. 1989, 118, 99–110. [Google Scholar] [CrossRef]
- Arabczyk, W.; Narkiewicz, U.; Kałucki, K. Model of active surface of iron catalyst for ammonia synthesis. Vacuum 1994, 45, 267–269. [Google Scholar] [CrossRef]
- Arabczyk, W.; Narkiewicz, U. Growth of iron oxides on the Fe(111) surface precovered with sulphur and/or potassium. Appl. Surf. Sci. 1997, 108, 379–384. [Google Scholar] [CrossRef]
- Arabczyk, W.; Kałucki, K. New model of deactivation of iron catalysts for ammonia-synthesis. Stud. Surf. Sci. Catal. 1993, 75, 2539–2542. [Google Scholar] [CrossRef]
- Arabczyk, W. Untersuchung der Segregation Nichtmetallischer Elemente und Ihres Einflusses auf die Oxydation der Eisen-(111) Oberflache mit Hilfe Elektronspektrometrischer Methoden; Technische Universität Dresden: Dresden, Germany, 1987. [Google Scholar]
- Arabczyk, W.; Narkiewicz, U.; Moszyński, D. Double-Layer Model of the Fused Iron Catalyst for Ammonia Synthesis. Langmuir 1999, 15, 5785–5789. [Google Scholar] [CrossRef]
- Arabczyk, W.; Jasińska, I.; Lubkowski, K. The surface properties of iron catalyst for ammonia synthesis. React. Kinet. Catal. Lett. 2004, 83, 385–392. [Google Scholar] [CrossRef]
- Lendzion-Bieluń, Z.; Arabczyk, W. Method for determination of the chemical composition of phases of the iron catalyst precursor for ammonia synthesis. Appl. Catal. A 2001, 207, 37–41. [Google Scholar] [CrossRef]
- Arabczyk, W.; Ekiert, E.; Pelka, R. Size-dependent transformation of α-Fe into γ′-Fe4N in nanocrystalline the Fe-NH3-H2 system. J. Phys. Chem. C 2016, 120, 17989–17995. [Google Scholar] [CrossRef]
- Arabczyk, W.; Ekiert, E.; Pelka, R. Hysteresis phenomenon in the reaction system of nanocrystalline iron with mixture of ammonia and hydrogen. Phys. Chem. Chem. Phys. 2016, 18, 25796–25800. [Google Scholar] [CrossRef]
- Arabczyk, W.; Pelka, R.; Wilk, B. Studies of phase transitions occurring in the system of nanocrystalline Fe/NH3/H2. Mater. Chem. Phys. 2019, 237, 121853. [Google Scholar] [CrossRef]
- Moszyńska, I.; Moszyński, D.; Arabczyk, W. Hysteresis in nitriding and reduction in the nanocrystalline iron-ammonia-hydrogen system. Przem. Chem. 2009, 88, 526–529. [Google Scholar]
- Wilk, B.; Arabczyk, W. Investigation of nitriding and reduction processes in a nanocrystalline iron–ammonia–hydrogen system at 350 °C. Phys. Chem. Chem. Phys. 2015, 17, 20185–20193. [Google Scholar] [CrossRef]
- Moszyński, D.; Moszyńska, I.; Arabczyk, W. Iron nitriding and reduction of iron nitrides in nanocrystalline Fe-N system. Mater. Lett. 2012, 78, 32–34. [Google Scholar] [CrossRef]
- Moszyński, D. Nitriding of nanocrystalline iron in the atmospheres with variable nitriding potential. J. Phys. Chem. C 2014, 118, 15440–15447. [Google Scholar] [CrossRef]
- Moszyński, D.; Moszyńska, I.; Arabczyk, W. The transformation of alpha-Fe into gamma’-Fe4N in nanocrystalline Fe-N system. Appl. Phys. Lett. 2013, 103, 253108. [Google Scholar] [CrossRef]
- Wilk, B.; Pelka, R.; Arabczyk, W. Study of the iron catalyst for ammonia synthesis by chemical potential programmed reaction method. J. Phys. Chem. C 2017, 121, 8548–8556. [Google Scholar] [CrossRef]
- Pelka, R.; Arabczyk, W. Studies of the Kinetics of Reaction Between Iron Catalysts and Ammonia—Nitriding of Nanocrystalline Iron with Parallel Catalytic Ammonia Decomposition. Top. Catal. 2009, 52, 1506–1516. [Google Scholar] [CrossRef]
- Pelka, R.; Kiełbasa, K.; Arabczyk, W. The effect of iron nanocrystallites’ size in catalysts for ammonia synthesis on nitriding reaction and catalytic ammonia decomposition. Centr. Eur. J. Chem. 2011, 9, 240–244. [Google Scholar] [CrossRef]
- Arabczyk, W.; Pelka, R.; Jasińska, I.; Lendzion-Bieluń, Z. Reaction model taking into account the catalyst morphology and its active specific surface in the process of catalytic ammonia decomposition. Materials 2021, 14, 7229. [Google Scholar] [CrossRef] [PubMed]
- Pelka, R. A method of determining nanoparticle size distribution in iron ammonia synthesis catalyst by measuring mass changes during the nitriding process. Catal. Today 2017, 286, 118–123. [Google Scholar] [CrossRef]
- Pelka, R.; Arabczyk, W. A new method for determining the nanocrystallite size distribution in systems where chemical reaction between solid and a gas phase occurs. J. Nanomater. 2013, 2013, 645050. [Google Scholar] [CrossRef]
- Rogowski, J. TOF-SIMS study of morphology and chemical composition of wustite-based precursor and iron catalyst for ammonia synthesis. Appl. Surf. Sci. 2019, 469, 82–89. [Google Scholar] [CrossRef]
- Arabczyk, W.; Narkiewicz, U.; Moszyński, D. Influence of potassium/oxygen layer on properties of iron surfaces. Appl. Catal. 1999, 182, 379–384. [Google Scholar] [CrossRef]
- Spencer, M.J.S.; Hung, A.; Snook, I.K.; Yarovsky, I. Density Functional Theory Study of the Relaxation and Energy of Iron Surfaces. Surf. Sci. 2002, 513, 389–398. [Google Scholar] [CrossRef]
- Tyson, W.R.; Miller, W.A. Surface Free Energies of Solid Metals. Estimation from Liquid Surface Tension Measurements. Surf. Sci. 1977, 62, 267–276. [Google Scholar] [CrossRef]
- Lendzion-Bieluń, Z. A comparison of the distribution of promoters in reduced and oxidized form of iron catalyst for ammonia synthesis. Pol. J. Chem. 2007, 81, 433–440. [Google Scholar]
- Jasińska, I.; Lubkowski, K.; Arabczyk, W. The surface properties of iron catalyst for ammonia synthesis. Ann. Pol. Chem. Soc. 2003, 2, 1205–1209. [Google Scholar]
- Arabczyk, W.; Jasińska, I.; Pelka, R. Measurements of the relative number of active sites on iron catalyst for ammonia synthesis by hydrogen desorption. Catal. Today 2011, 169, 97–101. [Google Scholar] [CrossRef]
Figure 1.
Concentrations of nitrogen in iron catalyst (reduced and annealed in hydrogen at 773 K) as function of time in nitriding process at 748 K.
Figure 1.
Concentrations of nitrogen in iron catalyst (reduced and annealed in hydrogen at 773 K) as function of time in nitriding process at 748 K.
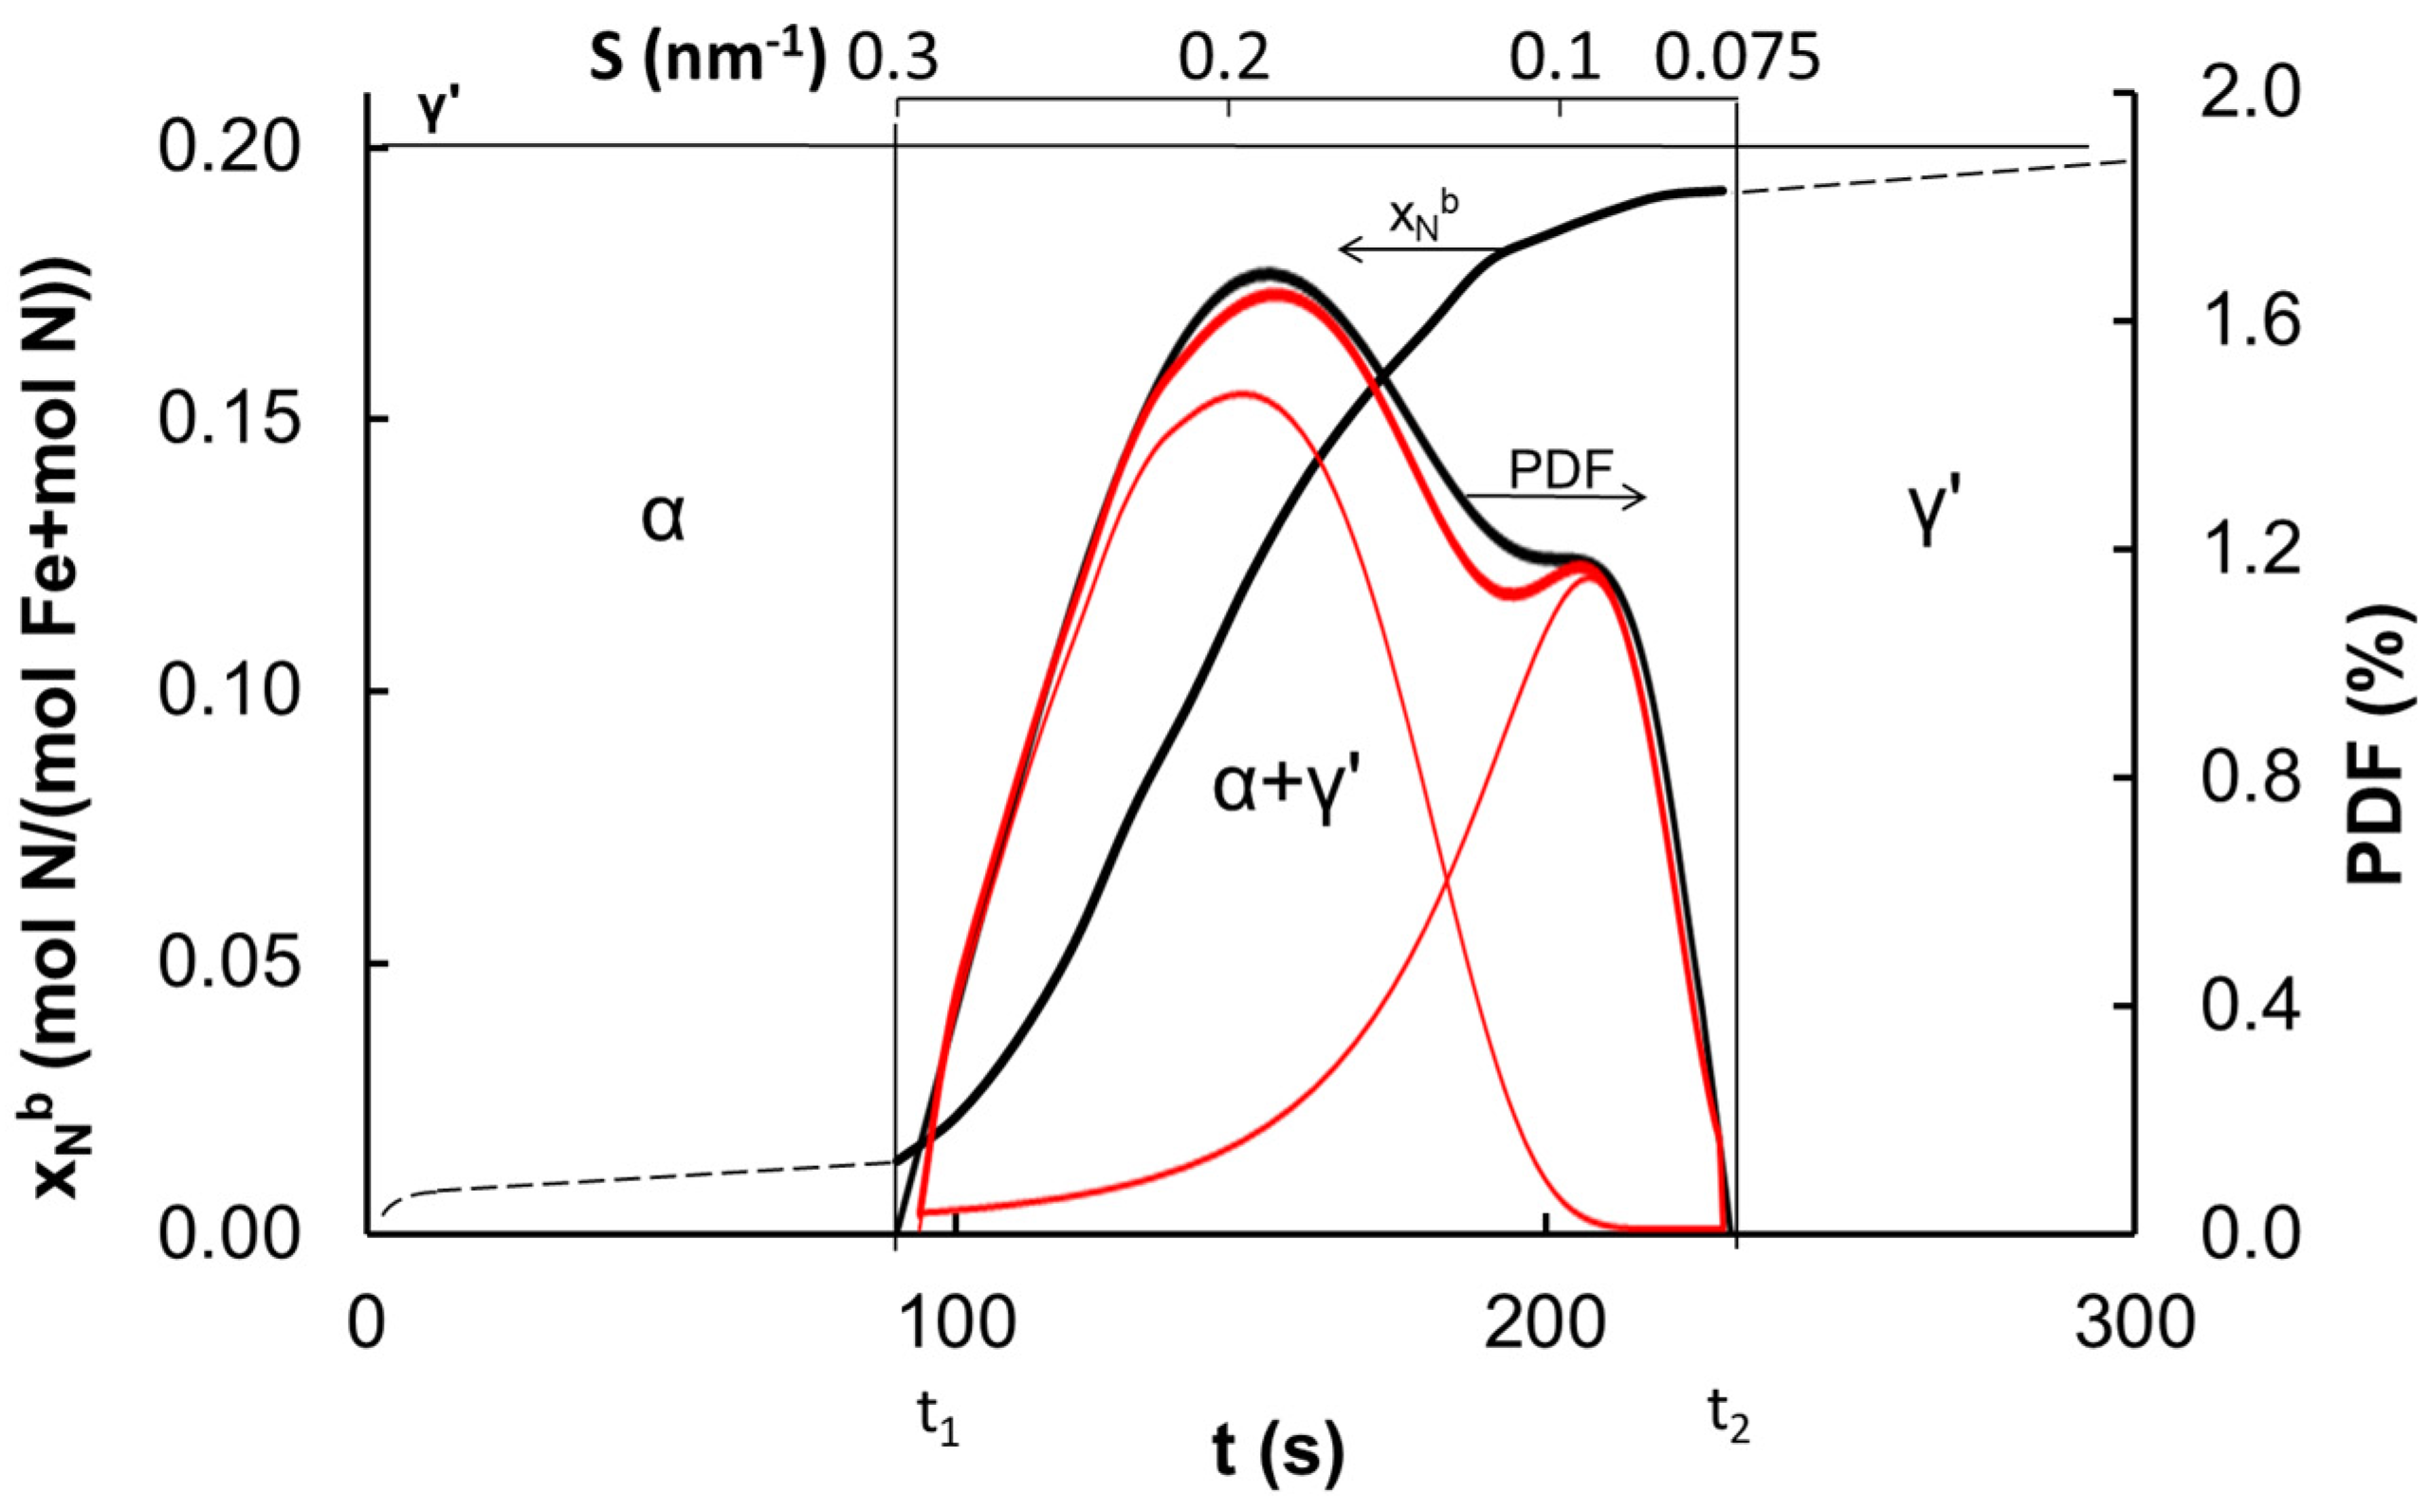
Figure 2.
Specific surface area of samples reduced and overheated in hydrogen atmosphere in a temperature range of 773 to 973 K.
Figure 2.
Specific surface area of samples reduced and overheated in hydrogen atmosphere in a temperature range of 773 to 973 K.
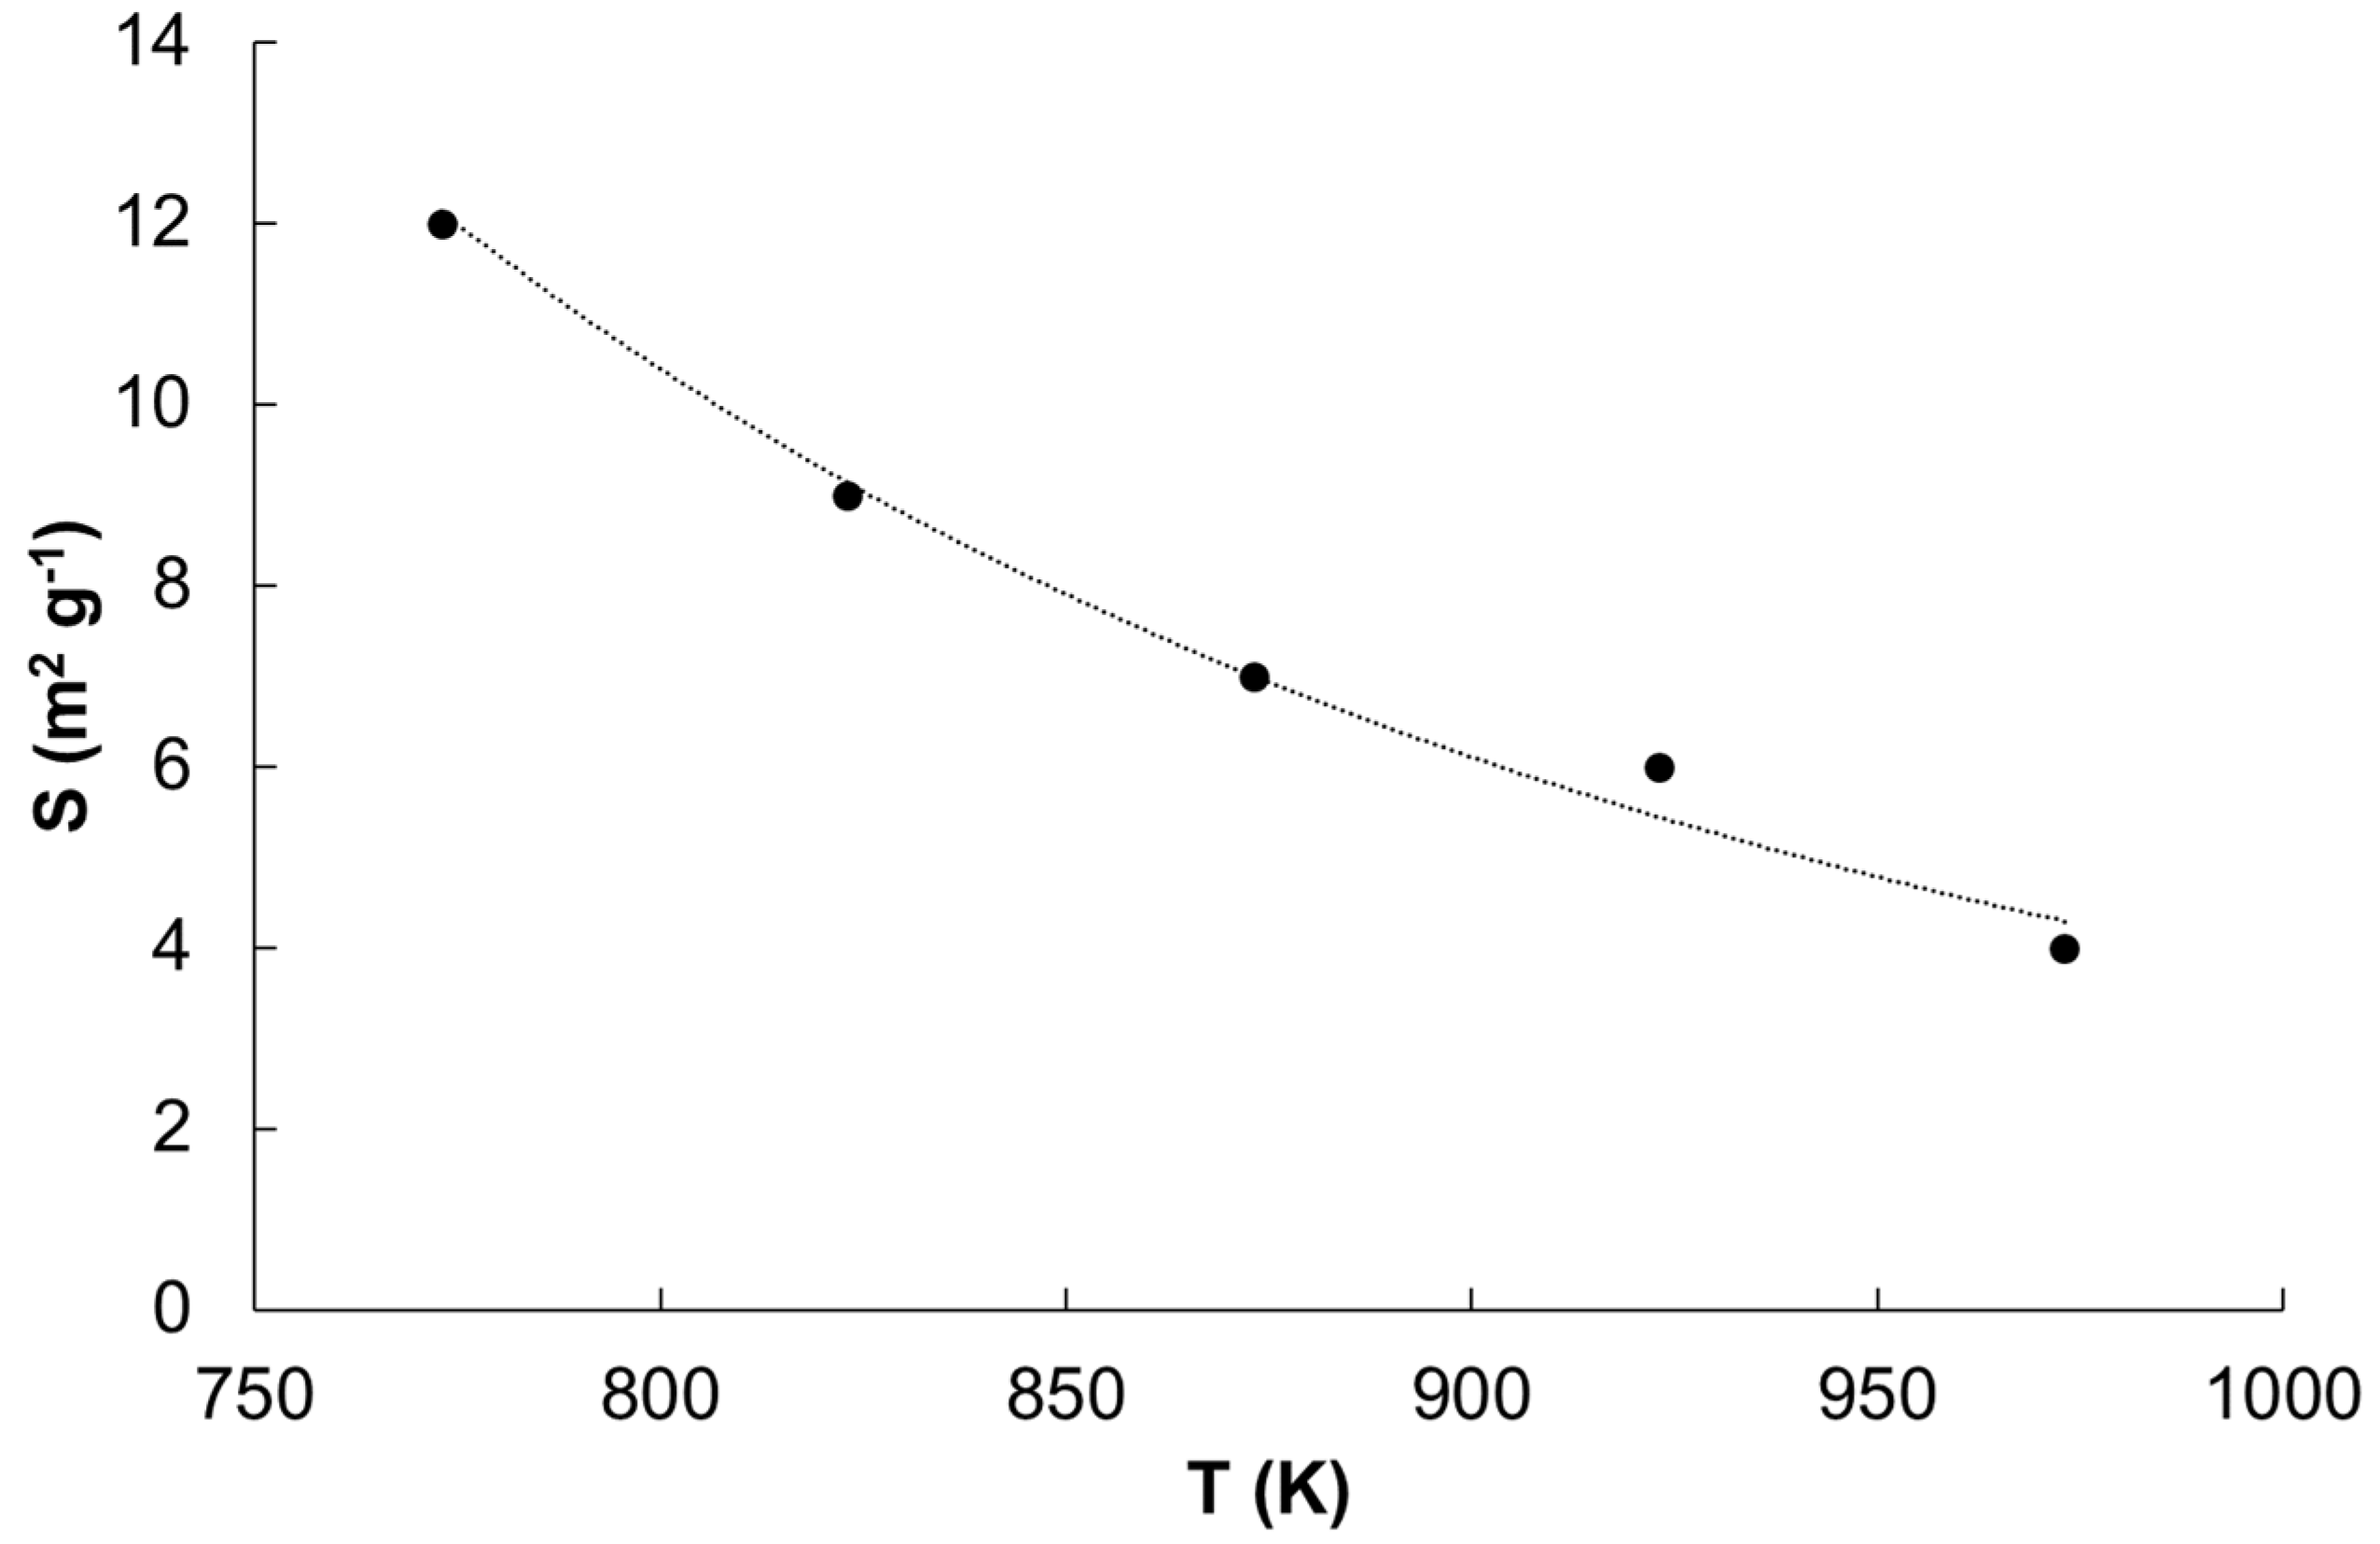
Figure 3.
Microscopic images of a sample of the catalyst reduced and annealed in hydrogen at a maximum temperature of 773 K (a) the smallest nanocrystallites, (b) the largest iron nanocrystallites.
Figure 3.
Microscopic images of a sample of the catalyst reduced and annealed in hydrogen at a maximum temperature of 773 K (a) the smallest nanocrystallites, (b) the largest iron nanocrystallites.

Figure 4.
(a) Scheme of iron catalyst 2D and 3D structure, (b) Model of the surface of nanocrystalline iron wetted with promoters in vacuum (I) and in hydrogen (II) and the scheme of the process of uncovering the iron surface through the -O-K structures and sintering with temperature increase from T1 to T2 (III).
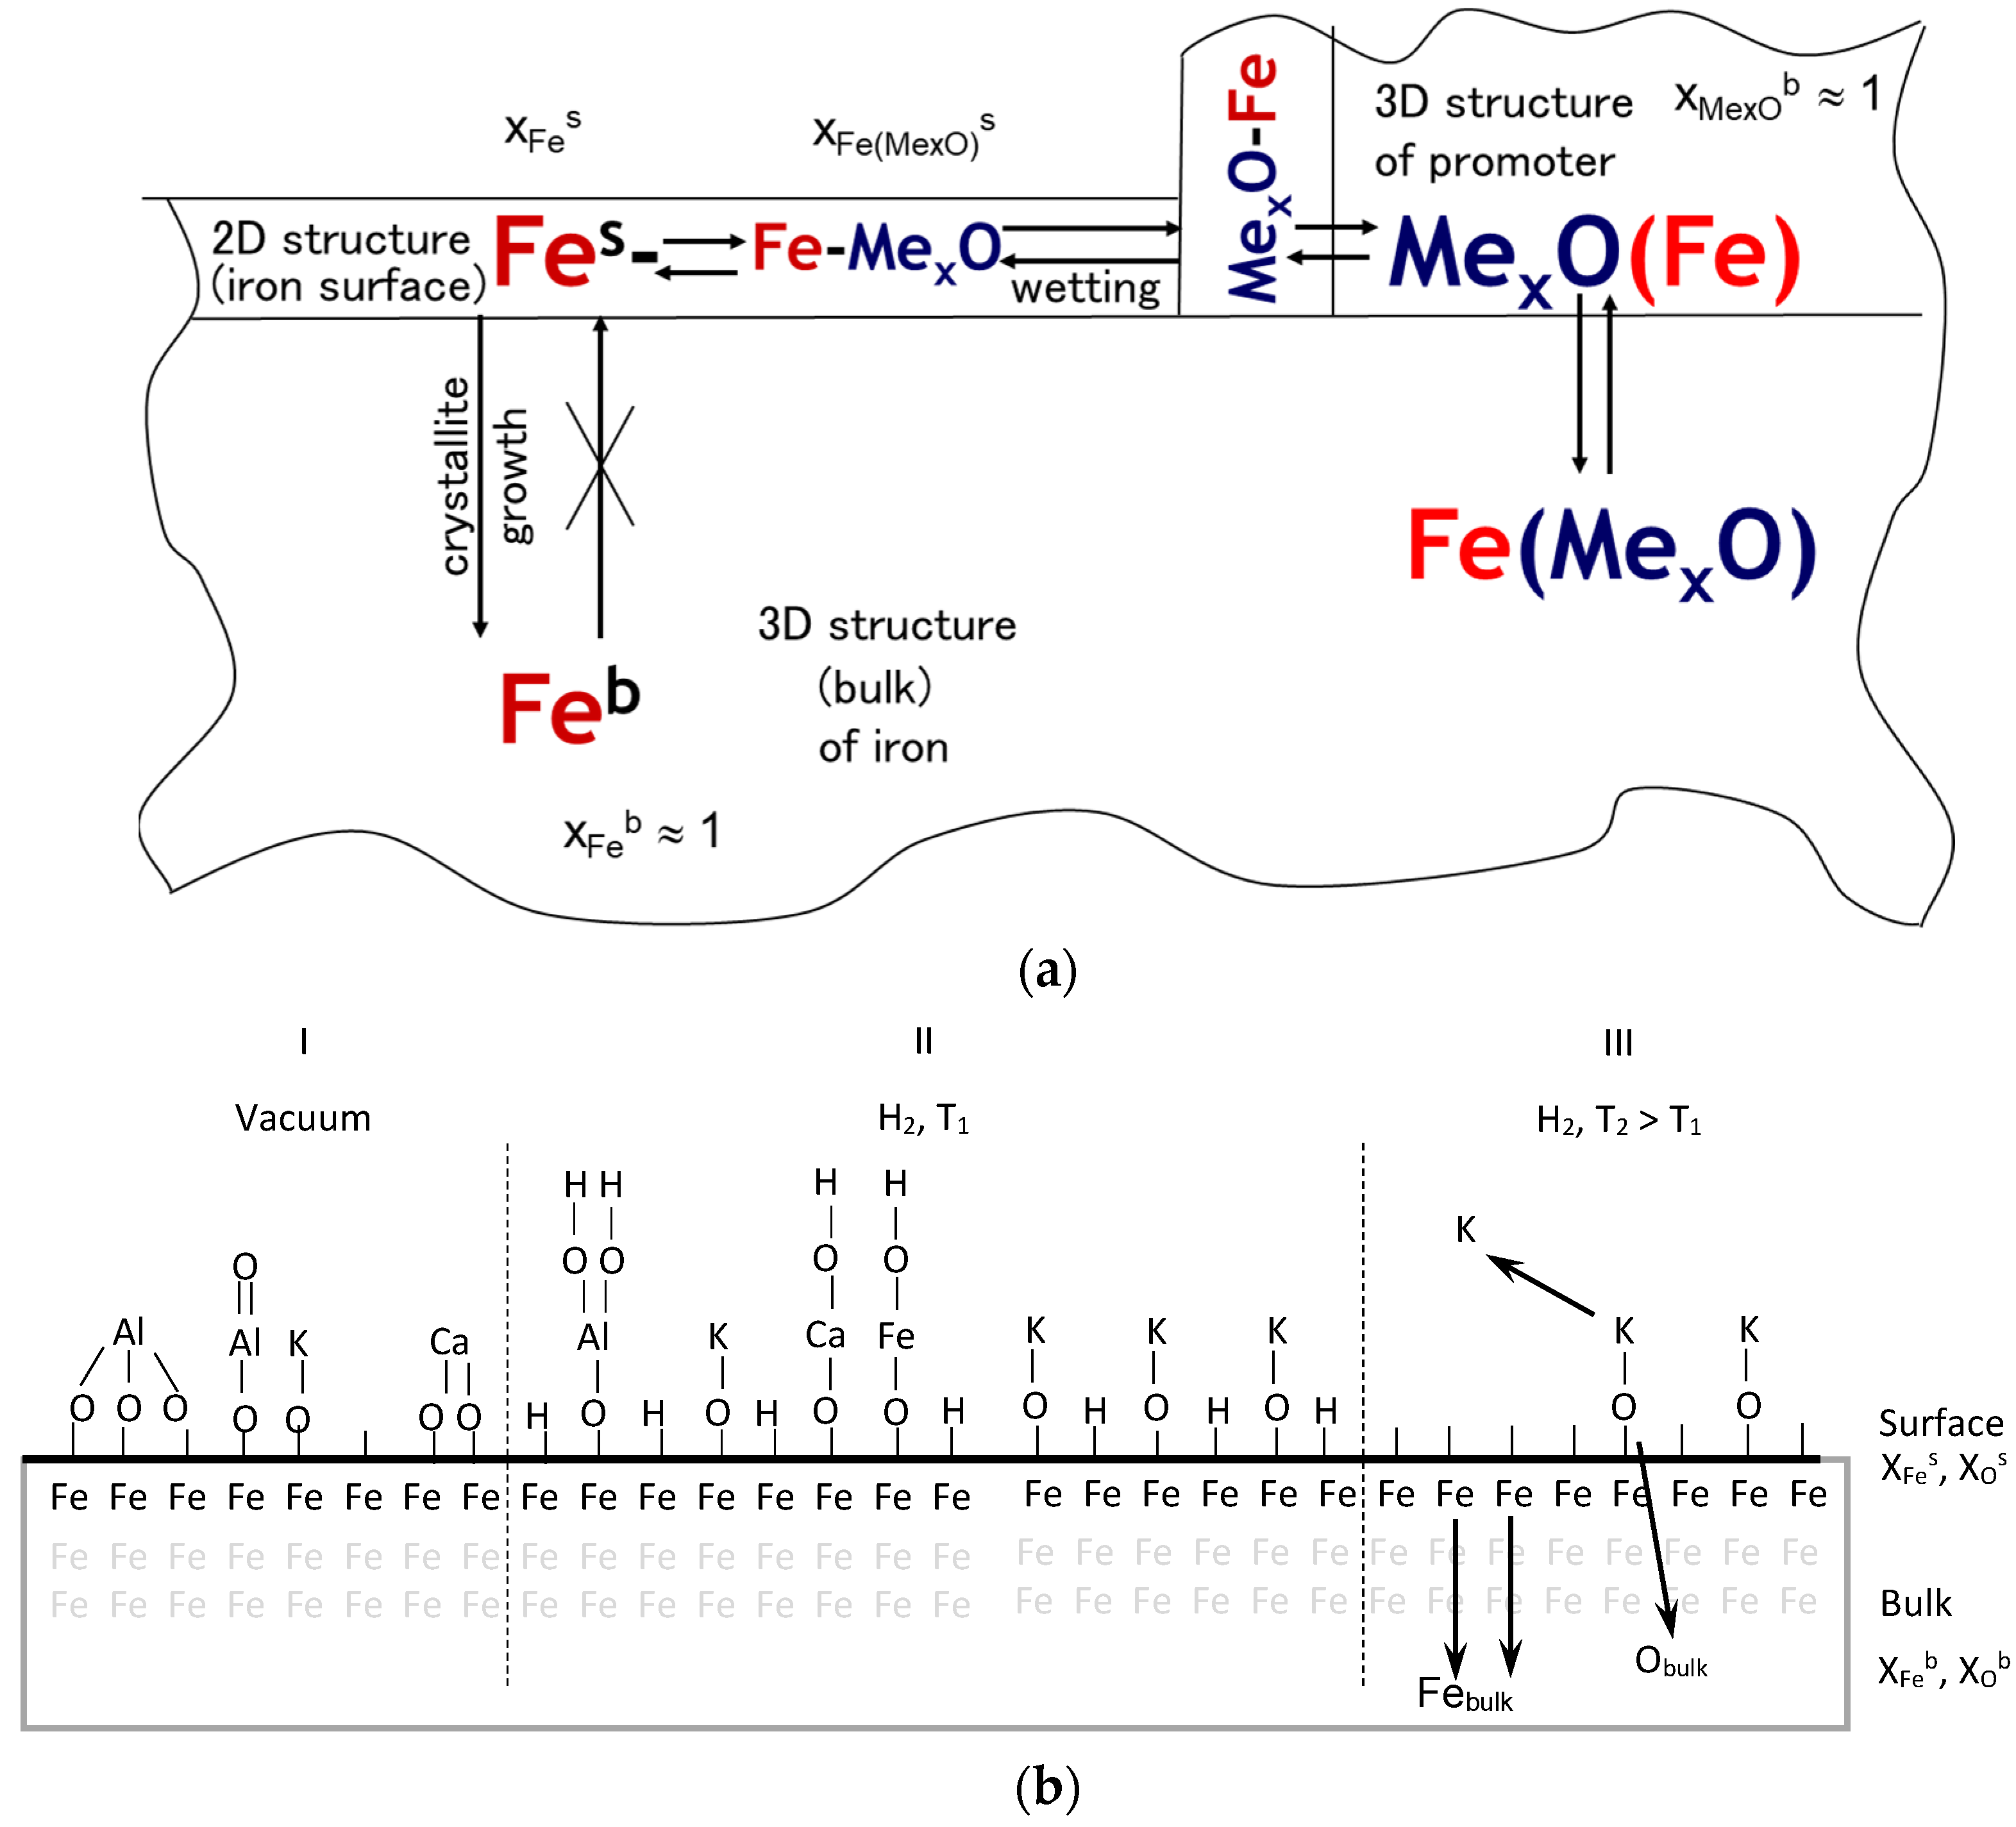
Figure 5.
Probabilities of the distribution densities of specific surface areas of nanocrystalline iron sintered at different temperatures within the range of 773–973 K (black lines—measurement results; red lines—fitting results).
Figure 5.
Probabilities of the distribution densities of specific surface areas of nanocrystalline iron sintered at different temperatures within the range of 773–973 K (black lines—measurement results; red lines—fitting results).
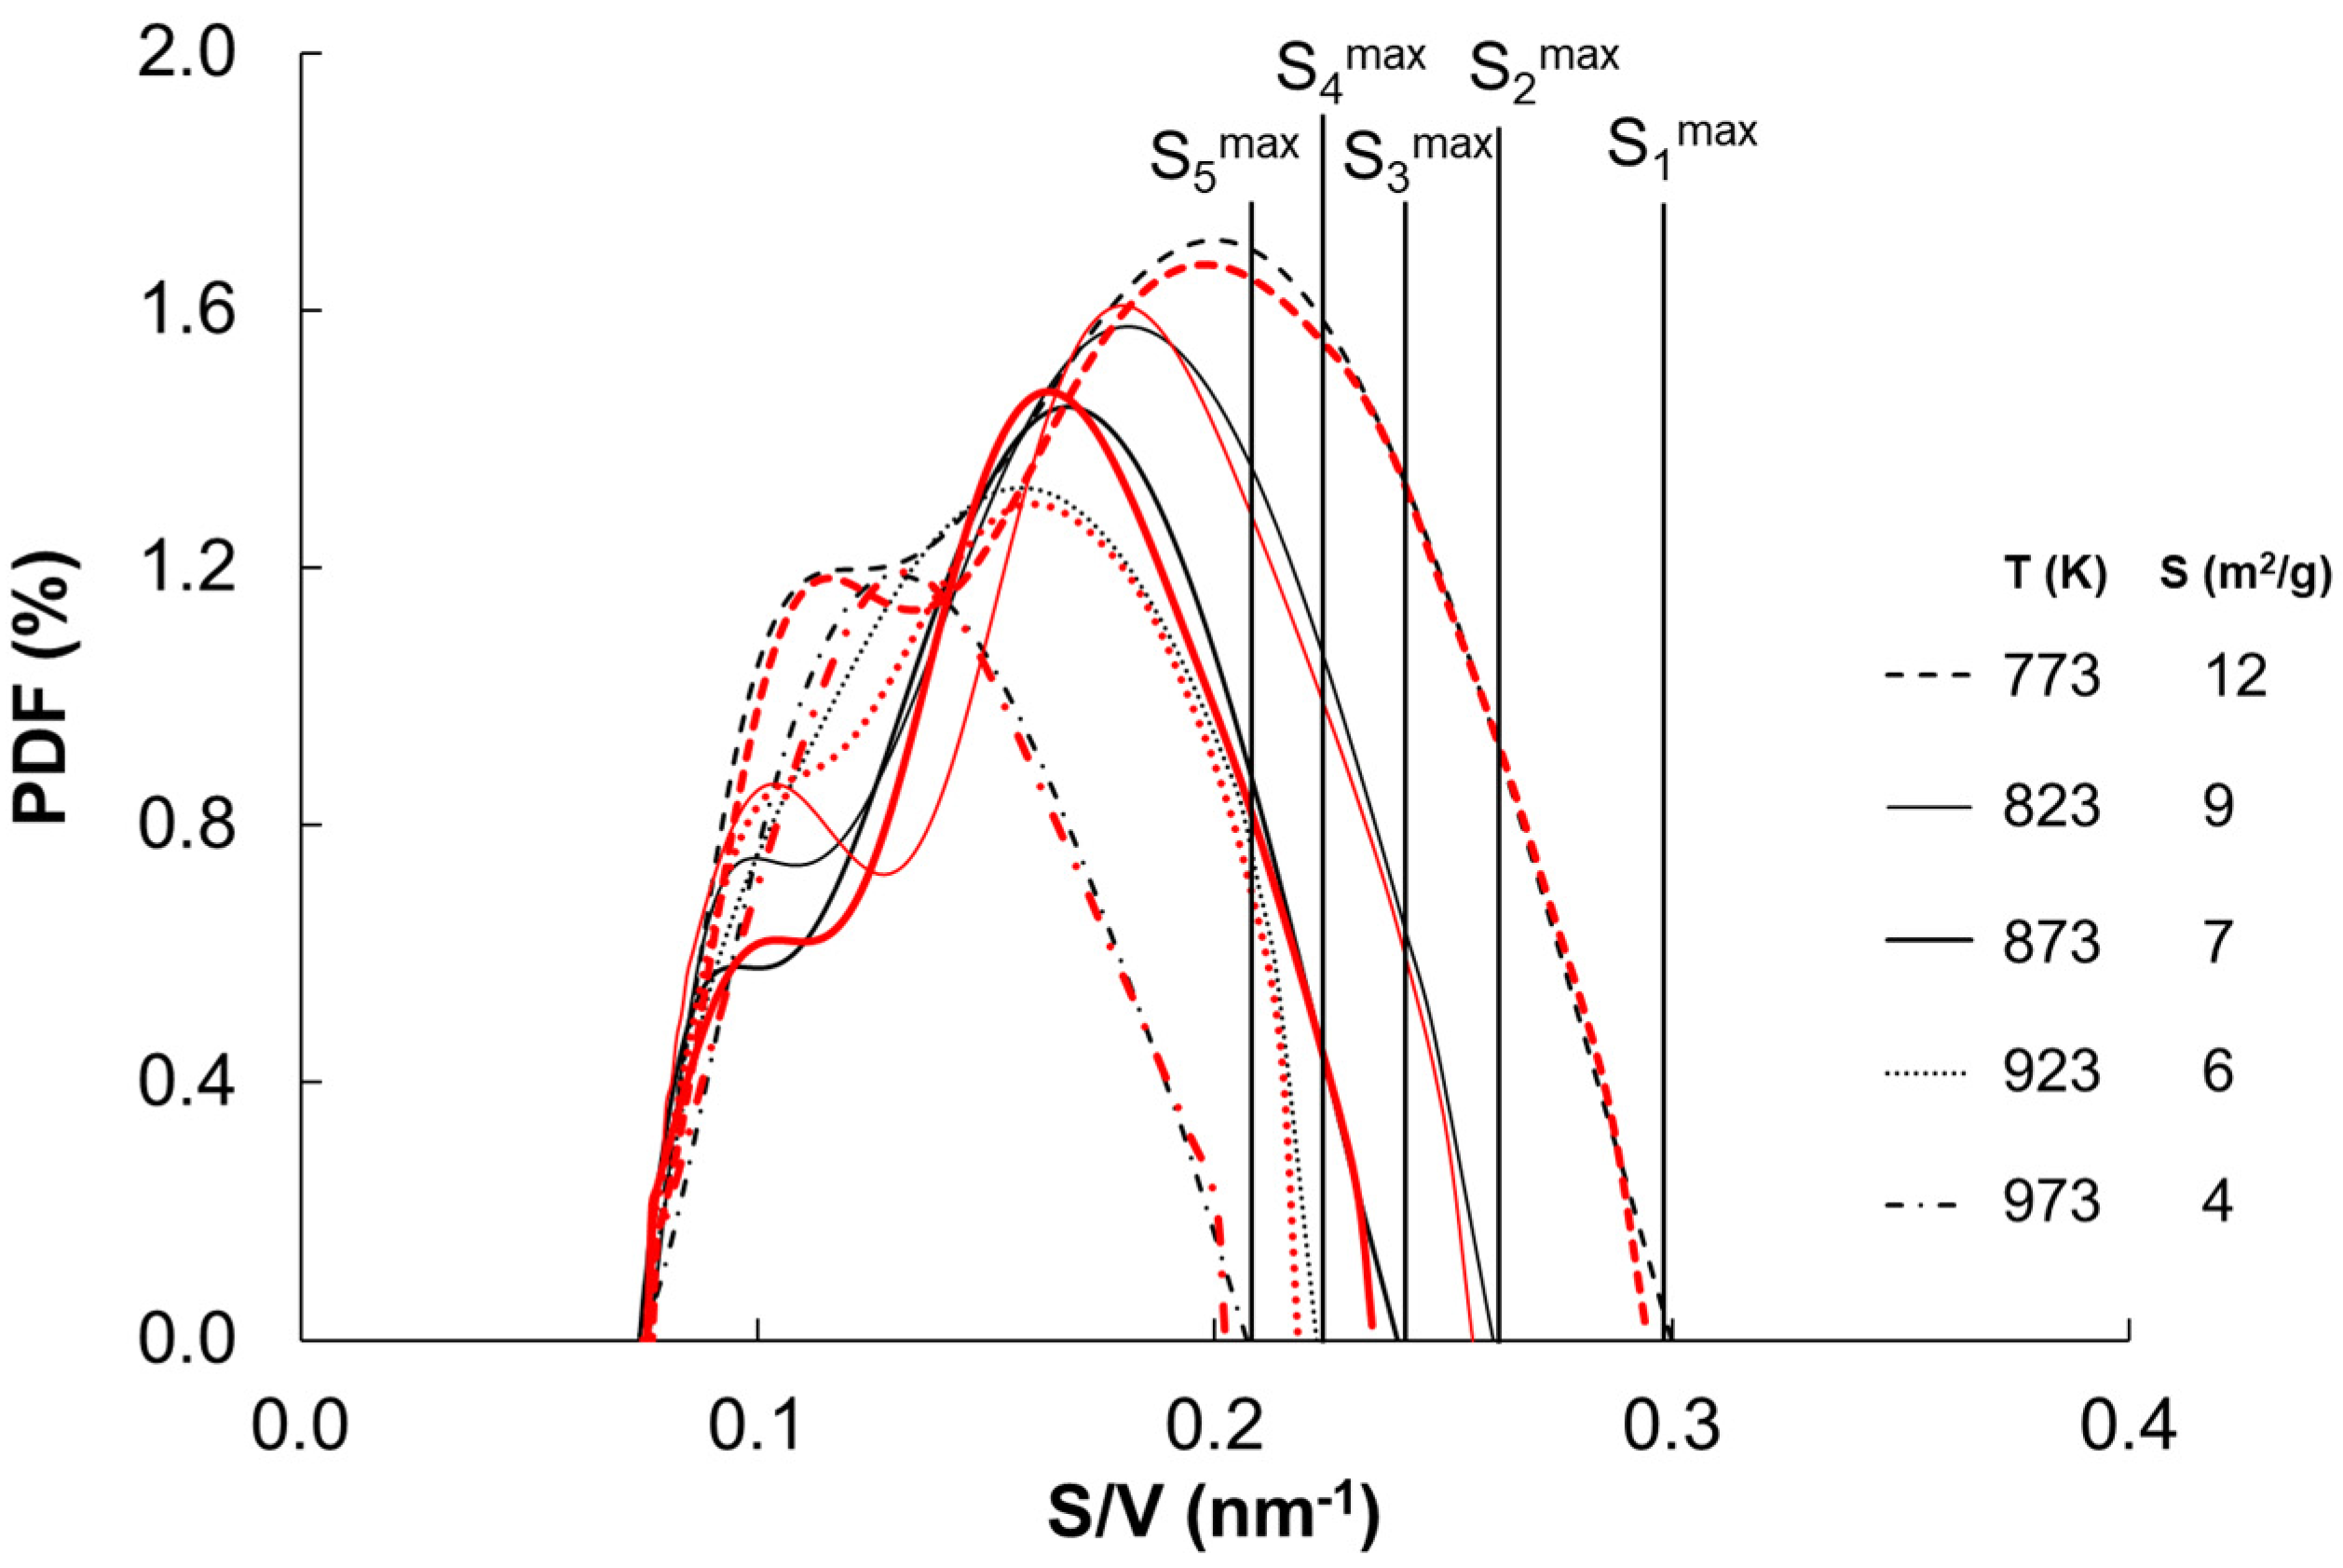
Figure 6.
Dependence of the specific surface Simax (nm−1), the active specific surface Aimax (nm−1) of the smallest nanocrystallite in the i-th sample; the specific surface S (nm−1), the active specific surface A (nm−1) and the ratio of the active area to the total area of the whole sample A/S on the temperature.

Table 1.
Results of measurements of the specific surface area and average size of nanocrystallites of samples reduced and annealed at temperatures of 773 to 993 K [28].
Table 1.
Results of measurements of the specific surface area and average size of nanocrystallites of samples reduced and annealed at temperatures of 773 to 993 K [28].
| Temperature (K) | Specific Surface Area (m2/g) | Average Size of Iron Nanocrystallites (nm) |
|---|---|---|
| 773 | 12.9 | 17 |
| 813 | 8.8 | 23 |
| 843 | 6.4 | 27 |
| 933 | 5.9 | 35 |
| 993 | 3.2 | 43 |
Table 2.
Enthalpies of formation of oxides Fe3O4, CaO, K2O, Al2O3 and enthalpies of wetting of iron surface with oxides (under standard conditions).
Table 2.
Enthalpies of formation of oxides Fe3O4, CaO, K2O, Al2O3 and enthalpies of wetting of iron surface with oxides (under standard conditions).
| Substance | Enthalpy of Formation, ΔHform (kJ/mol) | Enthalpy of Formation with Respect to One Me-O Bond, ΔH*form (kJ/mol) | Wetting Enthalpy ΔHwet + ΔHFe(MexO)s (kJ/mol) |
|---|---|---|---|
| K2O | −363 | −182 | −50 |
| Fe3O4 | −1118 | −140 | 0 |
| Al2O3 | −1676 | −280 | 232 |
| CaO | −635 | −317 | 269 |
Table 3.
Values of thermodynamic parameters characterizing the sintering process for the smallest nanocrystallite of Simax and the total sample of S surface.
Table 3.
Values of thermodynamic parameters characterizing the sintering process for the smallest nanocrystallite of Simax and the total sample of S surface.
| Temperature | ΔG(Simax) | ΔG(S) | ΔH(Simax) | ΔH(S) | ΔS(Simax) | ΔS(S) |
|---|---|---|---|---|---|---|
| (K) | (kJ mol–1) | (kJ mol–1 K–1) | ||||
| 773 | −55 | −28 | 0.7 | 33.4 | 0.072 | 0.078 |
| 823 | −58 | −30 | ||||
| 873 | −60 | −33 | ||||
| 923 | −67 | −37 | ||||
| 973 | −71 | −45 | ||||
Disclaimer/Publisher’s Note: The statements, opinions and data contained in all publications are solely those of the individual author(s) and contributor(s) and not of MDPI and/or the editor(s). MDPI and/or the editor(s) disclaim responsibility for any injury to people or property resulting from any ideas, methods, instructions or products referred to in the content. |
© 2024 by the authors. Licensee MDPI, Basel, Switzerland. This article is an open access article distributed under the terms and conditions of the Creative Commons Attribution (CC BY) license (https://creativecommons.org/licenses/by/4.0/).
Share and Cite
MDPI and ACS Style
Arabczyk, W.; Pelka, R.; Jasińska, I.; Lendzion-Bieluń, Z. Thermodynamics of Iron Ammonia Synthesis Catalyst Sintering. Crystals 2024, 14, 188. https://doi.org/10.3390/cryst14020188
AMA Style
Arabczyk W, Pelka R, Jasińska I, Lendzion-Bieluń Z. Thermodynamics of Iron Ammonia Synthesis Catalyst Sintering. Crystals. 2024; 14(2):188. https://doi.org/10.3390/cryst14020188
Chicago/Turabian StyleArabczyk, Walerian, Rafał Pelka, Izabella Jasińska, and Zofia Lendzion-Bieluń. 2024. "Thermodynamics of Iron Ammonia Synthesis Catalyst Sintering" Crystals 14, no. 2: 188. https://doi.org/10.3390/cryst14020188
Note that from the first issue of 2016, this journal uses article numbers instead of page numbers. See further details here.