Article

Origin of Color and Spectral Characteristics of Nanhong Agate from Northeast Yunnan, China

1
Faculty of Land Resources Engineering, Kunming University of Science and Technology, Kunming 650093, China
2
Kunming Prospecting Design Institute of China Nonferrous Metals Industry Co., Ltd., Kunming 650051, China
3
Yunnan Provincial Key Laboratory of Geotechnical Engineering and Geological Hazards, Kunming 650051, China
4
China ENFI Engineering Technology Co., Ltd., Beijing 100038, China
5
Analytic & Testing Research Center of Yunnan, Kunming 650093, China
6
Research Center for Analysis and Measurement, Kunming University of Science and Technology, Kunming 650093, China
*
Authors to whom correspondence should be addressed.
Crystals 2024, 14(4), 388; https://doi.org/10.3390/cryst14040388
Submission received: 13 March 2024 / Revised: 17 April 2024 / Accepted: 19 April 2024 / Published: 22 April 2024
(This article belongs to the Section Mineralogical Crystallography and Biomineralization)

Abstract

:
Nanhong agate has attracted public attention as the most distinctive gemstone in China. Owing to the limited data on Nanhong agates from a new production area in northeastern Yunnan, this paper presents the first data from gemological studies on these agates. Complex investigations using Fourier-transform infrared (FTIR) spectrometry, ultraviolet–visible (UV–VIS) luminescence spectrometry, Raman spectroscopy, polarizing microscopy, scanning electron microscopy (SEM), electron microprobe (EPMA), and laser ablation–inductively coupled plasma mass spectrometry (LA-ICP-MS) analyses were carried out to obtain basic data concerning the gemological properties, microstructure, and spectroscopic and geochemical characteristics of this interesting material. The results illustrate that Nanhong agates from northeastern Yunnan are mainly composed of α-quartz and also contain certain amounts of moganite, illite, goethite, and hematite. The typical red (yellow) and white appearance can be attributed to the microstructure of the agates, the contents of Fe and Al impurities, and trace elements. The Raman spectra, microstructure, and chemical composition of the unique “yellow-skinned” agates from northeastern Yunnan are significantly different from those of other types of Nanhong agate. This work lays a foundation for the future identification and research of this type of Nanhong agate.

1. Introduction

Nanhong agate, originating from the Baoshan region in Yunnan Province, China, has historically been a cherished gemstone with profound cultural significance. Nanhong agate is a reddish agate found in southern China. With the industry’s growth, Nanhong agate from Liangshan, Sichuan Province, China, has gained visibility. Northeastern Yunnan, a newly identified region with significant potential for Nanhong agate production, is recognized for its abundant resources and their superior quality, positioning it as a new production hub. The “yellow-skinned” variety from this region currently leads the market due to its distinctiveness and high quality.
We define agate as banded chalcedony [1,2]. It is loved for its colorfulness and unpredictable strips. Its main chemical component is SiO2, its main mineral component is α-quartz, and it also contains other phases of SiO2, such as chalcedony, moganite, and opal [3,4,5,6,7,8,9,10]. Different internal microstructures may produce different macroscopic strips, with variations in crystal particle size, microstructure, and pore distribution [11,12]. When agate contains other mineral impurities, it will show different colors [1,2,13,14,15]. According to previous research, the red color of agate is mainly caused by Fe compounds in the form of inclusions [16,17,18,19,20], while the red color of Nanhong agate is caused by inclusions. The red coloration in Nanhong agate is primarily due to hematite inclusions, while the yellow coloration is mainly attributed to goethite inclusions [6,21,22].
Regarding the research on red agate, previous researchers have focused on the Beihong agate from Heilongjiang, China [7,17], the Zhanguohong agate from Xuanhua, Hebei [20,23], and Nanhong agates from the Baoshan area of Yunnan Province [24,25,26] and the Liangshan area of Sichuan Province [27,28,29]; however, there have been few studies on the Nanhong agate from northeast Yunnan, a new source considered in this article. The gemology, spectroscopy, microstructure, and geochemical characteristics of the Nanhong agate in the area were studied, and the coloration mechanisms causing red, white, yellow, and “jelly” materials were preliminarily explored.

2. Materials and Methods

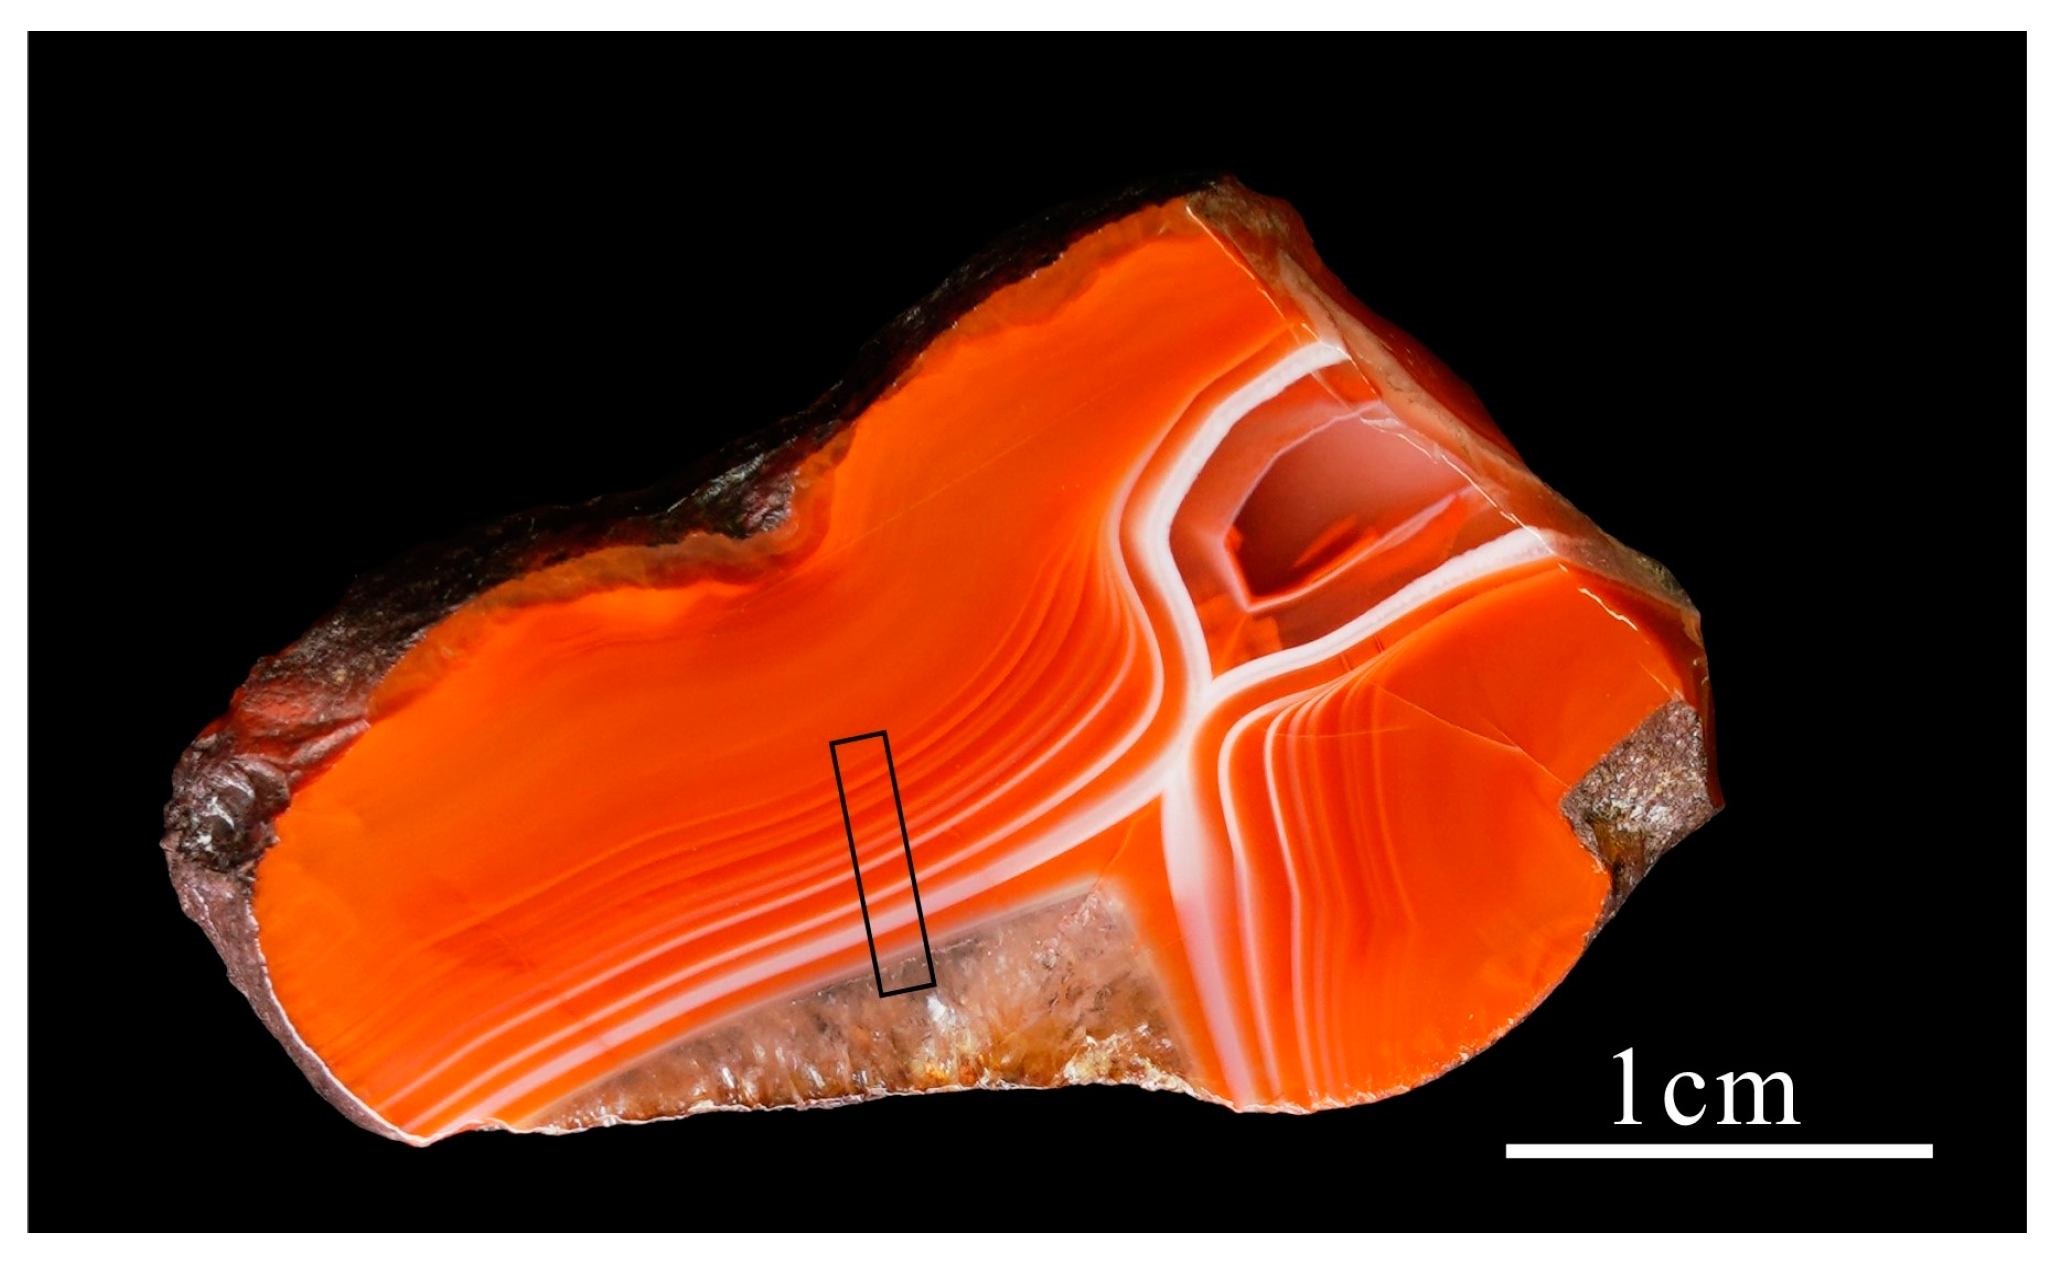
2.1. Sample Materials

In this study, we collected a large number of raw samples of Nanhong agate from northeast Yunnan. It was observed that the agate predominantly exhibited an egg-shaped or irregular spherical morphology, with relatively small sizes (mostly less than 5 cm). The color distribution range was extensive, primarily encompassing red, yellow, white, and colorless hues. Based on visual observations and comprehensive analyses considering different colors and strip characteristics, we selected the three most representative samples for further analysis (Figure 1). DNH1 was obtained from Zhaoyang District, Zhaotong City, Yunnan Province; DNH2 was obtained from Huize County, Qujing City; and DNH3 was obtained from Qiaojia County, Zhaotong City.

2.2. Methods

For gemological characterization, we selected samples and prepared them into slices of approximately 1–3 mm thickness with both sides polished parallel. We proceeded with basic gemological analysis, including refractometer readings for refractive index, Mohs hardness pencil for hardness assessment, static water weighing for relative density, and UV light for fluorescence response. Further, we employed a Leica M205A stereomicroscope with an integrated camera to observe and photograph magnified internal features of the samples.
For infrared spectrum analysis, we used a Thermo NICOLET iS50 Fourier-transform infrared spectrometer for diffuse reflection and transmission analysis. The diffuse reflection accessory uses UpIR produced by Pike, and the transmission accessory uses the KBr transmission accessory produced by Thermo for direct transmission analysis. The analytical conditions were as follows: The number of scans was 8, the resolution was 4 cm−1, the gain was 2, the moving mirror speed was 0.4747, and the aperture was 80. The collection range of diffuse reflection was 400–4000 cm−1. The transmission collection range was 400–6000 cm−1, the temperature was 20 °C, and the humidity was 52%. The analyses were carried out at the Kunming University of Science and Technology Analysis and Testing Research Center.
For ultraviolet–visible spectral analysis, the analysis instrument was a Skyray UV100 spectrometer, and the analysis conditions were as follows: the spectral range was 200–1000 nm, the integration time was 100 ms, and the smoothing width was 5. The analyses were carried out at the Kunming University of Science and Technology Analysis and Testing Research Center.
For Raman spectrum analysis, the analytical instrument model used was the LabRAM HR Evolution Raman spectrometer from HORIBA, France. The laser light source wavelength was 532 nm, the output power was 12.5 mW, the wavenumber range was 100–4000 cm−1, the resolution was 1 cm−1, the number of integrations was 5, and the detection time was 5 min. The analyses were carried out at the Kunming University of Science and Technology Analysis and Testing Research Center.
For the observation of thin rock sections, we first prepared thin sections from the samples with a standard thickness of 0.03 mm without adding a cover glass, polished the surface, and then used an OLYMPUS BX51 polarizing microscope to observe the samples using multiple light illumination methods, including transmission, reflection, and oblique illumination.
For micromorphological observations, the instrument used was a Japanese SU8100 high-resolution field-emission scanning electron microscope. Before the experiments, we took the fresh fracture surface of the analysis sample and sprayed it with platinum. The analytical conditions were as follows: voltage 1.5 kV, beam spot size 3 μm, magnification 2500~20,000×, and working distance 1.5 mm. After selecting a specific area under the scanning electron microscope, a semi-quantitative component analysis was performed using the main accessory, an energy-dispersive X-ray spectrometer (EDS). The analyses were carried out at the Kunming University of Science and Technology Analysis and Testing Research Center.
The main chemical components were analyzed using a JXA-8230 electronic probe. Before analysis, the samples were made into 0.04 mm thick probe sheets and sprayed with carbon. The analytical conditions were as follows: accelerating voltage 15 kV, accelerating current 20 nA, and beam spot diameter 10 μm; all analysis data were subjected to ZAF correction processing. The analyses were carried out at Wuhan Shangpu Analysis Technology Co., Ltd. (Wuhan, China).
Trace element analyses of the agates were carried out via laser ablation ICP-MS (LA-ICP-MS). The primary analysis device was an Agilent 7900 Plasma Mass Spectrometer, and the laser ablation system used for the analyses was the GeoLas HD, with a laser wavelength of 193 nm. The analytical conditions were as follows: laser energy 80 mJ, frequency 5 Hz, and laser spot diameter 44 µm. The reference samples were NIST 610, BHVO-2G, BIR-1G, BCR-2G, and GSE-1G, all of which are international standard materials. The analyses were carried out at Wuhan Shangpu Analysis Technology Co., Ltd.

3. Results and Discussion

3.1. Gemological Characteristics

The color of Nanhong agate from northeastern Yunnan is relatively bright and ranges from yellow to bright red. The fresh sections mostly have a greasy luster, and after polishing, they have a glassy luster. The agate has low transparency, a refractive index of about 1.54, a Mohs hardness of 7, and a relative density of 2.63. DNH1 is bright red in appearance, with red and white bandings in the middle and large quartz particles inside, which are fluorescence-inert. DNH2 is opaque on the outside and appears persimmon red, with high transparency on the inside; it is called “jelly” on the market, and part of the sample appears yellow-green under ultraviolet fluorescence (LW). DNH3 is the “yellow-skinned” variety unique to northeast Yunnan; it is characterized by yellow on the outside and bright red on the inside, and its fluorescence is inert.

3.2. Spectral Characteristics

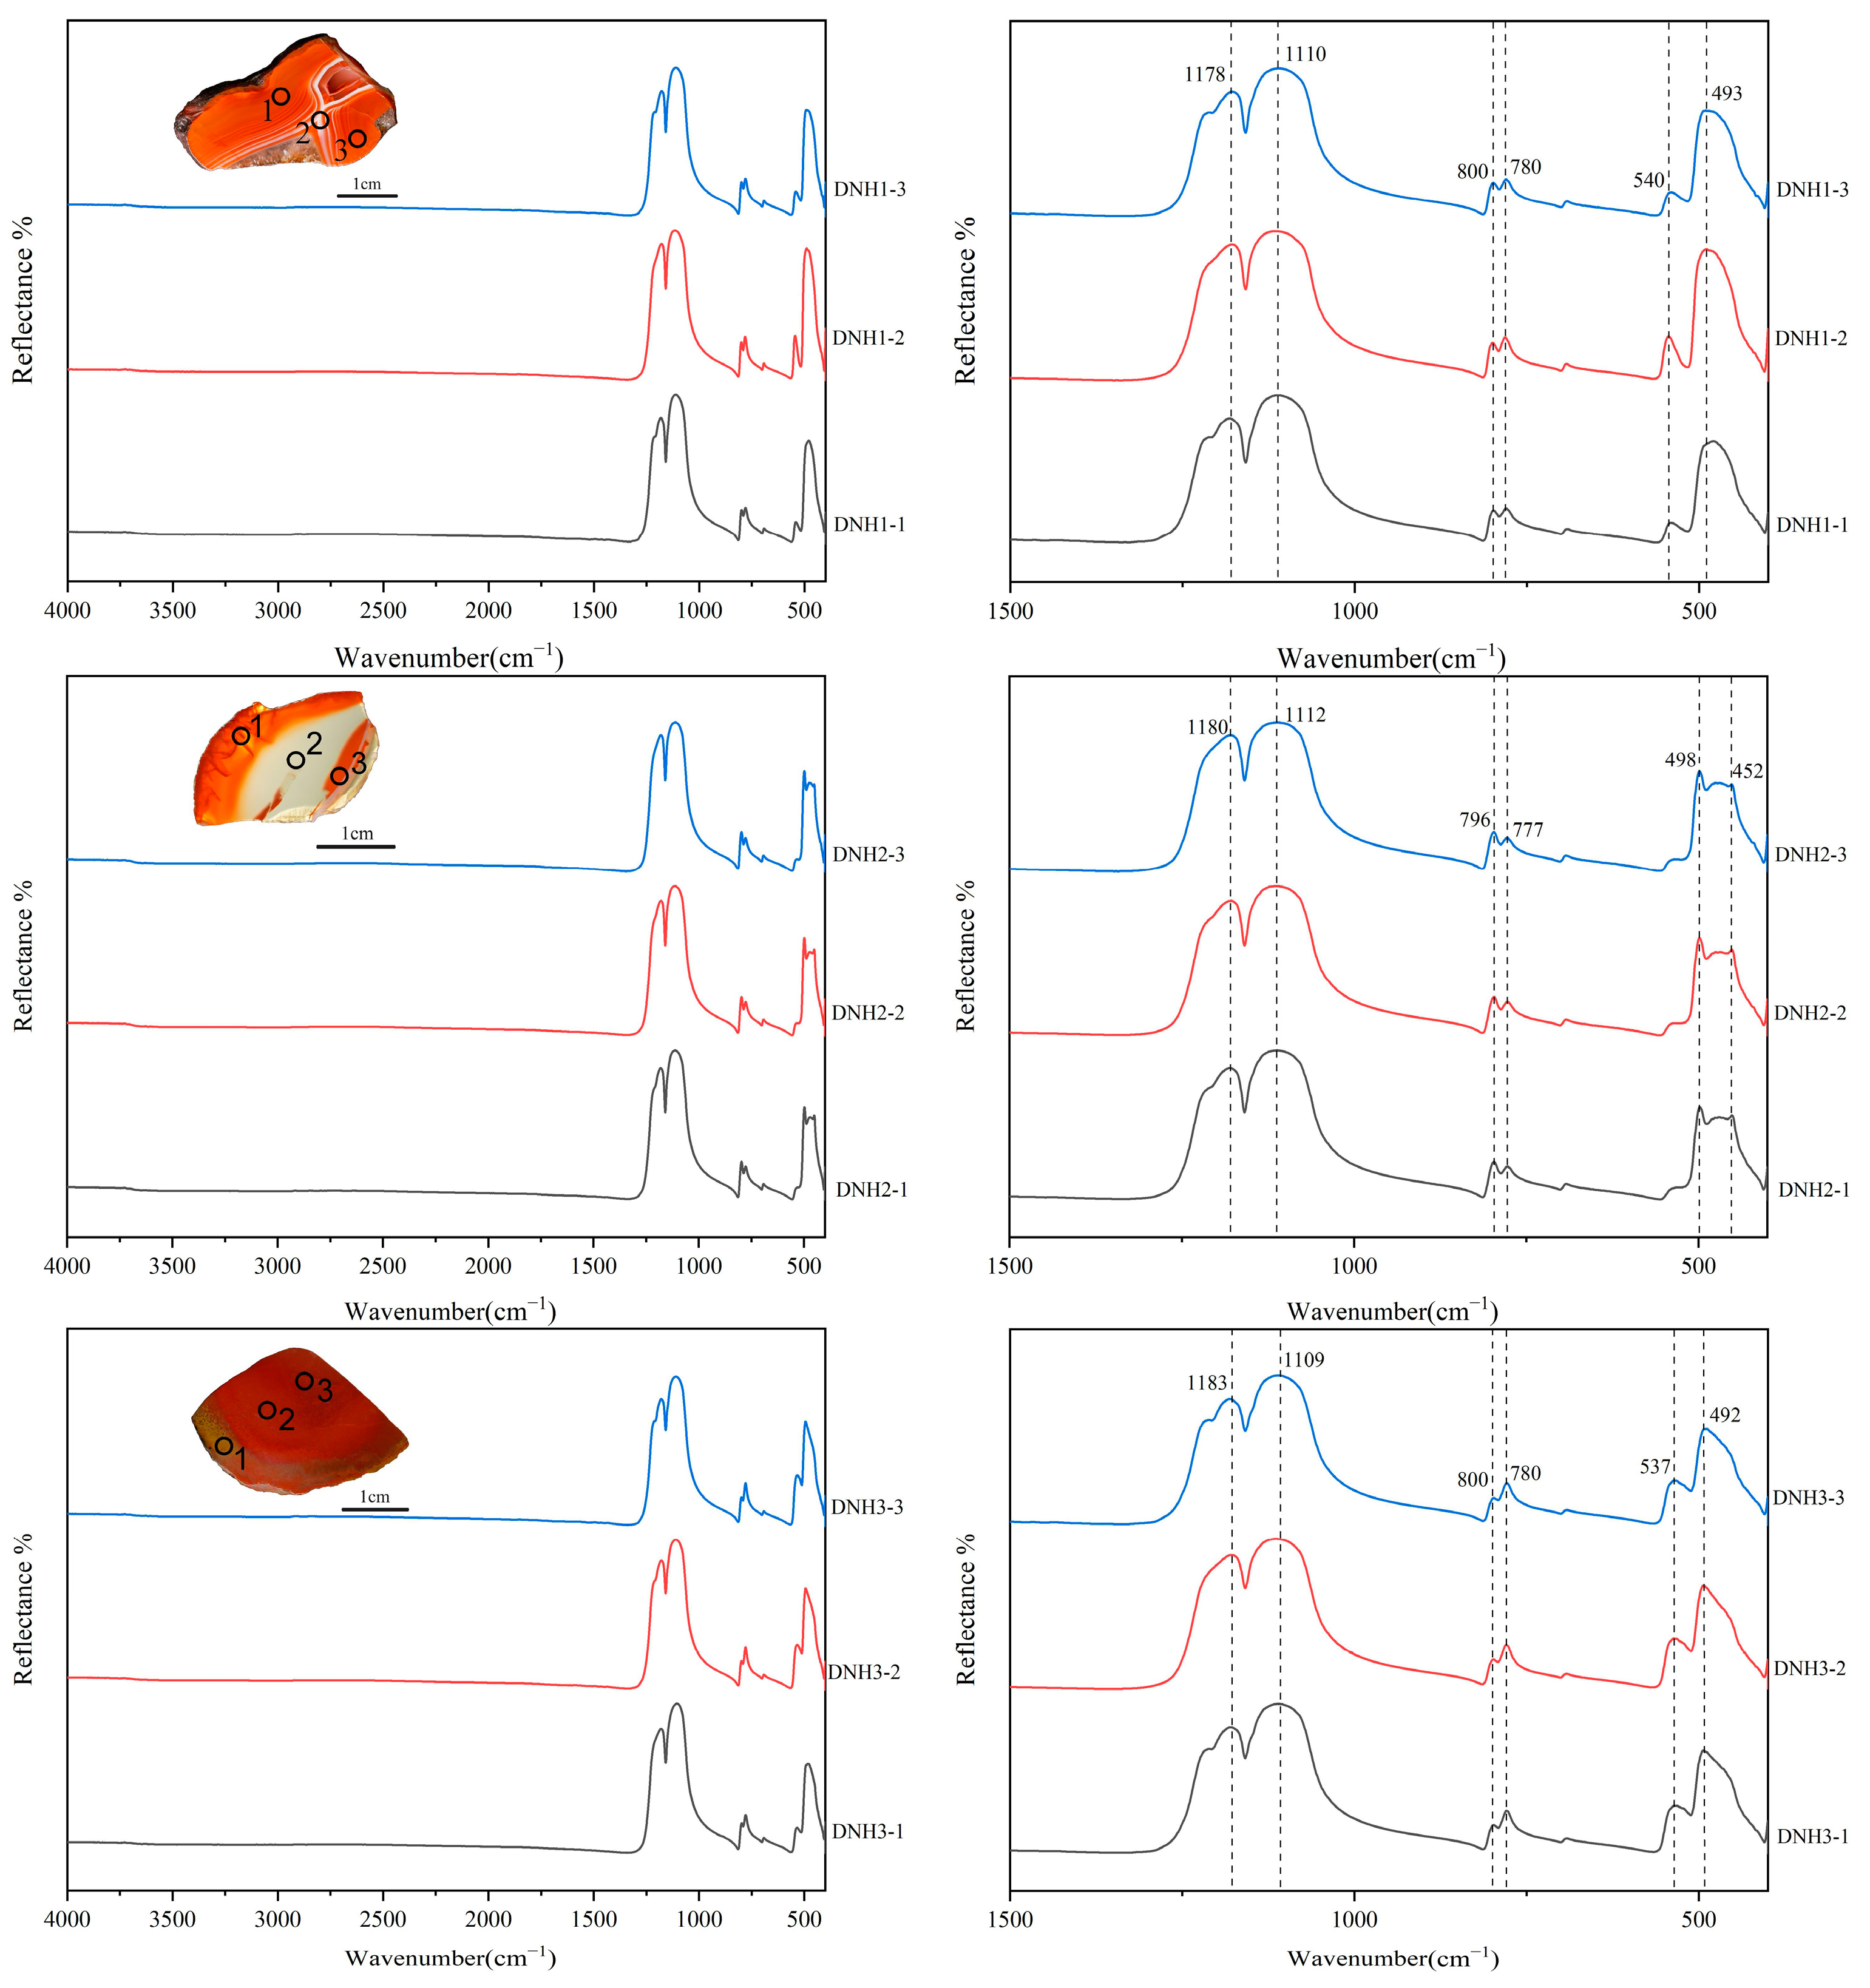
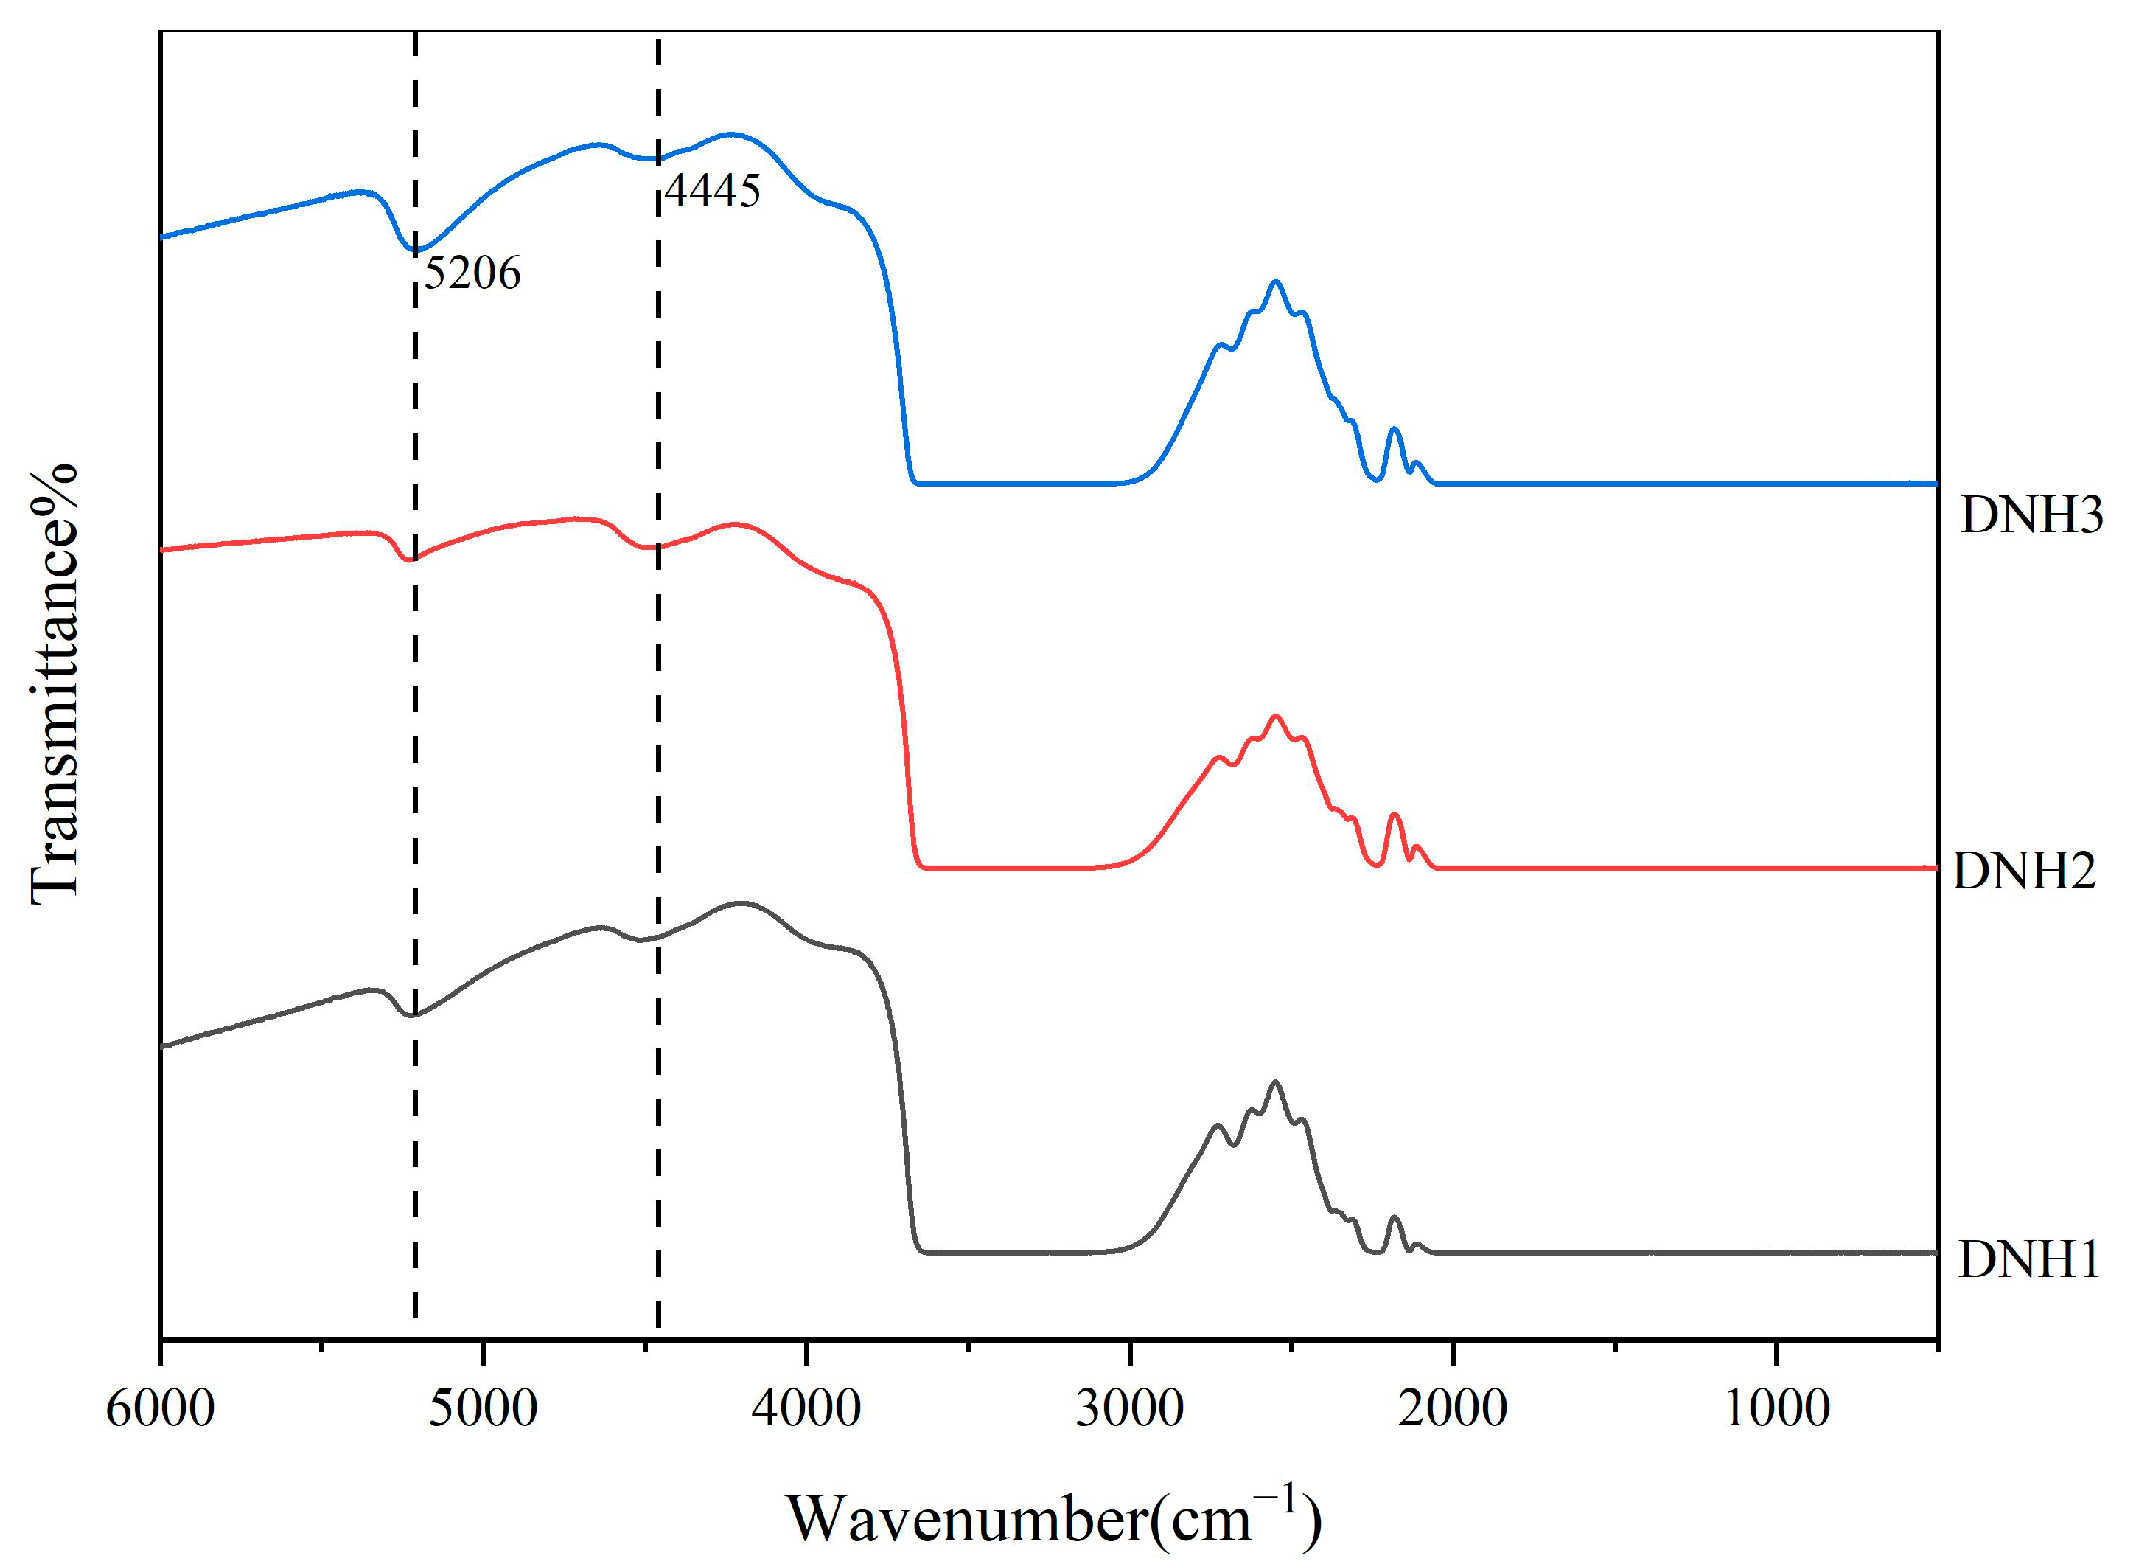
3.2.1. Infrared Spectra

Diffuse Reflection

We analyzed samples DNH1–DNH3, selecting three different parts of each sample, for a total of nine experimental data. In terms of spectral characteristics, the infrared reflection and absorption spectra of different parts of the three samples showed a similar shape. The infrared absorption spectrum diffuse reflection analysis of the three samples showed that the main absorption peaks of the Nanhong agate from northeast Yunnan are 1180, 1110, 800, 780, 537, and 492 cm−1, consistent with the characteristic absorption peaks of α-quartz [30]. The infrared reflection spectra showed a strong reflection band in the range of 1200–900 cm−1, which belongs to Si-O asymmetric stretching vibration. The characteristic absorption peaks at 800–600 cm−1 belong to Si-O-Si symmetric stretching vibration and are characteristic peaks of quartz, the intensity of which depends on the angle between incident infrared light and the C-axis of quartz. The reflection peak located in the range of 600–300 cm−1 is the Si-O bending vibration band and is the second-strongest absorption peak in the absorption spectrum [31]. The infrared reflection patterns of the three samples were consistent with the infrared reflection patterns of α-quartz (Figure 2), so it can be concluded that the Nanhong agate from northeast Yunnan is composed of α-quartz.

Transmission

An infrared transmission experiment was conducted on the three samples, and the results were as follows: All three samples showed infrared transmission spectrum characteristics between cryptocrystalline and phanerocrystalline. When the quartz particle size ranges from tens of microns to sub-millimeter—that is, when the quartz is in the form of a cryptocrystalline phaneromer—the amount of mineral interstices per unit thickness and the concentration of water deposited are between those of aphanitic quartz and phanerocrystalline quartz aggregates (this conclusion is verified by the SEM results in Section 3.3), and its infrared transmission spectrum (the band associated with the above factors) appears as a transitional form of the spectrum of aphanocrystalline quartz and phanerocrystalline quartz assemblages (Figure 3). Therefore, the internal structure of the Nanhong agate from northeast Yunnan is both cryptocrystalline and phanerocrystalline.

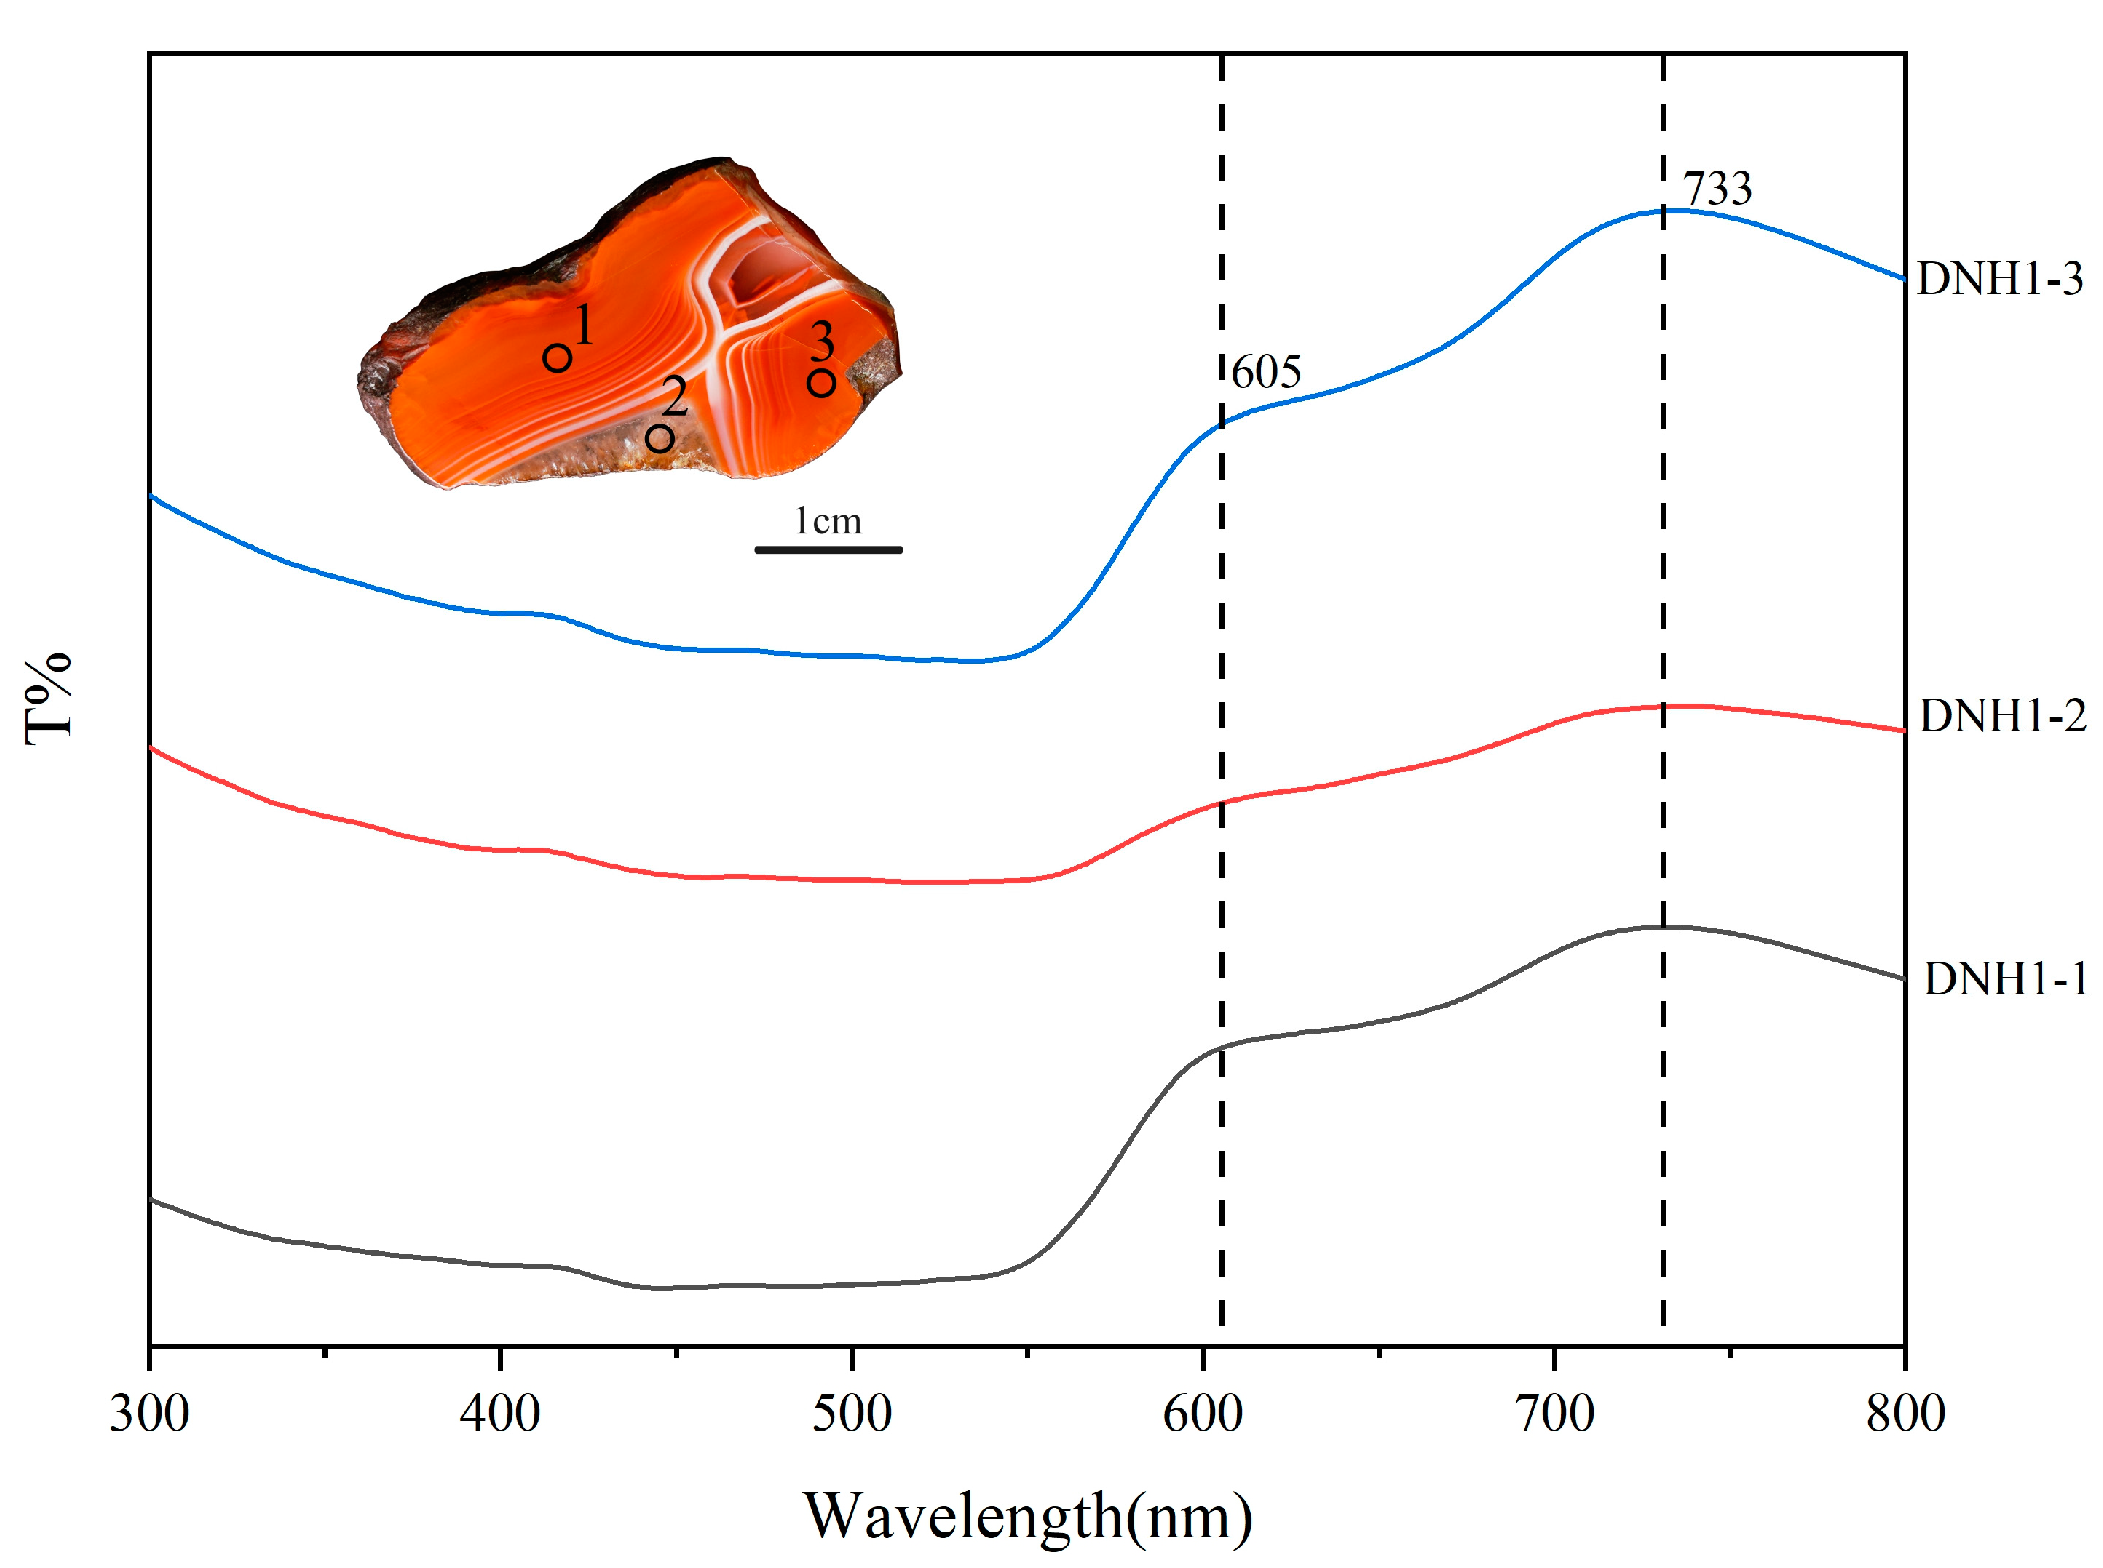
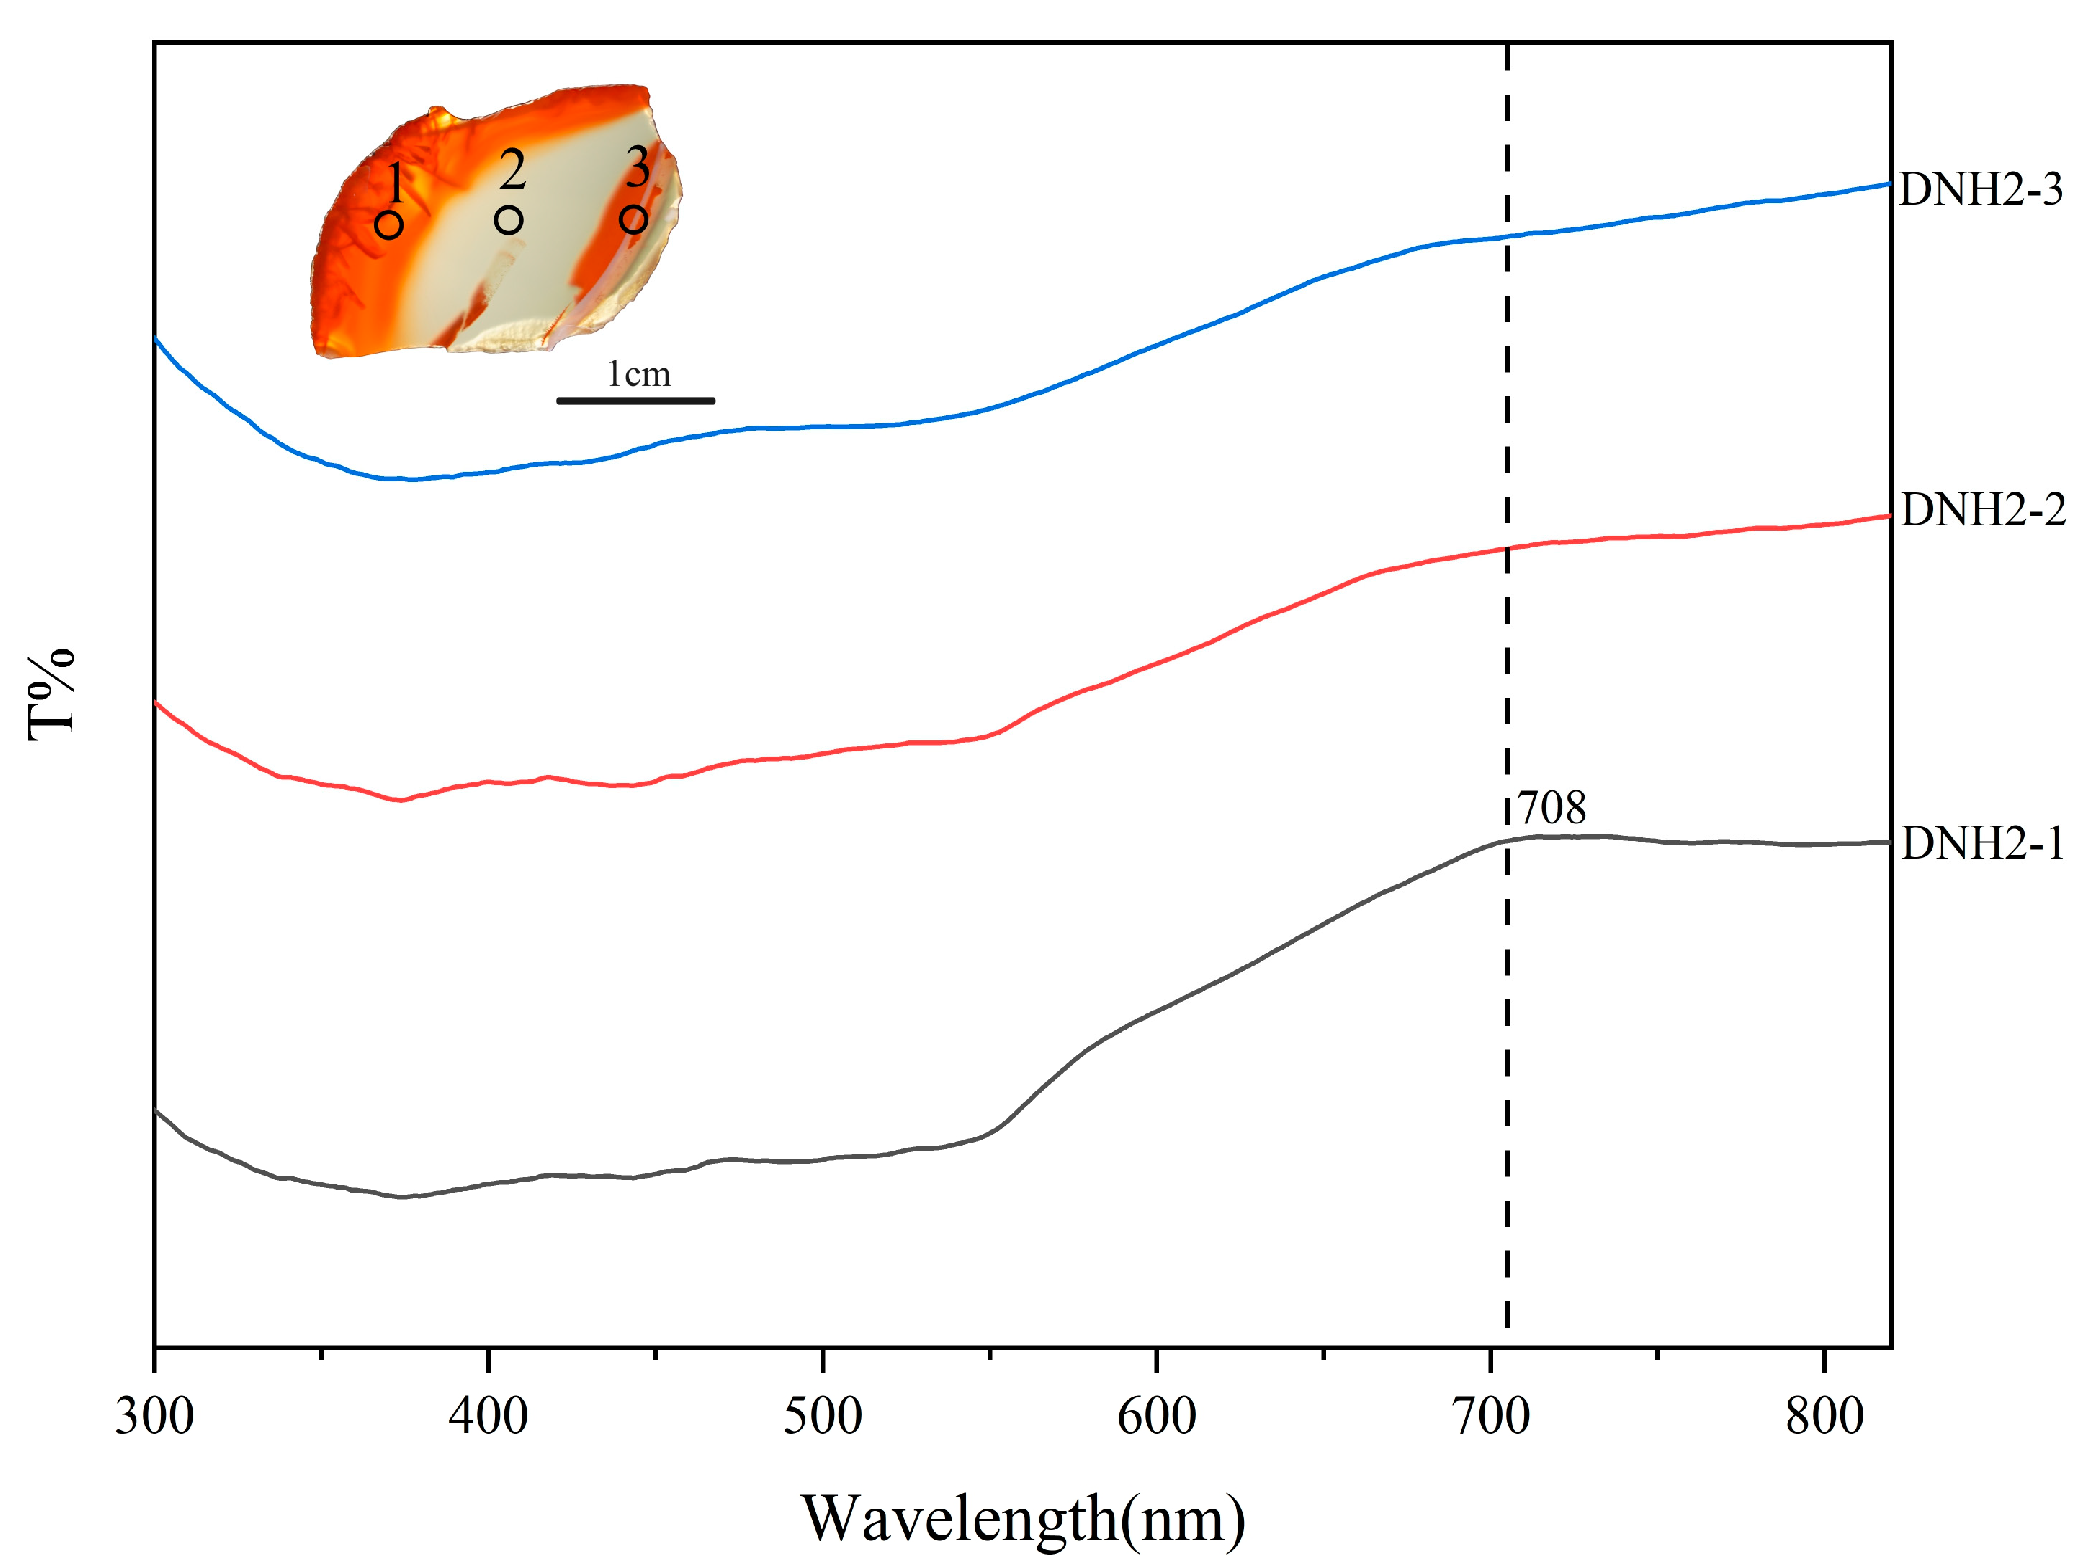
3.2.2. UV–VIS Spectra

The UV–visible spectrophotometry results showed that different-colored areas correspond to different characteristic peaks.
Points 1 and 3 on sample DNH1 have a broad reflection band at 605~733 nm (Figure 4), which is a superimposed peak of yellow and red. The intensity of the red absorption peak is higher than that of the yellow one, and the overall color is red. Point 2 is located in the large crystal quartz area and is generally colorless.
Point 1 on sample DNH2 has a broad absorption band at 708 nm (Figure 5), which is located in the red light area and appears “persimmon red”; points 2 and 3 are located in the more transparent area of the sample, with similar spectral shapes, and the overall appearance is colorless.
According to the spectrum (Figure 6), sample DNH3 generally has a broad reflection band from the orange light area to the red light area, and the overall color is red. The three points on sample DNH3 correspond to the three different colors observed—yellow, persimmon red, and bright red—and their UV–visible absorption spectrum characteristics are also different. Point 1 has an obvious characteristic peak at 612 nm in the orange light area, its intensity is greater than that in the red light area, and the overall color is orange-red and yellow; the intensity of the reflection peak of point 2 is essentially the same in the orange light area and the yellow light area, and it appears “persimmon red”; point 3 has reflection peaks in both the yellow and red light areas, but the intensity of the reflection peak in the red light area at 732 nm is much greater than that in the orange light area, and it appears “bright red”. Based on the reflection peak wavelength and intensity, the color of Nanhong agate can be qualitatively analyzed. The UV-VIS spectrum of Nanhong agate features a broad absorption band, with the location of its main absorption peak determining the primary color series of the agate.

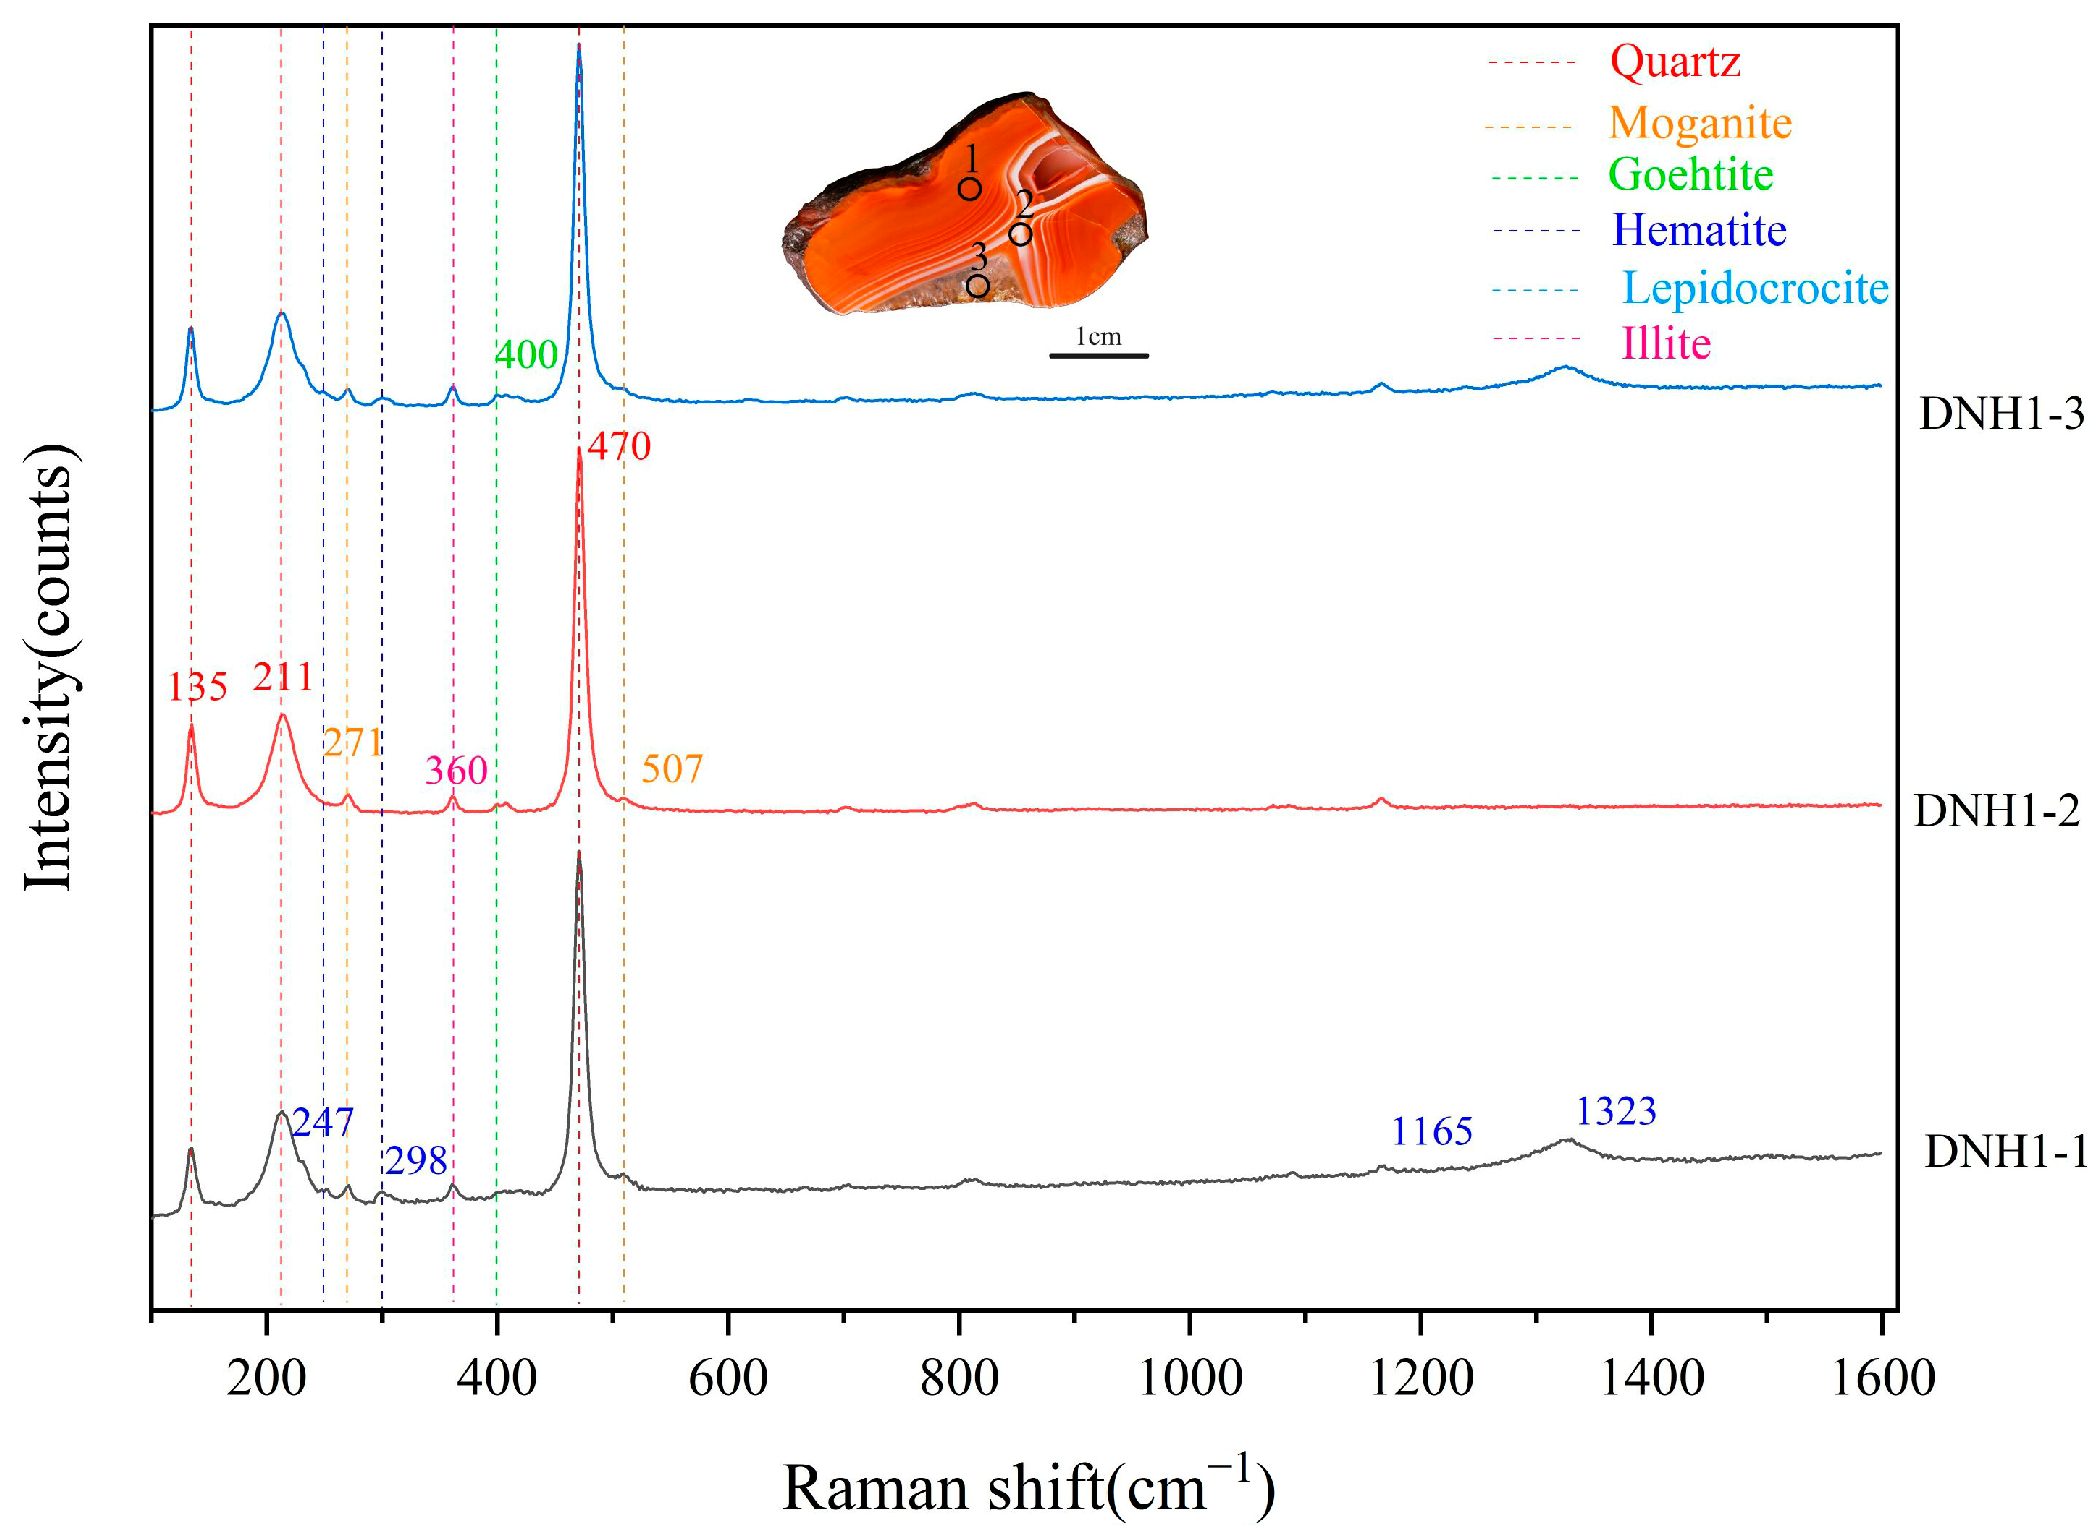
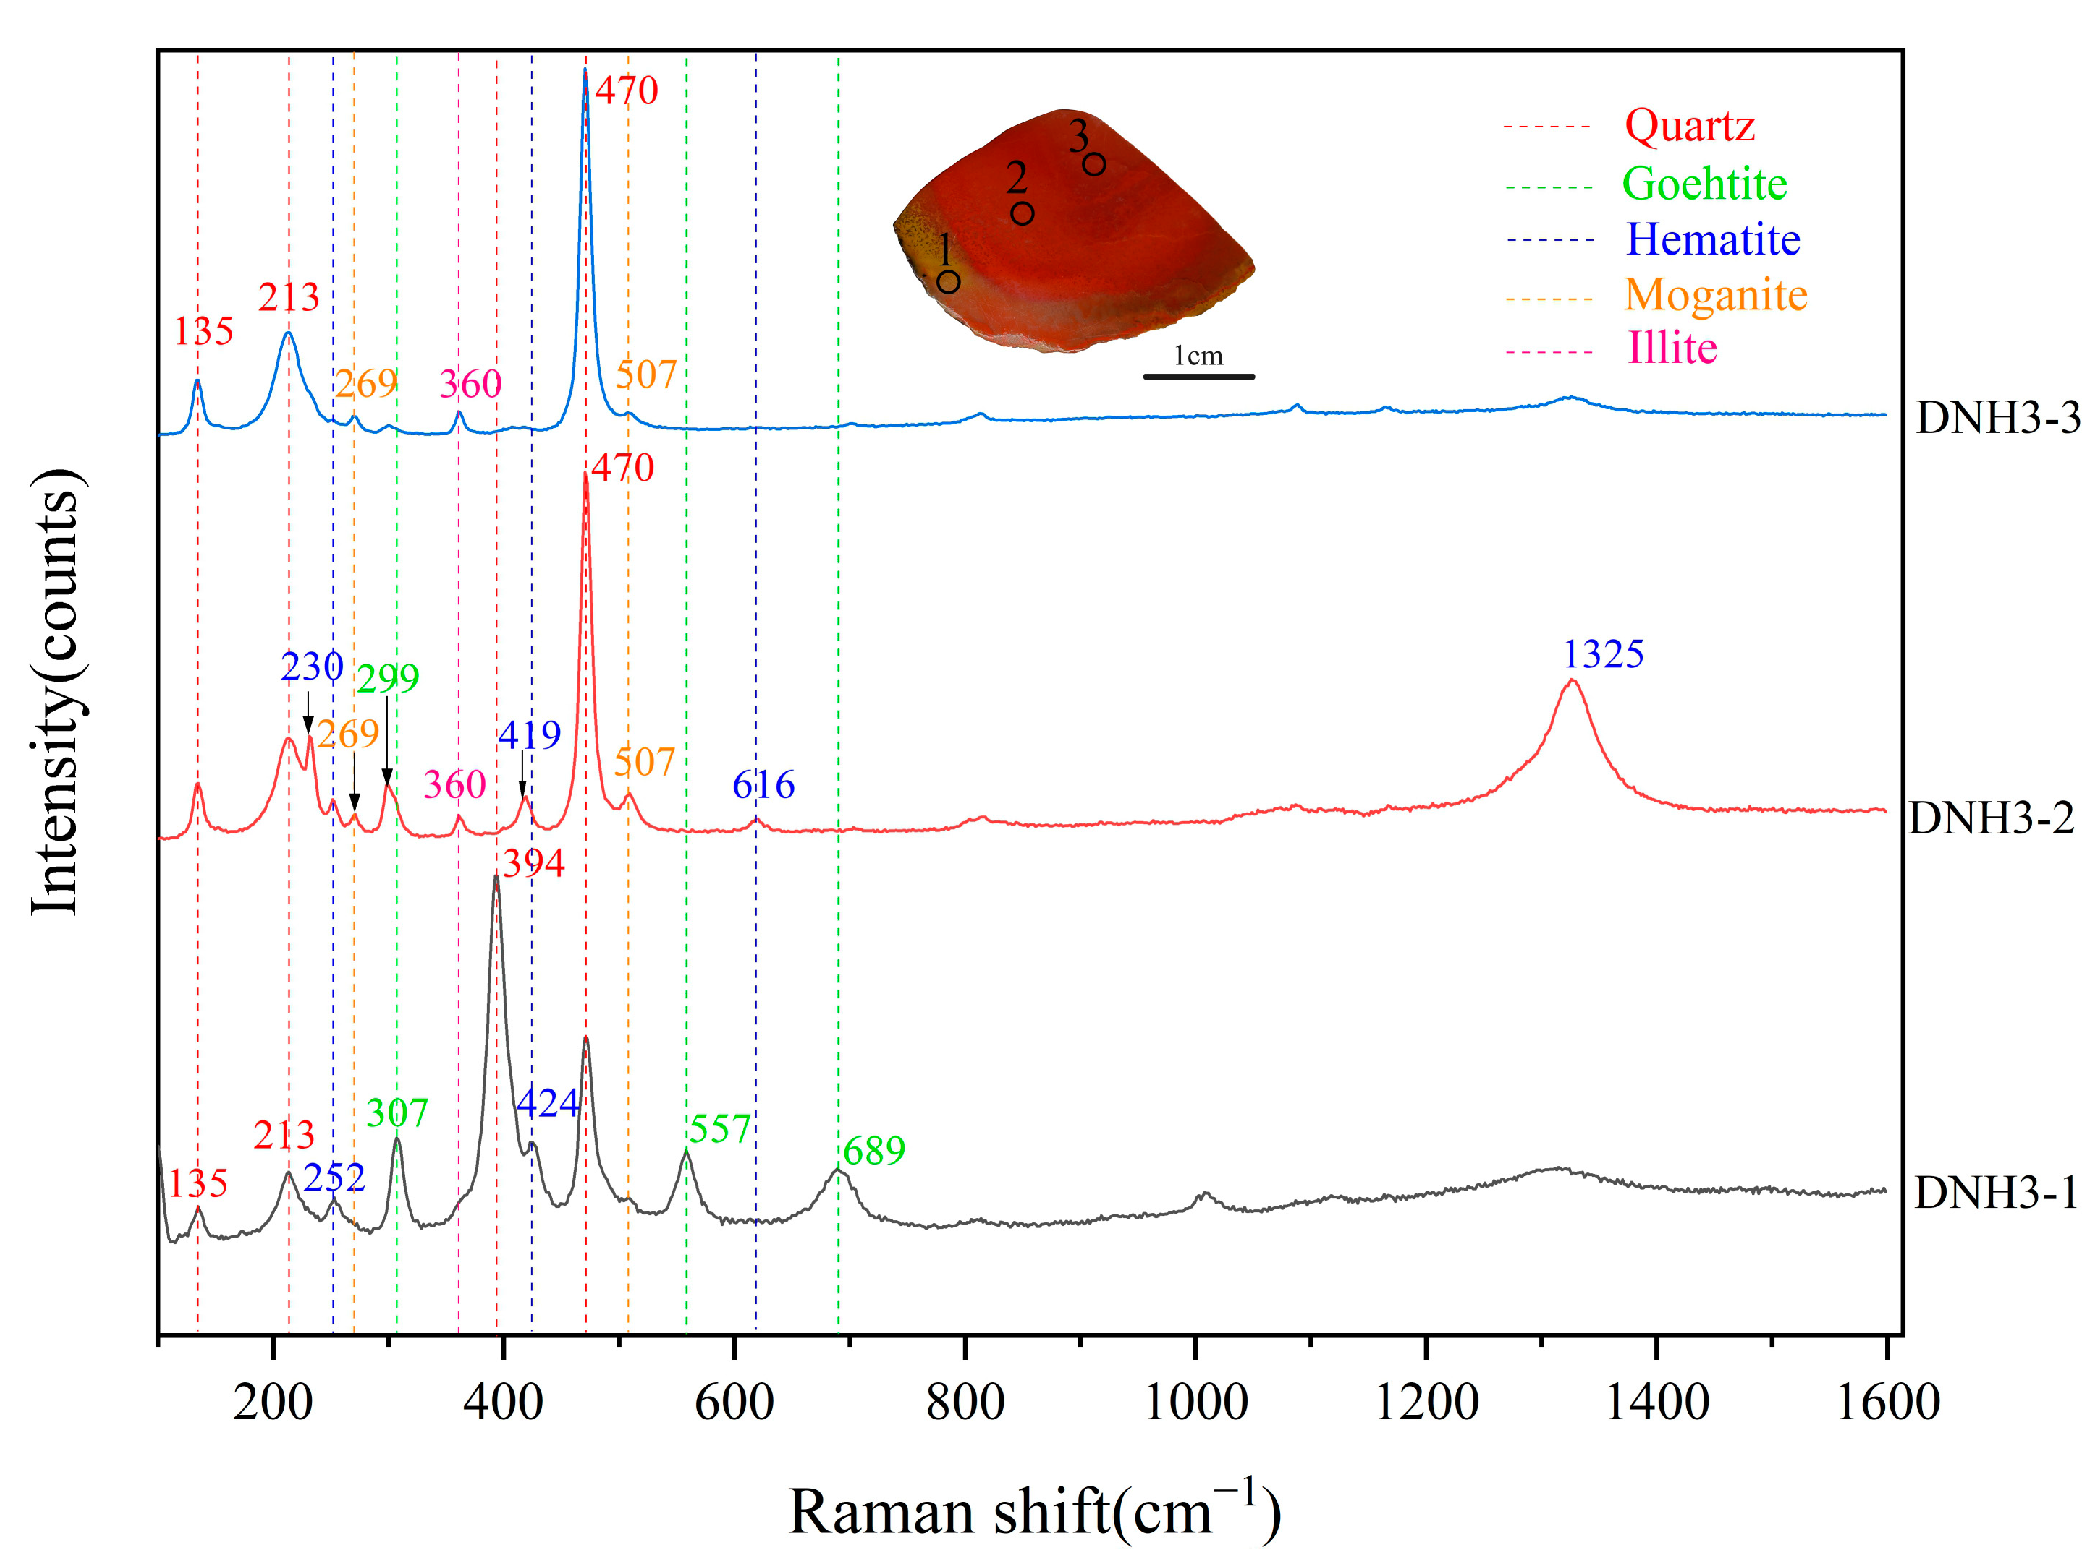
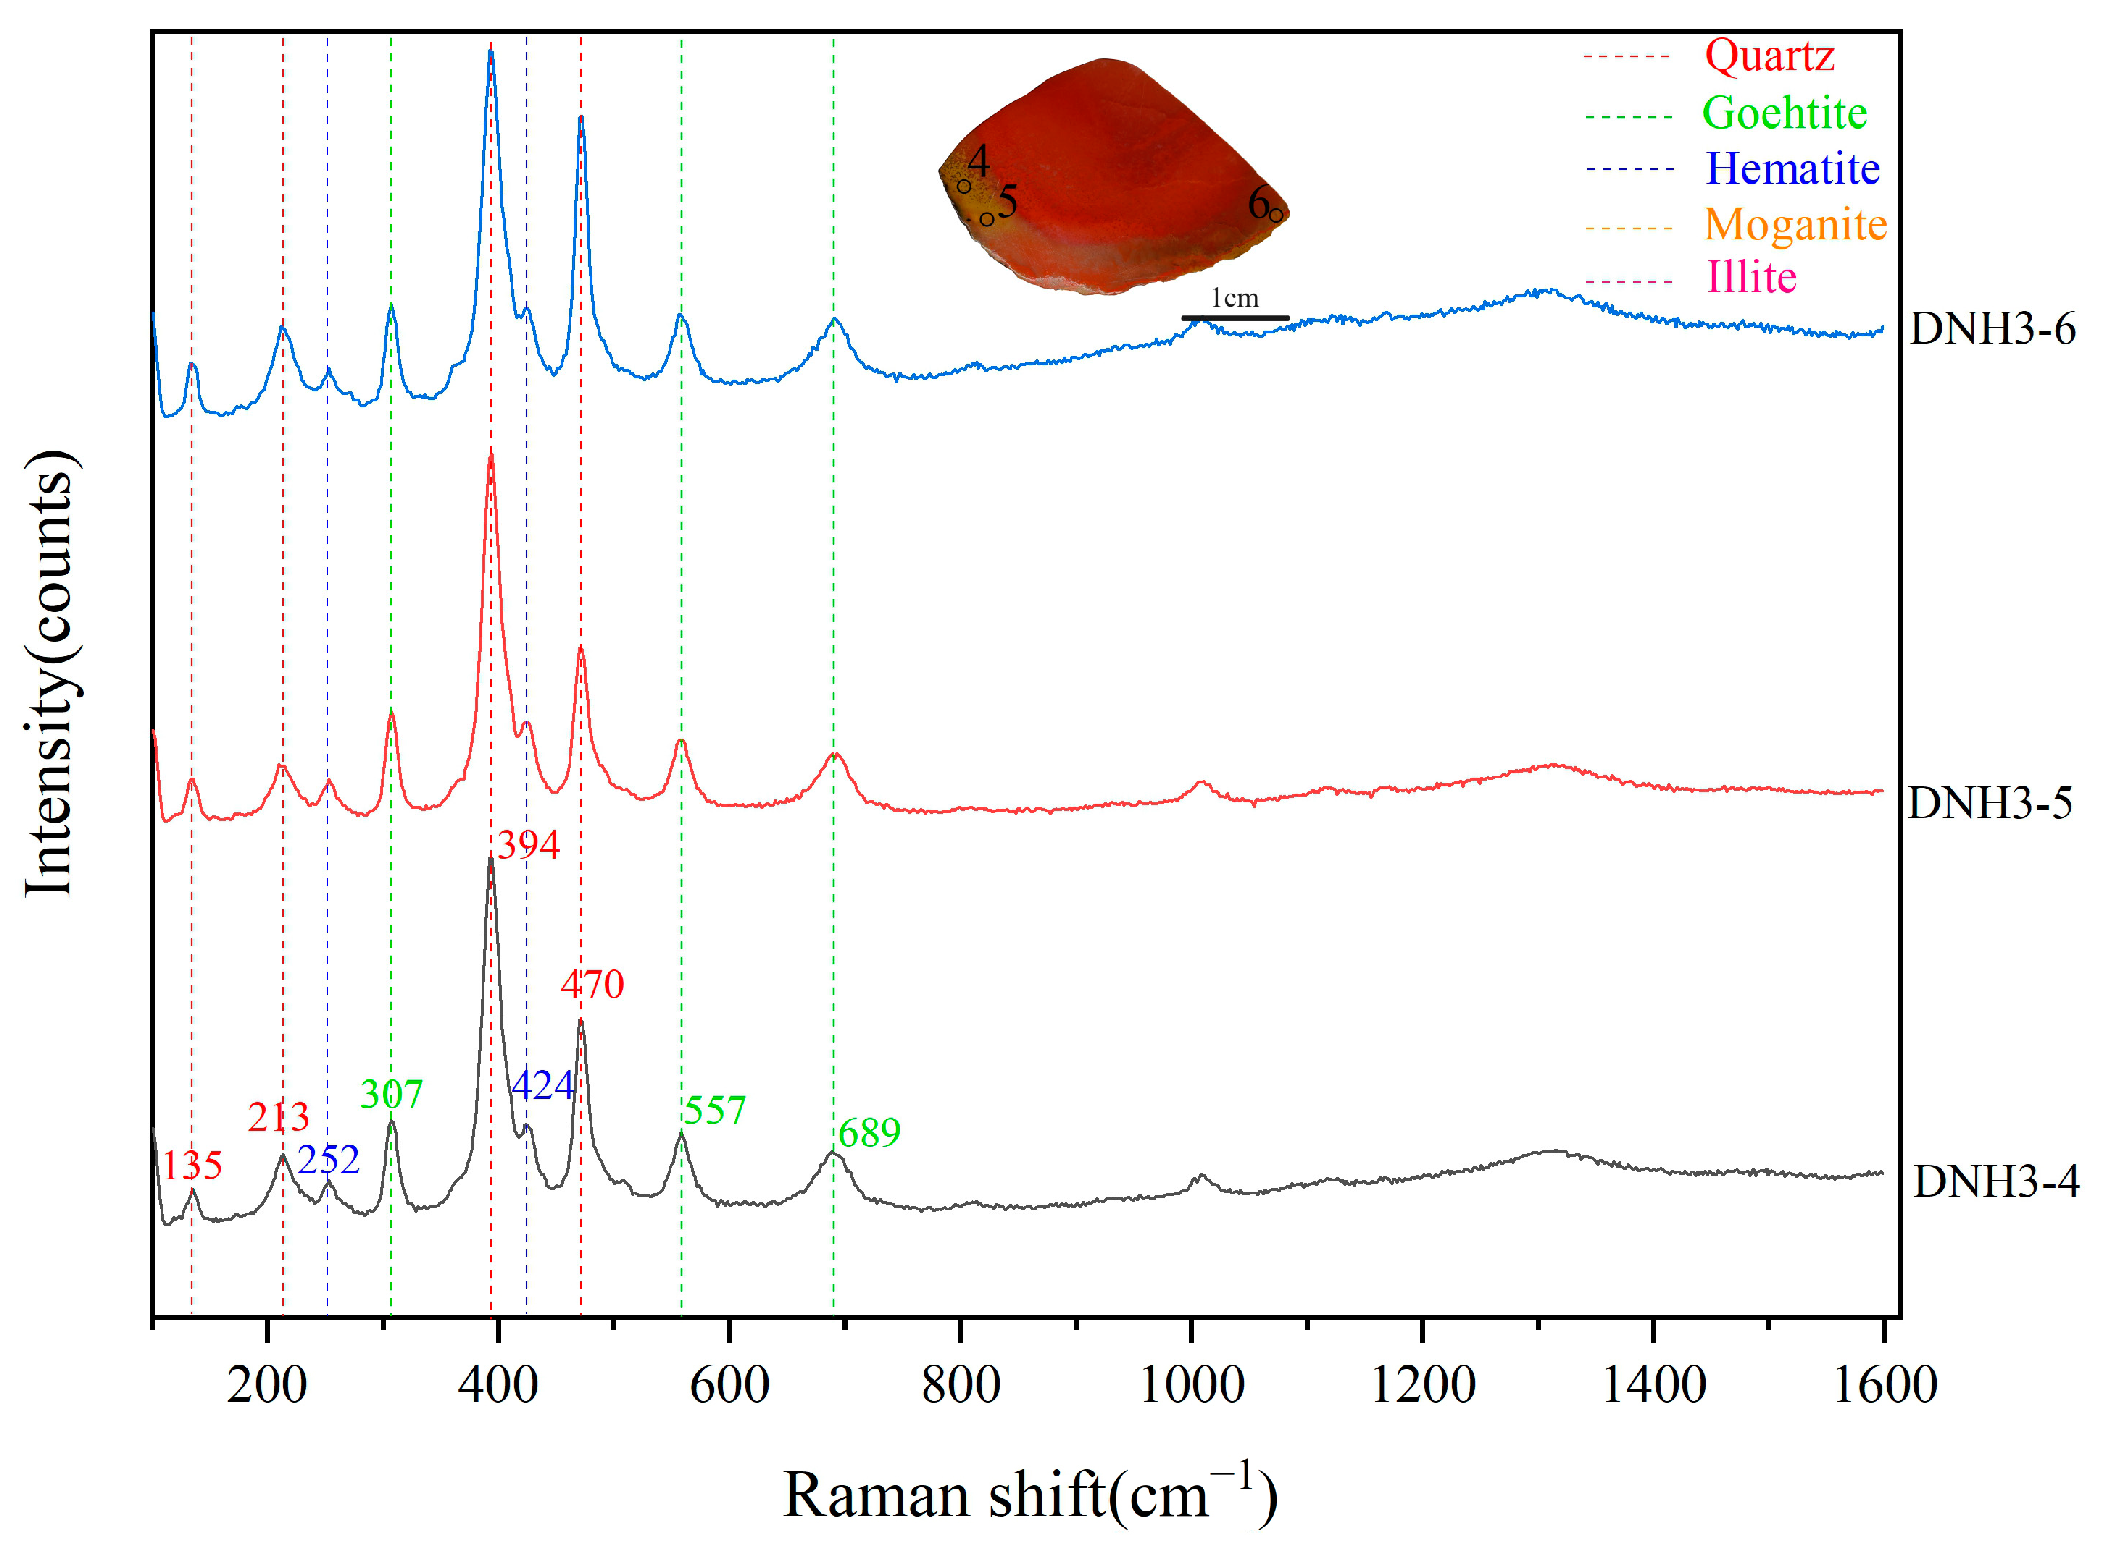
3.2.3. Raman Spectra

Raman spectrum analyses were carried out on different parts of the three samples. Based on the different colors that appeared, 3–5 points were analyzed for each region, and the representative points were selected to construct the Raman spectrum comparison diagram. The Raman spectra of sample DNH2 were not analyzed in detail because the fluorescence background was too strong to cover the essential characteristic vibration peaks. The experimental procedures for the Raman spectra analysis were strictly followed; however, due to instrumental errors and external environmental influences, the overall blueshift of the experimental data was observed at six wavenumbers. The measured characteristic Raman spectral wavenumbers were corrected and compared with the database to determine the corresponding minerals. For instance, after correction, the peak at 470 cm−1 was attributed to α-quartz, consistent with its characteristic Raman peak located at 464 cm−1.
The Raman spectrum of sample DNH1 is shown in Figure 7. The three analysis points all contain characteristic Raman peaks of α-quartz at 135 cm−1, 211 cm−1, and 470 cm−1, of which 470 cm−1 is the key characteristic peak of α-quartz in agate; secondly, there are weaker characteristic peaks of moganite at 271 cm−1 and 507 cm−1, caused by the symmetrical bending vibration of Si-O in moganite [31]. The characteristic peak of illite was observed at 360 cm−1, indicating that this sample is consistent with the results of previous research [3,7,22,25]; it is mainly composed of α-quartz, followed by a certain amount of moganite and the clay mineral illite.
DNH1-1 has a red appearance. This point has the characteristic Raman peaks of hematite at 247 cm−1, 298 cm−1, and 1323 cm−1; therefore, we speculate that the red appearance is caused by hematite. DNH1-2 is a white stripe area, with a very similar Raman spectrum to that of the colorless large quartz crystal at DNH1-3, compared with the spectrum of DNH1-1, except for the abovementioned α-quartz and moganite. In addition to the characteristic peaks of illite, there are weaker characteristic peaks of goethite at 400 cm−1 [32].
Similar to DNH1, sample DNH3 contains the Raman characteristics of α-quartz at 135 cm−1, 213 cm−1, and 470 cm−1 at the three analysis points, indicating that the sample is mainly composed of α-quartz. Point DNH3-2 and point DNH3-3 inside the sample have weak characteristic peaks of moganite at 269 cm−1 and 507 cm−1, along with characteristic peaks of illite at 360 cm−1 (Figure 8).
The appearance of point DNH3-1 is yellow. This point shows a different Raman peak from the other two points. Therefore, we re-selected three points in the yellow area for Raman spectrum analysis, and we obtained the same waveform as point DNH3-1 (Figure 9). There was a relatively strong characteristic Raman peak of α-quartz at 394 cm−1 in the “yellow-skinned” agate, and its intensity was greater than 470 cm−1; secondly, there was no characteristic Raman peak of moganite or illite at this point, and relatively strong characteristic Raman peaks of goethite appeared at 307 cm−1, 557 cm−1, 689 cm−1, along with a weaker one at 252 cm−1 and a characteristic Raman peak of hematite at 424 cm−1. Therefore, we speculate that the yellow color of this point is caused by goethite and hematite, with goethite being the main color-causing mineral.
DNH3-2 is “persimmon red” in appearance, and the most notable features of this point are at 230 cm−1, 419 cm−1, 616 cm−1, and 1325 cm−1. The characteristic Raman peak of hematite appears, and that of goethite appears at 299 cm−1. We speculated that the “persimmon red” color present at this point is caused by goethite and hematite, with hematite being the main color-causing mineral.
DNH3-3 only has the characteristic Raman peaks of α-quartz, moganite, and illite.

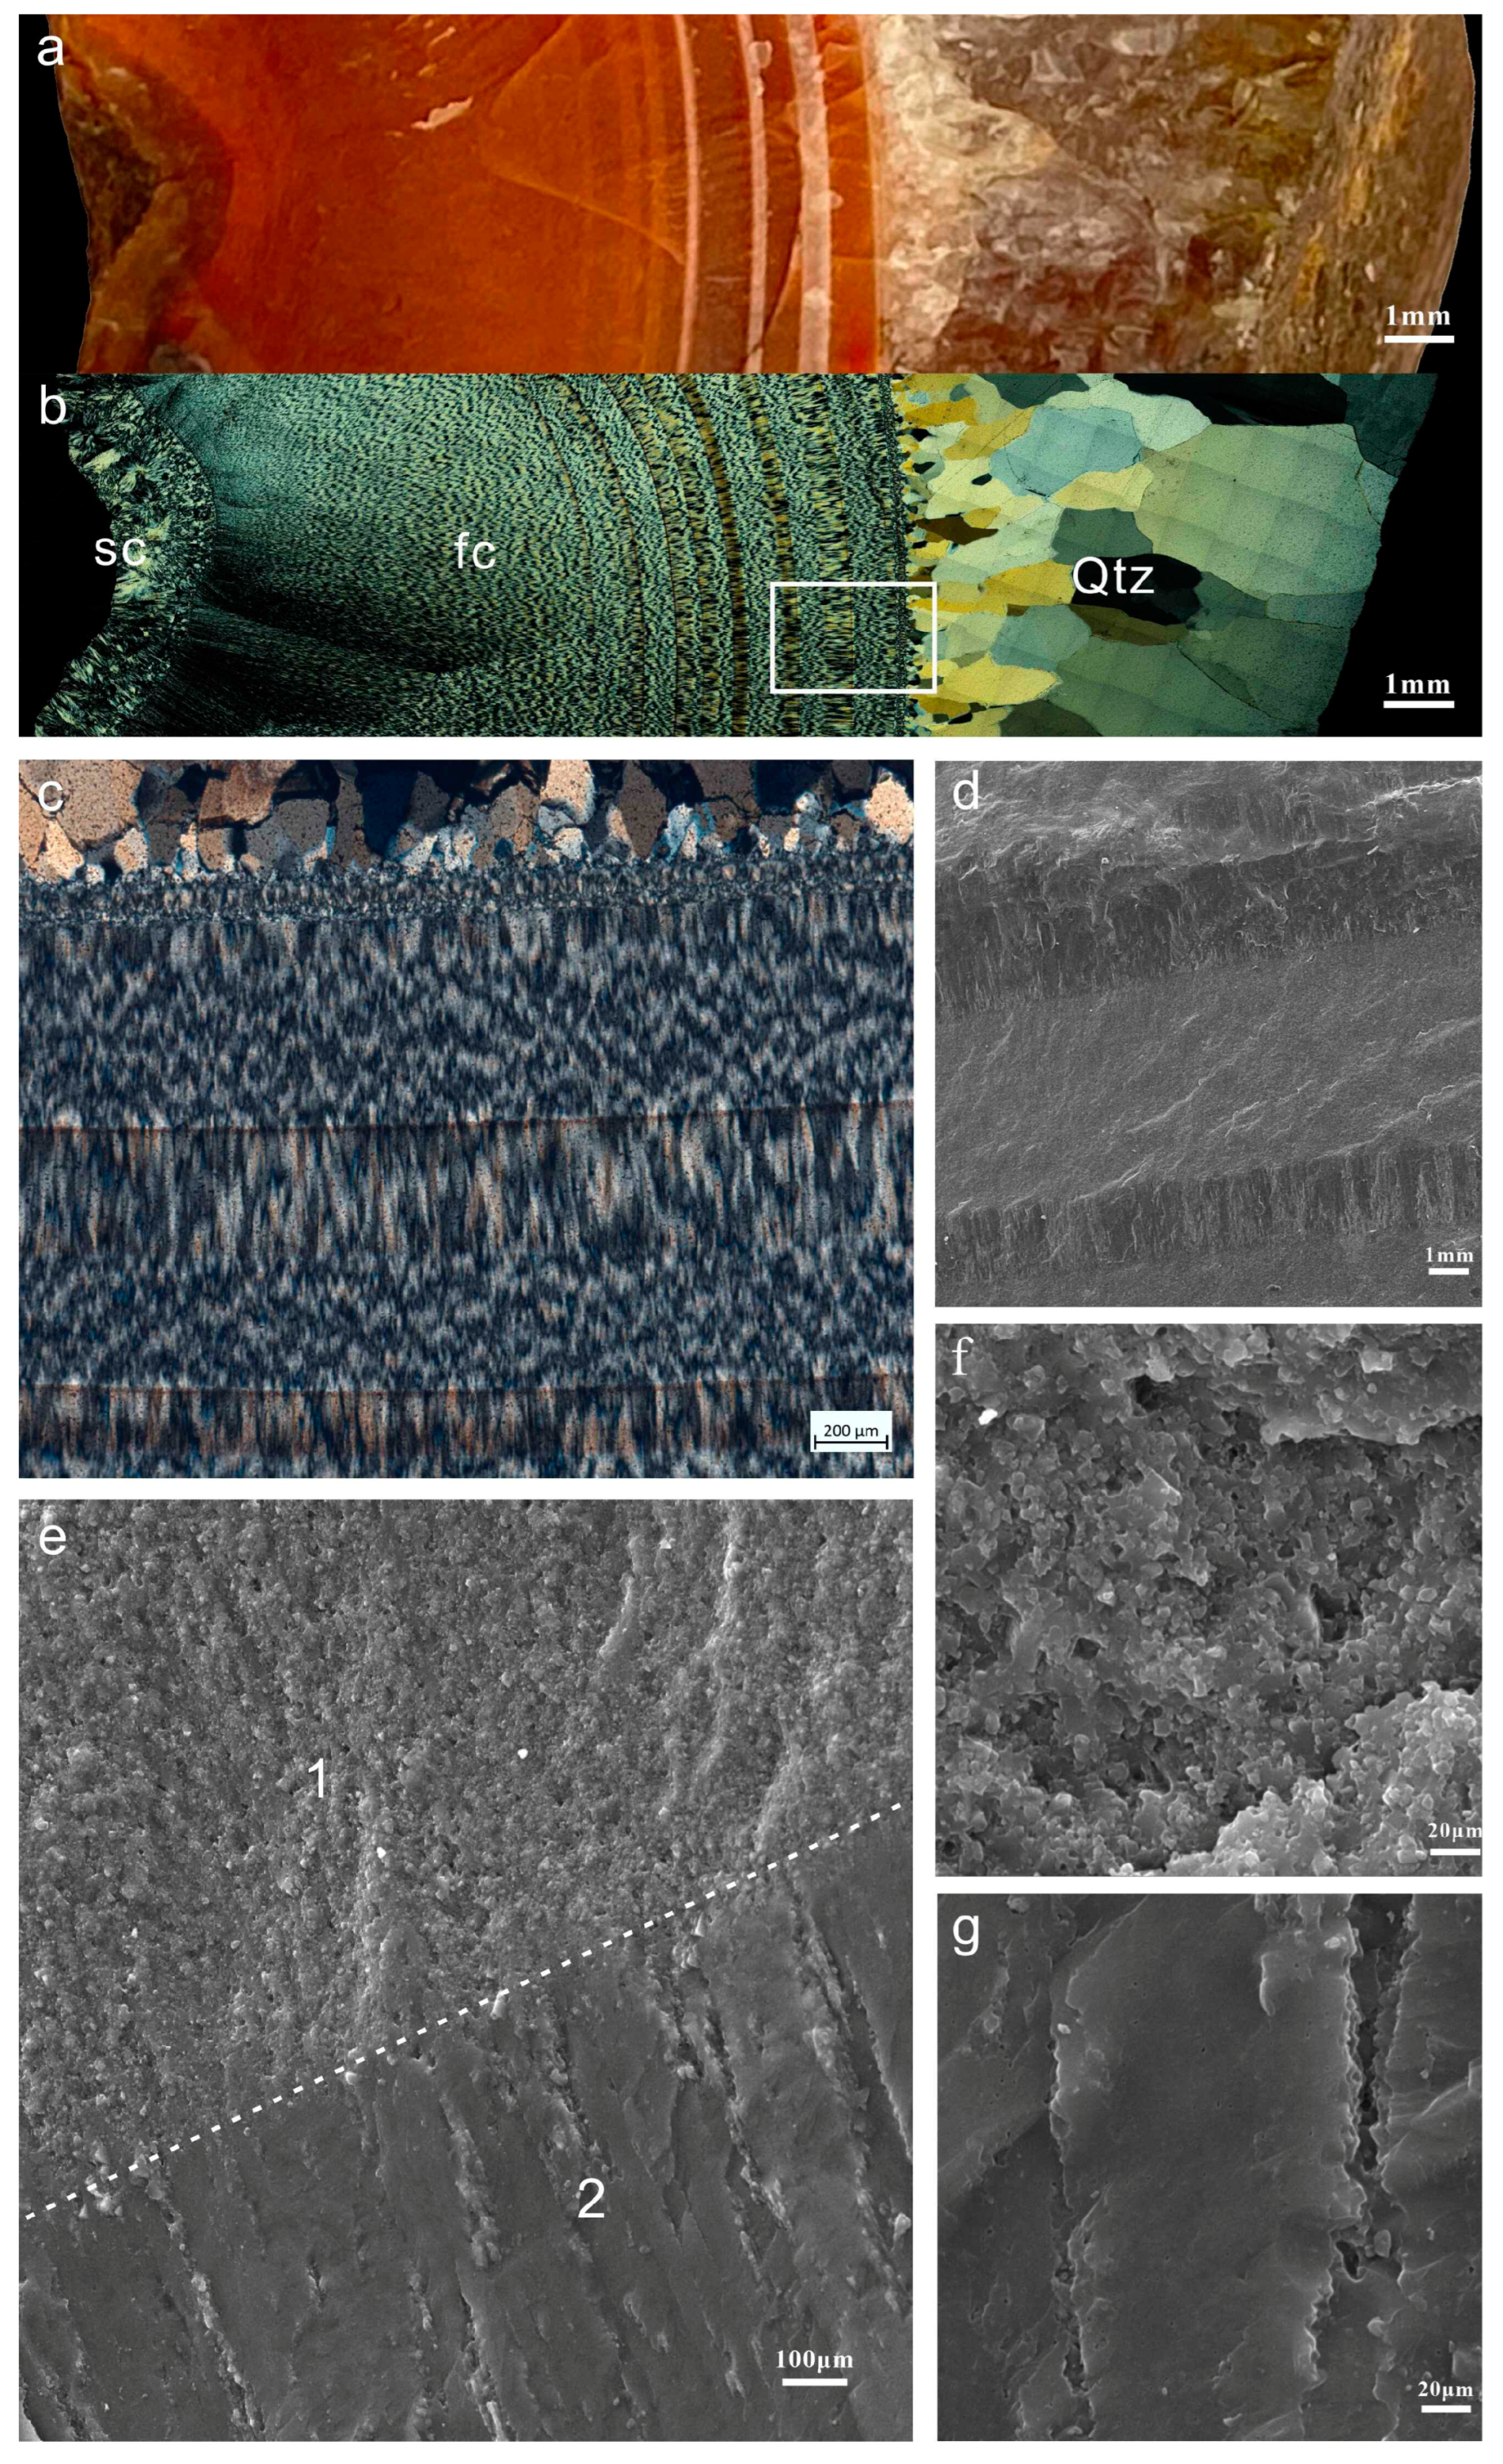
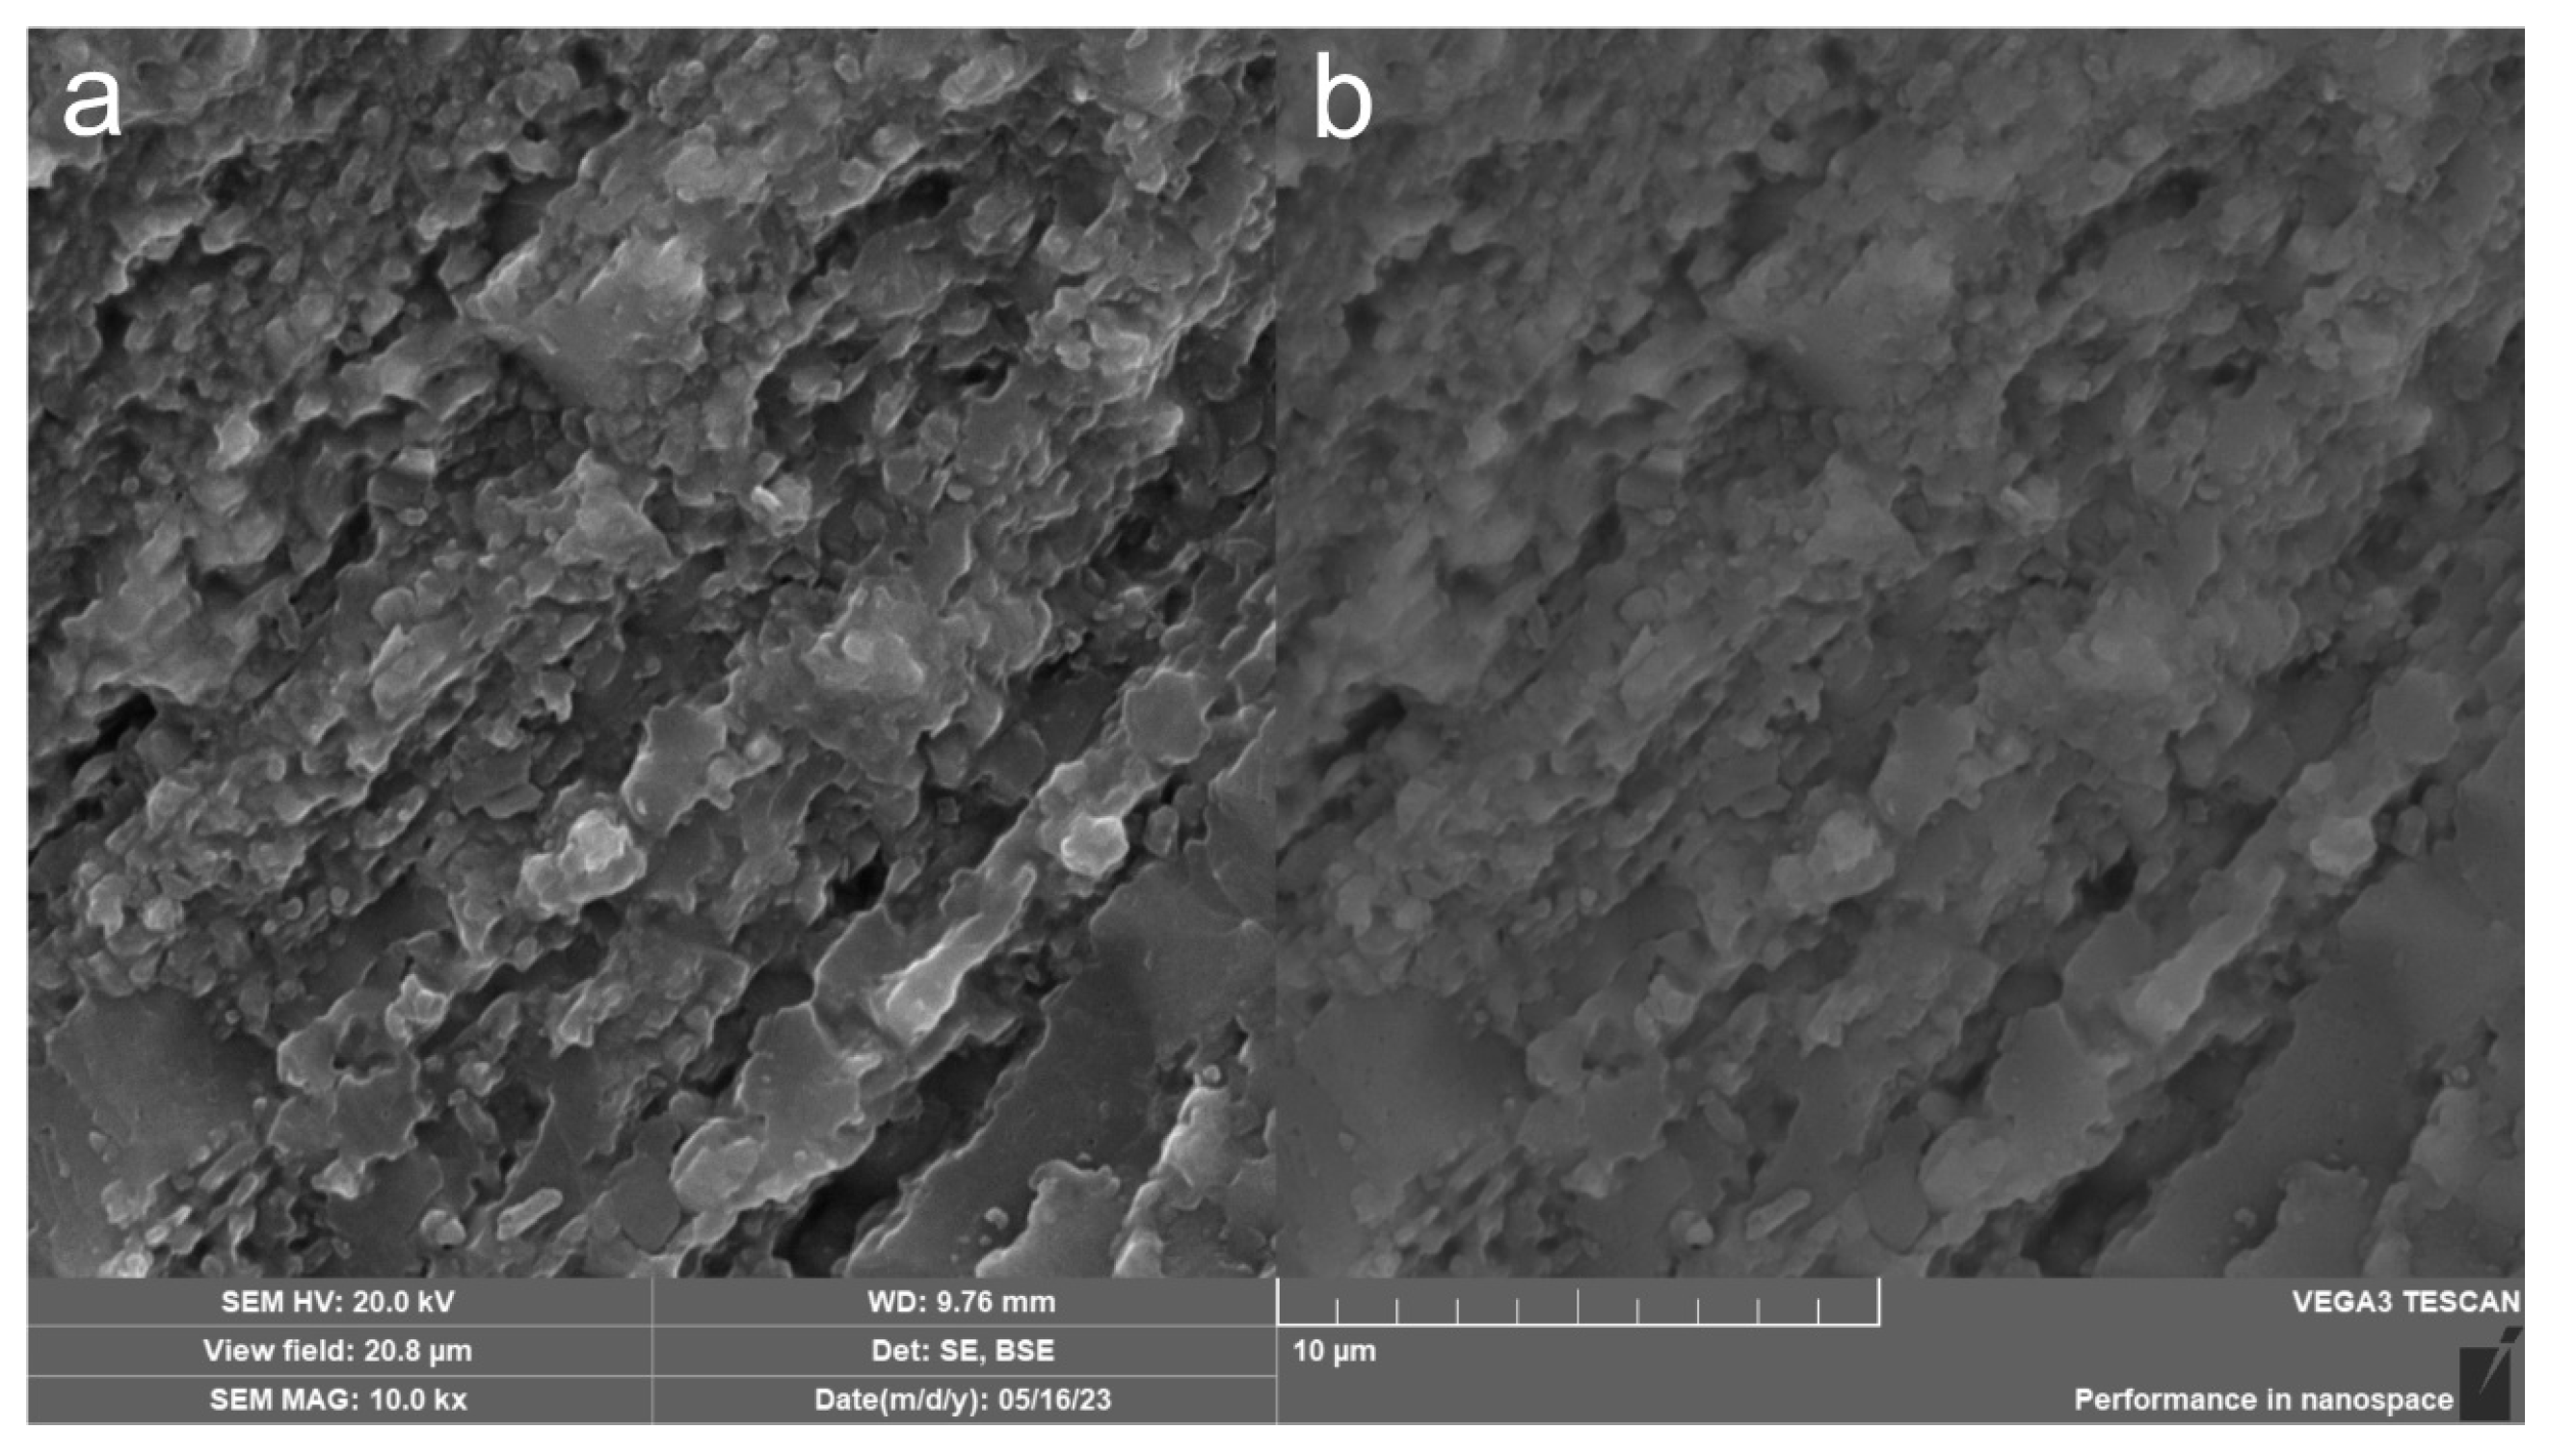
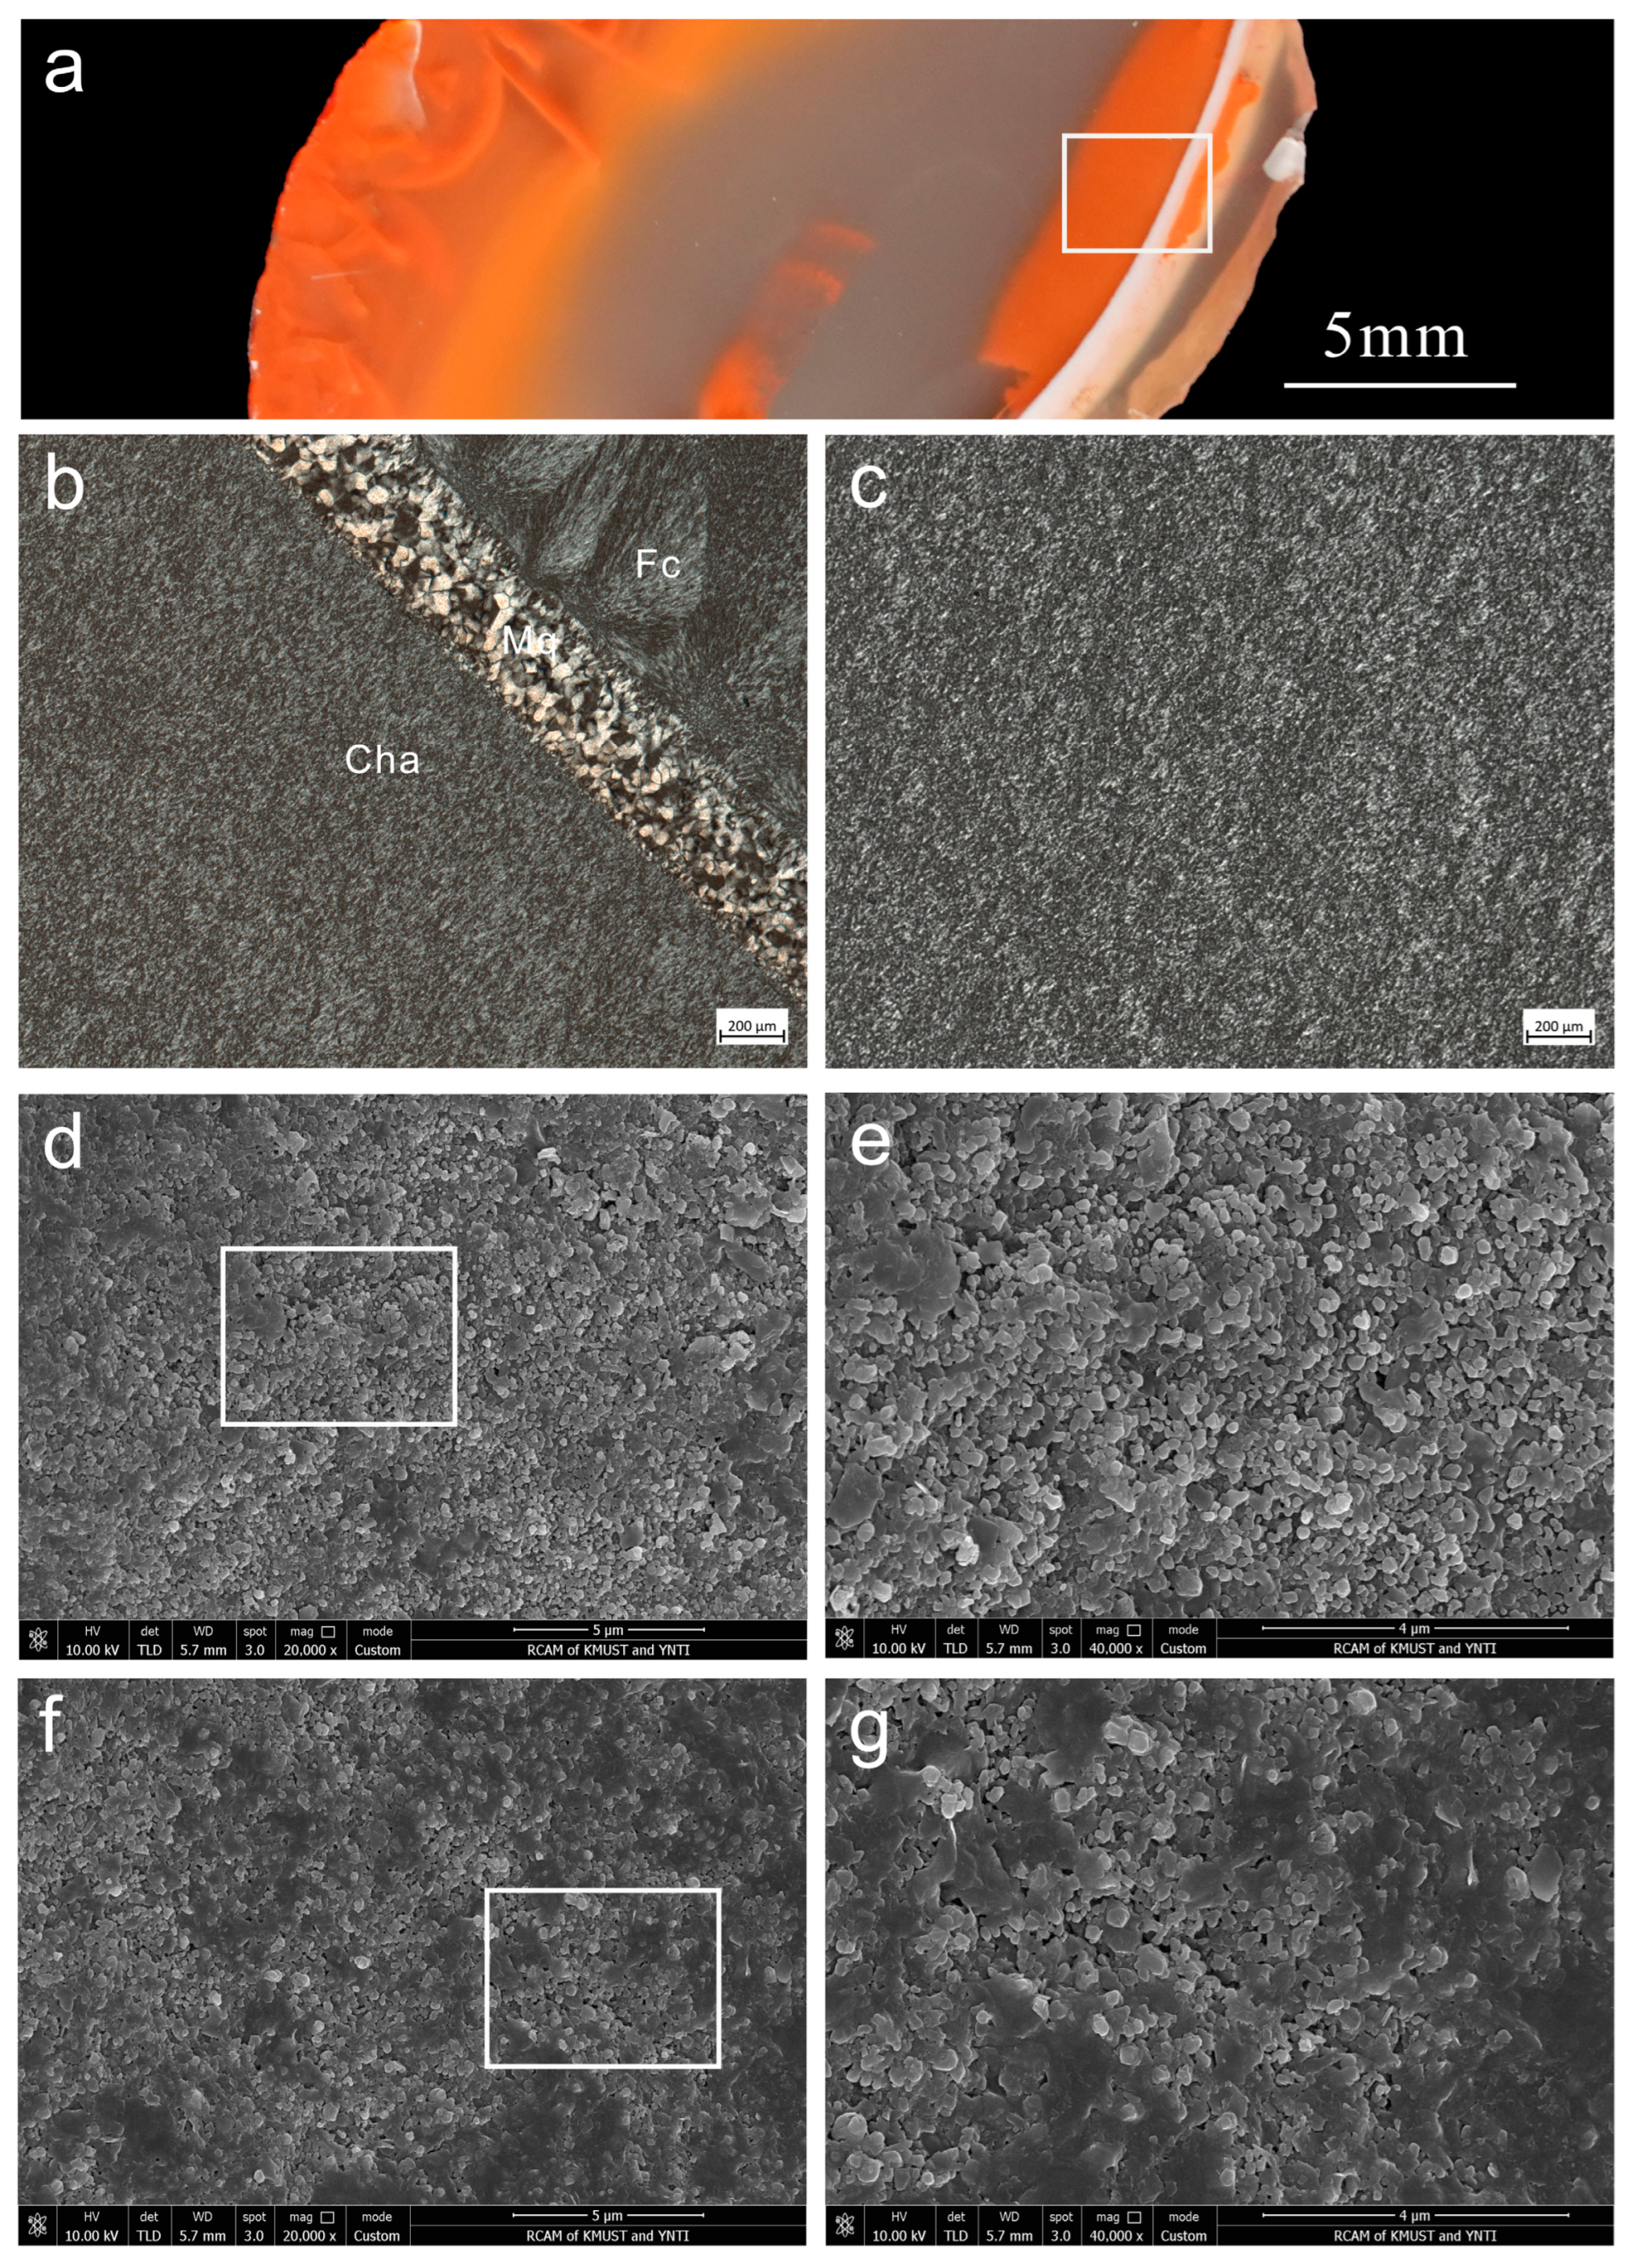
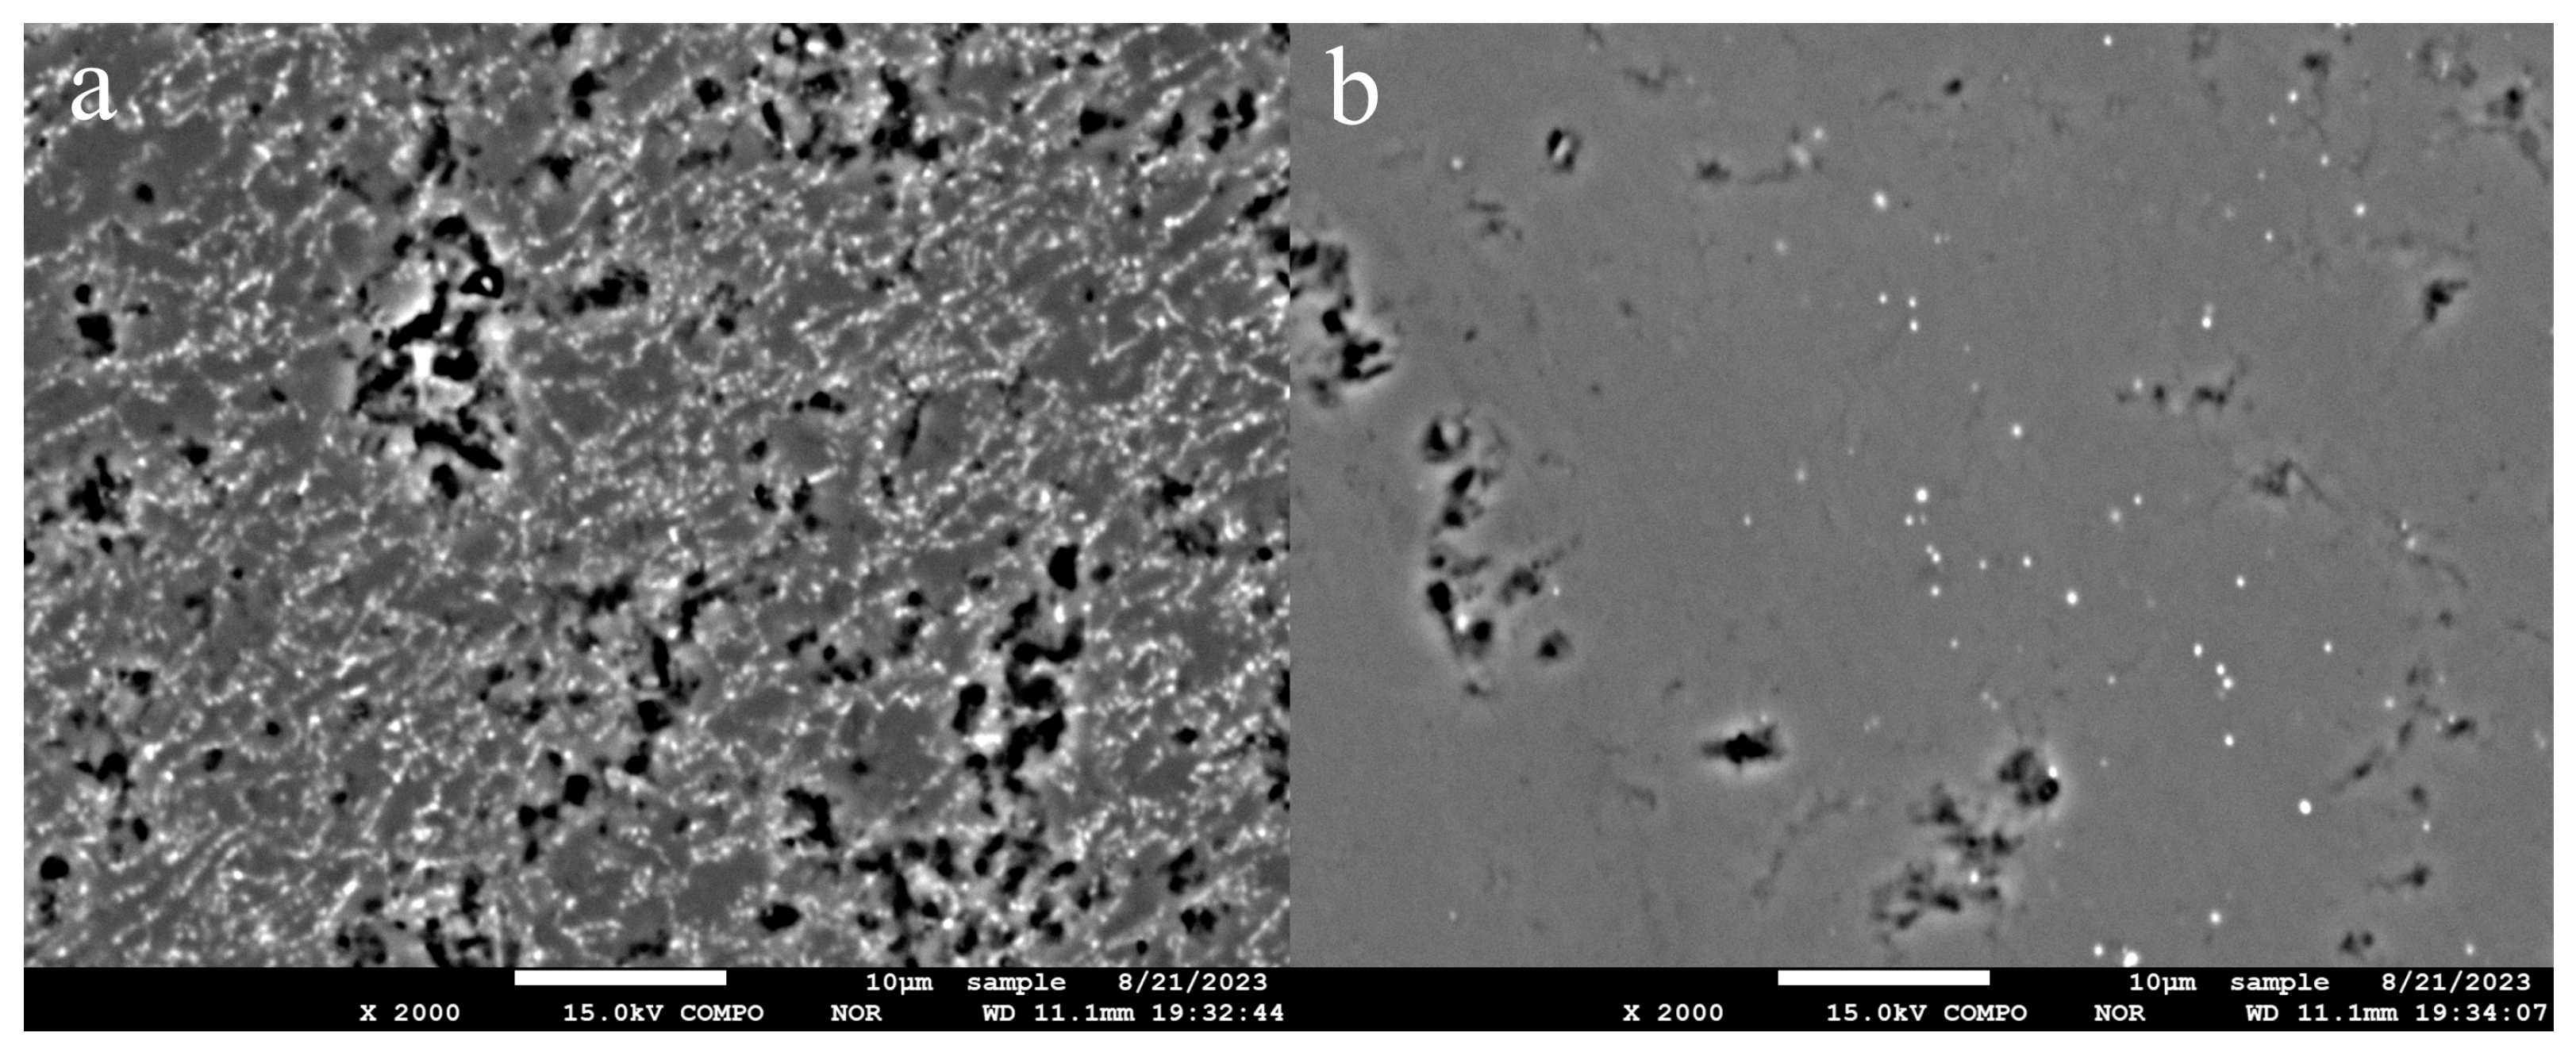
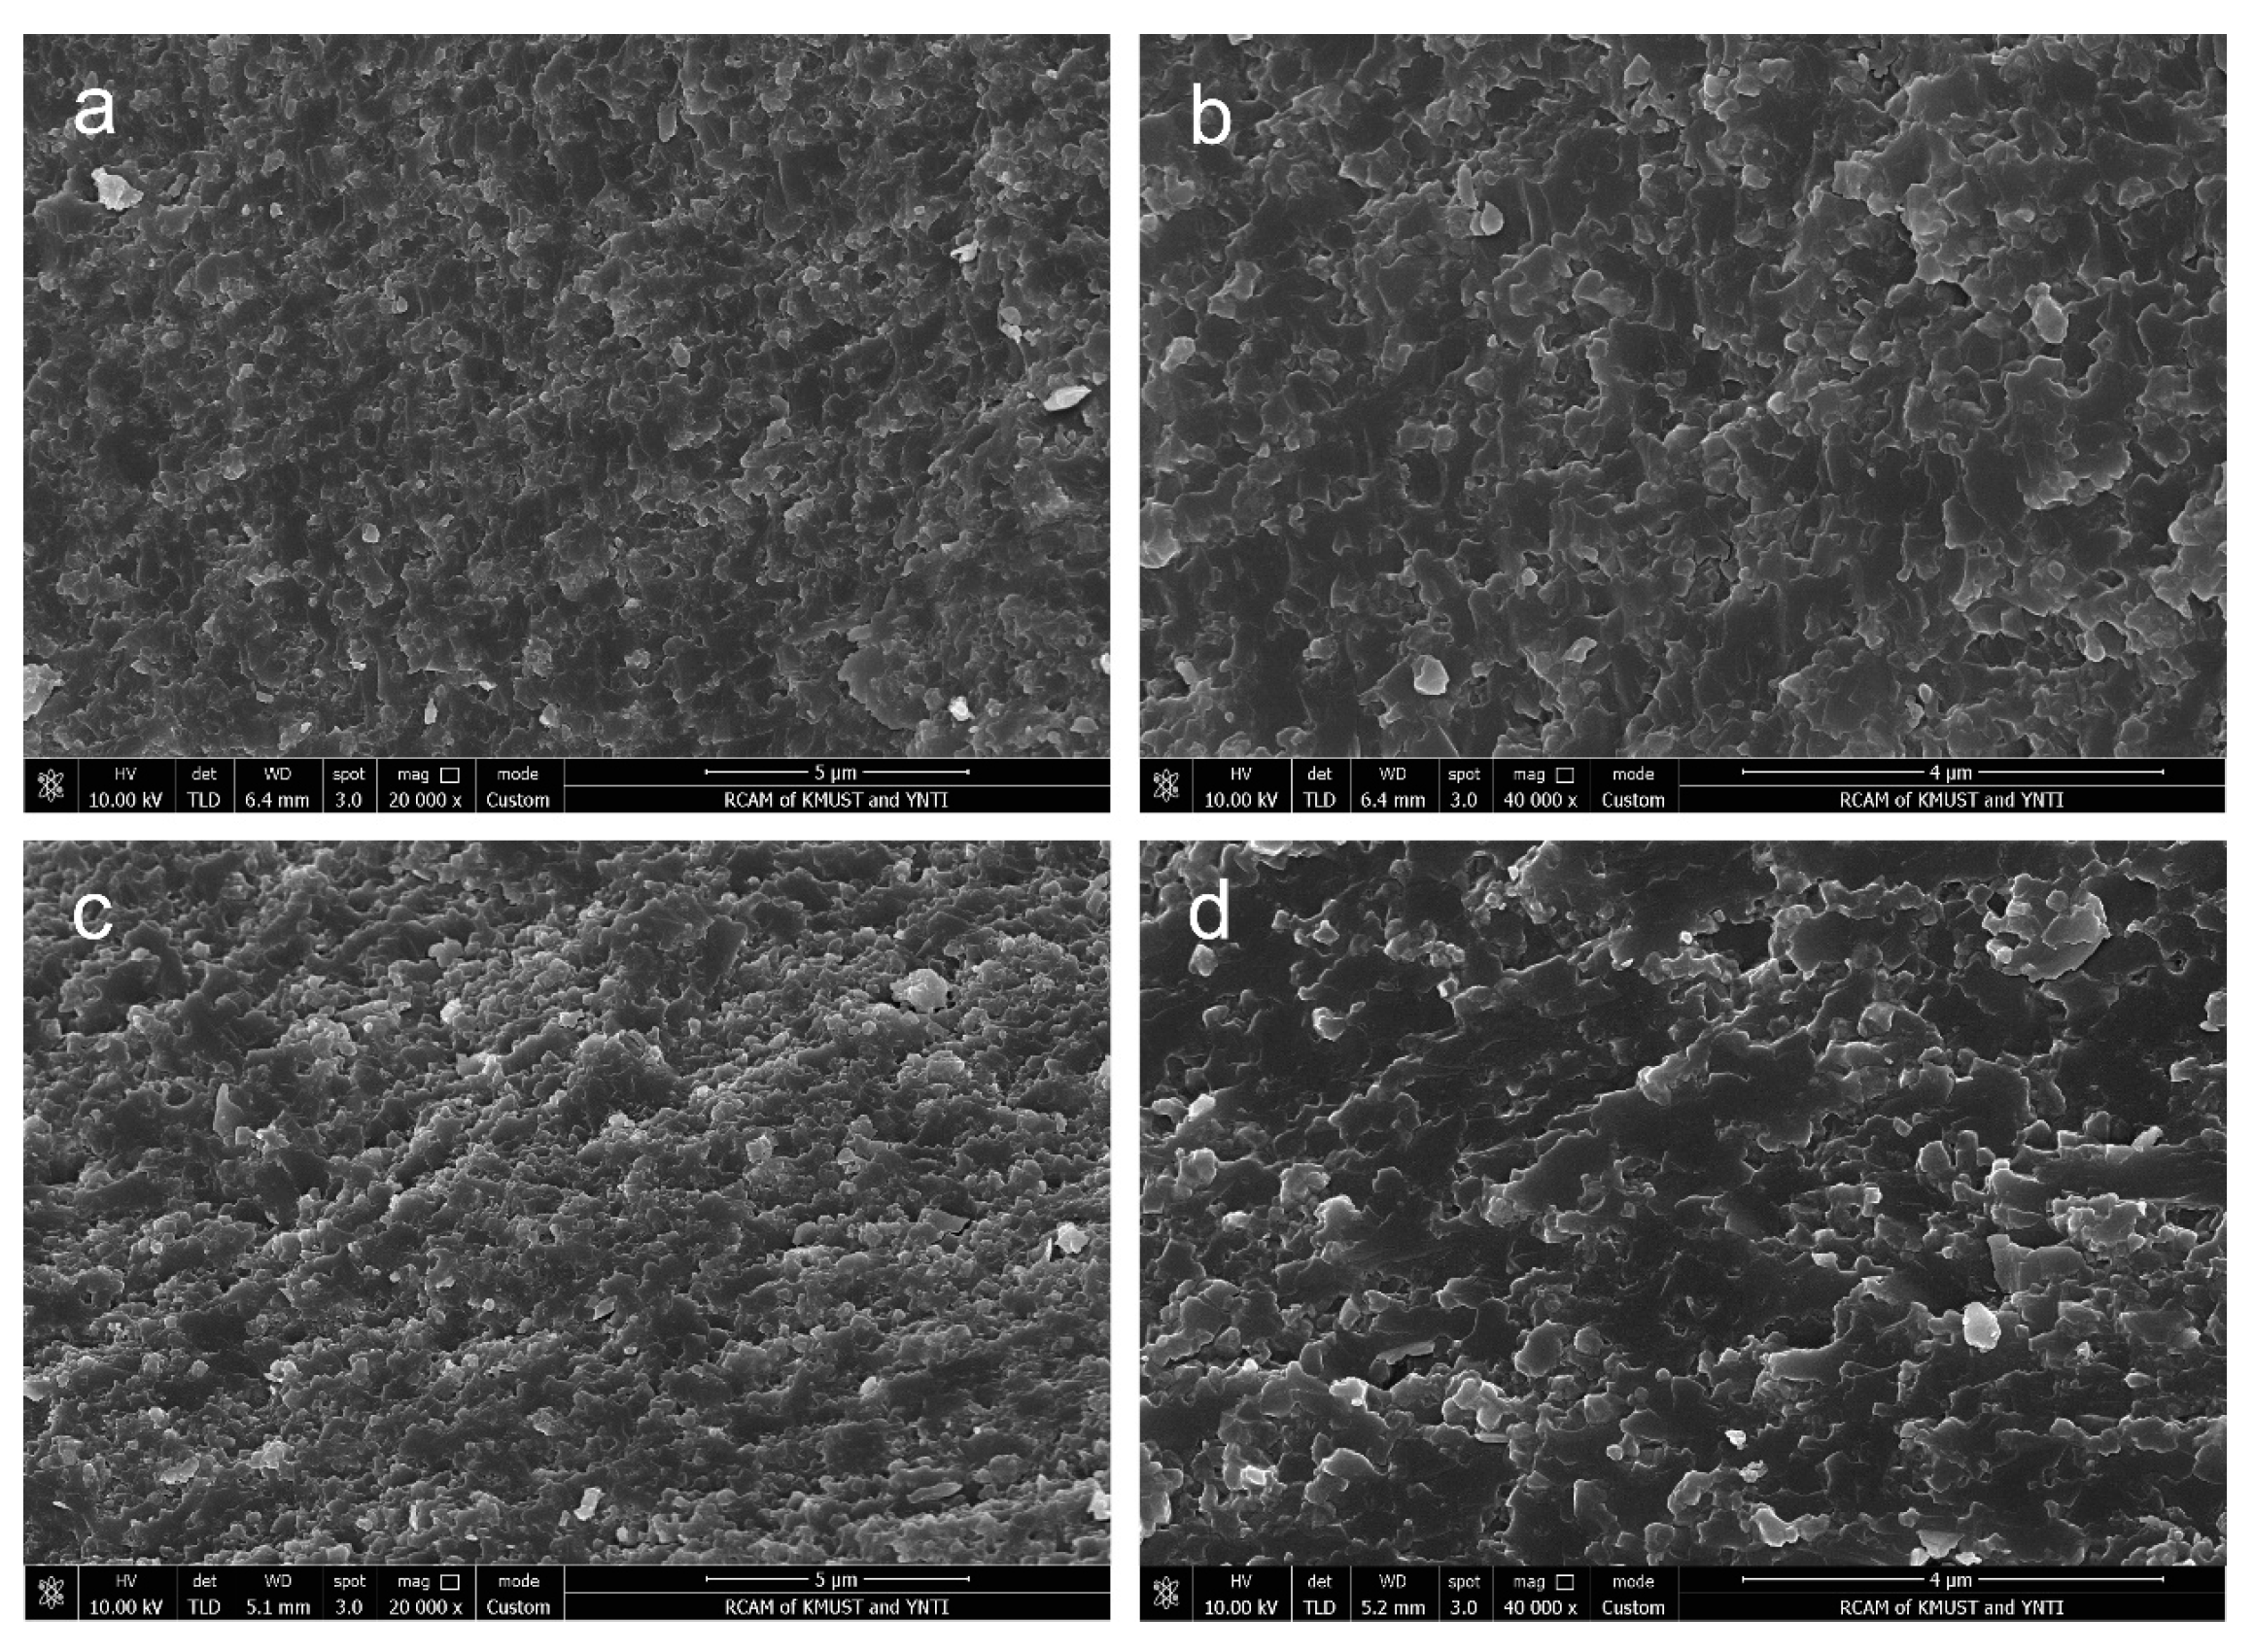
3.3. Microstructural Characteristics

When the structure of sample DNH1 is observed with the naked eye, the boundaries between the red bands and the white bands are clear (Figure 10a). In most cases, both bands are microcrystalline, and the particles are difficult to identify with the naked eye. However, a few of the white bands are highly crystalline. Especially in the center of the crystal sample, fine granular quartz aggregates can be seen, and these parts are mostly light in color and do not show a red tone.
Under polarized light microscopy, agate displays a pronounced banded structure. The red bands have finer crystalline granularity, resembling microcrystalline chalcedony (Figure 10b), with individual crystals faintly exhibiting unidirectional extension, which is not prominent. The micro-mineral assemblages within these red bands are relatively uniform, with a fibrous appearance. Under a crossed polarizer, the interference color of the red layer is relatively low, mostly ranging from first-level dark gray to first-level grayish white.
For the white banded sections, under the microscope, they appear as fibrous or comb-like aggregates, with individual minerals significantly extending in one direction, exhibiting micro-elongated acicular columnar shapes. The individual minerals extend approximately 0.02–0.2 mm in length, with growth directions perpendicular to the extension of the bands. Under cross-polarization, the interference colors of the assemblages in the white bands are higher than those in the red bands, reaching first-level yellowish-white, indicative of a higher degree of crystallinity than the red bands.
The central part of the agate is significantly light-colored and is mainly composed of quartz. The particle size is relatively large. The particle size is relatively small on the side close to the inner wall, mostly in the range of 0.2–0.8 mm. The shape of this section resembles a comb-shaped or crystal cluster that extends in a straight direction. The crystal grain size in the center is large, and the crystals in this area are mostly semihedral granular crystals in the range of 0.5–1.5 mm.
In addition, the differences between the banding of different tones under the scanning electron microscope were also significant (Figure 10d). Most of the red banding appeared as relatively uniform aggregates under low magnification (Figure 10(e1)), similar to the block structure in the macroscopic samples, and part of the field of view was fibrous in shape. The white banding was mostly fibrous aggregates (Figure 10(e2)), and the fiber growth direction was consistent with the extension direction of the banding.
Under high magnification (10,000×), the red laminated chalcedony was mostly composed of granular or near-granular amorphous SiO2, with a few areas similar to “silica balls” (Figure 10f). The size of the individual particles was about 0.7–1 μm. Evenly distributed pores or cavities could be seen between particles or aggregates. The red banding visible in the local field of view was composed of amorphous SiO2 particles arranged in a directional manner, showing a fibrous structure (Figure 11). The extension of individual particles was usually <2 μm (fine), and there were unidirectional pores or channels between the aggregates, as well as relatively high porosity.
Under high magnification (10,000×), the structural composition of the white bands was significantly different from that of the red bands. The constituents of the comb-like chalcedony exhibited unidirectional extension in long columnar or plank-like forms (Figure 10g), with extension lengths ranging from tens to hundreds of micrometers and widths of approximately 8–15 μm (larger relative to the red banding). The individual crystals were closely packed in the same direction, and unidirectional pores or channels could occasionally be observed between them. Compared to the fibrous aggregates in the red banding, the porosity in the white banding was relatively lower, with the morphology of pores or channels being dictated by the parallel alignment of the individual crystals.
The appearance of sample DNH2 is red, the interior is colorless, the interface between the two types of banding is not clear, and the structure is cryptocrystalline (Figure 12a). Under the orthogonal polarizing microscope, the two bands are snowflake-like, each part is more uniform, there is no obvious band structure, and the interference color of the aggregate is low, mostly first-grade gray (Figure 12b,c).
Under the SEM, each part also showed a relatively homogeneous and similar structure. They were mostly composed of granular or near-granular amorphous SiO2, most of which resembled “silica balls”. The size of the individual particles was about 0.5–1 μm, and occasionally flakes were observed. Evenly distributed pores or cavities could be seen between particles or between aggregates (Figure 12d–g).
Under high-magnification viewing (40,000×), the material and structure of the red part were slightly different from those of the colorless lamellae, and it was observed that the red part of the chalcedony was distributed in a sheet shape. Through EDS analysis (Figure 13), we found that iron and aluminum substances were disseminated in the chalcedony flakes, and their atomic percentages are shown in Table 1.
The outermost layer of sample DNH3 is yellow, which is a unique characteristic of the “yellow-skinned” agate found in northeast Yunnan, while its interior is red. The boundary between yellow and red is clear, and both bandings are cryptocrystalline (Figure 14a).
Under a polarizing microscope, the lamellar structure of the agate appeared significantly different. Our observations showed that the microscopic mineral aggregates in the yellow bandings were mostly in the shape of bundles (Figure 14c), and some parts seemed to be deformed. The interference color of this part of the aggregates is lower, mostly ranging from first-level gray to first-level gray–yellow, which can be defined as pseudo-granular silica according to previous studies [15]. The structure of the internal red banding was significantly different from that of the yellow banding: microgranular, with the particle size progressively increasing and the morphology becoming more uniform. As the size and the shape change, the degree of crystallization also increases. The interference color of this layer transitions from first-level gray to first-level gray–yellow. Under a single polarized light, dispersed iron was observed to be distributed along the aggregate shape.
In addition, the differences between the bandings of different tones under the scanning electron microscope were subtle (Figure 15); under the high-magnification field of view (40,000×), they were all in the form of sheets, closely arranged in the same direction and directional extension. The extension of individual units was usually <1 μm (extremely small), unidirectional pores or channels were observed between the aggregates, and the porosity was relatively high.

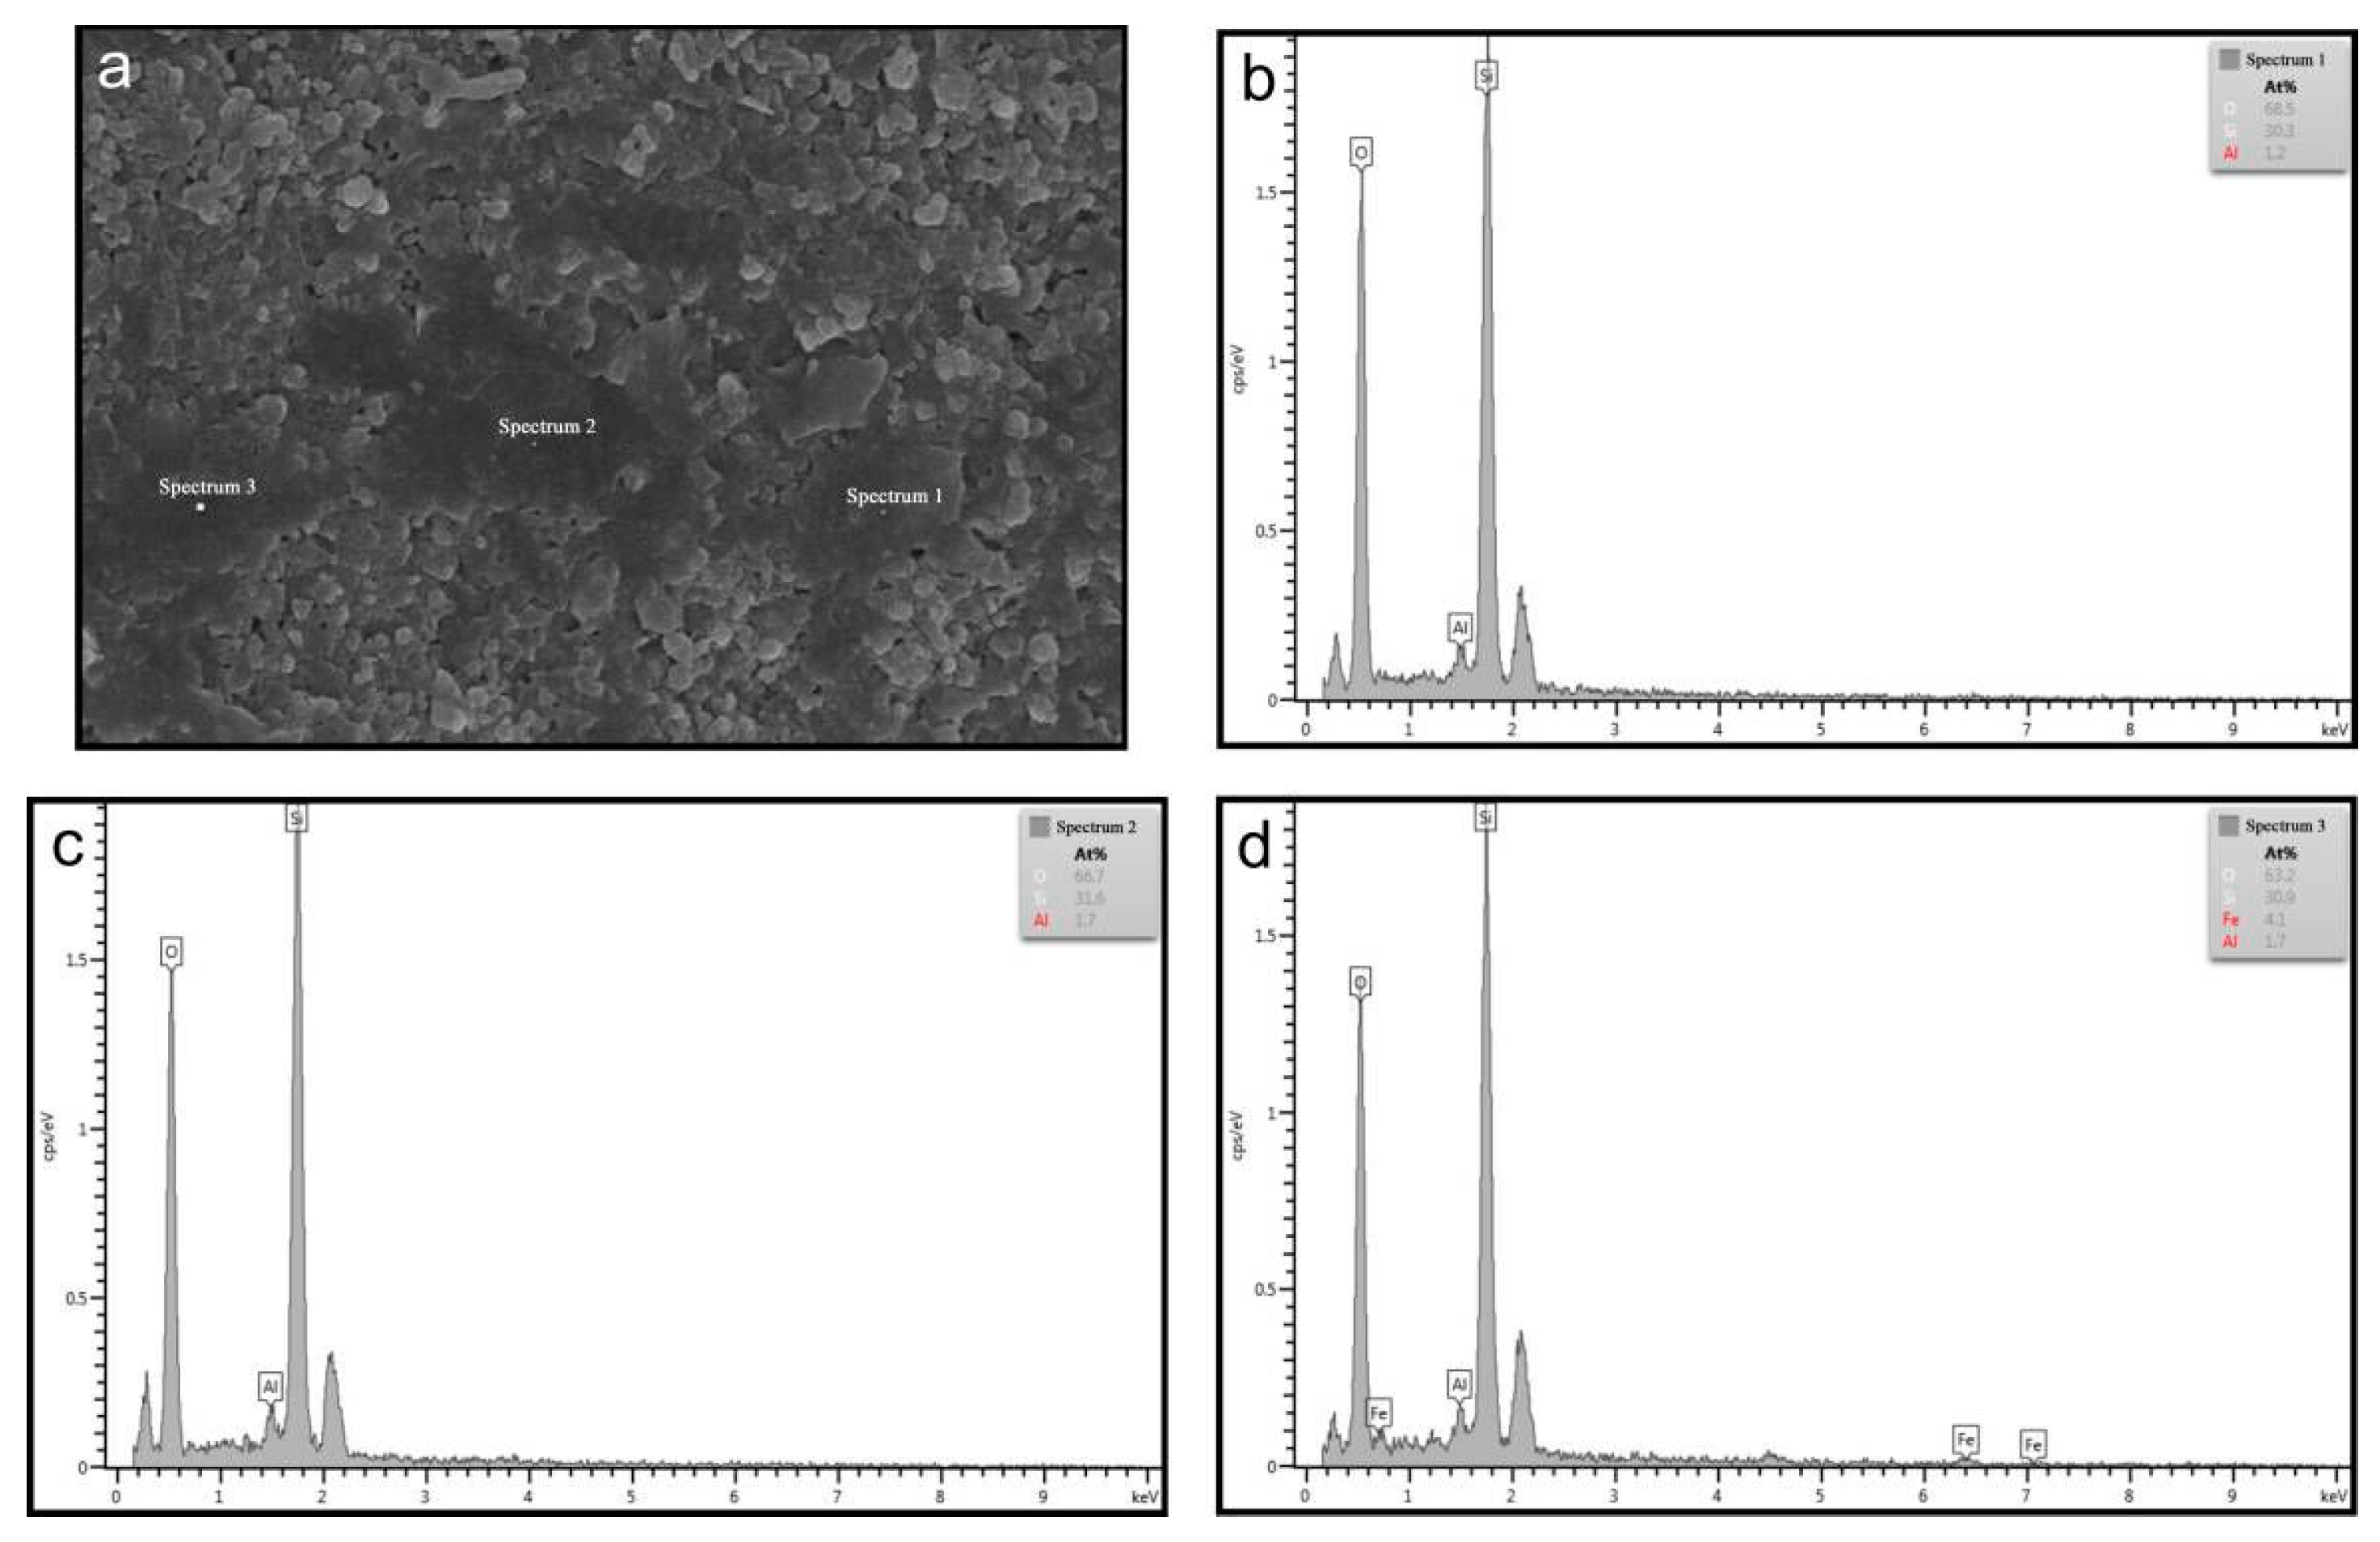
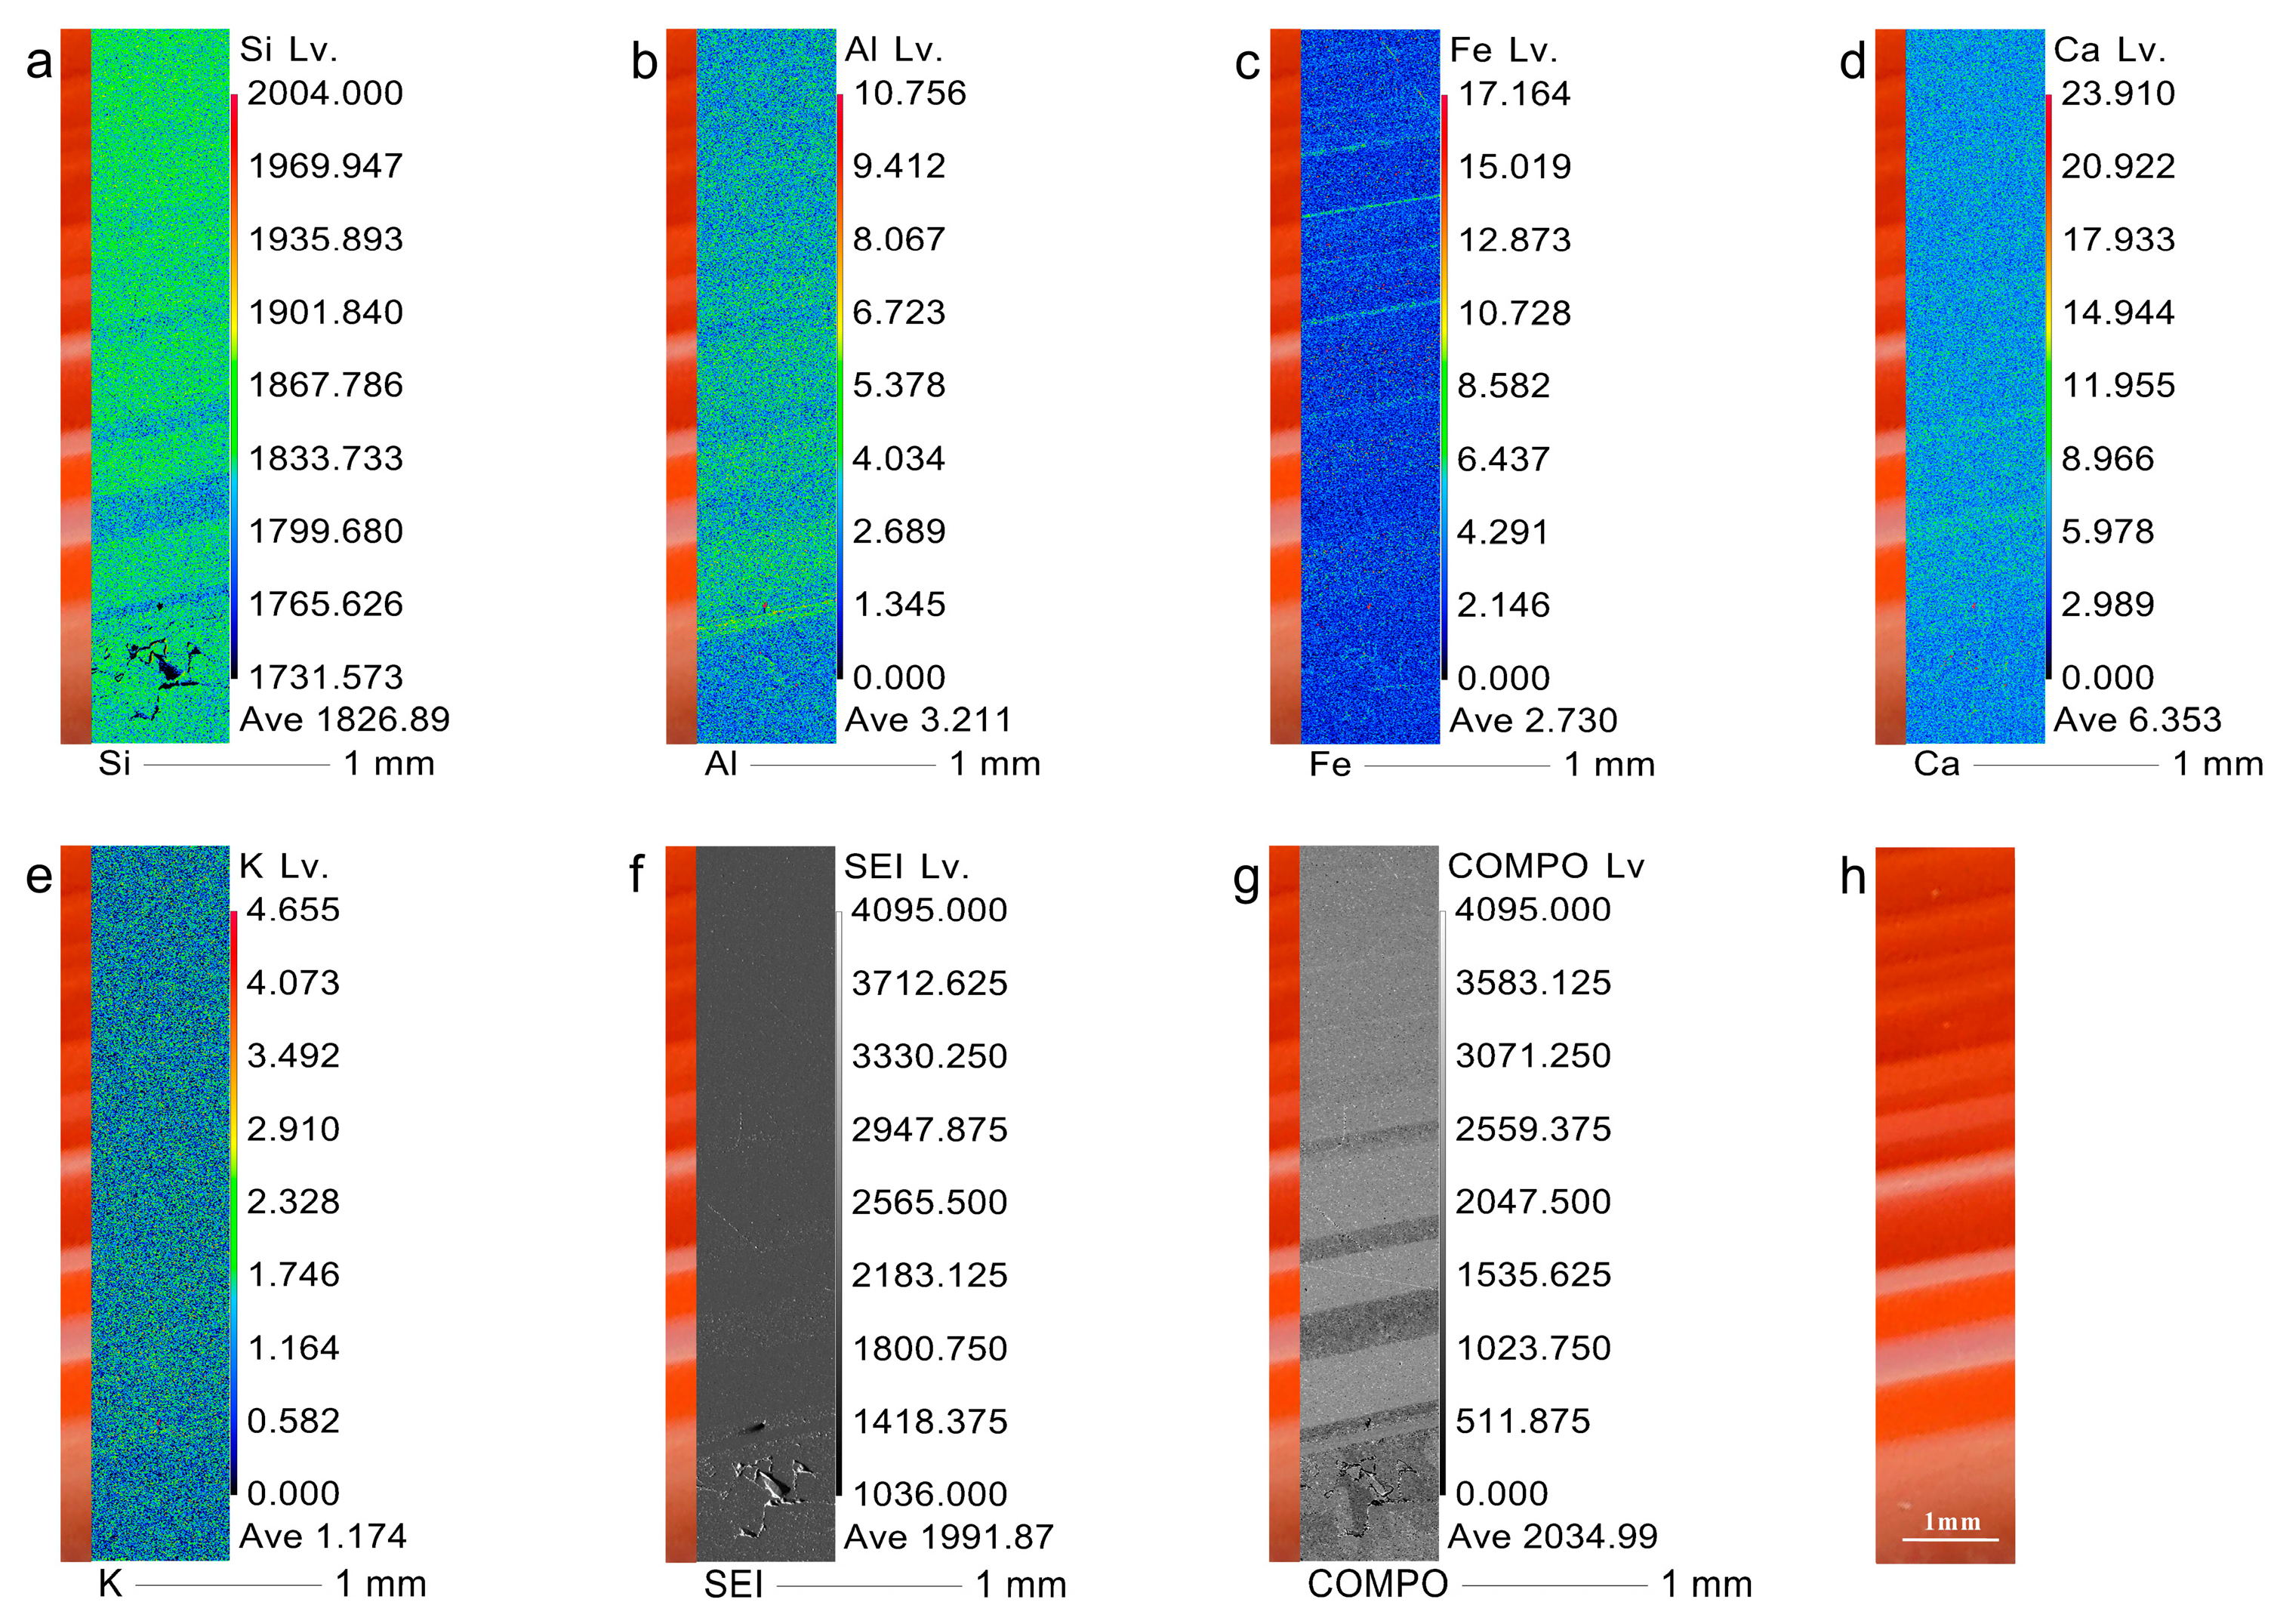
3.4. Geochemical Characteristics
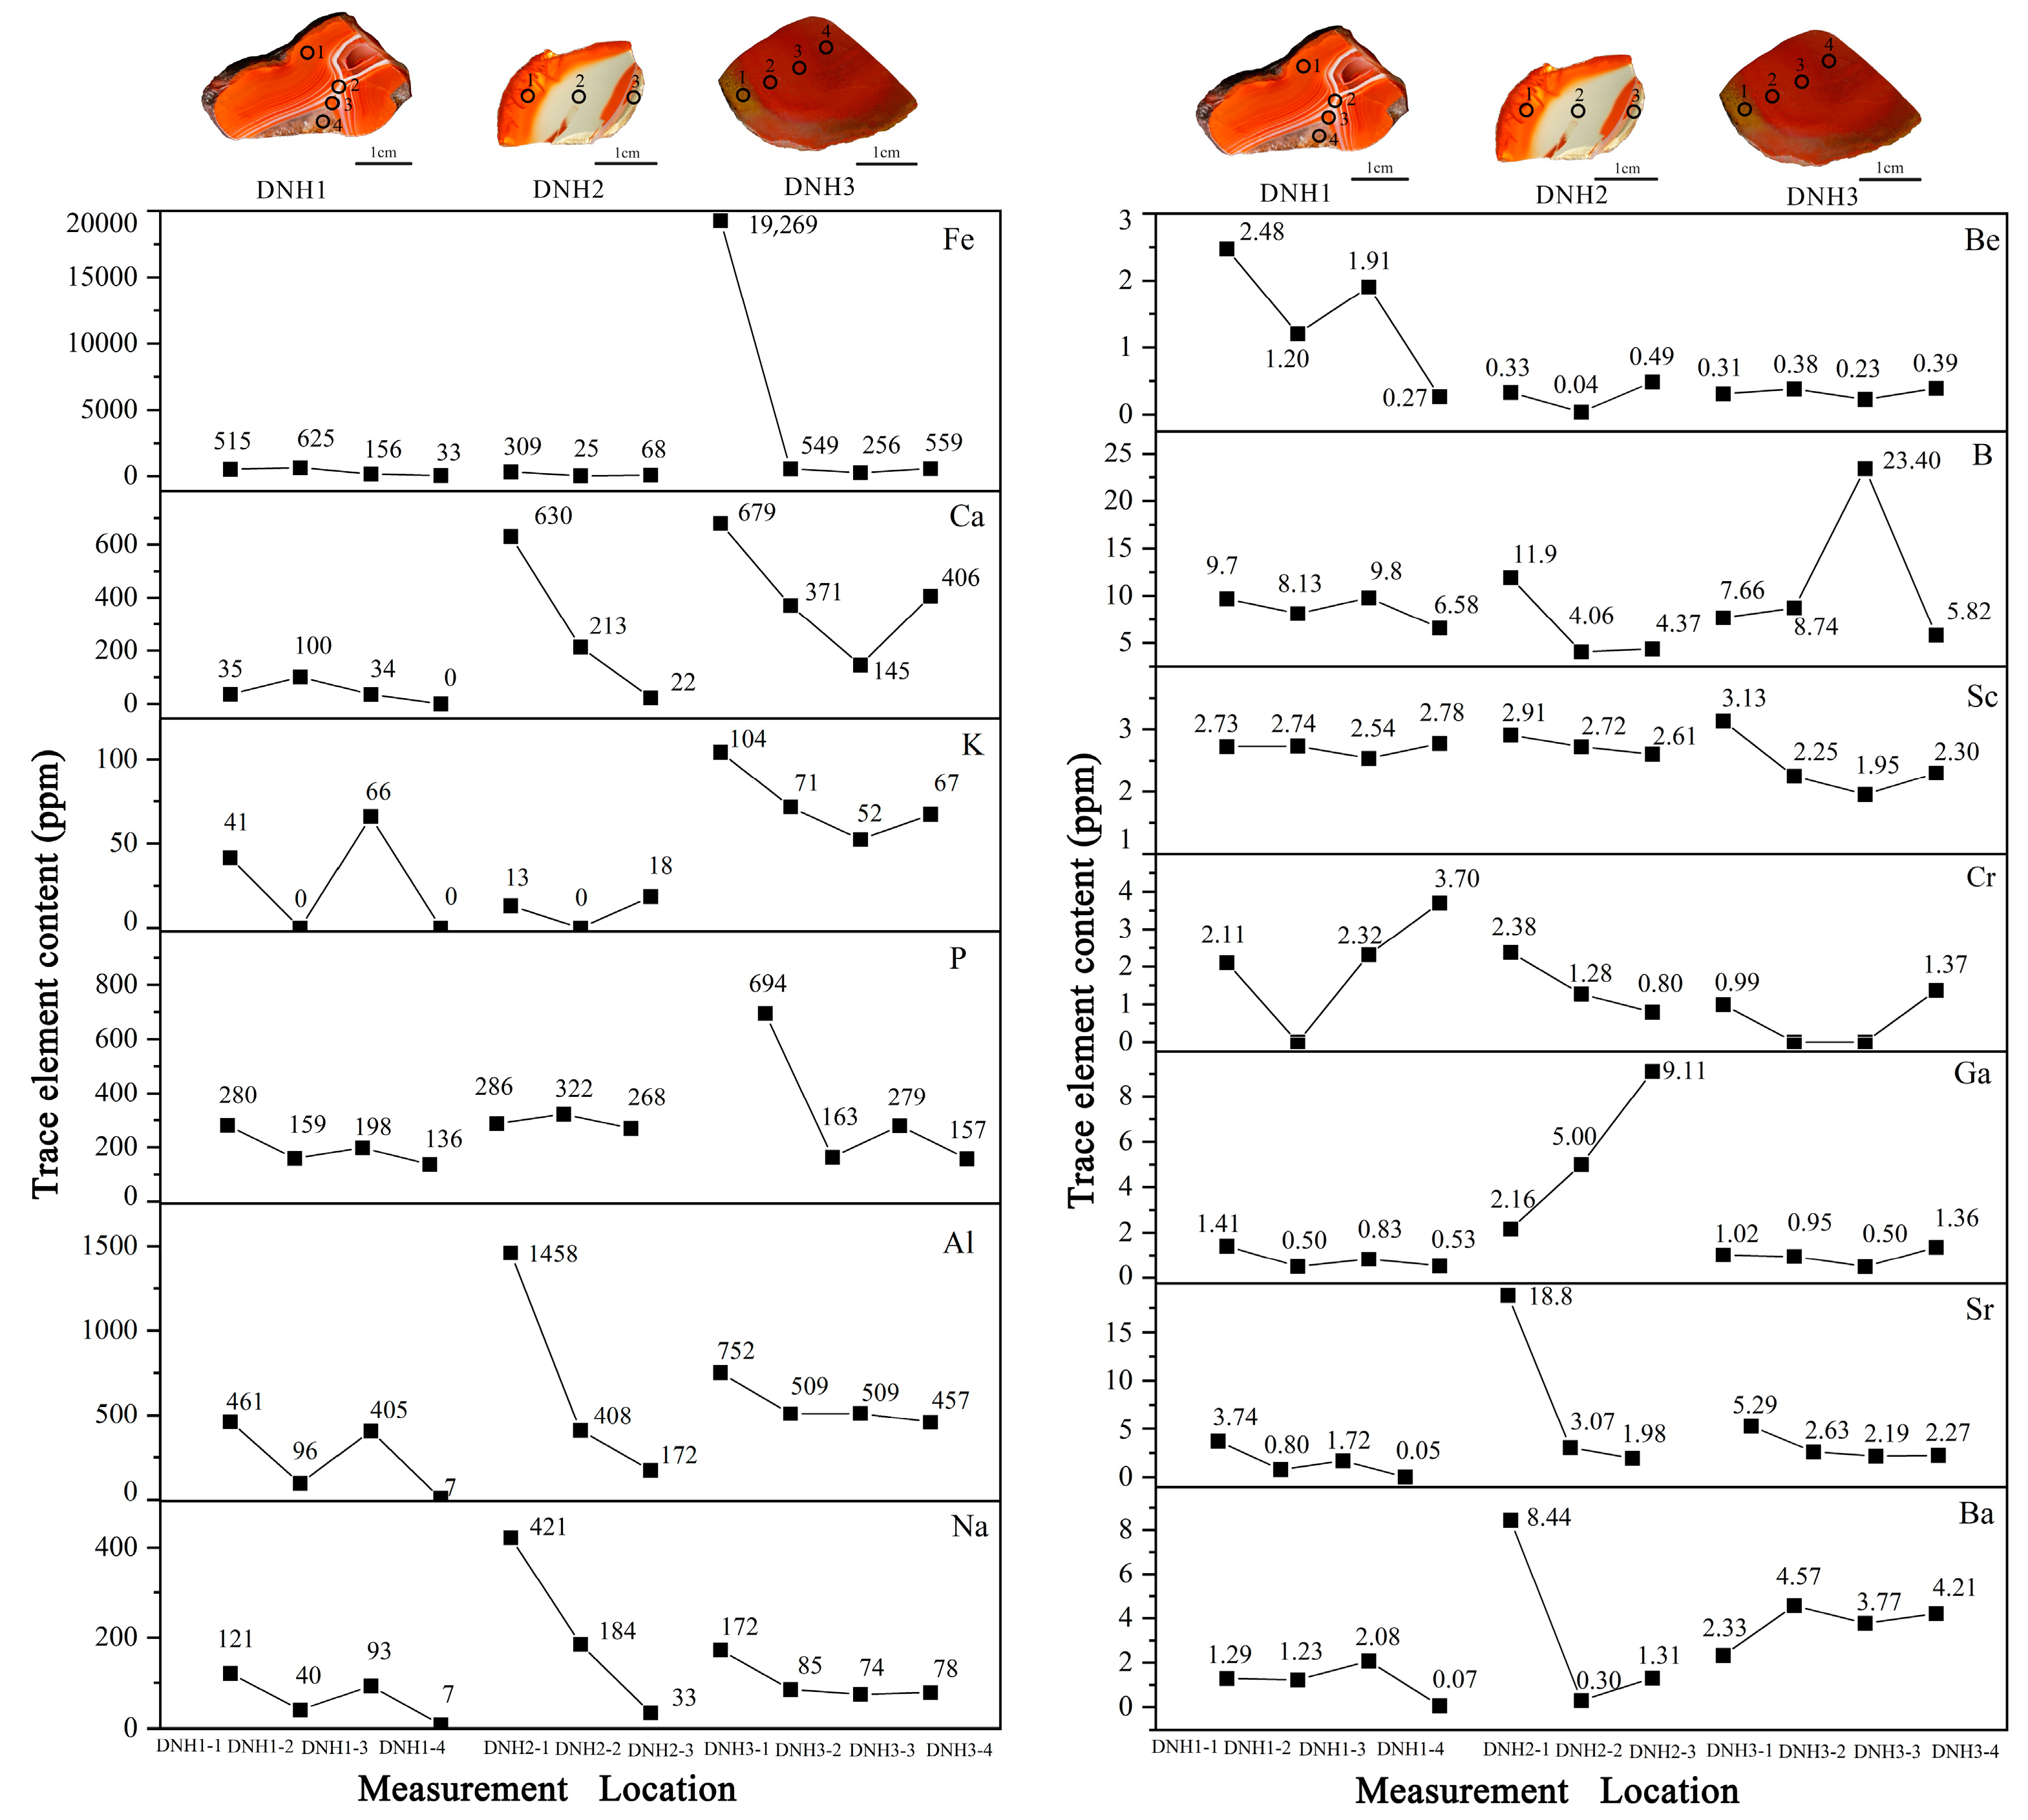
An electron probe was used to conduct in situ local chemical analyses on the three samples; the results are shown in Table 2, where it can be seen that the Nanhong agate from northeastern Yunnan is mainly composed of SiO2, the content of which is greater than 93 wt.%. The “jelly” SiO2 content reaches as high as 100 wt.%.
In order to better reflect the relationship between the bands and material contents of Nanhong agate, sample DNH1 was scanned (Figure 16). As can be seen from Figure 17, the band structure and color differences of Nanhong agate are closely related to the material components that it contains. Among them, obvious bands can be seen in the distribution of Si, Al, and Ca, and they match the real object to a high degree. The bands of Fe are distributed at the junction of the red and white bandings of the real object, while K has no obvious distribution pattern.
The analysis results of the main elements of sample DNH2 show that the SiO2 content is as high as 100 wt.%, while the contents of other elements are low. Point 1 of sample DNH3 is yellow in appearance, and the contents of Fe, Al, and Ca at this point are higher than those in the red region at point 2. The iron content in the yellow part (5.20 wt.%) is significantly higher than that in the red part (1.44 wt.%). It can be seen that the distribution characteristics of Fe are consistent with the EPMA analysis results according to the BSE diagram (Figure 18).

3.5. Trace Elements

The trace elements in the different-colored parts and strips of the three samples were analyzed using LA-ICP-MS, and the corresponding analysis results are presented in Figure 19.
In sample DNH1, the analysis points were distributed as follows: point 1 in the “bright red” area, point 2 in the white band, point 3 in the red part near the quartz, and point 4 in the quartz. Generally speaking, the trace element concentrations in the outer chalcedony (points 1–3) were typically higher than those found in the inner macrocrystalline quartz (point 4). The overall contents of trace elements in the red parts (points 1 and 3) surpassed those in the white parts (point 2). Therefore, overall, the trace element content curves of the three points present a “V” shape. However, a different trend was observed for Ca and Sc, the concentrations of which were higher in the white parts compared to the red parts.
In sample DNH2, the trace element concentrations displayed a declining trend from the outer to inner regions, except for Ga, which increased from the exterior towards the interior.
At analysis point 1 of DNH3, the concentrations of Fe, Ca, K, P, Al, and Na were notably higher compared to other red points, while the levels of Be, B, Sc, Cr, Ga, Sr, and Ba remained relatively stable.
The sample’s trace elements decreased from the outer to the inner areas, with higher concentrations in the red than the white areas, and the lowest in the macrocrystalline quartz. The “yellow-skinned” section had notably higher trace element levels than the other red areas.

3.6. Discussion

The three types of Nanhong agate examined in this study mainly show two color systems: red (yellow) and white. Through the above experiments, we found that the main factors that control the red and white coloration are the microscopic features inside the Nanhong agate, which differ significantly between the two color systems. Under a cross-polarized microscope, the microscopic mineral aggregates in the red bandings appeared relatively uniform and fibrous, and their SEM features presented uniform granular microscopic aggregates, with a few similar to “silica balls” and individual particles, and evenly distributed pores or cavities between particles or aggregates.
Under the polarizing microscope, the white bands appeared as fibrous or comb-like aggregates, with individual minerals exhibiting significant unidirectional extension, appearing as micro-elongated needle-like columns. The SEM micromorphological characteristics of the white bands significantly differed from those of the red bands, showing individuals of comb-like chalcedony extending unidirectionally in long columnar or elongated strip forms, with each individual closely aligned in the same direction. Between individuals, unidirectional extending pores or channels could sometimes be seen. Compared to the fibrous aggregates in the red bands, the porosity in the white bands was relatively lower.
As for the red color of Nanhong agate, we divided it into different types of red according to its depth; from deep to light, it was divided into bright red, persimmon red, etc. According to the EPMA and LA-ICP-MS experimental analysis, the redness of the agate is mainly determined by the contents of Fe and Al: the higher the Fe and Al contents, the deeper the red color.
The unique “yellow-skinned” agate found in Northeast Yunnan has significantly different characteristics from other agates. Through Raman spectrum analysis, the special yellow part first showed a characteristic peak of quartz that differs from other Nanhong agates. A relatively strong α-quartz characteristic Raman peak appeared at 394 cm−1, and its intensity was greater than 470 cm−1. Additionally, there were no characteristic Raman peaks of moganite and illite in this area. Since there were relatively strong characteristic peaks of goethite and weak characteristic Raman peaks of hematite in the yellow area, it can be inferred that goethite and hematite are jointly responsible for the color of the yellow area, but goethite is the main color-causing mineral.
The structure of “yellow-skinned” agate is also significantly different from that of other Nanhong agates. Observing the results under a cross-polarized polarizing microscope, the degree of crystallization was higher than that of other Nanhong agates. The SEM micromorphological features were all in the form of sheets that were closely arranged in the same direction and extended in a particular direction, there were unidirectional pores or channels between the aggregates, and the porosity was relatively high.
The material composition of the “yellow-skinned” patina differs from other agate varieties; trace element concentrations in the “yellow-skinned” areas are significantly higher than in the rest of the red areas. Elements such as Fe, Ca, K, P, Al, and Na are markedly elevated compared to other red analysis points, with Fe content notably exceeding that of other points, while elements like Be, B, Sc, Cr, Ga, Sr, and Ba show minimal variation.

4. Conclusions

This paper presented a study on the gemology, spectroscopy, microstructure, and geochemical characteristics of Nanhong agate from northeastern Yunnan.
The infrared and Raman spectra showed that the Nanhong agate in northeastern Yunnan is mainly composed of α-quartz, and it also contains certain amounts of moganite, illite, goethite, and hematite.
Under polarizing microscopy and scanning electron microscopy, the three representative Nanhong agates showed different microstructural characteristics. The main factors controlling the red and white coloration of Nanhong agate are its different internal structural characteristics.
EPMA and EDS showed that southern red agate in northeastern Yunnan is mainly composed of SiO2, followed by FeO and Al2O3. EPMA and LA-ICP-MS analyses of various red substances revealed that the intensity of redness is dictated by the concentration of these substances, with Fe and Al content being crucial in determining the hue of agate. A higher content of Fe and Al correlates with a more intense red, while the presence of other trace elements also exhibits a certain influence. The trace elements in the sample exhibited a decrease in concentration from the outer to inner areas. Specifically, the red areas had higher concentrations compared to the white areas, while the macrocrystalline quartz showed the lowest levels of trace elements. Notably, the “yellow-skinned” section displayed significantly higher trace element levels compared to other red areas.
Finally, the Raman spectrum, microstructure, and elemental contents of the “yellow-skinned” agate unique to northeast Yunnan were significantly different from those of other agates. This work lays a foundation for the future identification and research of this type of Nanhong agate.

Author Contributions

Conceptualization, Q.S., S.Z. and W.L.; data curation, Q.S. and X.Y.; formal analysis, Q.S. and S.S.; investigation, L.C. and W.P.; methodology, Q.S., S.Z. and W.L.; project administration, Q.S.; resources, Q.S.; software, Q.S. and X.C.; validation, Q.S., R.Z., S.Z. and W.L.; visualization, Q.S.; writing—original draft, Q.S.; writing—review and editing, Q.S. All authors have read and agreed to the published version of the manuscript.

Funding

This research was funded by Yunnan Key Laboratory of Geotechnical Engineering and Geohazards, grant number YNYDK-202204.

Data Availability Statement

All data are contained within the article.

Acknowledgments

I would like to thank the team members for accompanying me to Zhaotong and Huize in northeast Yunnan, Southwest China, for field investigation and sampling. I would also like to thank the reviewers for their professional insights, which have greatly expanded my knowledge; the teachers Xing Liu and Jun Zhu of Kunming University of Science and Technology for their valuable suggestions on this article; and Xiaoying Cui from the Analytic & Testing Research Center of Yunnan for her guidance in the spectroscopy experiments. We are grateful to all reviewers and editors for their constructive and helpful comments, which significantly improved the manuscript.

Conflicts of Interest

Author Qiuyun Song, Sugang Sui and Wenlian Liu were employed by the company Kunming Prospecting Design Institute of China Nonferrous Metals Industry Co., Ltd. Author Wenzhou Pu was employed by the company China ENFI Engineering Technology Co., Ltd. The remaining authors declare that the research was conducted in the absence of any commercial or financial relationships that could be construed as a potential conflict of interest.

References

  1. Götze, J.; Möckel, R.; Pan, Y.M. Mineralogy, Geochemistry and Genesis of Agate—A Review. Minerals 2020, 10, 1037. [Google Scholar] [CrossRef]
  2. Moxon, T.; Palyanova, G. Agate Genesis: A Continuing Enigma. Minerals 2020, 10, 953. [Google Scholar] [CrossRef]
  3. Gotze, J.; Nasdala, L.; Kleeberg, R.; Wenzel, N. Occurrence and distribution of “moganite” in agate/chalcedony: A combined micro-Raman, Rietveld, and cathodoluminescence study. Contrib. Miner. Petr. 1998, 133, 96–105. [Google Scholar] [CrossRef]
  4. Moxon, T.; Ríos, S. Moganite and water content as a function of age in agate: An XRD and thermogravimetric study. Eur. J. Miner. 2004, 16, 269–278. [Google Scholar] [CrossRef]
  5. Svetova, E.N.; Palyanova, G.A.; Borovikov, A.A.; Posokhov, V.F.; Moroz, T.N. Mineralogy of Agates with Amethyst from the Tevinskoye Deposit (Northern Kamchatka, Russia). Minerals 2023, 13, 1051. [Google Scholar] [CrossRef]
  6. Svetova, E.N.; Svetov, S.A. Agates from Mesoproterozoic Volcanics (Pasha-Ladoga Basin, NW Russia): Characteristics and Proposed Origin. Minerals 2023, 13, 62. [Google Scholar] [CrossRef]
  7. Shen, M.M.; Lu, Z.Y.; He, X.M. Mineralogical and Geochemical Characteristics of Banded Agates from Placer Deposits: Implications for Agate Genesis. ACS Omega 2022, 7, 23858–23864. [Google Scholar] [CrossRef]
  8. Svetova, E.N.; Chazhengina, S.Y.; Stepanova, A.V.; Svetov, S.A. Black Agates from Paleoproterozoic Pillow Lavas (Onega Basin, Karelian Craton, NW Russia): Mineralogy and Proposed Origin. Minerals 2021, 11, 918. [Google Scholar] [CrossRef]
  9. Goetze, J.; Stanek, K.; Orozco, G.; Liesegang, M.; Mohr-Westheide, T. Occurrence and Distribution of Moganite and Opal-CT in Agates from Paleocene/Eocene Tuffs, El Picado (Cuba). Minerals 2021, 11, 531. [Google Scholar] [CrossRef]
  10. Svetova, E.N.; Svetov, S.A. Agates from Paleoproterozoic Volcanic Rocks of the Onega Structure, Central Karelia. Geol. Ore Depos. 2020, 62, 669–681. [Google Scholar] [CrossRef]
  11. Goldbaum, J.; Howard, C.; Rabinovitch, A. Spatial Chirp of Agate Bands. Minerals 2019, 9, 634. [Google Scholar] [CrossRef]
  12. Götze, J.; Berek, H.; Schäfer, K. Micro-structural phenomena in agate/chalcedony: Spiral growth. Miner. Mag. 2019, 83, 281–291. [Google Scholar] [CrossRef]
  13. Lorenzi, R.; Zullinow, A.; Gagliardi, V.; Prosperi, L.; Paleari, A.; Adamo, I. Atomic and microstructural origin of banded colours in purple-blue variety of agate from Yozgat Province, Turkey. Phys. Chem. Miner. 2022, 49, 33. [Google Scholar] [CrossRef]
  14. Conte, A.; Della Ventura, G.; Rondeau, B.; Romani, M.; Guidi, M.C.; La, C.; Napoleoni, C.; Lucci, F. Hydrothermal genesis and growth of the banded agates from the Allumiere-Tolfa volcanic district (Latium, Italy). Phys. Chem. Miner. 2022, 49, 39. [Google Scholar] [CrossRef]
  15. Natkaniec-Nowak, L.; Dumanska-Slowik, M.; Gawel, A.; Latkiewicz, A.; Kowalczyk-Szpyt, J.; Wolska, A.; Milovská, S.; Luptáková, J.; Ladon, K. Fire agate from the Deer Creek deposit (Arizona, USA)—New insights into structure and mineralogy. Miner. Mag. 2020, 84, 343–354. [Google Scholar] [CrossRef]
  16. Mrozik, M.; Götze, J.; Pan, Y.M.; Möckel, R. Mineralogy, Geochemistry, and Genesis of Agates from Chihuahua, Northern Mexico. Minerals 2023, 13, 687. [Google Scholar] [CrossRef]
  17. Zhou, Y.F.; Liu, Z.Y.; Zhao, Z.T.; Guo, Y. Quantitative Study on Colour and Spectral Characteristics of Beihong Agate. Minerals 2022, 12, 677. [Google Scholar] [CrossRef]
  18. Götze, J.; Möckel, R.; Kempe, U.; Kapitonov, I.; Vennemann, T. Characteristics and origin of agates in sedimentary rocks from the Dryhead area, Montana, USA. Miner. Mag. 2009, 73, 673–690. [Google Scholar]
  19. Götze, J.; Möckel, R.; Vennemann, T.; Müller, A. Origin and geochemistry of agates in Permian volcanic rocks of the Sub-Erzgebirge basin, Saxony (Germany). Chem. Geol. 2016, 428, 77–91. [Google Scholar] [CrossRef]
  20. Zhang, X.M.; Ji, L.; He, X.M. Gemological Characteristics and Origin of the Zhanguohong Agate from Beipiao, Liaoning Province, China: A Combined Microscopic, X-ray Diffraction, and Raman Spectroscopic Study. Minerals 2020, 10, 401. [Google Scholar] [CrossRef]
  21. Zhang, S.X.; Cui, L.; Guo, Q.F.; Li, N.; Liu, Y.; Rao, Y.H.; Liao, L.B. A Comparative Study on Gemological Characteristics and Color Formation Mechanism of Moqi Agate, Inner Mongolia Province, China. Crystals 2023, 13, 977. [Google Scholar] [CrossRef]
  22. Lu, Z.Y.; He, X.M.; Guo, Q.F. Color and Genesis of Beihong Agate and Its Spectroscopic Characteristics. Spectrosc. Spect. Anal. 2020, 40, 2531–2537. [Google Scholar]
  23. Zhou, D.Y.; Shi, G.H.; Liu, S.Z.; Wu, B.L. Mineralogy and Magnetic Behavior of Yellow to Red Xuanhua-Type Agate and Its Indication to the Forming Condition. Minerals 2021, 11, 877. [Google Scholar] [CrossRef]
  24. Guo, W.; Wang, S. Mineralogical characteristics and coloration mechanism of Nanhong agate from Baoshan, Yunnan Province. Acta Petrol. Miner. 2017, 36, 419–430. [Google Scholar]
  25. Guo, M.; Wang, W.W.; Liu, H.; Lu, Z.; Yin, Z.W. Raman Spectral Analysis on a Special Band of Nanhong Agate. Spectrosc. Spect. Anal. 2021, 41, 1271–1275. [Google Scholar]
  26. Yang, L.Y.; Yan, S.W.; Wang, H.T.; Zhang, Y.T.; Wang, R.Y.; Yang, M.X.; Wang, C.W. Spectral Characteristics of Two Kinds of Nanhong Agate Imitations. Spectrosc. Spect. Anal. 2022, 42, 835–840. [Google Scholar]
  27. Xu, S.; Chen, D.P.; Shi, X.P. Unique metal sulfide inclusion in”Bing Piao” red agate from Liangshan, China. Gems Gemol. 2021, 57, 166–167. [Google Scholar]
  28. Xu, S.; Chen, D.P.; Shi, X.P. An unusual treated agate presented as “Shi Zi Hong” agate from Liangshan. Gems Gemol. 2021, 57, 96–98. [Google Scholar]
  29. Lu, Z.Y.; He, X.M.; Lin, C.L.; Jin, X.Y.; Pan, Y.M. Identification of Beihong Agate and Nanhong Agate from China Based on Chromaticity and Raman Spectra. Spectrosc. Spect. Anal. 2019, 39, 2153–2159. [Google Scholar]
  30. Zhang, Z.Q.; Zhao, T.; Liu, L.; Li, Y. Spectral Characteristics of Madagascar Agates. Spectrosc. Spect. Anal. 2021, 41, 3227–3232. [Google Scholar]
  31. Kathleen, J.K.; Russell, J.H. Raman spectroscopic study of microcrystalline silica. Am. Miner. 1994, 79, 269–273. [Google Scholar]
  32. Legodi, M.A.; de Waal, D. The preparation of magnetite, goethite, hematite and maghemite of pigment quality from mill scale iron waste. Dyes Pigment. 2007, 74, 161–168. [Google Scholar] [CrossRef]
Figure 1. Appearance of the samples used in the present study: (a) DNH1; (b) DNH2; (c) DNH3.
Crystals 14 00388 g001
Figure 2. FTIR spectra of the Nanhong agates (DNH1–DNH3).
Crystals 14 00388 g002
Figure 3. Infrared absorption transmission spectrum (DNH1–DNH3).
Crystals 14 00388 g003
Figure 4. UV–VIS spectra of typical Nanhong agate sample DNH1.
Crystals 14 00388 g004
Figure 5. UV–VIS spectra of typical Nanhong agate sample DNH2.
Crystals 14 00388 g005
Figure 6. UV–VIS spectra of typical Nanhong agate sample DNH3.
Crystals 14 00388 g006
Figure 7. Raman spectra of Nanhong agate sample DNH1.
Crystals 14 00388 g007
Figure 8. Raman spectra of Nanhong agate sample DNH3.
Crystals 14 00388 g008
Figure 9. Raman spectra of Nanhong agate sample DNH3 (yellow part).
Crystals 14 00388 g009
Figure 10. Structural characteristics of sample DNH1: (a) physical photo; (b) photo under a crossed polarizer corresponding to (a); (c) magnified image of the area marked by the white rectangle in (b); (d) standard magnified secondary electron (SE) SEM image of a site in (c); (e) SEM red and white stripe interface features, where (1) is the red banding and (2) is the white banding; (f) SEM of red banding under high magnification (10,000×); (g) SEM of white banding under high magnification (10,000×). Sc, spherulitic chalcedony; Fc, fibrous chalcedony; Qtz, quartz.
Crystals 14 00388 g010
Figure 11. Microscopic morphology of the fibrous structure within the red banding, as observed via SEM: (a) SE image, (b) BSE image.
Crystals 14 00388 g011
Figure 12. Structural characteristics of sample DNH2: (a) physical photo; (b) photo under a crossed polarizer corresponding to the position of the white frame in (a); (c) photo of chalcedony under a crossed polarizer; (d) standard secondary electron (SE) SEM images of chalcedony with high transparency (20,000×); (e) magnified image of the area marked by the white rectangle in (d) (40,000×); (f) standard secondary electron (SE) SEM images of the red part of chalcedony (20,000×); (g) magnified image of the area marked by the white rectangle in (f) (40,000×). Fc, fibrous chalcedony; Mq, microcrystalline quartz; Cha, chalcedony.
Crystals 14 00388 g012
Figure 13. EDS analysis results of the red part of sample DNH2: (a) EDS collection point distribution map; (b) Map 1; (c) Map 2; (d) Map 3.
Crystals 14 00388 g013
Figure 14. Structural characteristics of sample DNH3: (a) photograph of the object; (b) the orthogonal polarizer photograph corresponding to the position of the white rectangle in (a); (c) orthogonal polarizing photos of the yellow banding; (d) single-polarizer photos with yellow banding; (e) orthogonal polarizing photos at the intersection of the yellow and red bands; (f) single-polarizer photos at the intersection of the yellow and red bands. The red arrows indicate the direction of agate growth. Mq, microcrystalline quartz; Pg, pseudo-granular.
Crystals 14 00388 g014
Figure 15. SEM micro-features of sample DNH3: (a) SEM micro-features of the yellow part (20,000×); (b) SEM micro-features of the yellow part (40,000×); (c) SEM micro-features of the red part (20,000×); (d) SEM micro-features of the red part (40,000×).
Crystals 14 00388 g015
Figure 16. EPMA mapping position of sample DNH1 (black rectangle).
Crystals 14 00388 g016
Figure 17. EPMA mapping of sample DNH1: (ae) Distribution maps of Si, Al, Fe, Ca, and K, respectively; (f) secondary electron image; (g) backscatter electron image; (h) analysis position photograph. The red parts on the left of each map are the comparison photo of the real object. The color code (scale) of the semi-quantitative element distributions indicates signal strength.
Crystals 14 00388 g017
Figure 18. BSE image of sample DNH3: (a) yellow part; (b) red part.
Crystals 14 00388 g018
Figure 19. Trace element concentration profiles across different color bandings in samples DHN1-DNH3.
Crystals 14 00388 g019
Table 1. Sample DNH2’s atomic percentage contents (At%), as determined by EDS.
Sample PointOSiAlFe
Point 168.530.31.2
Point 266.731.61.7
Point 363.230.91.74.1
Table 2. EPMA data for the Nanhong agates (wt.%).
Sample NumberDNH2-01DNH2-02DNH3-01DNH3-02
SiO2100.02100.0593.8199.13
TiO20.000.000.050.00
Al2O30.060.030.130.07
FeO0.010.005.201.44
MnO0.000.000.010.00
MgO0.000.000.000.01
CaO0.020.020.040.02
Na2O0.020.030.000.00
K2O0.010.000.010.01
P2O50.000.000.100.02
UO20.010.000.000.00
SO30.000.000.000.00
Total100.16100.1399.34100.69
Disclaimer/Publisher’s Note: The statements, opinions and data contained in all publications are solely those of the individual author(s) and contributor(s) and not of MDPI and/or the editor(s). MDPI and/or the editor(s) disclaim responsibility for any injury to people or property resulting from any ideas, methods, instructions or products referred to in the content.

