3. Results and Discussion
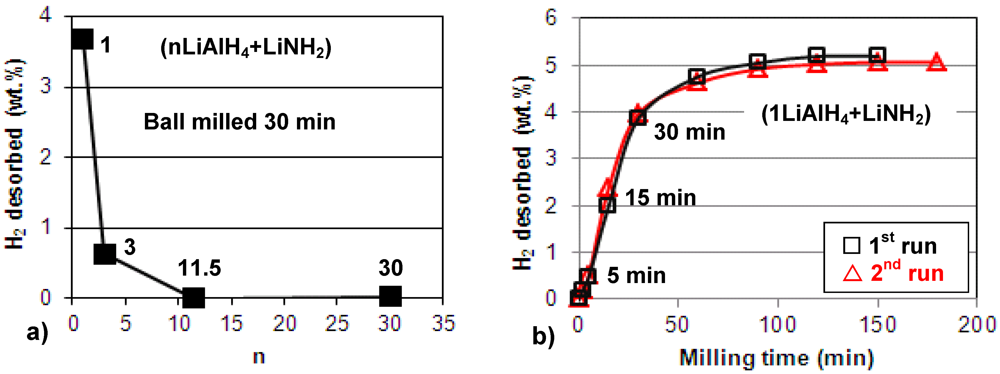
Figure 1a shows the quantity of H
2 desorbed during ball milling, plotted as a function of the molar ratio
n in the (nLiAlH
4 + LiNH
2) composite. It is observed that during ball milling up to 30 min., the composites with molar ratios
n = 1 and 3 gradually release H
2. In particular,
Figure 1b shows that for
n = 1 further ball milling up to 100–150 min releases as much as 5 wt.% H
2. We repeated the milling test in
Figure 1b twice (1st and 2nd run) to confirm that the results are reproducible. As can be seen, the hydrogen desorption during ball milling for the composite with
n = 1 is perfectly reproducible and the quantity of desorbed H
2 is nearly exactly the same for the 1st and 2nd run. Also,
Figure 1a shows that the composites with
n = 11.5 and greater do not release hydrogen during milling up to 30 min.
Figure 1.
The quantity of H2 desorbed during ball milling for (nLiAlH4 + LiNH2) as a function of (a) the molar ratio n (the numbers show the corresponding values of n) and (b) milling time for the composite with n = 1.
Figure 1.
The quantity of H2 desorbed during ball milling for (nLiAlH4 + LiNH2) as a function of (a) the molar ratio n (the numbers show the corresponding values of n) and (b) milling time for the composite with n = 1.
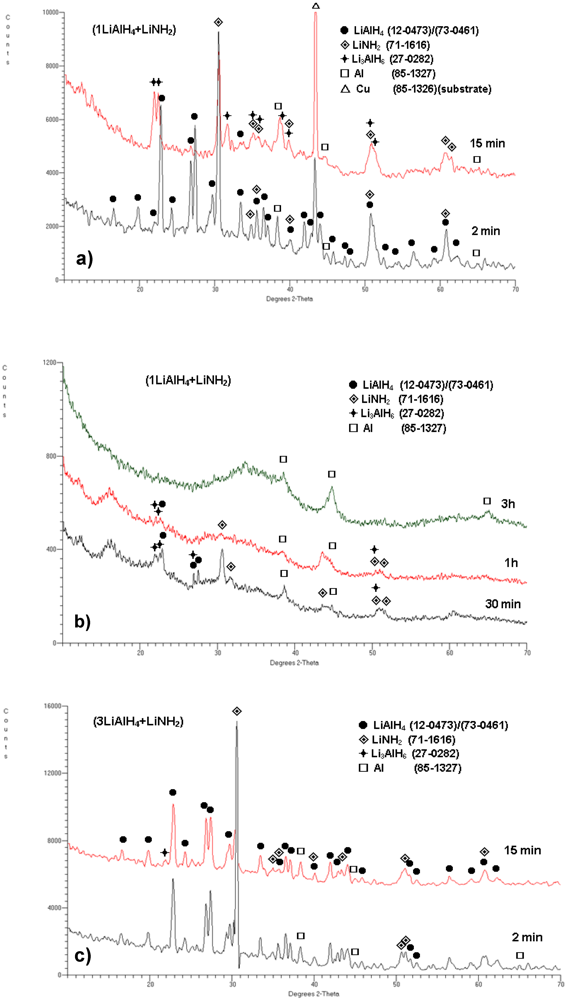
In order to obtain more insight into the phase changes occurring during ball milling as a function of milling time and molar ratio, X-ray diffraction (XRD) tests were carried out on the composite samples extracted after pre-determined milling durations. The XRD patterns are shown in
Figure 2. The XRD pattern for the
n = 1 composite (
Figure 2a) shows that after 2 min of milling the diffraction peaks of both constituents LiAlH
4 and LiNH
2 are still clearly observed. There is also a peak of Al which is an impurity in as received LiAlH
4 [
11,
12]. After 15 min of ball milling, the principal peaks of Li
3AlH
6 appear and the principal Al peak becomes stronger, indicating that more Al is formed during milling. It must be pointed out that the presence of the strong diffraction peaks of LiNH
2 indicates that no chemical reaction between LiAlH
4 and LiNH
2 occurred during ball milling.
Figure 2.
XRD patterns for (a) (1LiAlH4 + LiNH2) after milling for 2 and 15 min, (b) (1LiAlH4 + LiNH2) after milling for 30 min, 1 h and 3 h, and (c) (3LiAlH4 + LiNH2) after milling for 2 and 15 min. The ICDD file numbers for phase identification are shown in the legend.
Figure 2.
XRD patterns for (a) (1LiAlH4 + LiNH2) after milling for 2 and 15 min, (b) (1LiAlH4 + LiNH2) after milling for 30 min, 1 h and 3 h, and (c) (3LiAlH4 + LiNH2) after milling for 2 and 15 min. The ICDD file numbers for phase identification are shown in the legend.
As can be seen in
Figure 2b for the
n = 1 composite, with increasing ball milling time to 30 min, 1 h and 3 h, the peaks become broadened and diffused as well as a pronounced rise in the baselines and the formation of a broad “hump” in the range of 2
θ = 30–40° are observed, which can be attributed to heavy nanostructuring or even the existence of increasing quantities of amorphous structure(s) [
7,
8]. The 100% intensity peaks of LiAlH
4, LiNH
2 and Li
3AlH
6 are still visible after 30 min and even after 1 h of milling although much weakened (
Figure 2b). There are also clear peaks which we assign to Al. It is interesting that Xiong
et al. [
7], in their first paper on the ball milling of (1LiAlH
4 + LiNH
2)(molar ratio
n = 1) reported that the peaks of Al were clearly observed in the XRD patterns of the ball milled samples, although they were gradually weakened with milling time. However, in their second paper [
8] on the ball milling of (0.5LiAlH
4 + LiNH
2)(molar ratio
n = 0.5) they reported that no Al peaks were detected during the milling process. In contrast, Dolotko
et al. [
10] reported that no Al was detected in the (1LiAlH
4 + LiNH
2) composite during ball milling but instead they concluded that the amorphous AlN compound was formed during ball milling. On that basis, they proposed that a solid state reaction between LiAlH
4 and LiNH
2 occurred during ball milling which resulted in the formation of AlN, 2LiH and 2H
2. The quantity of H
2 released in this transformation is 6.6 wt.% which they claimed to be released after 30 min of ball milling.
However, we believe that the peaks assigned to Al in
Figure 2a, b for the milling duration from 2 min to 1 h of milling, indeed correspond to Al and not to AlN. There is some ambiguity here because the Fm3m space group of Al (ICDD 85-1327) is identical to AlN (ICDD 46-1200), which means that their XRD diffraction patterns practically superimpose. However, the intensities of the principal peaks of Al and AlN are opposite. For Al the (111) peak at 2
θ = 38.5° and (200) peak at 2
θ = 44.7° has 100 and 50% intensity, respectively. For AlN the intensity of (111)(2
θ = 38.5°), (200)(2
θ = 44.7°) and (220) (2
θ = 65.1°) peak is 30, 100 and 55%, respectively. The XRD patterns in
Figure 2a, b show that from 2 min to 1 h of milling duration the order of intensities for the peaks assigned to Al corresponds rather unambiguously to Al. However, the order of peak intensities changes after 3 h of milling since the first peak assigned to Al in this pattern (
Figure 2b) is weaker than the second one and also the third peak at around 2
θ = 65° appears. This intensity order may correspond to AlN. However, the observed alterations in the intensities of peaks assigned to Al after 3 h milling could also, at least to some extent, be induced by severe nanostructuring/amorphization of the ball-milled composite powders. Still, the maximum desorbed quantity of 5 wt.% H
2, reproducibly observed after 3 h of milling (
Figure 1b), does not support the reaction path involving the formation of AlN which requires 6.6 wt.% H
2 as claimed by Dolotko
et al. [
10]. The XRD patterns for the (3LiAlH
4 + LiNH
2) (
n = 3) composite after ball milling for 2 and 15 min (
Figure 2c) still indicate the presence of both LiAlH
4, LiNH
2 and Al, the latter being a pre-existing impurity for the composite milled for 2 min. After 15 min milling a very small principal peak of Li
3AlH
6 appears.
In general, it is well-known in the literature [
2,
11,
12,
13] that the dehydrogenation of LiAlH
4 in solid state occurs in three stages as shown below:
Only reactions (1) and (2) are accessible for practical hydrogen storage, because they occur up to roughly 250 °C in DSC tests. Reaction (3) occurs much above 300 °C and is of no interest [
2,
11,
12,
13]. Theoretical H
2 capacity of reactions (1) and (2) is 5.3 and 2.6 wt.%, respectively, which, for 97% pure LiAlH
4 used in this work, reduces to 5.14 and 2.52 wt.%, respectively. The composite with the molar ratio of
n = 1 (1LiAlH
4 + LiNH
2) corresponds to a weight ratio of 62.3 wt.% LiAlH
4 and 37.7 wt.% LiNH
2. Therefore, at this weight ratio, fully completed reactions (1) and (2) should provide approximately purity-corrected 3.2 and 1.6 wt.% H
2, respectively. Since ~5 wt.% H
2 is released after 150 min ball milling (
Figure 1b), both reactions must have occurred during ball milling. This is a very interesting observation because in a thermal DSC test, reaction (1) is exothermic and (2) is endothermic [
2,
12,
13]. That would suggest that both types of reactions, thermodynamically opposite, have been realized during high energy ball milling of hydride composites in the present work. However, since during ball milling the overall temperature increase in the milling vial is very small then the question arises whether the thermodynamic character of both reactions, which are now induced by mechanical energy, remains the same as that at elevated temperatures in a DSC test.
Furthermore, it seems that the entire quantity of H
2 desorbed during ball milling for the
n = 1 composite (
Figure 1b) can be easily provided by reactions (1) and (2) without invoking other reactions as claimed by Dolotko
et al. [
10]. The fact that the diffraction peaks of LiNH
2 in the
n = 1 composite persist throughout a long period of milling (
Figure 2a, b) indicates that LiNH
2 does not react/decompose but most likely becomes heavily nanostructured or even partially amorphized, and in this capacity destabilizes LiAlH
4 during ball milling and enhances its decomposition according to reactions (1) and (2) without involvement of any other reactions. However, with decreasing molar content of LiNH
2 in the composite (
n = 3 and larger), LiNH
2 somehow ceases to destabilize LiAlH
4 during ball milling. At the content of 5 wt.% (
n = 11.5) no release of H
2 is observed (
Figure 1b) for the applied milling time.
So far, such observations have never been reported in the literature. However, at the moment it is difficult to propose any detailed molecular mechanism by means of which LiNH
2 destabilizes LiAlH
4 during ball milling and, furthermore, the dependence of that mechanism on the molar ratio of the composite. Xiong
et al. [
7] pointed out that LiNH
2 may not work as a simple catalyst. They tried to get more insight into the role of LiNH
2 in the (0.5LiAlH
4 + LiNH
2) composite using Nuclear Magnetic Resonance (NMR) and Infrared Fourier Transform (FTIR) measurements. They came to the conclusion that an intermediate with the approximate chemical composition of “Li
3AlN
2H
4” was formed during milling. However, in their interpretation “Li
3AlN
2H
4” is not really a new hydride but a mixture of (LiNH
2 + AlN + 2LiH) - either amorphous or poorly crystalline. However, our XRD patterns in
Figure 2a,b convincingly show that the peaks of LiAlH
4, Li
3AlH
6, LiNH
2 and Al are clearly observed after up to 1 h of high energy ball milling although they become progressively broader and weaker. Their persistent presence does not support the existence of any new intermediates and their broadening/weakening is quite typical for the progressive occurrence of nanostructuring/amorphization during ball milling.
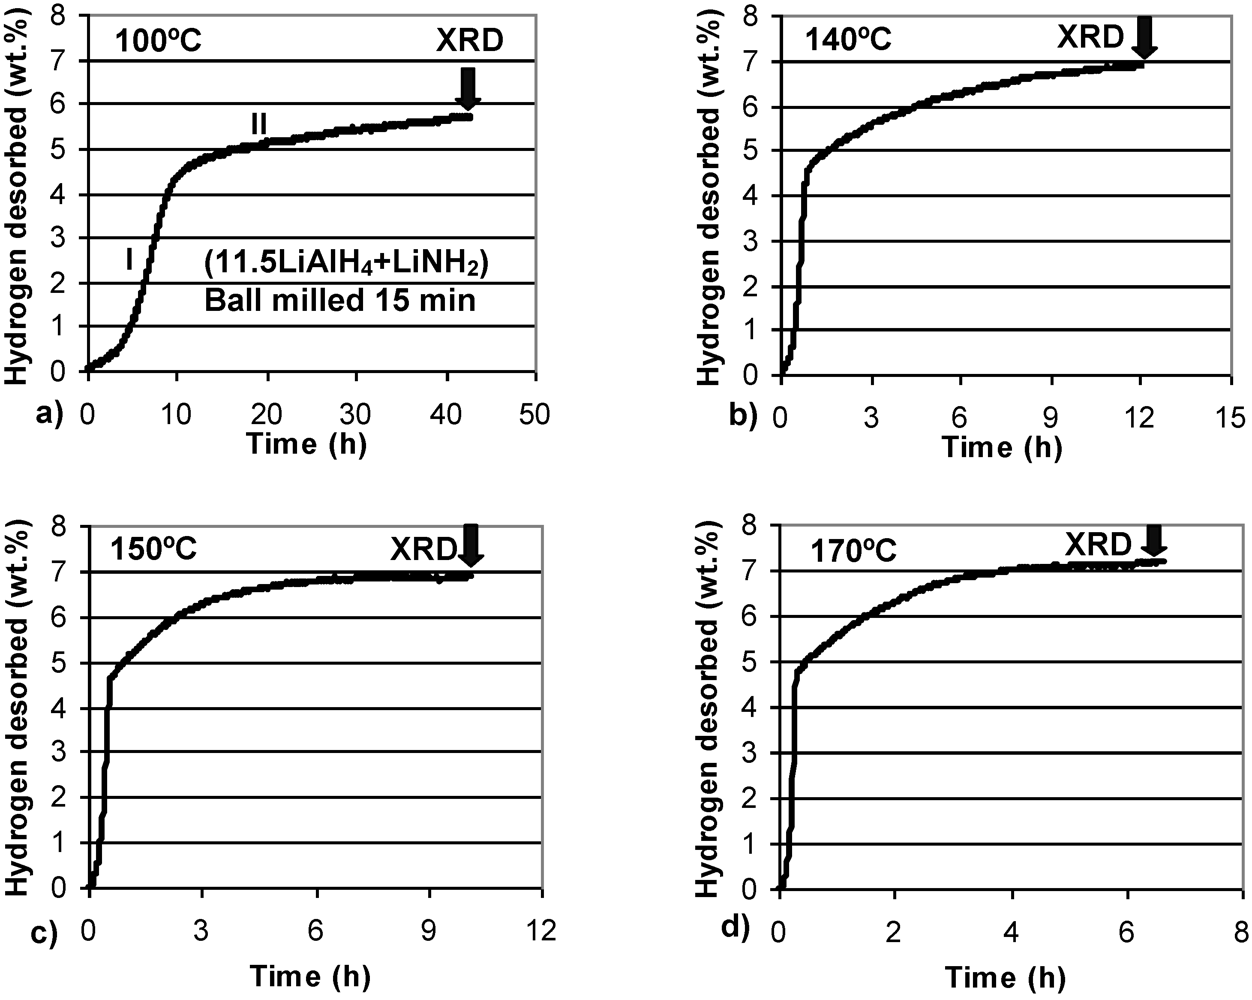
Figure 3 shows volumetric isothermal dehydrogenation curves at four temperatures for (1LiAlH
4 + LiNH
2) ball milled for 2 min. In this case, a short milling time was used to avoid any desorption of H
2 during milling (
Figure 1b). The composite is able to dehydrogenate at 100 °C, although at a slow rate. Barely ~3 wt.% H
2 is desorbed after a very long time of 43 h. However, this quantity of H
2 is in excellent agreement with the purity-corrected H
2 capacity of reaction (1) in the
n = 1 composite, as discussed above. This finding further supports our explanation. With increasing temperature the rate of dehydrogenation increases, as expected, but still remains relatively sluggish. Even at 170 °C about 7 h time duration is required to desorb 5 wt.% H
2. It is also seen that at 140, 150 and 170 °C dehydrogenation curves exhibit two clear stages, designated I and II in
Figure 3b. Stage I always desorbs ~3 wt.% H
2 while Stage II desorbs the rest of the total quantity of H
2. Apparently, Stage I and II correspond closely to reactions (1) and (2), respectively.
Figure 3.
Volumetric dehydrogenation curves at (a) 100°C, (b) 140°C, (c)150°C and (d) 170°C (at 1 bar H2) for (1LiAlH4 + LiNH2) ball milled for 2 min. The arrows indicate the end time of dehydrogenation after which samples were taken for XRD tests.
Figure 3.
Volumetric dehydrogenation curves at (a) 100°C, (b) 140°C, (c)150°C and (d) 170°C (at 1 bar H2) for (1LiAlH4 + LiNH2) ball milled for 2 min. The arrows indicate the end time of dehydrogenation after which samples were taken for XRD tests.
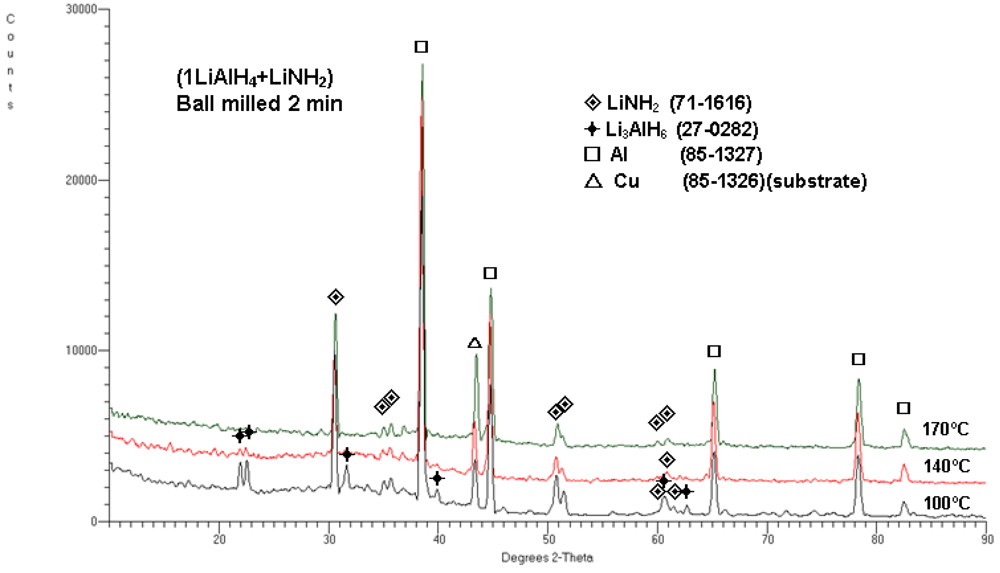
In order to investigate phase transformations occurring during isothermal dehydrogenation, the powder samples were extracted after completion of each desorption time as shown by the arrows in
Figure 3 and were studied by XRD.
Figure 4 shows the typical XRD patterns obtained after dehydrogenation at 100, 140 and 170 °C. As can be seen, the microstructure after dehydrogenation at 100 °C shows the presence of Li
3AlH
6, LiNH
2 and Al which indicate that reaction (1) is already completed since ~3 wt.% H
2 is desorbed (
Figure 3a). After dehydrogenation at 140 °C, very weak principal diffraction peaks of Li
3AlH
6 are still visible together with strong Al peaks and basically unchanged LiNH
2 peaks. The quantity of ~4.4 wt.% H
2 desorbed (
Figure 3b) indicates that reaction (2) is near completion. Finally, after completion of dehydrogenation at 170 °C no peaks of Li
3AlH
6 are visible while strong Al and LiNH
2 peaks are clearly seen. This microstructure corresponds to desorption of 5 wt.% H
2 , as shown in
Figure 3d, which means that both reactions (1) and (2) must have been completed. Since the total H
2 capacity of reactions (1) and (2) is about 5 wt.%, there is a perfect match between observed H
2 desorption capacities in
Figure 3 and the microstructure in
Figure 4 after dehydrogenation at 170 °C. Since there is no observed change in the intensities of the LiNH
2 peaks in
Figure 4, which is a microstructural constituent during H
2 desorption, there is no reason to believe that any other reaction involving LiNH
2, other than reactions (1) and (2), occurred during dehydrogenation of the
n = 1 composite up to 170 °C.
Figure 4.
XRD patterns for (1LiAlH4 + LiNH2) ball milled for 2 min and subsequently isothermally dehydrogenated at 100, 140 and 170°C. The ICDD file numbers for phase identification are shown in the legend.
Figure 4.
XRD patterns for (1LiAlH4 + LiNH2) ball milled for 2 min and subsequently isothermally dehydrogenated at 100, 140 and 170°C. The ICDD file numbers for phase identification are shown in the legend.
However, for the sake of clarity it must be pointed out that at high temperatures above 500 °C both Dolotko
et al. [
6] and Xiong
et al. [
7] reported that the reaction occurs between LiAlH
4 and LiNH
2 in a (0.5LiAlH
4 + LiNH
2) composite, as a result of which (Li
3AlN
2 + 4H
2) is formed, desorbing 9.5 wt.% H
2. As reported in [
7] this reaction was reversible at about 350 °C under 80 bar H
2 pressure, providing about 5 wt.% H
2 according to the following reaction:
On the other hand, Dolotko
et al. [
6] claimed that they rehydrogenated the fully decomposed (1LiAlH
4 + LiNH
2) mixture at 275 °C at 180 bar of H
2 pressure , supposedly according to reaction (4). The microstructure after rehydrogenation consisted of LiNH
2, metallic Al, LiH, amorphous Li
3AlN
2, amorphous AlN, and an unknown species “X”. This microstructure does not exactly agree with reaction (4). Apparently, the establishing of dehydrogenation/rehydrogenation paths for the LiAlH
4-LiNH
2 composites at high temperatures and pressures still requires more research.
Figure 5 shows volumetric isothermal dehydrogenation curves at four temperatures for (11.5LiAlH
4 + LiNH
2) (a molar ratio corresponding to 5 wt.% LiNH
2) ball milled for 15 min. No desorption of H
2 during the 15 min milling is observed (
Figure 1a) for this molar ratio. For the molar ratio
n = 11.5 (95 wt.% LiAlH
4), the purity-corrected H
2 capacity of reactions (1) and (2) is ~4.88 and 2.39 wt.%, respectively. The dehydrogenation curves exhibit the same two stages of desorption I and II as those in
Figure 3 for the
n = 1 composite. It is also clearly seen that at each temperature, the rate of H
2 desorption is much more rapid than that for the
n = 1 composite in
Figure 3. At 100 °C after a comparable time of 40 h the
n = 11.5 composite desorbs nearly 6 wt.% H
2 (
Figure 5a) as compared to barely ~3 wt.% H
2 for the
n = 1 composite (
Figure 3a). At 140, 150 and 170 °C the
n = 11.5 composite desorbs ~7 wt.% H
2 which is nearly equal to the purity corrected total capacity of reactions (1) and (2) for 95 wt.% LiAlH
4 in the composite (~7.3 wt.% H
2).
Figure 5.
Volumetric dehydrogenation curves at (a) 100°C, (b) 140°C, (c)150°C and (d) 170°C (at 1 bar H2) for (11.5LiAlH4 + LiNH2) ball milled for 15 min. The arrows indicate the dehydrogenation time after which samples were taken for XRD tests.
Figure 5.
Volumetric dehydrogenation curves at (a) 100°C, (b) 140°C, (c)150°C and (d) 170°C (at 1 bar H2) for (11.5LiAlH4 + LiNH2) ball milled for 15 min. The arrows indicate the dehydrogenation time after which samples were taken for XRD tests.
After completion of each desorption, the powder samples were extracted for XRD studies as indicated by the arrows in
Figure 5. The XRD patterns in
Figure 6 clearly confirm that the phase transformations occurred in accordance with reactions (1) and (2). After dehydrogenation at 100 °C there are clear peaks of Li
3AlH
6 , and no peaks of LiAlH
4 , confirming that reaction (1) is completed. However, the quantity of H
2 desorbed at this temperature is nearly 6 wt.% (
Figure 5a) which also indicates that reaction (2) must have partially occurred. After dehydrogenation at 140 °C , weak peaks of Li
3AlH
6 are visible (
Figure 6), which show that reaction (2) is near completion. At 170 °C, no peaks of Li
3AlH
6 are discernible, indicating the completion of reaction (2). For the sake of explanation, it must be pointed out that the occurrence of reaction (2) requires the presence of LiH in the microstructure. However, we were unable to identify the LiH peaks in the XRD patterns in
Figure 4 and 6 after dehydrogenation at 140 and 170 °C. There is a common problem with finding LiH peaks in the multiphase hydride/Al metal microstructures by XRD. First, the LiH Bragg peaks superimpose nearly completely with the Al peaks, because both have an FCC crystallographic structure and a very similar lattice parameter (one can compare ICDD 85-1327 for Al and 09-0340 for LiH). Second, as a very light hydride, LiH does not effectively diffract X-rays, particularly when metallic Al is present together with LiH and the low intensity LiH diffraction peaks are strongly suppressed by the high intensity Al peaks. Third, it may be at least partially amorphous after ball milling.
Figure 6.
XRD patterns for (11.5LiAlH4 + LiNH2) ball milled for 15 min and subsequently isothermally dehydrogenated at 100, 140 and 170°C. The ICDD file numbers for phase identification are shown in the legend.
Figure 6.
XRD patterns for (11.5LiAlH4 + LiNH2) ball milled for 15 min and subsequently isothermally dehydrogenated at 100, 140 and 170°C. The ICDD file numbers for phase identification are shown in the legend.
As shown earlier, LiNH
2 strongly enhances destabilization of LiAlH
4 in the (1LiAlH
4 + LiNH
2) composite during ball milling (
Figure 1b). One would expect that at the molar ratio
n = 1, a similar destabilization effect might be observed during isothermal dehydrogenation. However,
Figure 3 shows that this is not the case. Therefore, the question arises: why did LiNH
2 not enhance the dehydrogenation rate during isothermal dehydrogenation as observed in
Figure 3? This is most likely related to a very short milling time of 2 min for the (1LiAlH
4 + LiNH
2) composite which we used for processing. On one hand, such a short milling time prevents H
2 release during milling (
Figure 1b) allowing subsequent dehydrogenation of the full H
2 capacity of the
n = 1 composite (
Figure 3). On the other hand, the milling time of 2 min is most likely too short to allow for an intimate hydride phase alloying and substantial nanostructuring of the composite such as reduction of particle and crystallite (grain) size within the particles. It is well known that nanostructuring, and especially the reduction of powder particle size, is one of the critical factors enhancing dehydrogenation/rehydrogenation properties of hydrides and their composites [
2]. We observe that both LiAlH
4 and LiNH
2 are not particularly prone to nanostructuring. We reported for LiAlH
4 that a high energy milling duration for 20 h reduced its initial particle size from 9.9 ± 5.2 μm to 2.8 ± 2.3 μm [
11], still far away from a nanometric range. The crystallite (grain) size of LiAlH
4 actually slightly increased from ~30 nm to ~80 nm range after 15 min of high energy ball milling [
11]. We also reported that high energy ball milling of LiNH
2 for 1 h changed its Specific Surface Area (SSA) only slightly for particle sizes from 16.5 to 26.4 m
2/g with an associated crystallite (grain) size still at ~65 nm [
16]. Therefore, it is quite clear that a short milling time for just 2 min might have been insufficient for any substantial refinement of microstructure that, in turn, would lead to improvement of thermal dehydrogenation for the
n = 1 composite.
In contrast, a continuous high energy ball milling for a few hours was, most likely, sufficient to refine microstructure and allow dehydrogenation of full H
2 capacity from the
n = 1 composite (
Figure 1b) after 100–150 min in the presence of LiNH
2 , destabilizing LiAlH
4. Apparently, the (1LiAlH
4 + LiNH
2) composite creates a serious dilemma for the enhancement of its dehydrogenation properties at elevated temperatures because it definitely needs a longer milling time than just 2 min to bring about more structural refinement. In turn, a longer milling time leads to a loss of H
2 during milling (
Figure 1b). One possible avenue to overcome this problem could be ball milling of both constituents LiAlH
4 and LiNH
2 separately for sufficient time to achieve their microstructural refinement and then composite them together by relatively short ball milling.
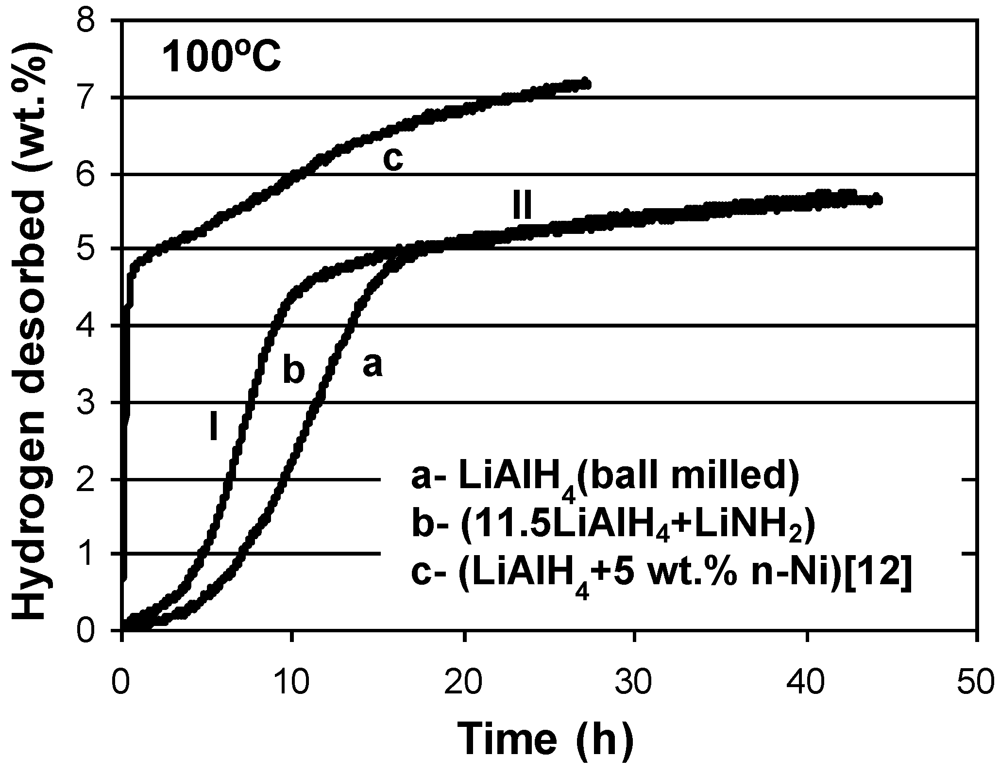
As can be seen in
Figure 5, for the
n = 11.5 composite, its thermal dehydrogenation rate increases as compared to the
n = 1 composite (
Figure 3), most likely due to an enhanced microstructural refinement resulting from a longer high energy milling time which does not lead to H
2 desorption during milling at molar ratios >3. The dehydrogenation behavior at 100 °C of a composite with
n = 11.5, which corresponds to 5 wt.% content of LiNH
2, is compared in
Figure 7 to the dehydrogenation behavior of single phase LiAlH
4 and to the dehydrogenation behavior of the composite of LiAlH
4 , containing 5 wt.% of a nanometric Ni catalyst whose hydrogen storage properties were reported in [
12]. All composites were ball milled for 15 min under the same milling conditions. Apparently, the ball milled (11.5LiAlH
4 + LiNH
2) composite exhibits a more rapid dehydrogenation rate in stage I (reaction (1)) than a simple ball milled single phase LiAlH
4. However, in stage II (reaction (2)) both have nearly identical dehydrogenation rates, although the rates for both are much inferior to the dehydrogenation rate of ball milled LiAlH
4 catalyzed with 5 wt.% n-Ni (curve c): the latter being the same weight content as that for LiNH
2 in the
n = 11.5 composite. This comparison shows that a small content of LiNH
2 composited with LiAlH
4 enhances rather modestly the thermal dehydrogenation rate of the LiAlH
4 constituent in the composite.
Figure 7.
A comparison of dehydrogenation curves at 100°C (at 1 bar H
2) for the following composites ball milled under the same conditions: a- LiAlH
4, b- (11.5LiAlH
4 + LiNH
2) (5 wt.% LiNH
2) composite and c- (LiAlH
4 + 5 wt.% n-Ni)(n-Ni-nanometric size Ni catalyst). Curve c is re-plotted from [
12].
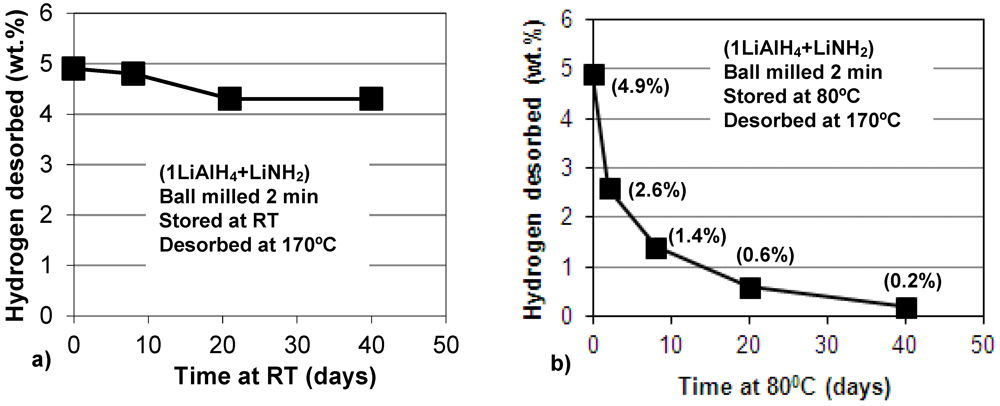
Figure 8.
Plot of hydrogen desorbed at 170°C vs. storage time at (a) room temperature (RT) and (b) 80°C, in days (1 day = 24 h) for the (1LiAlH4 + LiNH2) composite ball milled for 2 min. Stored under Ar; subsequently, fully dehydrogenated at 170°C at 1 bar H2 pressure. The numbers in parentheses show the quantity of H2 desorbed isothermally at 170°C.
Recently, we reported that ball milled LiAlH
4 catalyzed with nanometric Ni (n-Ni), slowly discharged during storage at room temperature, 40 and 80 °C, gradually releasing quite substantial quantities of H
2 [
12]. In the present work, we also investigated long term dehydrogenation of the (1LiAlH
4 + LiNH
2) composite, ball milled for only 2 min (no H
2 release during milling). The composite was stored after ball milling in a sealed glass vial containing high purity Ar under slight overpressure temperature in a glove box and in an oven at 80 °C. After a pre-determined length of time small samples of stored composite were extracted from the vial and fully dehydrogenated isothermally at 170 °C in a Sieverts-type apparatus at 1 bar H
2 pressure, registering the quantity of H
2 desorbed. At room temperature, the composite discharged about 0.6 wt.% H
2 after 40 days of storage (
Figure 8a). However, at 80 °C the dehydrogenation rate dramatically accelerated, as shown in
Figure 8b. It is observed that after 40 days of storage the H
2 discharge during storage amounts to ~4.7 wt.% H
2 which, practically, is the total capacity of reactions (1) and (2) for the molar ratio
n = 1 (3.2 and 1.6 wt.% H
2, respectively).
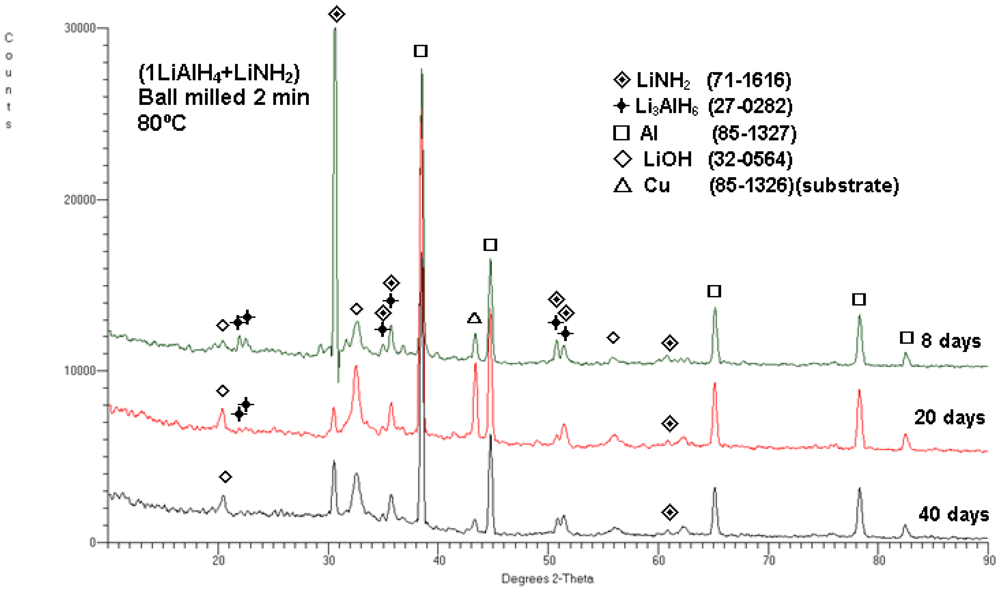
In order to understand the microstructural evolution which occurs during slow desorption at 80 °C, small samples for XRD were extracted after 8, 20 and 40 days. The corresponding XRD patterns obtained from the extracted samples are shown in
Figure 9. After 8 days of storage, the weak peaks of Li
3AlH
6 and strong principal peaks of phases such as Al and LiNH
2 are observed. After 20 and 40 days, the Li
3AlH
6 peaks are barely visible and very strong peaks of Al and LiNH
2 are clearly observed.
Figure 8b shows that during the first 8 days of storage, the sample discharged ~3.5 wt.% H
2, and during the next 32 days, the sample discharged an additional 1.2 wt.% H
2 to the total of 4.7 wt.% H
2. Apparently, the highest rate of dehydrogenation is observed for the first few days of storage. It is perfectly clear that the slow dehydrogenation during long term storage occurs up to 8 days mostly by reaction (1), and possibly the early stage of reaction (2), and then it proceeds by reaction (2). The persistent presence of the LiNH
2 peaks indicates that this hydride is not involved in any other auxiliary reactions at room temperature.
Figure 9.
XRD patterns obtained for the ball milled (1LiAlH4 + LiNH2) composite, stored at 80°C under Ar for 8, 20 and 40 days (1 day = 24 h). The ICDD file numbers for phase identification are shown in the legend.
Figure 9.
XRD patterns obtained for the ball milled (1LiAlH4 + LiNH2) composite, stored at 80°C under Ar for 8, 20 and 40 days (1 day = 24 h). The ICDD file numbers for phase identification are shown in the legend.
Finally, it must be pointed out that the diffraction peaks of LiOH are also observed in the XRD patterns in
Figure 9. LiOH is an impurity, frequently found in LiNH
2 [
16]. Alternatively, a part of LiOH might have been formed by oxidation of LiH from reaction (2) in an XRD holder.


