Communication

Simulation Design for Rutile-TiO2 Nanostructures with a Large Complete-Photonic Bandgap in Electrolytes

Department of Metallurgy & Ceramics Science, Graduate School of Science & Technology, Tokyo Institute of Technology 2-12-1-S7-8, Ookayama, Meguro-ku, Tokyo 152-8552, Japan
*
Author to whom correspondence should be addressed.
Crystals 2012, 2(4), 1483-1491; https://doi.org/10.3390/cryst2041483
Submission received: 4 April 2012 / Revised: 9 October 2012 / Accepted: 10 October 2012 / Published: 26 October 2012
(This article belongs to the Special Issue Current Trends in Application of Photonic Crystals)

Abstract

:
The photonic bands of various TiO2 2D photonic crystals, i.e., cylindrical, square and hexagonal columns connected with/without walls and filled with acetonitrile, were investigated from the perspective of dye-sensitized solar cells. The finite-difference time-domain methods revealed that two-dimensional (2D) photonic crystals with rods connected with walls composed of TiO2 and electrolytes had complete photonic band gaps under specific conditions. This optimally designed bandgap reaches a large Δω/ωmid value, 1.9%, in a triangular array of square rods connected with walls, which is the largest complete 2D bandgap thus far reported for a photochemical system. These discoveries would promote the photochemical applications of photonic crystals.

1. Introduction

The concept of coupling a conventional dye-sensitized nanocrystalline TiO2 film with a photonic crystal has been actively pursued [1,2,3,4,5,6,7,8,9,10]. A promising idea is to enhance the relaxation-light harvesting by multiple scattering to improve the efficiency of dye-sensitized solar cells. We pursued coupling the conventional dye-sensitized nanocrystalline titanium oxide (TiO2) film with a photonic crystal, which inhibits spontaneous emission [11] and light propagation [12], in order to enhance the spectral response to the red end of the dye absorption band [13]. The short-circuit photocurrent efficiency across the visible spectrum (400–750 nm) of the electrode comprising a bilayer of inverse opal photonic crystal—nanocrystalline dye-sensitized titanium dioxide could be increased by about 26%, relative to an ordinary dye-sensitized nanocrystalline TiO2 photoelectrode [7,14].
Among this research, the authors have paid attention to the dye emission in the solar cell. The key component of the dye-sensitized solar cell is the photoelectrode, which consists of a dye molecule, titanium oxide (TiO2), and a transparent electrode. The incident light at the photon energy of hν1 excites the dye molecule. The excited electron relaxes to a lower excited state in the dye and then a certain fraction of it is injected into the conduction band of TiO2, resulting in the extraction of photocurrent from the electrode. Another fraction directly relaxes to the ground state with an emission of photon energy of hν2, resulting in the reduction of photon-to-electron conversion efficiency. We would like to introduce a photonic crystal structure to inhibit the emission from the dye at hν2 for enhancement of electron injection efficiency. This idea allows us to be free from the consideration of the illumination direction, because the illumination wavelength hν1 differs from the emission wavelength hν2. Our idea had been partially proved using inverse-opal-type photonic crystals; however, since inverse-opals were not shown the full-photonic band gaps, this former result is fraught with uncertainty. To prove our idea, we need the full photonic band gap structure composed of TiO2 and electrolyte.
This light emission from the dye is not a major problem in the Ruthenium dye, which is the most efficient dye in the DSCs. However, Ruthenium is a rare-metal resulting in the high-cost preparation of the DSCs. If we would like to use non-rare metal dyes, the light emission from the dyes becomes the one of the major problems because of the low electron injection efficiencies to the TiO2[15]. Using this concept, the authors tried to inhibit the spontaneous emission from the Chlorine-e6 dye in a dye-sensitized photoelectrode by the photonic crystal structures, resulting in an increase in photon-to-electron conversion efficiency per mol of dye [8]. The improvement of monochromatic incident photon-to-current conversion efficiency (IPCE) in the dye-sensitized solar cells using quasi-photonic crystals was convinced in the author’s previous paper and patent [8,16]. However, TiO2 inverse opal structures only exhibit a pseudogap not a complete photonic bandgap. To inhibit the spontaneous emission, the complete photonic bandgap, or complete photonic bandgap in a 2D structure at least, is necessary. Not only for such dye-sensitized solar cells, an air-guiding photonic bandgap fiber was also examined as a highly sensitive gas sensor [17], and a liquid-filled hollow-core photonic crystal fiber was studied as a highly controlled photochemical reactor [18]. The current problem of this field is the lack of the complete-photonic bandgap structures composed of the materials of the photochemical systems.
However, few reports are available on complete-photonic-bandgap (CPBG) structures composed of photochemically functional materials such as photocatalysts. Recently, the authors computationally discovered both two-dimensional (2D) and three-dimensional (3D) CPBG structures composed of TiO2 in electrolytes by plane-wave expansion method [2]. The discovered 3D structures were the diamond-log structures composed of TiO2 rods in electrolytes and the inverse diamond-log structures composed of electrolyte rods in a TiO2 slab. However, as regards dye-sensitized solar cells when using popular dyes in ruthenium complexes, for example, the single cell size of a rutile-TiO2 photonic crystal with the CPBG centered near the dye emission wavelength (λ ~600 nm) must be 307 nm, which corresponds to a 70-nm rod diameter. Such a feature size is beyond the fabrication capabilities of the current 3D lithography methods [19].
The 2D CPBG structures detailed in the author’s previous report [2] were triangular lattices of electrolytes composed of square rods drilled into a TiO2 slab. To fabricate such a structure with the bandgap centered at the emission maximum of ruthenium complex, the width of the square holes and TiO2 canals should be 396 and 164 nm, respectively. Such 2D structures can be produced by electron-beam lithography. However, the gap-midgap ratio Δω/ωmid of the CPBG was only 1.2%. In this study, the authors attempted to determine the photochemically functional 2D periodic structures exhibiting wider CPBG while considering the following recent discoveries by other researchers: bandgaps for transverse-electric (TE) polarization are favored in a lattice of an isolated high-εregion, bandgaps for transverse-magnetic (TM) polarization are favored in a connected lattice, and two geometric parameters are required to balance the band edges of TE and TM polarizations to obtain the optimal complete bandgap [20].

2. Calculation

2.1. Structural Design
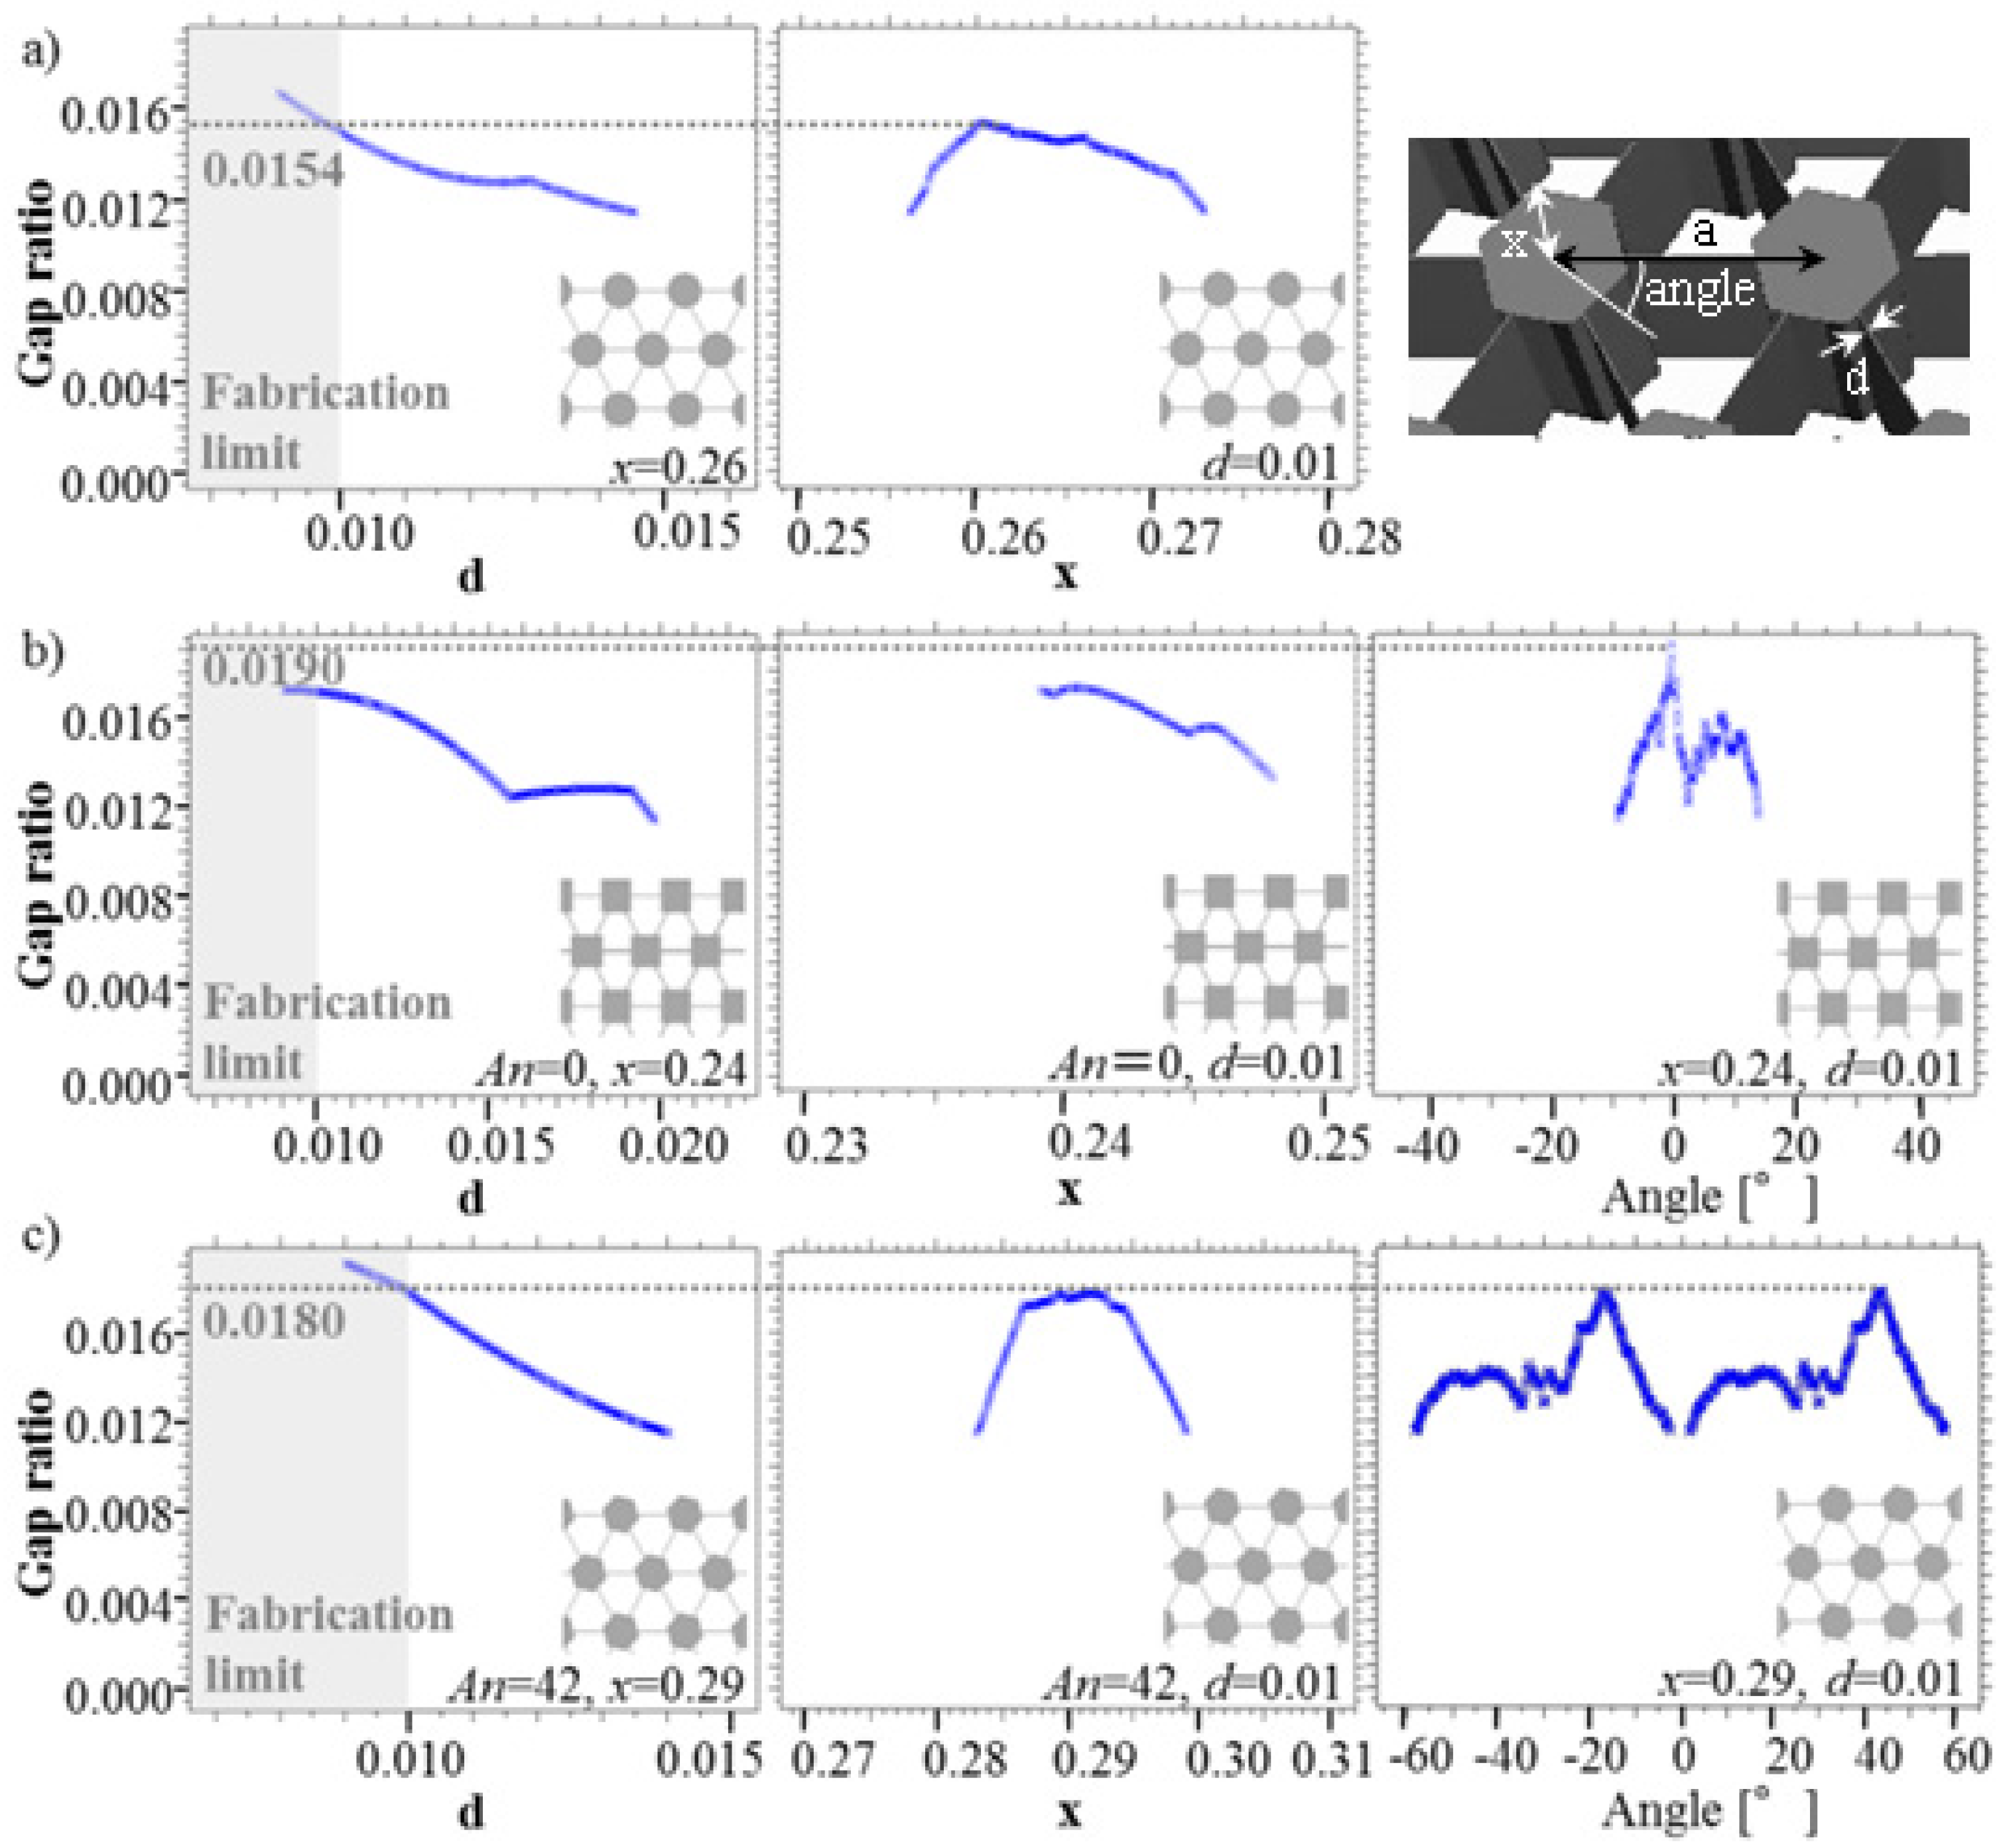
The optical properties of photonic crystals are governed by the geometry and difference in index contrasts. In general, a large difference in index contrasts is required for CPBG [21]. To increase the difference in the index contrasts of semiconductors and electrolytes, which comprise a photochemical system, we exclusively studied rutile-TiO2 structures (n = 2.9 and 2.6 for C// and C, respectively, at 0.6 μm light wavelength by SOPRA N & K database) with an index contrast of 1.55 in acetonitrile (n = 1.35), rather than anatase-TiO2 structures (n = 2.55). Here we should mention that TiO2 refractive indexes (both rutile and anatase) exhibit a strong dispersive behavior in the UV and in the visible. This feature can be problematic to fabricate the structure, but it can also be an opportunity, because the growth of n with the frequency leads to the possibility of multiple CPBGs, or to their widening. In this research, tentatively, we fixed the refractive index at 2.9. We should also point out that, talking from the viewpoint of the photon-to-electron conversion efficiency, anatase-type TiO2 has been a promising material for dye-sensitized solar cells, at one sun light intensity, because of its surface chemistry and potentially higher conduction-band edge energy, even though rutile is potentially cheaper to be produced and has superior light scattering characteristics.
Complete-photonic-bandgap structures of 2D lattices composed of square air rods drilled into silicon [22] and the influence of rotating non-cylindrical air rods in a dielectric background [23] have been reported. Considering these studies, we investigated the tetragonal or triangular arrays of TiO2 composed of cylindrical, square, and hexagonal rods in electrolytes and electrolytes composed of cylindrical, square, and hexagonal rods in TiO2. Each rod was connected to its nearest neighbors by thin walls. The simulation parameters included the width of the wall, d; the radius/length of each side, x; and the rotation angle of the rod, Angle. The simulation range and resolution of each parameter are summarized in Table 1. All possible values of d, x, and Angle in the structure were examined. Here we set the distance between the centers of the columns, a, as 1.
Table 1. Simulation range of each parameter. Crystals 02 01483 i001
ResolutionCylindricalSquareHexagonal
d1 × 10−50.00–0.500.00–0.500.00–0.50
x1 × 10−40.01–0.500.01–0.500.01–0.50
Angle [°]0.01-(−45)–(+45)(−60)–(+60)

2.2. Simulation Methods

Photonic bands were determined using photonic band calculation software (BandSOLVE, Rsoft Design Group), which is based on the plane-wave-expansion method. A Windows computer (Dell precision T1500, Intel (R) Core (TM) i7 CPU, [email protected] GHz) was used for the calculations. The number of calculated bands was 16. Path Division number was examined from 8 to 256.

3. Results and Discussion

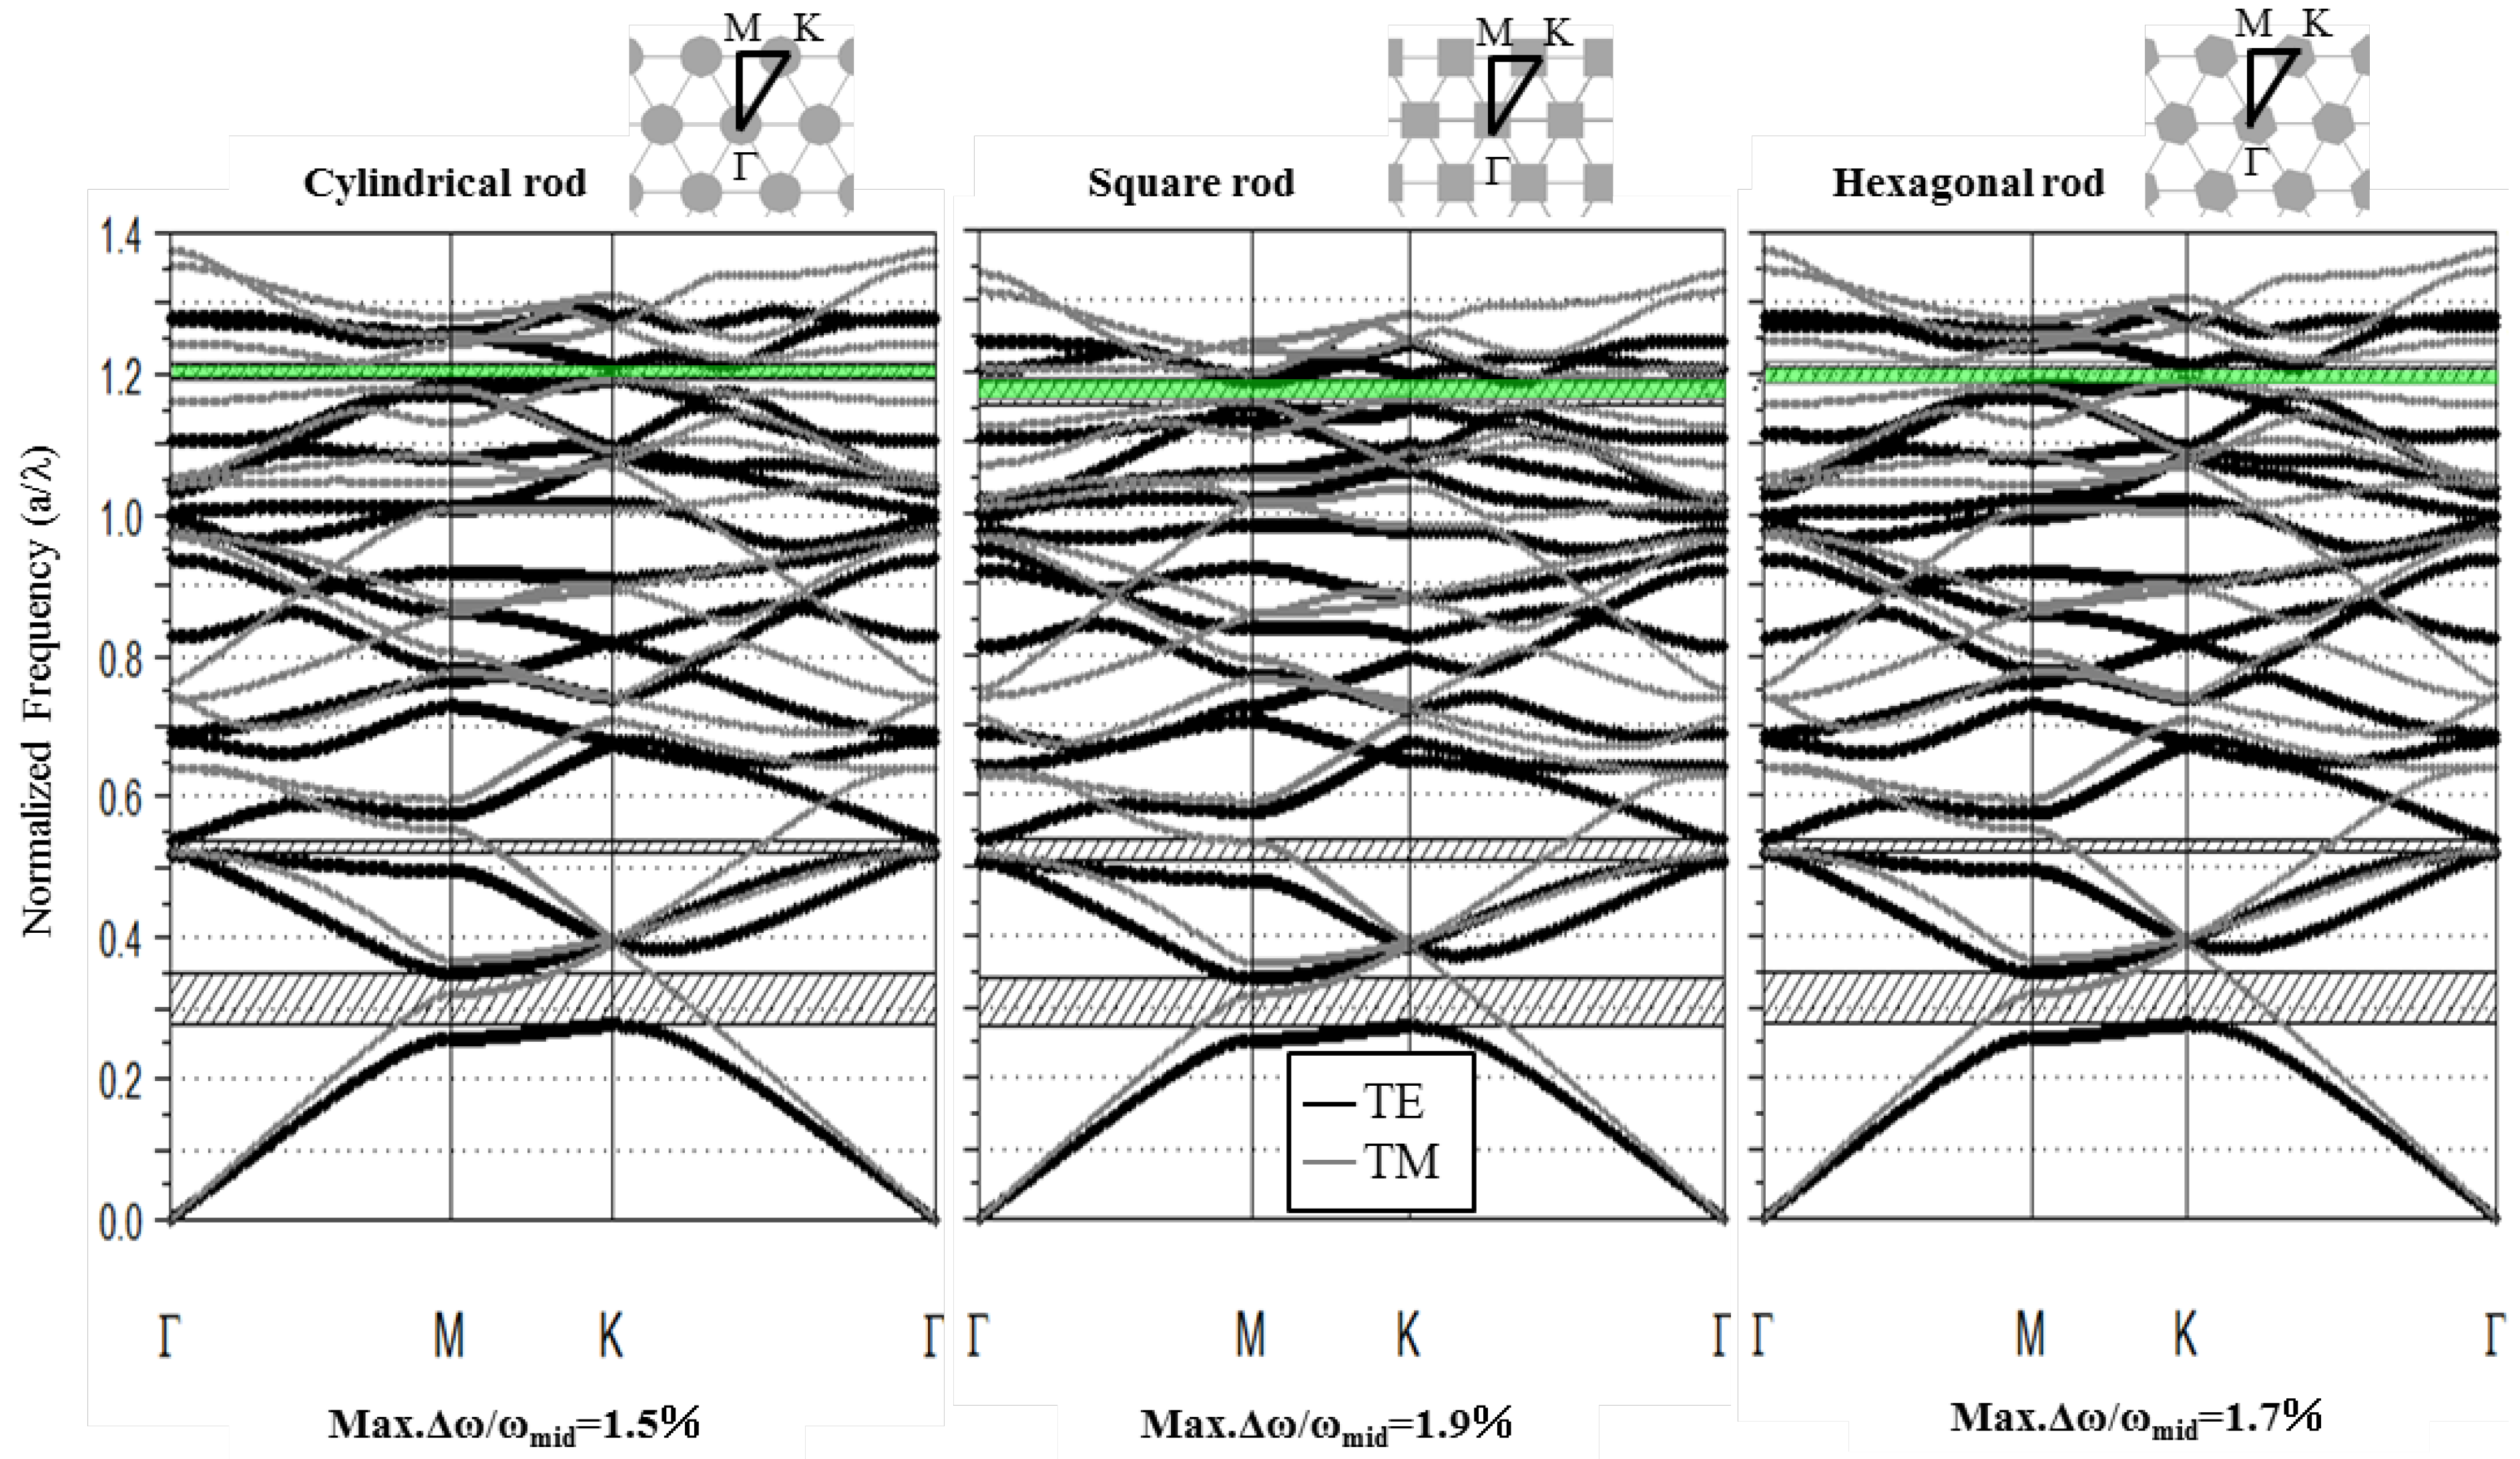
3.1. Photonic Band Diagram of Each Structure

After precise calculations to check the dependence of the band diagram stability on the path division number, we select 128 as the path division number. As previously mentioned, bandgaps for TE polarization are favored in a lattice of isolated high-ε region and those for TM polarization are favored in a connected lattice. This connected structure was precisely studied by Chern et al. [20,24] On the basis of their reports, we examined arrayed electrolytes and TiO2 rods connected by walls composed of the same material as that of the rods.
The tetragonal arrays of both electrolytes and TiO2 rods exhibited either TE or TM bandgaps but no CPBG, regardless of the presence of wall-connected rods. On the contrary, triangular arrays of TiO2 composed of cylindrical, square, and hexagonal columns with the walls exhibited CPBG in electrolytes; however, structures without the walls exhibited no CPBG in our calculations. The walls, introduced to make the TE fields follow the high-ε paths from site to site, appeared insufficient to localize the TE band. Instead, the narrow spaces between the columns in the triangular arrays acted as the high-ε paths.
The photonic band diagrams with the maximum Δω/ωmid value in the triangular arrays of cylindrical, square and hexagonal columns are depicted in Figure 1. The CPBGs, represented as mesh areas, are located around a/λ = 1.2 in each band diagram. The maximum Δω/ωmid value in cylindrical, square, and hexagonal columns with the walls were 1.5%, 1.9%, and 1.7%, respectively, which were larger than the 1.2% previously reported. The maximum gap–midgap ratio for cylindrical columns corresponded to x/a = 0.26; for square columns, to x/a = 0.24 and Angle = −0.3°; and for hexagonal columns, to x/a = 0.2875 and Angle = 43° and −16.5°. The maximum complete bandgaps of square and hexagonal columns were larger than those of cylindrical columns because of the large number of parameters and, possibly, the localization of the electromagnetic wave at the corner.
Regarding the location of the bandgap in the frequency domain, the complete bandgap for all the three structures lies between the 14th and 15th branches for TE polarization and between the 13th and 14th branches for TM polarization. The band edges for both polarizations occur at different points, with the exception of the square column structure (Table 2). The edge of CPBG generally exists at the corner of the Brillouin zone; however, this condition was not apparent in our triangular array of the hexagonal column structures. As previously mentioned, the hexagonal columns show the maximum CPBG when x/a = 0.2875 and Angle = 43° (Figure 1); that is, the angled columns of high-εTiO2 constitute more than half of the distance between the columns. The Brillouin zone of such a structure might not be considered the same as that of a normal triangular array because we have to additionally consider the smaller hierarchy of hexagonal columns to the larger hierarchy of triangular array. This difference could account for the band edge position.
Table 2. Edge position of the complete photonic bandgap in the triangular arrays of cylindrical, square and hexagonal columns illuminated by transverse-electric (TE) and transverse-magnetic (TM) polarizations.
ShapeCylindricalSquareHexagonal
TEUpper edgeKMK
Lower edgeKMBetween M and K
TMUpper edgeK and ΓMBetween Γ and M
Lower edgeKMK
Figure 1. Schematic images and photonic band diagrams of complete-photonic-band 2D structures composed of rutile-TiO2 columns in electrolytes. Cylindrical (a), square (b) and hexagonal (c) columns were triangularly arrayed and connected by TiO2 walls. The complete photonic bandgaps are shown as green lines. The maximum gap–midgap ratio appears below the photonic band diagram.
Crystals 02 01483 g001

3.2. Gap Ratio Change with Each Parameter

Changes in the gap ratio varied with each parameter are summarized in Figure 2. The Δω/ωmid value increased as d decreased. The strength of the interactions among scattering walls is attributed to the field distribution characteristics. Thus, bandgap can vary significantly depending on the geometric details of photonic crystals [25]. Qiu et al. reported that TE polarization bandgap appeared with small wall widths [26]. These results indicate that the wall—that is, the localized spot for TE polarization—plays a key role in obtaining a large complete 2D bandgap in our structures.
The x and Angle were normalized by d = 0.01 because d < 0.01 (gray area in Figure 2); that is, a thickness of several nanometers for the visible light wavelength is impractical. The Δω/ωmid value did not exhibit a monotonic increase in x because TE polarization shows lower localization at an extremely large x. In hexagonal columns, the Δω/ωmid dependence of Angle—angle is therefore the same as that of Angle 0° to 60°. This result can be easily explained by hexagonal symmetrical geometry. In square columns, a large Δω/ωmid value was observed at a slightly negative angle. The distance between the corner of the square and the wall decreased at the triangular array of slightly negative-angled square columns, resulting in the strong localization of TE polarization.
Figure 2. Maximum gap–midgap ratio dependence on d, x, and Angle. Cylindrical (a), square (b), and hexagonal (c) TiO2 columns were triangularly arrayed and connected by TiO2 walls. Each fixed parameter is shown in the inset.
Crystals 02 01483 g002

4. Conclusions

The photonic bands of various TiO2 photonic crystals filled with acetonitrile were investigated from the perspective of the dye-sensitized solar cells. Our structural design followed recent discoveries by other researchers: bandgaps for TE polarization are favored in a lattice of an isolated high-ε region, bandgaps for TM polarization are favored in a connected lattice, and two geometric parameters are required to balance the band edges of TE and TM polarizations in order to obtain the optimal complete bandgap [20]. The finite-difference time-domain methods on such structures revealed that two-dimensional (2D) photonic crystals with rods connected with walls composed of TiO2 and electrolyte had complete photonic band gaps under the specific conditions. The maximum gap-midgap ratio dependence on the wall thickness, rod diameter and angle of cylindrical, square, and hexagonal columns was precisely examined. The optimally designed bandgap reaches a large Δω/ωmid value, 1.9%, in a triangular array of square rods connected with walls, which is the largest complete 2D bandgap thus far reported for a photochemical system. These discoveries would promote the photochemical applications of photonic crystals.

Acknowledgments

The authors thank M. Kurihara for her support. This work was partially supported by the Ministry of Education, Culture, Sports, Science and Technology (2170024), Tokuyama Science Foundation, the Kazuchika Okura Memorial Foundation, and Nihon University Strategic Projects for Academic Research (Nanotechnology Excellence).

Conflict of Interest

The authors declare no conflict of interest.

References

  1. Tao, C.-A.; Zhu, W.; An, Q.; Li, G. Theoretical demonstration of efficiency enhancement of dye-sensitized solar cells with double-inverse opal as mirrors. J. Phys. Chem. C 2010, 114, 10641. [Google Scholar] [CrossRef]
  2. Matsushita, S.; Suavet, O.; Hashiba, H. Full-photonic-bandgap structures for prospective dye-sensitized solar cells. Electrochim. Acta 2010, 55, 2398–2403. [Google Scholar] [CrossRef]
  3. Guldin, S.; Hüttner, S.; Kolle, M.; Welland, M.E.; Müller-Buschbaum, P.; Friend, R.H.; Steiner, U.; Tétreault, N. Dye-sensitized solar cell based on a three-dimensional photonic crystal. Nano Lett. 2010, 10, 2303–2309. [Google Scholar] [CrossRef]
  4. Kwak, E.S.; Lee, W.; Park, N.-G.; Kim, J.; Lee, H. Compact inverse-opal electrode using non-aggregated TiO2 nanoparticles for dye-sensitized solar cells. Adv. Funct. Mater. 2009, 19, 1093–1099. [Google Scholar] [CrossRef]
  5. Colodrero, S.; Mihi, A.N.; Häggman, L.; Ocaña, M.; Boschloo, G.; Hagfeldt, A.; Míguez, H.N. Porous one-dimensional photonic crystals improved the power-conversion efficiency of dye-sensitized solar cells. Adv. Mat. 2009, 21, 764–770. [Google Scholar] [CrossRef]
  6. Mihi, A.; Calvo, M.E.; Anta, J.A.; Miguez, H. Spectral response of opal- based dye-sensitized solar cells. J. Phys.Chem. C 2008, 112, 13–17. [Google Scholar]
  7. Lee, S.-H.A.; Abrams, N.M.; Hoertz, P.G.; Barber, G.D.; Halaoui, L.I.; Mallouk, T.E. Coupling of titania inverse opals to nanocrystalline titania layers in dye-sensitized solar cells. J. Phys. Chem. B 2008, 112, 14415–14421. [Google Scholar] [CrossRef]
  8. Matsushita, S.I.; Fukuda, N.; Shimomura, M. Photochemically functional photonic crystals prepared by using a two-dimensional particle-array template. Colloid. Surf. A 2005, 257-258, 15–17. [Google Scholar] [CrossRef]
  9. Matsushita, S.; Fujiwara, R.; Shimomura, M. Calculation of photonic energy bands of self-assembled-type TiO2 photonic crystals as dye-sensitized solar battery. Colloid. Surf. A 2008, 313-314, 617–620. [Google Scholar] [CrossRef]
  10. Mihi, A.; Calvo, M.E.; Anta, J.A.; Miguez, H. Spectral response of opal-based dye-sensitized solar cells. J. Phys.Chem.C 2008, 112, 13–17. [Google Scholar] [CrossRef]
  11. Yablonovitch, E. Inhibited spontaneous emission in solid-state physics and electronics. Phys. Rev. Lett. 1987, 58, 2059–2062. [Google Scholar] [CrossRef]
  12. John, S. Strong localization of photons in certain disordered dielectric superlattices. Phys. Rev. Lett. 1987, 58, 2486–2489. [Google Scholar] [CrossRef]
  13. Usami, A. Theoretical study of application of multiple scattering of light to a dye-sensitized nanocrystalline photoelectrichemical cell. Chem. Phys. Lett. 1997, 277, 105. [Google Scholar] [CrossRef]
  14. Nishimura, S.; Abrams, N.; Lewis, B.A.; Halaoui, L.I.; Mallouk, T.E.; Benkstein, K.D.; Lagemaat, J.V.D.; Frank, A.J. Standing wave enhancement of red absorbance and photocurrent in dye-sensitized titanium dioxide photoelectrodes coupled to photonic crystals. J. Am. Chem. Soc. 2003, 125, 6306–6310. [Google Scholar]
  15. Rehm, J.M.; McLendon, G.L.; Nagasawa, Y.; Yoshihara, K.; Moser, J.; Gratzel, M. Femtosecond electron-transfer dynamics at a sensitizing dye-semiconductor (TiO2) interface. J. Phys. Chem. 1996, 100, 9577–9578. [Google Scholar]
  16. Shimomura, M.; Matsushita, S.; Fukuda, N. Photon-to-electron conversion devices and the aplication to the solar cells. Japanese Unexamined Patent Application Publication 2005-72524, 2005. [Google Scholar]
  17. Ritari, T.; Tuominen, J.; Ludvigsen, H.; Petersen, J.C.; Sørensen, T.; Hansen, T.P.; Simonsen, H.R. Gas sensing using air-guiding photonic bandgap fibers. Opt. Express 2004, 12, 4080–4087. [Google Scholar] [CrossRef]
  18. Chen, J.S.Y.; Euser, T.G.; Farrer, N.J.; Sadler, P.J.; Scharrer, M.; Russell, P.S.J. Photochemistry in photonic crystal fiber nanoreactors. Chem. Eur. J. 2010, 16, 5067–5612. [Google Scholar]
  19. Oh, S.H.; Kim, J.G.; Kim, C.S.; Chang, S.; Lee, S.; Jeong, M.Y. The fabrication of three-dimensional nano-structures by defocused electron beam energy. Microelectron. Eng. 2011, 88, 914–922. [Google Scholar] [CrossRef]
  20. Chern, R.-L.; Chang, C.-C.; Chang, C.C.; Hwang, R.R. Two classes of photonic crystals with simultaneous band gaps. Jpn. J. Appl. Phys. 2004, 43, 3484–3490. [Google Scholar] [CrossRef]
  21. Joannopoulos, J.D.; Johnson, S.G.; Winn, J.N.; Meade, R.D. Photonic Crystals: Molding the Flow of Light; Princeton University Press: New Jersey, NJ, USA, 2008. [Google Scholar]
  22. Marsal, L.F.; Trifonov, T.; Rodriguez, A.; Pallares, J.; Alcubilla, R. Larger absolute photonic band gap in two-dimensional air-silicon structures. Physica E 2003, 16, 580–585. [Google Scholar] [CrossRef]
  23. Wang, X.H.; Gu, B.Y.; Li, Z.Y.; Yang, G.Z. Large absolute photonic band gaps created by rotating noncircular rods in two-dimensional lattices. Phys. Rev. B 1999, 60, 11417. [Google Scholar]
  24. Chern, R.L.; Chang, C.C.; Chang, C.; Hwang, R.R. Large full band gaps for photonic crystals in two dimensions computed by an inverse method with multigrid acceleration. Phys. Rev. E 2003, 68, 026704. [Google Scholar] [CrossRef]
  25. Liu, W.-L.; Yang, T.-J. Engineering the bandgap of a two-dimensional photonic crystal with slender dielectric veins. Phys. Lett. A 2007, 369, 518–523. [Google Scholar] [CrossRef]
  26. Qiu, M.; He, S. Optimal design of a two-dimensional photonic crystal of square lattice with a large complete two-dimensional bandgap. J. Opt. Soc. Am. B 2000, 17, 1027–1030. [Google Scholar] [CrossRef]

