1. Introduction
Lead-based ferroelectric oxides of Pb(Zr,Ti)O
3 (PZT) and related materials have been widely used for piezoelectric devices such as sensors, actuators, and nonvolatile memories. Enhanced piezoelectric performance of relaxor-based ferroelectrics of Pb(Zn
1/3Nb
2/3)O
3–PbTiO
3 (PZN–PT) and Pb(Mg
1/3Nb
2/3)O
3–PbTiO
3 (PMN–PT) has attracted much attention from scientific and technological points of view. Single crystals of PZN–PT and PMN–PT exhibit an ultrahigh piezoelectric response (a strain constant
d over 2500 pC/N) near morphotropic phase boundary (MPB) compositions between rhombohedral (R) and tetragonal (T) structures [
1,
2]. Various mechanisms have been proposed to explain the origin of the high piezoelectric response. Fu and Cohen [
3] have reported the polarization rotation mechanism in which spontaneous polarization (
Ps) rotates by the application of an electric field (
E) from the <111>
pc (pseudo-cubic notation) direction in the R phase to the <001> direction in the T phase via an intermediate monoclinic (M) phase. The M phase provides a bridging pathway between the R and T phases and then the
Ps vector easily rotates under a weak
E [
3]. It is stated that the polarization rotation is a consequence of the flat energy profile in which a small
E can lead to a large change in polarization angle [
3]. Lately, Damjanovic [
4] has pointed out that the polarization rotation is an old concept to explain the enhanced piezoelectric properties of PZT near the MPB region and that not only the polarization rotation but also a polarization extension plays an important role in some cases in the piezoresponse of ferroelectric materials.
A growing concern regarding the toxicity in lead-containing devices and their environmental impact has, however, triggered extensive research on lead-free piezoelectric materials [
5,
6,
7,
8,
9]. Bismuth sodium titanate (Bi
0.5Na
0.5)TiO
3 (BNT) has been recognized as one of the most promising candidates for the lead-free piezoelectric material [
5,
10,
11,
12,
13]. To clarify the origin of its ferroelectricity, the crystal structure has been intensively analyzed in detail [
14,
15,
16,
17,
18,
19,
20,
21,
22]. The averaged structure of BNT has been reported to be a rhombohedral structure in space group
R3
c. A high resolution synchrotron radiation X-ray diffraction (SR-XRD) study reveals that BNT has a slight monoclinic distortion in the monoclinic
Cc space group. The monoclinic
Cc structure has been recently observed in BNT single crystals by optical birefringence microscopy [
22].
Since Takenaka
et al. [
5,
23,
24,
25] first reported the piezoelectric properties of (1 −
x)(Bi
0.5Na
0.5)TiO
3–
xBaTiO
3 (BNT–BT), polycrystalline ceramics and films of BNT–BT have been extensively studied to improve the piezoelectric performance, to investigate the phase diagram [
24,
26,
27,
28], the domain structure [
29,
30], and the relaxor behavior [
31,
32,
33,
34,
35], and to elucidate the effect of the application of
E [
27,
28]
etc. Single crystals of BNT–BT have been grown and the influence on dc-bias
E on the phase stability [
36] and the diffuse X-ray scattering [
37] have been investigated. Recently, a bifurcated polarization rotation model in BNT has been postulated by a neutron pair distribution analysis [
38] and the piezoelectric response is suggested to originate from a polarization rotation.
Although there have been detailed studies on the crystal structures of BNT and BNT–BT [
39,
40,
41,
42,
43], their underlying mechanism of ferroelectricity and piezoelectricity is not well understood, e.g., how the local structures near Bi and Na are developed, how the constituent ions are displaced, and how the vector of spontaneous polarization (
Ps) responds to the application of
E. The study on the responses of the unit-cell parameters and atomistic polarization with respect to
E are essential to clarifying the origin of the ferroelectric polarization and piezoelectric properties in the BNT system.
In this review, the intrinsic responses of unit-cell parameters, local atomic polarization and Ps to E are summarized for BNT and BNT–5%BT. The investigation of in-situ measurements of high-energy synchrotron radiation X-ray diffraction (SR-XRD) under an E is conducted to analyze the structural deformation by the application of E. In addition, density functional theory (DFT) calculations are used to derive the positions in the unit cell, Born effective charges, dipole moments of the constituent atoms and therefore the Ps with respect to E is finally determined.
High-quality single crystals of BNT and BNT–5%BT grown by a high-Po2 (oxygen pressure) top-seeded solution growth (TSSG) method were used for the structural analyses as well as for the measurements of polarization and E-field-induced strain properties. It is emphasized that all SR-XRD data were collected under an application of E, i.e., that the in-situ measurements of the SR-XRD under an E were conducted. To definitely distinguish the state in which an E is applied to the crystals during the measurements from the one after an electric poling, the E applied during the in-situ SR-XRD measurements is defined as “Ein-situ”. It is demonstrated that a rotation of the Ps vector is induced by applying an Ein-situ for the BNT–5%BT crystals.
2. Experiments
Single crystals of BNT [
44,
45] and BNT–BT were grown at a high oxygen pressure (
Po
2) of 0.9 MPa using a TSSG method [
46,
47,
48,
49]. The crystals were annealed at 950 °C for 50 h, cut into plates with a thickness of 0.2 mm. Au electrodes were sputtered onto the cut surfaces. X-ray fluorescence analysis showed that the BNT–BT crystals obtained had a composition of 0.95BNT–0.05BT (BNT–5%BT). Properties of polarization (
P) and electric-induced-strain (
S) were investigated along the <001>
pc direction at 25 °C using the ferroelectric test system (Toyo Corporation, Tokyo, Japan, Model 6252 Rev. B). The pseudo-cubic (pc) notation is used for denoting the crystallographic axes of the pc cell.
For the SR-XRD measurements, the crystals were cut into plates with a thickness of 0.2 mm, and then gold electrodes with a thickness of 20 nm were sputtered onto the cut surfaces. The details of the SR-XRD experiments are described in the references [
50,
51]. The direction of
E,
i.e., the axis normal to the crystal plates was set to be along the <001>
pc direction. SR-XRD data were collected with a transmission geometry using a large cylindrical two-dimensional imaging plate (IP) camera with a 1/4
χ three-axis goniometer at BL02B1 in the SPring-8 synchrotron radiation facility [
50,
51,
52,
53]. A high SR energy of 35 keV [wavelength: 0.035313(2) nm for BNT and 0.035345(2) nm for BNT–5%BT] was adopted so that X-rays with a high transmission ratio could penetrate through the crystals and that a high-angle diffraction pattern could be observed. The X-ray beam incident to the crystals was 150 μm in diameter. The diffraction patterns were measured in a wide ω range of 30°–67°. The diffraction patterns were exposed on the IP camera in the following
∆ω of 30°–40°, 39°–49°, 48°–58°, and 57°–67°. A
∆ω of 1° was set to be overlapped to superimpose each of the 4 diffraction patterns.
The SR-XRD measurement temperature was kept at 25 °C, at which BNT has the monoclinic space group
Cc [
19,
22] (see
Figure 1a), where
Ps is approximately aligned along the <111>
pc direction. Prior to the diffraction measurements, an
E of 30–50 kV/cm, which was higher than the coercive field (
Ec) [
54], was applied to the crystals along <001>
pc as a poling treatment. To investigate the intrinsic response of the unit cell to an
Ein-situ, SR-XRD measurements were performed at
Ein-situ = 0, 30, 50, 70, and 100 kV/cm. During the measurements,
Ein-situ was applied in the same <001>
pc direction of the
E in the poling treatment.
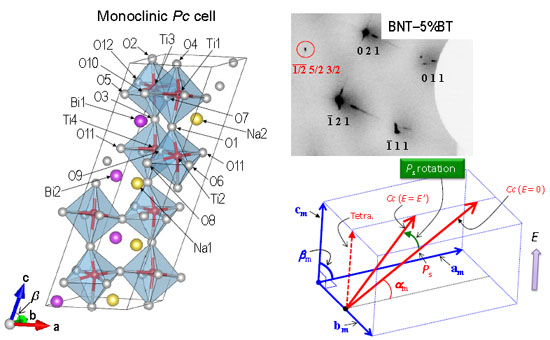
Figure 1.
Crystal structures of BNT in the monoclinic space group (
a)
Cc and (
b)
Pc cells. The
Cc structure in (
a) is drawn from the structural parameters reported by Aksel
et al. [
19]. In this
Cc cell, Bi and Na are randomly distributed on the A site. The monoclinic supercell in space group
Pc [BiNaTi
2O
6,
Z = 4, see (
b)], in which the structural feature in the
Cc cell can be taken into account. In the
Pc cell, the nearest-neighbor (NN) A-site bonds consist of five Bi–Na and one Bi–Bi or Na–Na.
Figure 2a exhibits a diffraction pattern observed for BNT with
Ein-situ = 0 kV/cm. In the 30°–67° ω range,
ca. 880 reflections were observed in a resolution limit of the lattice spacing (
d) larger than 0.04 nm for the BNT crystals. To improve the accuracy of determining the lattice parameters
ca. 500 reflections in the
d range of 0.055–0.04 nm were selected in the structure analysis. For the BNT–5%BT crystals, 660 reflections in the
d range of 0.058–0.038 nm were used for the analysis. The structure analysis under an application of
Ein-situ was also conducted in a similar manner. In the SR-XRD analysis, the
C base centered cell with the Laue class 2/
m was selected to determine the lattice parameters.
It is evident that the BNT crystals with an
Ein-situ along the <001>
pc direction has a multidomain structure (the details are described in [
51]). The intensity data recorded were therefore obtained as the summation of diffraction spots from each domain. The multidomain structure makes the structure analysis of the atomic positions difficult. Here, we focus our attention on the monoclinic lattice parameters as a function of
Ein-situ applied along the <001>
pc direction. In the structural analysis, the diffraction spot with a higher intensity was selected in the same
hkl reflections to calculate the lattice parameters. In the data in the small
d range, the diffraction spots resulting from each domain were clearly separated (see
Figure 4 in [
51]).
Figure 2.
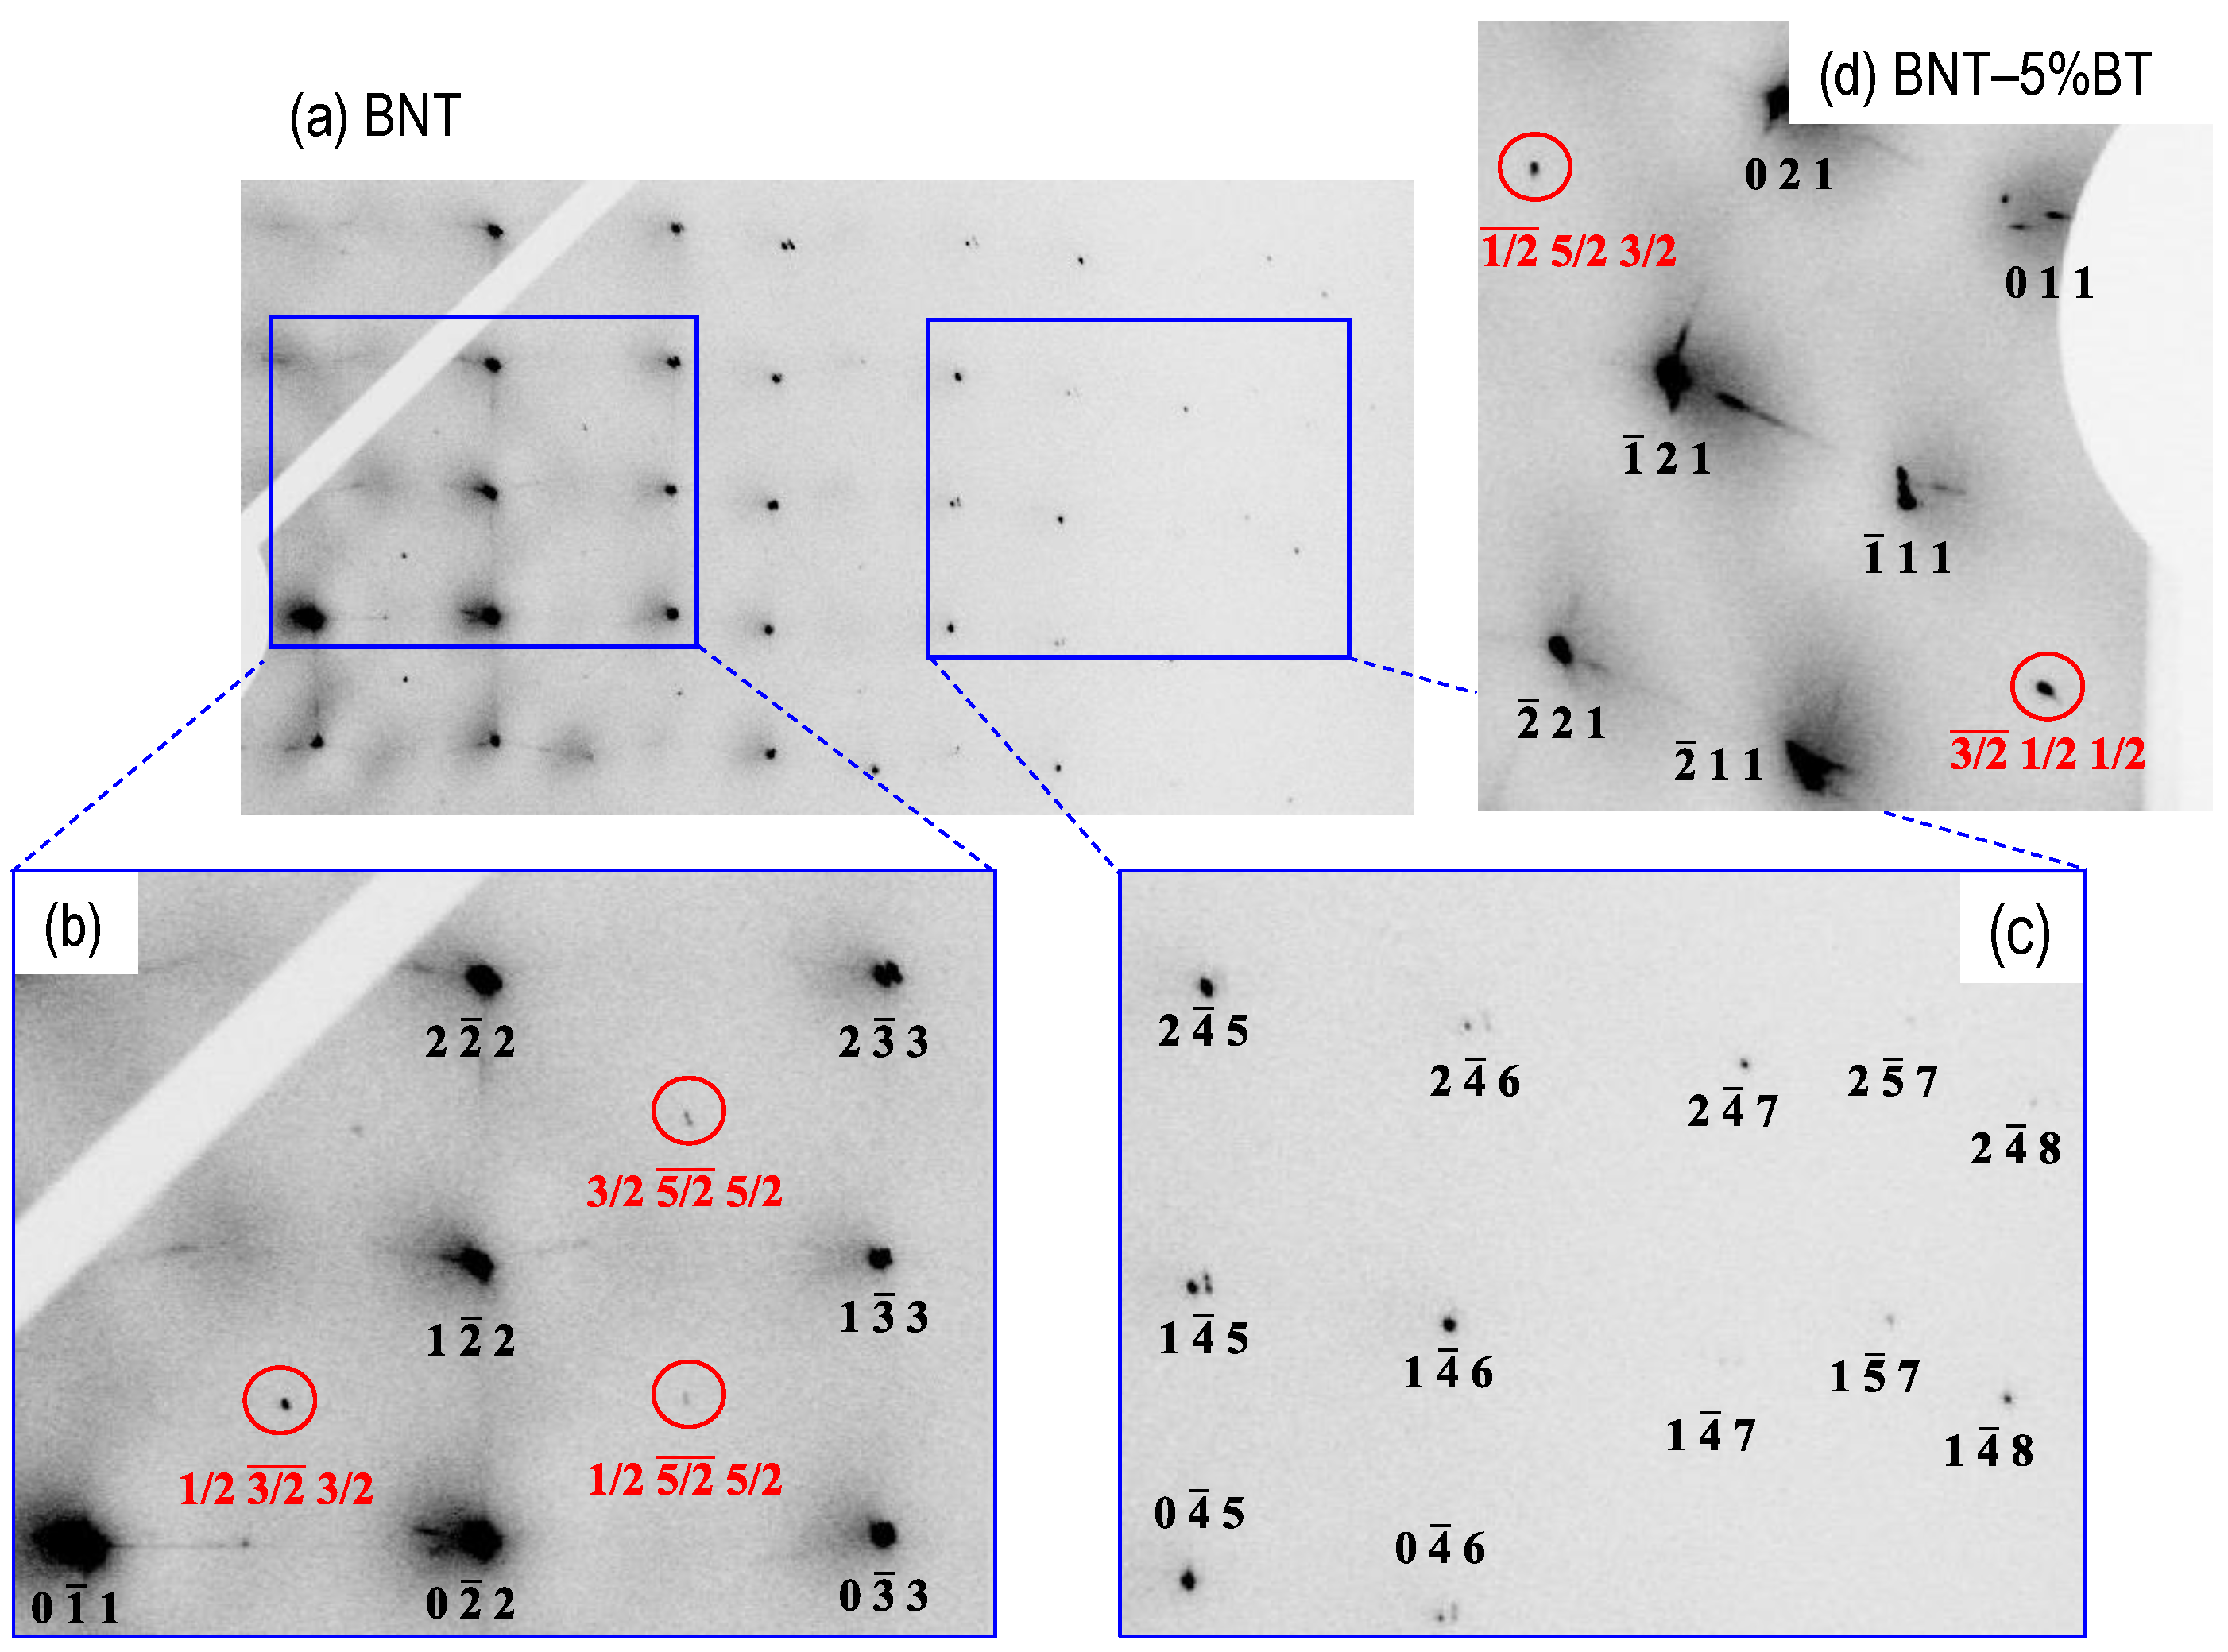
Synchrotron radiation X-ray diffraction (SR-XRD) patterns at Ein-situ = 0 kV/cm observed for the single crystals of (a–c) BNT and (d) BNT–5%BT. (b) and (c) indicate the expansions of the square parts in (a). The superlattice 1/2 (o o o) reflections (o: odd) in addition to the fundamental hkl reflections from the ABO3 primitive unit cell were detected for both crystals.
Figure 2.
Synchrotron radiation X-ray diffraction (SR-XRD) patterns at Ein-situ = 0 kV/cm observed for the single crystals of (a–c) BNT and (d) BNT–5%BT. (b) and (c) indicate the expansions of the square parts in (a). The superlattice 1/2 (o o o) reflections (o: odd) in addition to the fundamental hkl reflections from the ABO3 primitive unit cell were detected for both crystals.
The relation between the monoclinic and pc cells is depicted in
Figure 3a, in which the axes of the monoclinic and pc cells are denoted by the subscript as “m” and “pc”, respectively. The monoclinic cell size used for our structure analysis is different from those of the monoclinic
Cc and
Pc cells. The
C base centered cell with 2/
m symmetry can describe the crystal structures of
Cc and
Pc and the structural parameters can be transformed to each other.
Figure 3.
Unit cells of pseudo-cubic (pc) and monoclinic (m) structures: (a) the relation between the pc cell and the monoclinic cell (the C base centered one with 2/m symmetry) adapted for the SR-XRD analysis. In rhombohedral R3c symmetry, the Ps vector is aligned along <111>pc and forms an angle of αpc with the apc-bpc plane. (b) depicts the schematic image of the Ps rotation by applying an E. In this monoclinic cell, αpc is defined as the angle of the Ps vector with the am–bm plane.
4. Results and Discussion
Figure 2a shows the SR-XRD pattern at
Ein-situ = 0 kV/cm observed for the single crystals of BNT.
Figure 2b,c depict the expansions of the square parts in
Figure 2a. In addition to the fundamental
hkl reflections from the ABO
3 primitive unit cell, the superlattice 1/2 (
o o o) reflections (
o: odd) such as 1/2
3/2 3/2 and 1/2
5/2 5/2 are clearly observed. These 1/2 (
o o o) reflections originate from the tilting of TiO
6 octahedra with
a−a−a− (Glazer notation [
60]), which is described in the space group of rhombohedral
R3
c [
17] or monoclinic
Cc [
61]. As clearly seen in
Figure 2d for the BNT–5%BT crystals, apparent 1/2 (
o o o) reflections were observed. If the tetragonal phase in space group
P4
bm reported in the MPB region (
x = 0.05–0.11) [
28] is present, superlattice 1/2 (
o o e) reflections (
o: odd,
e: even) should be observed, but our BNT and BNT–5%BT crystals did not exhibit any 1/2 (
o o e) reflection in the
Ein-situ range of 0–100 kV/cm.
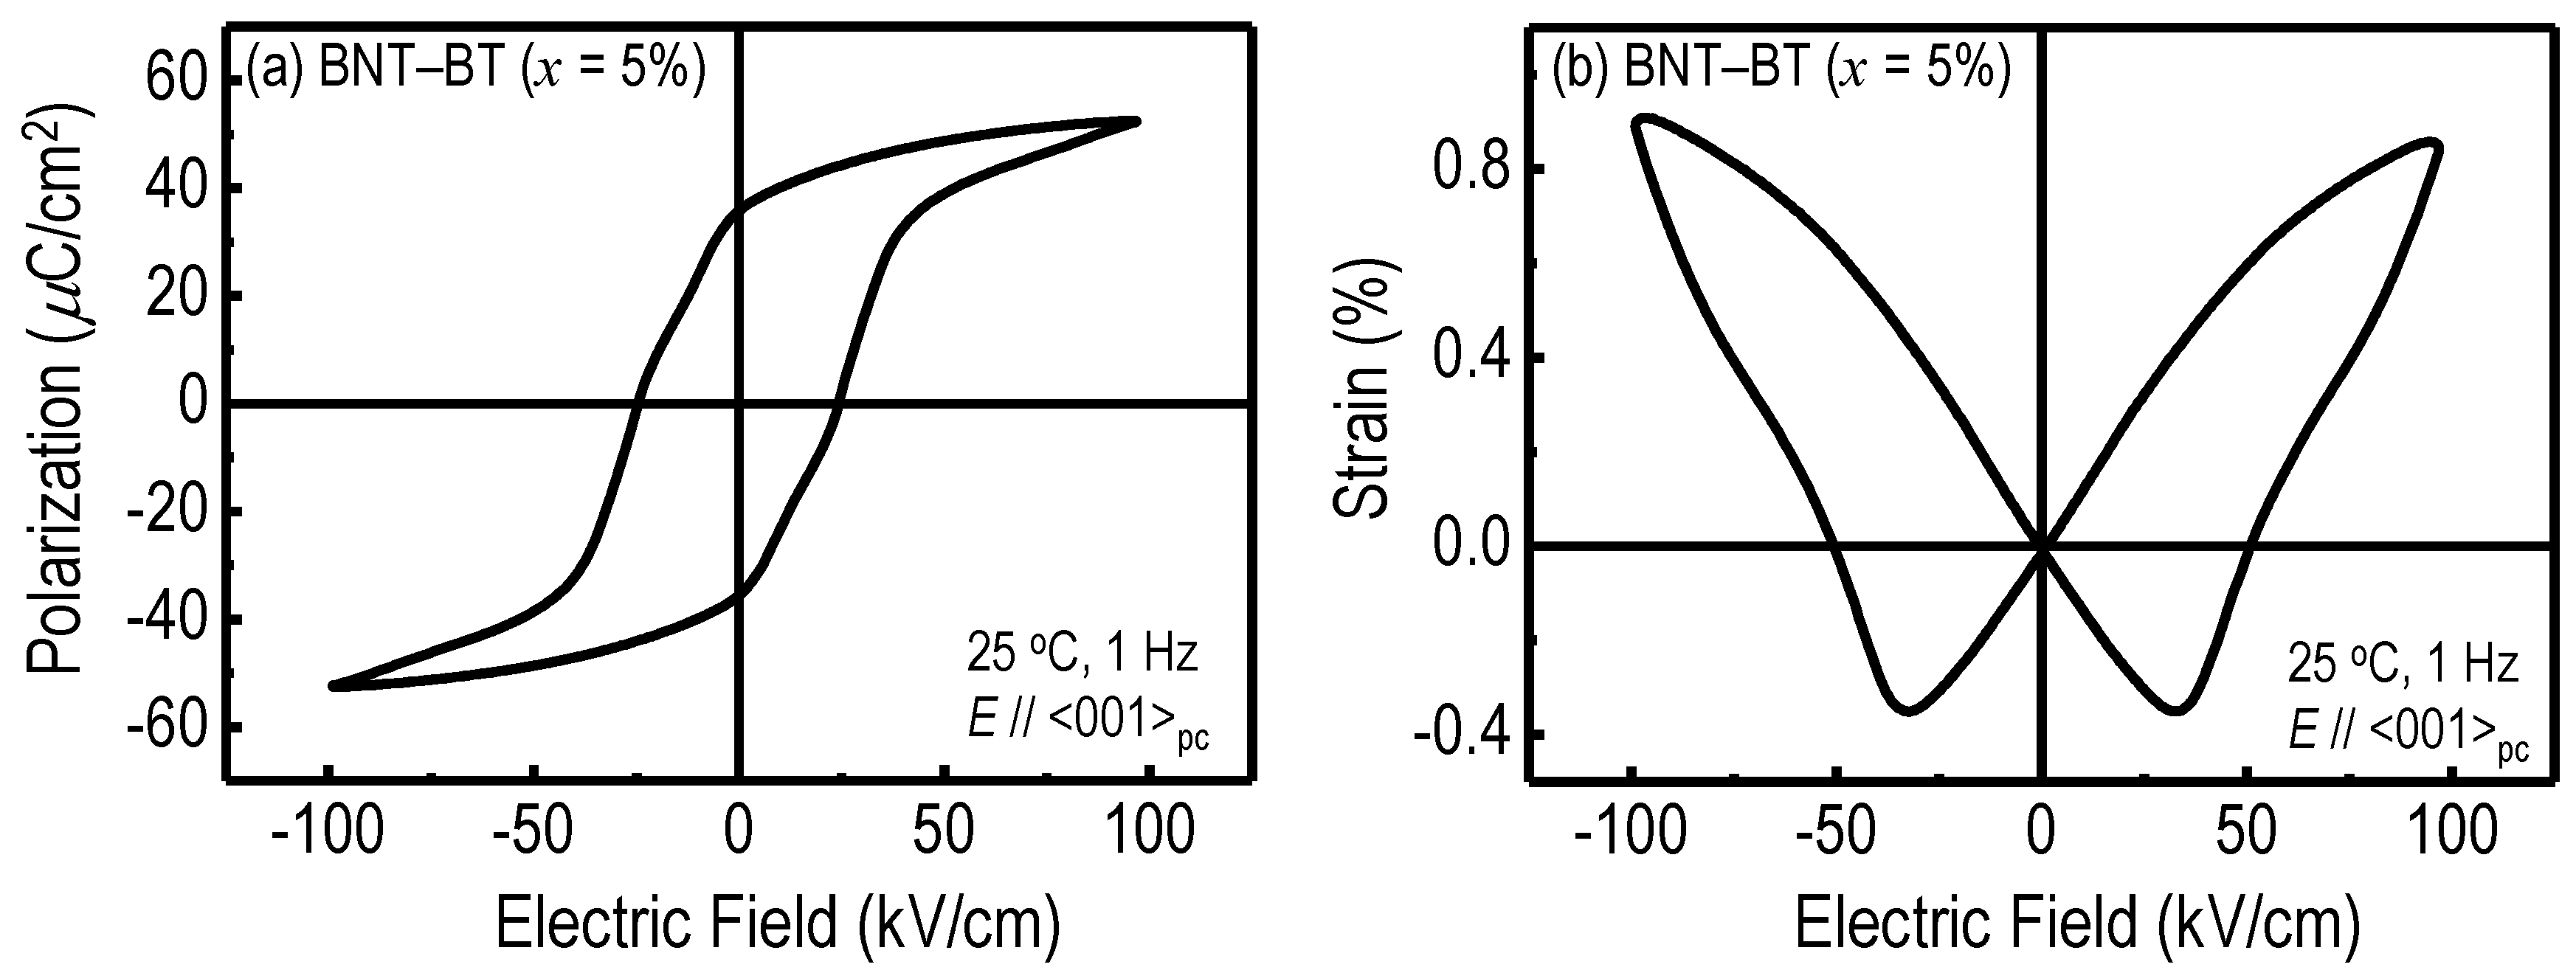
Figure 4a represents the polarization-electric field [
P(
E)] hysteresis loop measured for the BNT–5%BT crystals along <001>
pc at 25 °C. The crystals exhibited a remanent polarization (
Pr) of 36 μC/cm
2 and a coercive field (
Ec) of 24 kV/cm. This
Pr is comparable to the value (34 μC/cm
2) observed for the BNT crystals along <001>
pc [
47].
Our crystals had a relatively large
Pr and a small
Ec compared with the reported values for other BNT–BT crystals [
54,
62,
63]. It has been reported that the high-
Po
2 TSSG method provides high-quality crystals with low concentrations of the vacancies of Bi and O due to a suppression of the defect-formation reaction at high temperatures during the crystal-growth process [
46,
47,
48,
49].
Figure 4b shows the bipolar strain-electric field [
S(
E)] curve measured for the BNT–5%BT crystals along <001>
pc at 25 °C.
Figure 4.
(a) Polarization-electric field [P(E)] hysteresis loop and (b) bipolar strain-electric field [S(E)] curve measured for the BNT–5%BT crystals along <001>pc at 25 °C.
Figure 4.
(a) Polarization-electric field [P(E)] hysteresis loop and (b) bipolar strain-electric field [S(E)] curve measured for the BNT–5%BT crystals along <001>pc at 25 °C.
A typical butterfly curve, mainly due to a domain switching and the converse piezoelectric effect, was observed. The
E at which the
S had the minimum value was
ca. 30 kV/cm, which is slightly higher than the
Ec determined by the
P(
E) measurements. The crystals had a maximum strain (
Smax) up to 0.9% at an
E of 100 kV/cm, which is much larger than those observed for the single crystals of BNT [
64] and BNT–12%BT [
46].
Figure 5a shows the unipolar strain curve (
Sbulk) observed for the BNT–5%BT crystals along <001>
pc. The unit-cell strain (
Sunit-cell) calculated from the lattice parameter
cpc with respect to
Ein-situ in the SR-XRD analysis is also plotted. The piezoelectric strain constant
d33* estimated from the
Sbulk data in the low-
E region (0–5 kV/cm) was 138 pm/V, which is comparable to the strain constant
d33(unit-cell) of 175(28) pm/V determined from the
Sunit-cell data. The
d33(unit-cell) originates from the unit-cell deformation by applying an
Ein-situ mainly due to the intrinsic contribution,
i.e., the converse piezoelectric effect. In the low-
Ein-situ region below 20 kV/cm,
Sbulk and
Sunit-cell are in reasonable agreement with each other. In contrast, the
Smax/
Emax value determined by the
Sbulk was 408 pm/V, which is much larger than the
d33* and
d33(unit-cell) values. The hysteresis observed in the unipolar
Sbulk curve and our SR-XRD analysis suggest that the large
Smax/
Emax is attributed to an extrinsic contribution by non-180° ferroelastic domains.
Figure 5.
(a) Unipolar strain curve (Sbulk) observed for the BNT–5%BT crystals along <001>pc at 25 °C. The unit-cell strain (Sunit-cell) calculated from the lattice parameter cpc with respect to Ein-situ determined in the SR-XRD analysis is also plotted. Figure (b) represents the intensity (I) ratio of superlattice 3/2 1/2 1/2 reflection to fundamental 2 1 1 one as a function of Ein-situ applied along <001>pc for the BNT–5%BT crystals.
When an
Ein-situ is applied along <001>
pc to R(or M) crystals with
Ps mainly along <111>
pc, an
E-induced phase transition from the R(or M) to a T phase is expected, as observed for PZN–PT and PMN–PT crystals [
3]. Such an
E-induced phase transition should change the intensity of the 1/2 (
o o o) reflections with respect to the fundamental
hkl ones.
Figure 5b represents the intensity of the
3/2 1/2 1/2 superlattice spot as a function of
Ein-situ observed for the BNT–5%BT crystals. The intensity of
3/2 1/2 1/2 normalized by the fundamental spot of
2 1 1 exhibits no change by applying an
Ein-situ up to 70 kV/cm. These results clearly show that the BNT–5%BT crystals do not undergo any
E-induced phase transition and that they remain as the monoclinic
Cc (described in detail below).
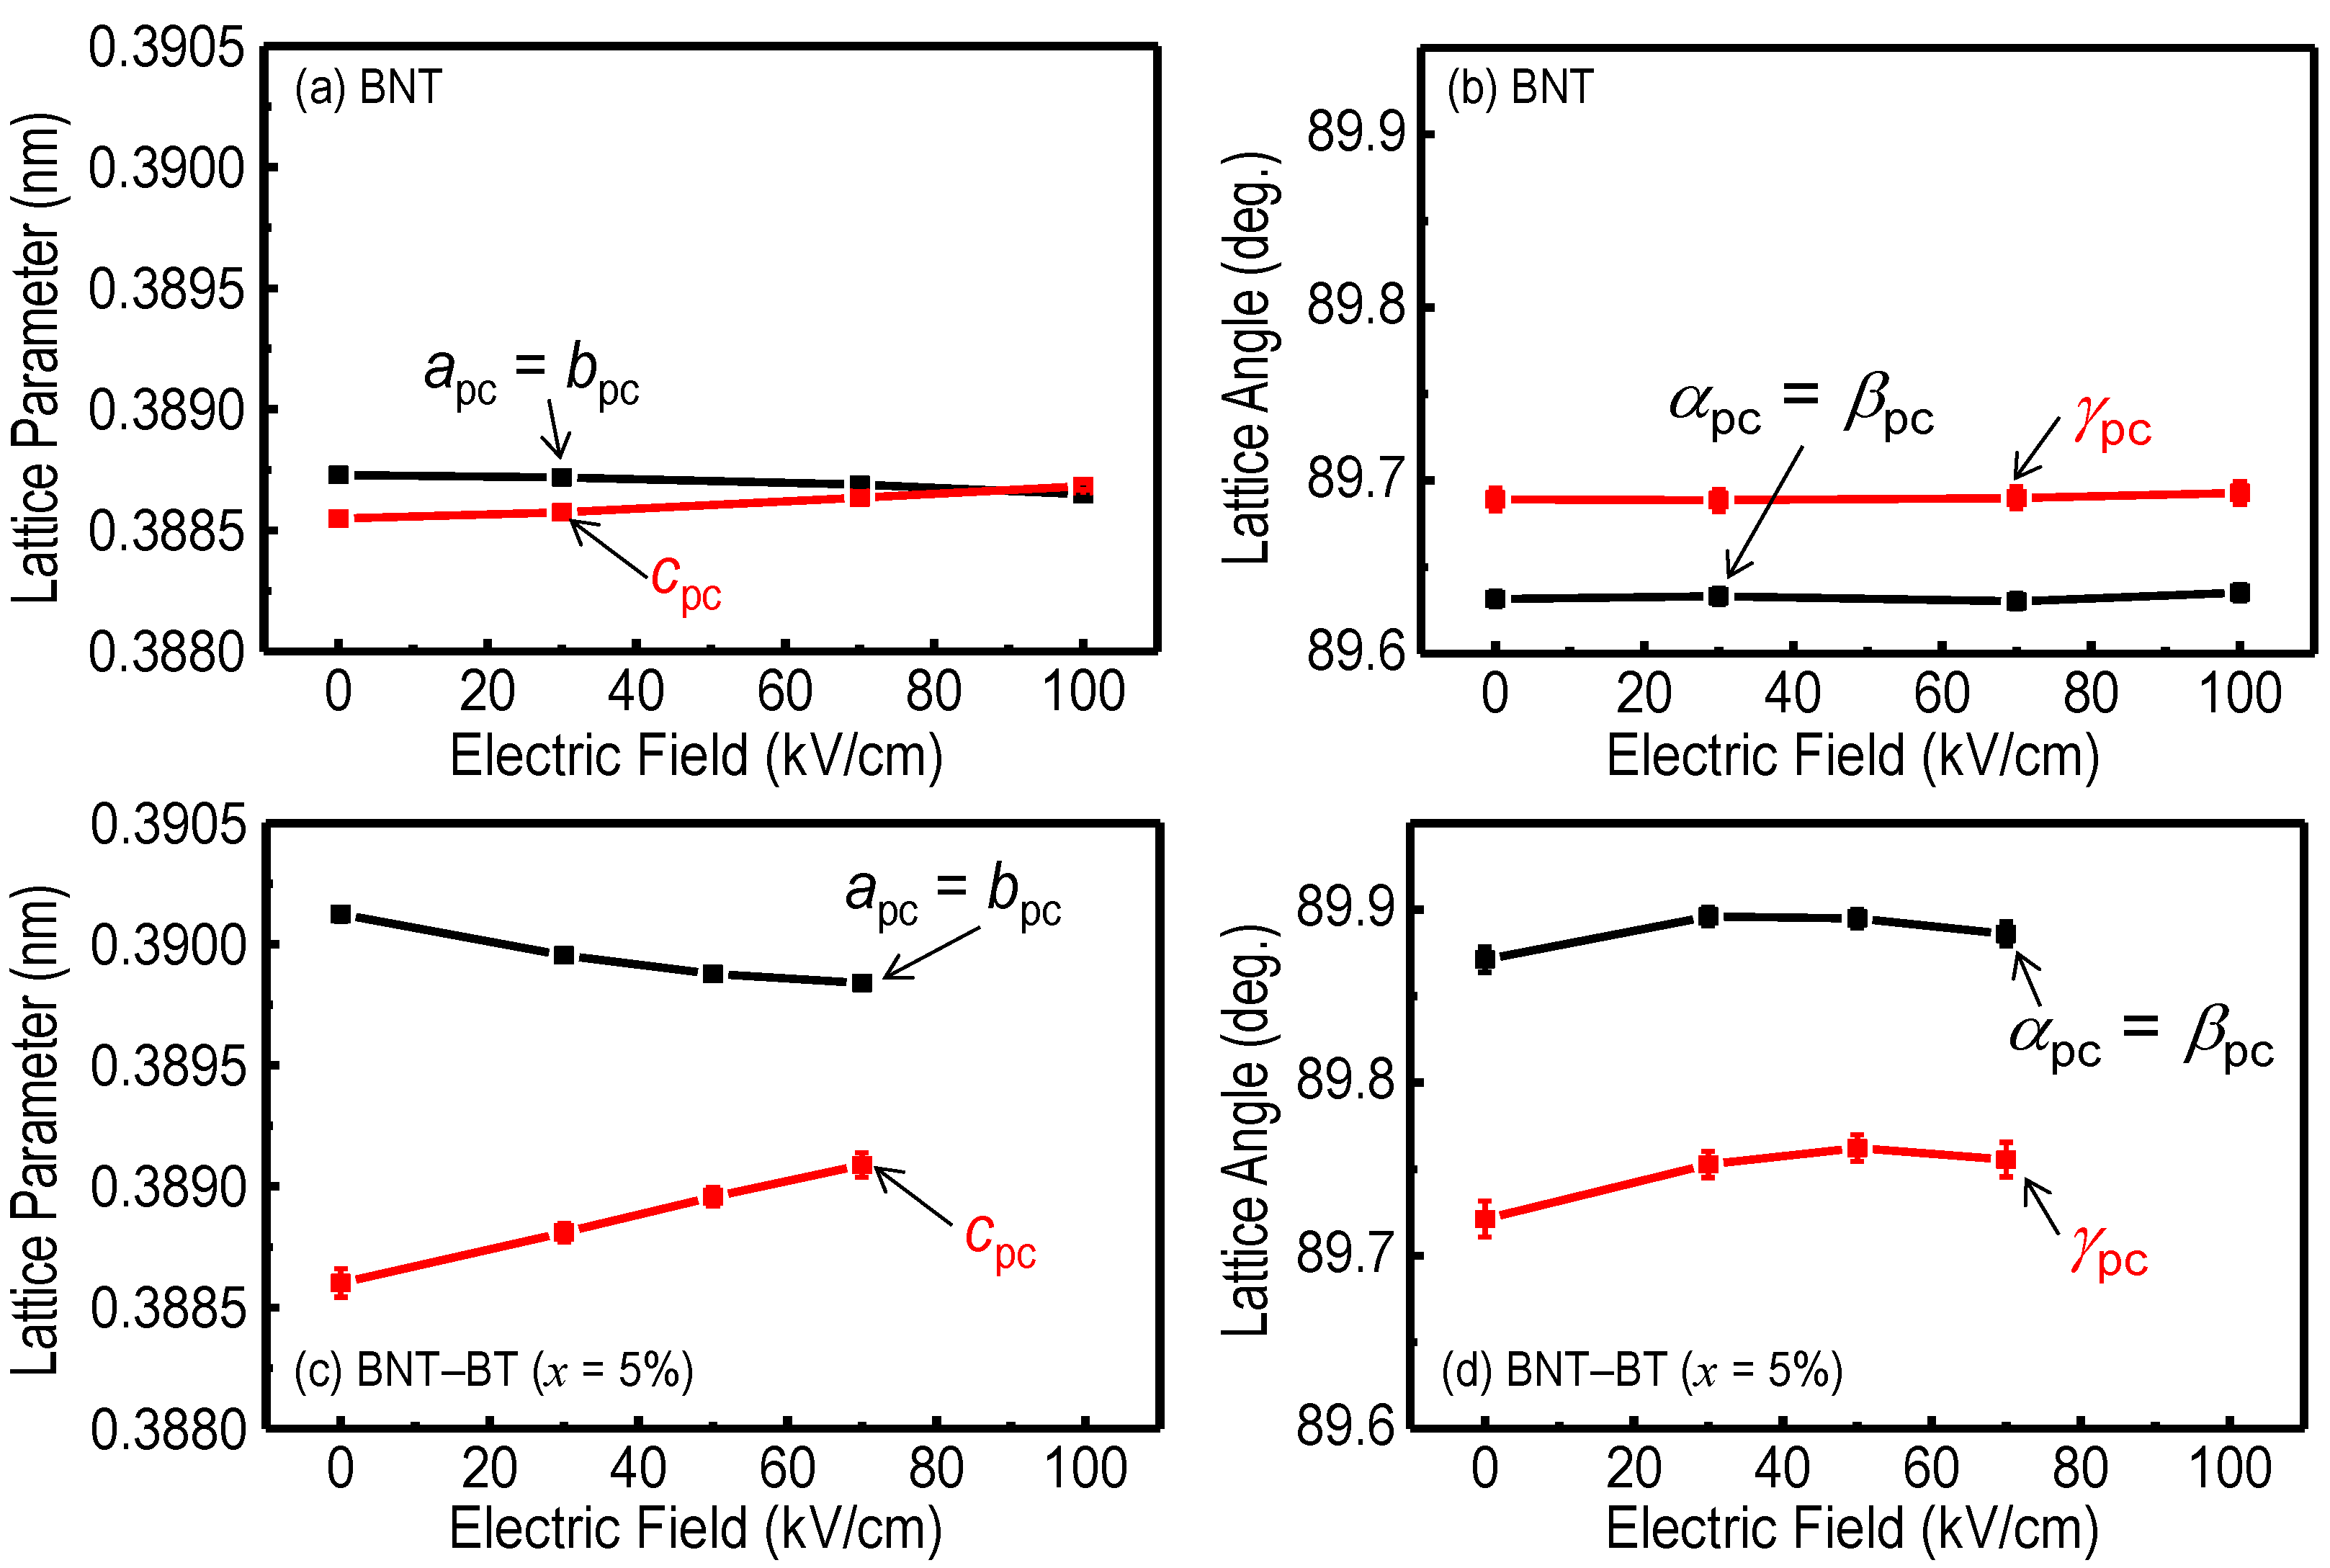
Figure 6 shows the pc unit cell parameters as a function of
Ein-situ along <001>
pc. The rhombohedral
R3
c cell has the relations of
apc =
bpc =
cpc and α
pc = β
pc = γ
pc, but both the crystals of BNT and BNT–5%BT exhibit a structural deviation from the
R3
c cell. These results are direct evidence that the BNT and BNT–5%BT crystals have monoclinic
Cc symmetry.
With increasing Ein-situ, apc was compressed while cpc was elongated mainly due to the converse piezoelectric effect. For the BNT crystals, αpc and γpc remained constant around 89.63° and 89.69°, respectively, regardless of Ein-situ. It is worth noting that the BNT–5%BT crystals presented increasing trends of αpc and γpc with Ein-situ. In particular, γpc markedly increased by 0.04° by Ein-situ, which is much larger than the detection limit of 0.005°–0.007°.
Ma
et al. [
27] have reported that BNT ceramics exhibited an
E-induced phase transition from the
Cc to
R3
c phase at a poling
E of
ca. 50 kV/cm. It is interesting to note that the transition is found to be irreversible,
i.e., that the
R3
c phase is shown to be maintained in the ceramics without the application of
E. This is quite different from the
E-induced phase transitions reported for BaTiO
3-based [
65,
66,
67] and PbTiO
3-based [
2,
68,
69,
70,
71] single crystals. Considering the fact that the BNT single crystals did not exhibit any change in crystal symmetry, the
Cc-
R3
c phase transition induced by the poling is considered peculiar only for the ceramic forms in the BNT system.
Figure 6.
Pseudo-cubic (pc) unit-cell parameters as a function of Ein-situ along <001>pc : (a) lattice parameters and (b) lattice angel observed for the BNT crystals, (c) lattice parameters and (d) lattice angel observed for the BNT–5%BT crystals.
Figure 6.
Pseudo-cubic (pc) unit-cell parameters as a function of Ein-situ along <001>pc : (a) lattice parameters and (b) lattice angel observed for the BNT crystals, (c) lattice parameters and (d) lattice angel observed for the BNT–5%BT crystals.
The bond lengths obtained by the DFT calculations by employing the lattice parameters at
Ein-situ = 0 kV/cm are listed in
Table 1,
Table 2 and
Table 3. The absolute values of the bond length are quite similar for BNT(Aksel
et al. [
19]), BNT, and BNT–5%BT and their differences are as small as 0.8% at most. With respect to the cages composed of O atoms, Ti and Bi display an averaged displacement along <111>
pc, which results in short and long bonding characteristics. For the Ti–O bonding, the three short bonds with 0.181–0.195 nm are seen, which leads to three long bonds with 0.20–0.22 nm. The bond valence sum (BVS) [
72] of Ti is calculated to be 3.95–4.05, which accords well with the nominal ionic valence of Ti
4+. It is interesting to note that Bi exhibits an enhanced off-centering with respect to the cage of twelve O atoms approximately along the
c axis in the
Pc cell (
Figure 1b). These large displacements of Bi cause a considerable difference between the short and long Bi–O bonds. The short Bi–O bonds are in the range of 0.22–0.25 nm while the long Bi–O bonds are found in 0.30–0.33 nm. The averaged short and long bonds of Bi–O are quantitatively in good agreement with 0.22 nm and 0.32 nm determined by the neutron pair distribution analysis [
38] The short bond of Bi–O also accords with 0.22 nm estimated by the extended X-ray absorption fine structure studies [
73]. The BVS of Bi is estimated to be 3.14–3.16, which is slightly larger than the nominal ionic valence of Bi
3+. For the Na–O bonding, the short and long bonds are formed, whereas the off-centering of Na is not significant compared with that of Bi due to the ionic nature of Na atoms. Actually, the BVS of Na is
ca. 1.1, which is almost the same as that of the nominal formal valence of Na
+.
Table 1.
Bond lengths of Ti–O obtained by the density functional theory (DFT) calculations for BNT and BNT–5%BT with Ein-situ = 0 kV/cm in the Pc cell.
Table 1.
Bond lengths of Ti–O obtained by the density functional theory (DFT) calculations for BNT and BNT–5%BT with Ein-situ = 0 kV/cm in the Pc cell.
| Bond length (nm) | BNT b | BNT (Ein-situ = 0 kV/cm) | BNT–5%BT (Ein-situ = 0 kV/cm) |
|---|
| Ti1–O12 | 0.1812 | 0.1813 | 0.1812 |
| Ti1–O5 | 0.1861 | 0.1864 | 0.1863 |
| Ti1–O4 | 0.1894 | 0.1893 | 0.1900 |
| Ti1–O1 | 0.2069 | 0.2085 | 0.2080 |
| Ti1–O10 | 0.2120 | 0.2116 | 0.2133 |
| Ti1–O7 | 0.2179 | 0.2178 | 0.2193 |
| BVS a | 4.02 | 3.99 | 3.95 |
| Ti2–O11 | 0.1869 | 0.1876 | 0.1874 |
| Ti2–O6 | 0.1875 | 0.1880 | 0.1882 |
| Ti2–O1 | 0.1905 | 0.1904 | 0.1915 |
| Ti2–O2 | 0.2048 | 0.2069 | 0.2064 |
| Ti2–O8 | 0.2075 | 0.2072 | 0.2083 |
| Ti2–O9 | 0.2076 | 0.2071 | 0.2082 |
| BVS a | 4.02 | 3.98 | 3.93 |
| Ti3–O2 | 0.1859 | 0.1856 | 0.1859 |
| Ti3–O7 | 0.1906 | 0.1908 | 0.1909 |
| Ti3–O10 | 0.1945 | 0.1953 | 0.1954 |
| Ti3–O5 | 0.2006 | 0.2005 | 0.2014 |
| Ti3–O12 | 0.2020 | 0.2022 | 0.2030 |
| Ti3–O3 | 0.2069 | 0.2089 | 0.2087 |
| BVS a | 4.05 | 4.01 | 3.97 |
| Ti4–O3 | 0.1848 | 0.1845 | 0.1847 |
| Ti4–O8 | 0.1851 | 0.1854 | 0.1851 |
| Ti4–O9 | 0.1869 | 0.1871 | 0.1870 |
| Ti4–O6 | 0.2102 | 0.2104 | 0.2118 |
| Ti4–O4 | 0.2117 | 0.2136 | 0.2133 |
| Ti4–O11 | 0.2128 | 0.2125 | 0.2145 |
| BVS a | 4.02 | 3.99 | 3.96 |
Table 4 lists the
Z* tensors of the constituent atoms obtained for the
Pc cell calculated using the unit-cell parameters of BNT (
Ein-situ = 0 kV/cm). The
Z* tensors reflects the relations expected from symmetry, as reported for monoclinic ZrO
2 [
74]. In the
Pc cell, as all of the constituent atoms are on the 2
a site, an atom at (
x,
y,
z) and its partner atom at (
x, −
y,
z + 1/2) are structurally equivalent. For the atoms on the same 2
a site, the absolute values of the matrix elements are the same. The off-diagonal matrix elements of
xy,
yx,
yz and
zy change sign between the partners while those of
xz and
zx and the diagonal matrix elements of
xx,
yy and
zz have the same sign.
Table 2.
Bond lengths of Bi–O obtained by the DFT calculations for BNT and BNT–5%BT with Ein-situ = 0 kV/cm in the Pc cell.
Table 2.
Bond lengths of Bi–O obtained by the DFT calculations for BNT and BNT–5%BT with Ein-situ = 0 kV/cm in the Pc cell.
| Bond length (nm) | BNT b | BNT (Ein-situ = 0 kV/cm) | BNT–5%BT (Ein-situ = 0 kV/cm) |
|---|
| Bi1–O7 | 0.2271 | 0.2274 | 0.2270 |
| Bi1–O1 | 0.2298 | 0.2302 | 0.2293 |
| Bi1–O10 | 0.2358 | 0.2349 | 0.2352 |
| Bi1–O9 | 0.2403 | 0.2422 | 0.2426 |
| Bi1–O3 | 0.2457 | 0.2461 | 0.2473 |
| Bi1–O5 | 0.2472 | 0.2473 | 0.2495 |
| Bi1–O8 | 0.3074 | 0.3095 | 0.3100 |
| Bi1–O3 | 0.3082 | 0.3096 | 0.3107 |
| Bi1–O12 | 0.3120 | 0.3120 | 0.3135 |
| Bi1–O11 | 0.3199 | 0.3208 | 0.3207 |
| Bi1–O6 | 0.3245 | 0.3252 | 0.3252 |
| Bi1–O1 | 0.3298 | 0.3277 | 0.3302 |
| BVS a | 3.16 | 3.13 | 3.10 |
| Bi2–O4 | 0.2277 | 0.2277 | 0.2270 |
| Bi2–O6 | 0.2332 | 0.2329 | 0.2327 |
| Bi2–O11 | 0.2355 | 0.2350 | 0.2354 |
| Bi2–O2 | 0.2419 | 0.2431 | 0.2444 |
| Bi2–O10 | 0.2433 | 0.2451 | 0.2452 |
| Bi2–O8 | 0.2464 | 0.2470 | 0.2490 |
| Bi2–O7 | 0.3064 | 0.3084 | 0.3078 |
| Bi2–O9 | 0.3089 | 0.3102 | 0.3123 |
| Bi2–O2 | 0.3109 | 0.3118 | 0.3128 |
| Bi2–O5 | 0.3134 | 0.3139 | 0.3138 |
| Bi2–O12 | 0.3152 | 0.3158 | 0.3160 |
| Bi2–O4 | 0.3316 | 0.3298 | 0.3321 |
| BVS a | 3.14 | 3.10 | 3.07 |
In
Pc space group,
Ps lies in the
a–
c plane and contains
x and
z components, which emphasizes the importance of the
xx and
zz elements of the
Z* tensors. It is worth noting that the
xx and
zz elements are quite different from the nominal ionic charges of Bi
3+, Ti
4+, and O
2− whereas only Na exhibits the similar value expected from that of Na
+. The large
Z* is considered as a result of a strong dynamic charge transfer between Bi–O and Ti–O. The
Z* much larger than the nominal ionic charge reflects the delocalized structure of the electronic charge distributions, which is quite common in other ferroelectric perovskite oxides [
74,
75].
Considering the relations between the Z* tensors and the bond lengths, we find the characteristic feature of the large effective charge elements caused by the dynamic charge transfer. The zz elements in the Z* tensors of O1–O4 are extraordinarily large compared with other elements whereas other O atoms except for O10 exhibit the zz elements close to the nominal ionic valence (−2). The quite large zz elements of O1–O4 are a result of the dynamic charge transfer due to the formation of the short bonds of Ti1–O4, Ti2–O1, Ti3–O2, and Ti4–O3, which are approximately normal to the a–b plane in the Pc cell. As for the Z* tensors of O5–O12, the xx and yy elements are relatively large compared with their zz elements, which is attributed to the formation of the short bonds between Ti and O parallel to the a–b plane. These short Ti–O bonds form an angle of ca. 45° with the a and b axes, which enlarges both the xx and zz elements. The relatively large zz element of O10 results from the formation of the short bonds with Bi1 and Bi2 that are aligned averagely along the c axis.
Table 3.
Bond lengths of Na–O obtained by the DFT calculations for BNT and BNT–5%BT with Ein-situ = 0 kV/cm in the Pc cell.
Table 3.
Bond lengths of Na–O obtained by the DFT calculations for BNT and BNT–5%BT with Ein-situ = 0 kV/cm in the Pc cell.
| Bond length (nm) | BNT b | BNT (Ein-situ = 0 kV/cm) | BNT–5%BT (Ein-situ = 0 kV/cm) |
|---|
| Na1–O4 | 0.2423 | 0.2439 | 0.2454 |
| Na1–O12 | 0.2430 | 0.2451 | 0.2463 |
| Na1–O6 | 0.2447 | 0.2456 | 0.2479 |
| Na1–O8 | 0.2508 | 0.2516 | 0.2519 |
| Na1–O9 | 0.2510 | 0.2515 | 0.2518 |
| Na1–O2 | 0.2582 | 0.2589 | 0.2590 |
| Na1–O2 | 0.2997 | 0.2974 | 0.2990 |
| Na1–O11 | 0.3065 | 0.3061 | 0.3072 |
| Na1–O5 | 0.3071 | 0.3093 | 0.3095 |
| Na1–O4 | 0.3108 | 0.3109 | 0.3116 |
| Na1–O10 | 0.3124 | 0.3129 | 0.3128 |
| Na1–O7 | 0.3178 | 0.3178 | 0.3177 |
| BVS a | 1.14 | 1.11 | 1.09 |
| Na2–O1 | 0.2432 | 0.2446 | 0.2461 |
| Na2–O7 | 0.2434 | 0.2442 | 0.2465 |
| Na2–O11 | 0.2434 | 0.2454 | 0.2465 |
| Na2–O5 | 0.2530 | 0.2539 | 0.2542 |
| Na2–O12 | 0.2554 | 0.2559 | 0.2560 |
| Na2–O3 | 0.2565 | 0.2568 | 0.2577 |
| Na2–O3 | 0.3023 | 0.3003 | 0.3011 |
| Na2–O9 | 0.3026 | 0.3022 | 0.3016 |
| Na2–O8 | 0.3058 | 0.3052 | 0.3046 |
| Na2–O6 | 0.3081 | 0.3088 | 0.3089 |
| Na2–O1 | 0.3084 | 0.3087 | 0.3096 |
| Na2–O10 | 0.3096 | 0.3108 | 0.3123 |
| BUS a | 1.14 | 1.11 | 1.08 |
Table 4.
Born effective charge (Z*) tensors of the constituent atoms obtained for the Pc cell calculated using the unit-cell parameters of BNT (Ein-situ = 0 kV/cm). The elements in the Z* tensors are listed below.
Table 4.
Born effective charge (Z*) tensors of the constituent atoms obtained for the Pc cell calculated using the unit-cell parameters of BNT (Ein-situ = 0 kV/cm). The elements in the Z* tensors are listed below.
| Atom | xx | yy | zz | xy | xz | yx | yz | zx | zy |
|---|
| Bi1 | 4.18 | 5.05 | 5.03 | 0.29 | −0.64 | −0.35 | 0.31 | −0.41 | −0.33 |
| Bi2 | 4.41 | 5.08 | 5.09 | 0.28 | −0.44 | −0.24 | 0.33 | −0.66 | −0.37 |
| Na1 | 1.17 | 1.18 | 1.11 | −0.03 | 0.02 | 0.02 | −0.04 | −0.03 | 0.03 |
| Na2 | 1.19 | 1.20 | 1.14 | −0.02 | −0.03 | 0.03 | −0.02 | 0.04 | 0.04 |
| Ti1 | 6.58 | 5.29 | 5.77 | 0.33 | −0.78 | −0.10 | 0.67 | −0.44 | −0.38 |
| Ti2 | 5.42 | 7.21 | 6.48 | −0.36 | −0.98 | 0.34 | −0.51 | −1.38 | 0.54 |
| Ti3 | 5.07 | 8.13 | 6.62 | −0.07 | −0.37 | 0.52 | 0.08 | −0.49 | 0.10 |
| Ti4 | 6.03 | 6.05 | 5.97 | −0.02 | −0.08 | 0.00 | 0.08 | 0.07 | 0.06 |
| O1 | −2.77 | −1.32 | −5.02 | 0.02 | 0.46 | −0.16 | −0.17 | 0.59 | −0.24 |
| O2 | −1.15 | −2.90 | −5.44 | 0.23 | −0.06 | 0.10 | 0.30 | 0.04 | 0.56 |
| O3 | −1.27 | −2.88 | −5.22 | 0.11 | 0.36 | 0.09 | 0.36 | 0.17 | 0.51 |
| O4 | −3.02 | −1.25 | −4.69 | 0.08 | 0.87 | −0.09 | −0.22 | 0.60 | −0.24 |
| O6 | −3.31 | −3.91 | −2.08 | −1.46 | −0.10 | −1.49 | 0.96 | −0.14 | 0.73 |
| O7 | −2.96 | −3.70 | −2.14 | −1.22 | 0.06 | −1.27 | 0.81 | 0.16 | 0.76 |
| O9 | −2.89 | −4.08 | −2.19 | −1.49 | 0.32 | −1.59 | −0.66 | 0.59 | −0.55 |
| O10 | −2.76 | −3.98 | −2.97 | 1.26 | 0.09 | 1.10 | −0.01 | 0.07 | 0.09 |
| O11 | −2.99 | −4.06 | −2.17 | 1.54 | −0.29 | 1.44 | −0.55 | −0.34 | −0.73 |
| O12 | −3.37 | −3.96 | −1.42 | −2.05 | −0.05 | −2.15 | −0.07 | 0.05 | 0.17 |
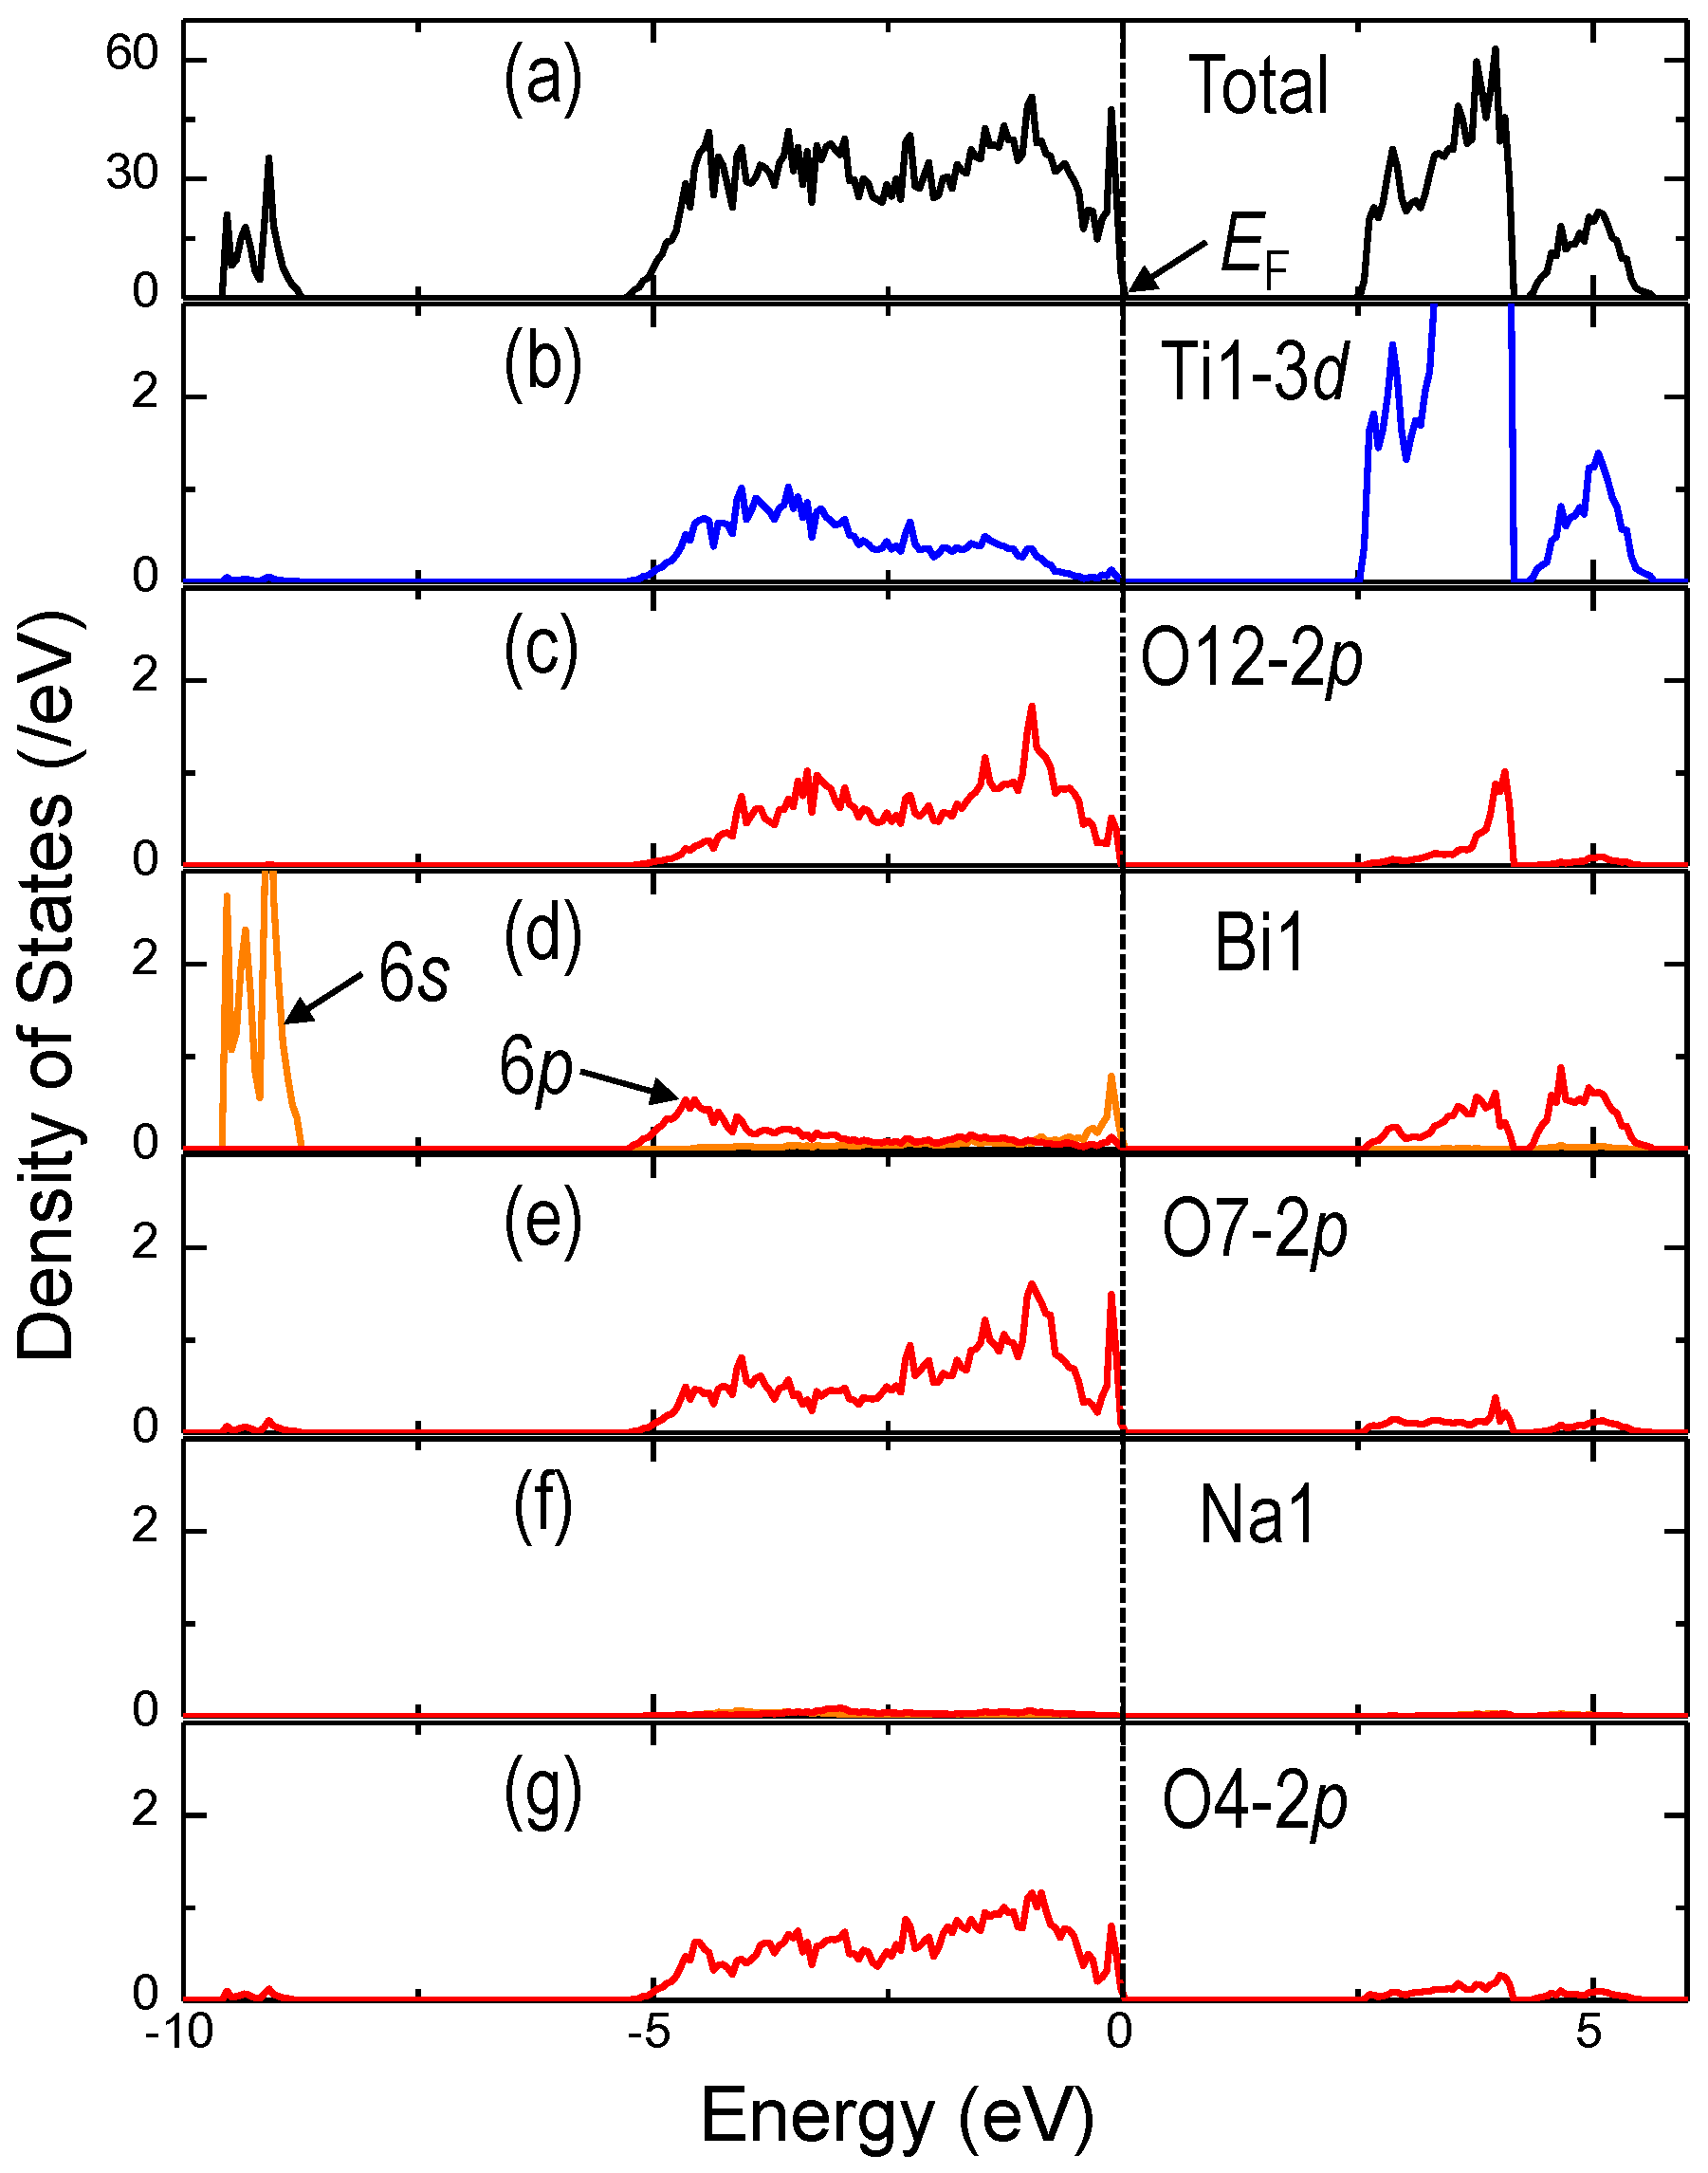
The charge transfer feature can be evaluated by electronic density of states (DOS). If Ti atoms have the nominal ionic valence of +4, the electronic configuration of Ti
4+ is expressed as [Ar]3
d0 and should not possess partial DOS (PDOS) in the valence band (VB). Similarly, Bi
3+ with 6
s26
p0 does not have PDOS in the VB if Bi atoms behave as an ion with the nominal valence of +3.
Figure 7 exhibits the (a) total DOS and (b)–(g) PDOS of the representative constituent atoms of BNT (
Ein-situ = 0 kV/cm). In these plot, the valence band maximum (VBM) is set to be the Fermi level,
i.e., 0 eV. As reported for BaTiO
3 and PbTiO
3 [
76,
77], the PDOS of the Ti–3
d states are found in the valence band (VB, −5 to 0 eV) due to the dynamic charge transfer,
i.e., the orbital hybridization between the 3
d states of Ti and the 2
p states of the neighboring O forming the short bonds with Ti. It is interesting to note that Bi has some PDOS of 6
p in the VB resulting from the Bi–6
p–O–2
p hybridization, which is similar to the Pb–6
p–O–2
p one reported for PbTiO
3 [
78]. In contrast, Na has almost no PDOS in the VB, showing that Na has an ionic nature in BNT. This result is consistent with the calculation of the
Z* tensor of Na. The orbital hybridizations of Bi and Ti with O lower the energy levels with occupied electrons, leading to the characteristic short bonds, as listed in
Table 1,
Table 2 and
Table 3.
Table 5 lists the structural parameters obtained by the DFT calculations for BNT (
Ein-situ = 0 kV/cm). The displacements of atoms along the
a (∆
x) and
c (∆
z) axes in the
Pc cell are estimated from the center of the polyhedral cages. For example, the center of a TiO
6 octahedron is determined to be the position at which the sum of the displacements of the six O atoms becomes zero both along the
a and
c axes. Using these displacements and the
Z* tensors, the
x (
pa) and
z (
pc) components of
patom are obtained as a dipole moment per the unit-cell volume. The angle of
patom with the
a–
b plane is defined as α
patom, which is obtained by the
pa,
pc, and the monoclinic angle β. The direction of α
patom is expressed by [
uuv], as listed in
Table 5, where [
uuv] is calculated to be [11v] in the pc cell. As the sum values of
pa and
pc are denoted as
Pa and
Pc, respectively,
Pa = 35.8 μC/cm
2 and
Pc = 41.9 μC/cm
2 are obtained. To estimate the contributions of Bi, Na, Ti, and O to the macroscopic polarization, the polarization vectors of Bi, Na, Ti, and O are calculated and the results are as follows:
pBi = 28.2 μC/cm
2 (α
m = 35.6°),
pNa = 5.3 μC/cm
2 (α
m = 36.8°),
pTi = 34.5 μC/cm
2 (α
m = 36.8°), and
pO = −4.8 C/cm
2 (α
m = −11.0°). The summation of these
p vectors leads to a
Ps of 63.7 μC/cm
2 with its angle (α
m) of 38.2° with the
a–
b plane.
Table 6 lists the structural parameters obtained by the DFT calculations for BNT–5%BT (
Ein-situ = 0 kV/cm) in the same manner, and
Pa = 38.6 μC/cm
2 and
Pc = 40.4 μC/cm
2 are obtained.
Figure 7.
(a) Total and (b–g) partial density of states (DOS) of the representative constituent atoms of BNT (Ein-situ = 0 kV/cm) obtained by the DFT calculations in which the Pc cell with its fixed lattice parameters determined by the SR-XRD analysis is adapted The valence band maximum (VBM) is set to be the Fermi level, i.e., 0 eV.
The
Ps of BNT is found to be 63.7 μC/cm
2, which leads to a <001>
pc component of 39.4 μC/cm
2. This agrees well with the
Pr (34 μC/cm
2) observed for the BNT crystals along <001>
pc [
47]. The angle (α
m) of
Ps with the
am–
bm plane (
Figure 3b) is estimated to be 38.2°, which is slightly higher than the <111>
pc angle (α
pc) of 35.3° (
Figure 3a). This result shows that the crystal structure of BNT is well described by the rhombohedral
R3
c symmetry [
38]. The
Ps of BNT–5%BT is obtained to be 64.6 μC/cm
2, which results in a <001>
pc component of 38.0 μC/cm
2. This
Ps component accords qualitatively with the
Pr of 36 μC/cm
2 observed for the BNT–5%BT crystals along <001>
pc.
Figure 8 exhibits the α
m of
Ps and
patom as a function of
Ein-situ. The DFT calculations in the
Pc cell were conducted using the lattice parameters determined by the SR-XRD analysis (see
Figure 6) to incorporate the influence of
Ein-situ on
Ps and
patom. The values of
Ps and
patom did not depend on
Ein-situ and the difference in
patom caused by the application of
Ein-situ was less than 0.1 μC/cm
2 for both BNT and BNT–5%BT. It is interesting to note that α
m displays a characteristic trend with
Ein-situ. BNT is found to show an almost constant α
m of around 38.2° and the rotation angle (
∆α
m) of
Ps by
Ein-situ was as small as 0.2°, which is due to the constant lattice parameters of BNT regardless of
Ein-situ. Note that the α
m of BNT–5%BT varies significantly from 36.0° (
Ein-situ = 0 kV/cm) to 37.3° (
Ein-situ = 70 kV/cm) and that its
∆α
m reaches 1.3°. These results clearly show that BNT–5%BT features an electrically soft with respect to the rotation of
Ps by
Ein-situ.
One of the possible origins of the
Ps rotation observed for the BNT–5%BT crystals is that this composition is present near the MPB between monoclinic
Cc and tetragonal
P4
bm. Transmission electron microscopy observations by Ma
et al. [
28] have revealed that (1 −
x)BNT–
xBT ceramics without an application of
E exhibit
P4
bm symmetry in the
x range of 6%–10%. Neutron powder diffraction study conducted by Kitanaka
et al. [
79] have reported direct evidence of tetragonal
P4
bm for BNT–7%BT powder. The
P4
bm phase has a
Ps of 4 μC/cm
2 [
79] along <001>
pc, as depicted in
Figure 3b. It is suggested that the MPB between monoclinic
Cc and tetragonal
P4
bm lies around
x of 6%. This implies that the
Cc and
P4
bm phases are energetically competitive but that an energy barrier for the
E-induced phase transition from the
Cc to
P4
bm phase is not overcome in the BNT–5%BT crystals under an
Ein-situ along <001>
pc up to 70 kV/cm. Although the application of
Ein-situ does not lead to a phase transition, the
Ps rotation observed is considered as a sign of the
E-induced phase transition. A materials design for enhancing piezoelectric response of Bi-based ferroelectric oxides based on the
Ps rotation is expected to be developed by the studies of the structural analyses under
Ein-situ combined with DFT calculations.
Figure 8.
Angles (αm) of the (a,c) Ps and (b,d) patom vectors as a function of Ein-situ along <001>pc. The αm is defined as the angle of Ps or patom with the am–bm plane. Ps and patom denotes Ps = ǀPsǀ and patom = ǀpatomǀ. Ps and patom are estimated from the off-center displacements and the Born effective charge (Z*) tensors obtained by the DFT calculations.
Table 5.
Structural parameters obtained by the DFT calculations for BNT (Ein-situ = 0 kV/cm) in the Pc cell. The following lattice parameters were used: a = 0.55124 nm, b = 0.54825 nm, c = 1.65376 nm, α = γ = 90.0000°, and β = 70.0105°. The Ps of 63.7 μC/cm2 with its angle (αm) of 38.2° is estimated.
| Atom | x (−) | y (−) | z (−) | ∆x (nm) a | ∆z (nm) a | pa b (μC/cm2) | pc b (μC/cm2) | αpatom c (deg) | [u | u | v] d |
|---|
| Bi1 | 0.2726 | 0.7478 | 0.2566 | 0.03296 | 0.02772 | 8.24 | 8.64 | 35.96 | 1 | 1 | 1.03 |
| Bi2 | 0.0203 | 0.2544 | 0.0077 | 0.03172 | 0.02944 | 8.71 | 8.85 | 35.32 | 1 | 1 | 1.00 |
| Na1 | 0.4986 | 0.7498 | 0.0034 | 0.01976 | 0.02231 | 1.63 | 1.66 | 35.36 | 1 | 1 | 1.00 |
| Na2 | 0.7470 | 0.2538 | 0.2529 | 0.01885 | 0.02162 | 1.48 | 1.74 | 38.19 | 1 | 1 | 1.11 |
| Ti1 | 0.6218 | 0.7584 | 0.3732 | 0.01876 | 0.01381 | 7.73 | 4.90 | 26.08 | 1 | 1 | 0.69 |
| Ti2 | 0.8627 | 0.7524 | 0.1224 | 0.01371 | 0.01237 | 4.27 | 4.20 | 34.69 | 1 | 1 | 0.98 |
| Ti3 | 0.0977 | 0.2557 | 0.3733 | 0.00544 | 0.01394 | 1.54 | 6.15 | 57.76 | 1 | 1 | 2.24 |
| Ti4 | 0.3670 | 0.2498 | 0.1247 | 0.01609 | 0.01628 | 6.56 | 6.74 | 35.56 | 1 | 1 | 1.01 |
| O1 | 0.6980 | 0.8128 | 0.2421 | −0.00814 | 0.00362 | 1.66 | −1.58 | −52.90 | 1 | 1 | −1.87 |
| O2 | 0.9758 | 0.6910 | −0.0088 | 0.00719 | 0.00222 | −0.58 | −0.81 | 41.79 | 1 | 1 | 1.26 |
| O3 | 0.2194 | 0.1891 | 0.2410 | 0.00362 | 0.00190 | −0.27 | −0.64 | 51.02 | 1 | 1 | 1.75 |
| O4 | 0.4440 | 0.3116 | −0.0093 | −0.01037 | 0.00144 | 2.24 | −0.89 | −23.40 | 1 | 1 | −0.61 |
| O5 | 0.8876 | 0.5307 | 0.3518 | 0.02746 | −0.02158 | −8.30 | 3.77 | −26.80 | 1 | 1 | −0.71 |
| O6 | 0.1304 | −0.0168 | 0.0979 | 0.02352 | −0.02803 | −5.15 | 3.78 | −42.63 | 1 | 1 | −1.30 |
| O7 | 0.3762 | 0.4831 | 0.3456 | 0.02119 | −0.03195 | −4.43 | 4.93 | −59.32 | 1 | 1 | −2.38 |
| O8 | 0.6378 | 0.0294 | 0.1000 | 0.02754 | −0.02457 | −8.59 | 5.22 | −35.77 | 1 | 1 | −1.02 |
| O9 | 0.5488 | 0.5333 | 0.1308 | −0.02147 | 0.02631 | 4.84 | −4.83 | −54.92 | 1 | 1 | −2.01 |
| O10 | 0.2898 | 0.9599 | 0.3780 | −0.02645 | 0.02170 | 5.13 | −4.54 | −49.99 | 1 | 1 | −1.69 |
| O11 | 0.0448 | 0.4676 | 0.1279 | −0.02367 | 0.02158 | 4.43 | −2.66 | −35.39 | 1 | 1 | −1.00 |
| O12 | 0.8008 | 0.0293 | 0.3814 | −0.02041 | 0.02734 | 4.63 | −2.73 | −34.78 | 1 | 1 | −0.98 |
Table 6.
Structural parameters obtained by the DFT calculations for BNT–5%BT (Ein-situ = 0 kV/cm) in the Pc cell. The following lattice parameters were used: a = 0.55306 nm, b = 0.55037 nm, c = 1.65152 nm, α = γ = 90.0000°, and β = 70.2530°. The Ps of 64.6 μC/cm2 with its angle (αm) of 36.0° is estimated.
| Atom | x (−) | y (−) | z (−) | ∆x (nm) a | ∆z (nm) a | pa b (μC/cm2) | pc b (μC/cm2) | αpatom c (deg) | [u | u | v] d |
|---|
| Bi1 | 0.2739 | 0.7477 | 0.2565 | 0.03420 | 0.02729 | 8.61 | 8.46 | 34.76 | 1 | 1 | 0.98 |
| Bi2 | 0.0222 | 0.2542 | 0.0074 | 0.03328 | 0.02880 | 9.20 | 8.56 | 33.65 | 1 | 1 | 0.94 |
| Na1 | 0.4994 | 0.7495 | 0.0032 | 0.02066 | 0.02188 | 1.70 | 1.62 | 34.18 | 1 | 1 | 0.96 |
| Na2 | 0.7472 | 0.2539 | 0.2528 | 0.01940 | 0.02112 | 1.53 | 1.70 | 37.28 | 1 | 1 | 1.08 |
| Ti1 | 0.6232 | 0.7589 | 0.3731 | 0.01998 | 0.01334 | 8.31 | 4.67 | 23.98 | 1 | 1 | 0.63 |
| Ti2 | 0.8635 | 0.7520 | 0.1220 | 0.01464 | 0.01165 | 4.66 | 3.79 | 30.98 | 1 | 1 | 0.85 |
| Ti3 | 0.0979 | 0.2557 | 0.3731 | 0.00601 | 0.01344 | 1.76 | 5.90 | 55.97 | 1 | 1 | 2.09 |
| Ti4 | 0.3688 | 0.2496 | 0.1246 | 0.01757 | 0.01595 | 7.18 | 6.62 | 33.49 | 1 | 1 | 0.94 |
| O1 | 0.6960 | 0.8121 | 0.2422 | −0.00887 | 0.00373 | 1.80 | −1.64 | −51.08 | 1 | 1 | −1.75 |
| O2 | 0.9750 | 0.6913 | −0.0088 | 0.00716 | 0.00207 | −0.57 | −0.76 | 40.68 | 1 | 1 | 1.22 |
| O3 | 0.2194 | 0.1894 | 0.2410 | 0.00406 | 0.00166 | −0.31 | −0.55 | 46.05 | 1 | 1 | 1.47 |
| O4 | 0.4429 | 0.3104 | −0.0092 | −0.01058 | 0.00140 | 2.28 | −0.88 | −22.81 | 1 | 1 | −0.59 |
| O5 | 0.8864 | 0.5309 | 0.3521 | 0.02726 | −0.02123 | −8.23 | 3.72 | −26.64 | 1 | 1 | −0.71 |
| O6 | 0.1289 | −0.0165 | 0.0982 | 0.02313 | −0.02769 | −5.06 | 3.73 | −42.74 | 1 | 1 | −1.31 |
| O7 | 0.3741 | 0.4837 | 0.3459 | 0.02048 | −0.03148 | −4.28 | 4.85 | −59.92 | 1 | 1 | −2.44 |
| O8 | 0.6373 | 0.0297 | 0.1001 | 0.02781 | −0.02452 | −8.66 | 5.23 | −35.55 | 1 | 1 | −1.01 |
| O9 | 0.5488 | 0.5326 | 0.1310 | −0.02114 | 0.02637 | 4.77 | −4.82 | −55.30 | 1 | 1 | −2.04 |
| O10 | 0.2893 | 0.9609 | 0.3781 | −0.02640 | 0.02163 | 5.12 | −4.52 | −49.84 | 1 | 1 | −1.68 |
| O11 | 0.0452 | 0.4690 | 0.1279 | −0.02314 | 0.02126 | 4.32 | −2.62 | −35.70 | 1 | 1 | −1.02 |
| O12 | 0.8013 | 0.0287 | 0.3812 | −0.01976 | 0.02680 | 4.48 | −2.67 | −35.16 | 1 | 1 | −1.00 |


