Article

TEV—A Program for the Determination of the Thermal Expansion Tensor from Diffraction Data

by
Thomas Langreiter
and
Volker Kahlenberg
*
Institute of Mineralogy and Petrography, University of Innsbruck, Innrain 52, A-6020 Innsbruck, Austria
*
Author to whom correspondence should be addressed.
Crystals 2015, 5(1), 143-153; https://doi.org/10.3390/cryst5010143
Submission received: 6 January 2015 / Accepted: 4 February 2015 / Published: 16 February 2015

Abstract

:
TEV (Thermal Expansion Visualizing) is a user-friendly program for the calculation of the thermal expansion tensor αij from diffraction data. Unit cell parameters determined from temperature dependent data collections can be provided as input. An intuitive graphical user interface enables fitting of the evolution of individual lattice parameters to polynomials up to fifth order. Alternatively, polynomial representations obtained from other fitting programs or from the literature can be entered. The polynomials and their derivatives are employed for the calculation of the tensor components of αij in the infinitesimal limit. The tensor components, eigenvalues, eigenvectors and their angles with the crystallographic axes can be evaluated for individual temperatures or for temperature ranges. Values of the tensor in directions parallel to either [uvw]’s of the crystal lattice or vectors (hkl) of reciprocal space can be calculated. Finally, the 3-D representation surface for the second rank tensor and pre- or user-defined 2-D sections can be plotted and saved in a bitmap format. TEV is written in JAVA. The distribution contains an EXE-file for Windows users and a system independent JAR-file for running the software under Linux and Mac OS X. The program can be downloaded from the following link: http://www.uibk.ac.at/mineralogie/downloads/TEV.html (Institute of Mineralogy and Petrography, University of Innsbruck, Innsbruck, Austria)

Graphical Abstract

1. Introduction

Together with thermal conductivity, thermal expansion is one of the key parameters for the physical characterization of the temperature dependent behavior of materials and is of relevance for both Earth and materials science. For anisotropic compounds such as crystalline phases which are uniformly heated or cooled the resulting homogeneous strain xij can be described by the following relationship:
xij = αij ΔT
where αij are the thermal expansion coefficients defining a symmetrically second rank tensor and ΔT is the temperature change. Most oxides, for example, have ambient temperature thermal expansion coefficients in the order of 10−6/K.
Classical methods for the evaluation of thermal expansion data include dilatometry (inductive, capacity, optical interference) or diffraction. Especially the last technique has been frequently employed for T-dependent investigations on single-crystals or polycrystalline compounds using X-rays or neutrons. According to Jessen and Küppers [1], two different approaches for the extraction of thermal expansion coefficients from diffraction data can be principally distinguished. In the first case, the inter-planar spacings d(hkl) of a set of m lattice planes (hkl)m (m >> 6) is described by an appropriate function of temperature. Depending on the symmetry, the maximal six independent tensor components of αij can be obtained from solving an over-determined system of m linear equations [2,3]. Alternatively, the changes in the lattice parameters a, b, c, α, β, γ determined at different temperatures can be used directly to relate them to the tensor components αij [4,5]. In reference [5], Schlenker et al. presented a mathematical treatment for the general triclinic case in terms of finite changes between two different temperatures T1 and T2.
As discussed by Paufler and Weber [6], however, this methodology has the disadvantage that the consideration of finite temperature differences will always produce “average values”, while the magnitudes and the orientation of all three principal axes of the thermal expansion tensor for a triclinic crystal will change within the selected temperature interval without any coupling to the lattice parameters. Therefore, Paufler and Weber derived a set of equations that allow the calculation of the coefficients in the infinitesimal temperature limit.
In order to use this method the temperature dependency of the individual lattice-parameters has to be described by an appropriate function. In the literature, different mathematical expressions have been used for this purpose. A comparatively simple function is based on an Einstein model assuming that all atoms vibrate with the same angular frequency, i.e., there exists a delta function in the phonon density of states at the Einstein frequency ωE. The resulting expression for the unit cell volume has been transferred to describe the temperature dependence of the individual unit cell edges: r(T) = r0 + E/(exp(ΘE/T − 1)), where r0 (value for the particular lattice parameter r at T = 0 K), ΘE (effective Einstein temperature) and E (Einstein constant) are the fit parameters [7,8,9]. For the description of more complex relationships between r and T “two-term Einstein models” [10,11], “extended Einstein-models” [12,13], Debye-like expressions [14] or combinations between Einstein- and Debye-like functions including anharmonic contributions [15] have been used. Alternatively, a more straightforward description using polynomials has also been successfully employed in many cases to model thermal expansion over large temperature intervals [6,16].

2. Results and Discussion

2.1. Mathematical Background

A second rank tensor (such as the tensor of thermal expansion αij) is usually referred to an orthogonalized coordinate system {e1, e2, e3}. In general, there is an infinite number of ways in which this reference system could be selected. In TEV, this system was chosen in such a way that it can be derived from the crystallographic basis vectors {a, b, c} according to the following relations: e3 is parallel to c, e2 is parallel to b* and e1 = e2 × e3 (in order to create a right-handed coordinate system). In more detail, these relationships can be expressed as follows:
( a b c ) = ( a   sinβ 0 a   cosβ b   sinα   cosγ * b   sinαsinγ * b   cosα   0 0 c ) ( e 1 e 2 e 3 )
TEV is based on the abovementioned formalism of Paufler and Weber [6], where the temperature increments are treated in the infinitesimal limit. In the first step of the calculations, the temperature evolution of the relevant lattice parameters must be described by a continuous function of T. In the present version of TEV, polynomials up to fifth order can be used for this purpose. The temperature dependency of the lattice parameter a, for example, for a third order polynomial can be parameterized as:
a ( T ) = p 0 + p 1 T + p 2 T 2 + p 3 T 3  
Numerically, the quality of the fitting can be described by the coefficient of determination R2:
R 2 =   i = 1 n ( a i   a ¯ ) 2   i = 1 n ( a i   a ^ i ) 2   i = 1 n ( a i   a ¯ ) 2
( a i : observed value no. i; a ^ i : calculated value no. i; a ¯ : mean; n: no. of different temperatures).
In the second step, the six (for the most general triclinic case) independent αij components can be related to the lattice parameters and their derivatives according to the following mathematical expressions presented by Paufler and Weber [6]:
α 11 1 a d a d T + d β d T cotβ
α 22 1 b d b d T + d α d T cotα + d γ * d T cotγ *
α 33 1 c d c d T
α 12 1 2 cotγ * ( 1 a d a d T 1 b d b d T d α d T cotα + d β d T cotβ ) + 1 2 d γ * d T
α 13 1 2   ( 1 a d a d T 1 c d c d T ) cotβ 1 2 d β d T
α 23 1 2 ( ( 1 a d a d T 1 c d c d T ) cotγ *  cotβ + ( 1 b d b d T 1 c d c d T ) cotα sin γ * ( 1 sinγ * d α d T + d β d T cotγ * ) )
The relationships for the other crystal systems follow directly from simplifications of these equations according to restrictions in and/or dependencies between the values of the parameters a, b, c, α, β and γ.
Using the components of the symmetrical αij-tensor, the value of the thermal expansion can be calculated for any direction which can defined by a vector q whose three components are the direction cosines q 1 , q 2 and q 3 , i.e., the cosines of the angles between the vector q and the three axes of the orthogonalized reference system {e1, e2, e3}:
α q 1 , q 2 , q 3   =   ( q 1 q 2 q 3 )   ( α 11 α 12 α 13 α 12 α 22 α 23 α 13 α 23 α 33 ) ( q 1 q 2 q 3 )  
Frequently, the values of αij in directions parallel to a crystallographic direction t = ua + vb + wc or parallel to a reciprocal lattice vector r* = ha* + kb* + lc* (perpendicular to a lattice plane with indices (hkl)) are of special importance. Therefore, the direction cosines of these vectors relative to the reference system {e1, e2, e3} must be known. In TEV, the necessary transformations are calculated as follows (V and V* are the unit cell volumes of the direct and the reciprocal lattice, respectively):
q ( h k l ) =   r * | r * | = ( q 1 q 2 q 3 ) = ( 1 V b * | r * | ( h c l a cosβ ) 1 | r * | ( h a * cosγ * +   k b * +   l c * cosα * ) l c | r * | )
q [ u v w ] =   t | t | = ( q 1 q 2 q 3 ) = ( 1 V * c | t | ( u b * v a * cosγ * ) v b * | t | 1 | t | ( u a cosβ +   v b cosα + w c ) )
By plotting the thermal expansion coefficients α q 1 , q 2 , q 3 as a function of the direction q =   ( q 1 , q 2 , q 3 ) one obtains a geometric representation of the tensor in form of a surface in 3-D space. TEV calculates this representation surface and visualizes it as a surface chart. Alternatively, pre- or user-defined 2-D sections can be drawn. The corresponding figures can be exported in bitmap format (PNG).

2.2. Using the Program—General Remarks

The program allows the user to determine the tensor of thermal expansion αij from
(i)
the evaluation of a data set containing a sequence of lattice parameters measured as a function of temperature T;
(ii)
the evaluation of an already existing polynomial description of the lattice parameters obtained from another fitting program or from the literature.
The experimental data for (i) must be stored in plain-text (ASCII) format. The file can be prepared with a standard text editor. People working with Excel or OpenOffice can simply save the data as character-separated values (CSV).
The data (without any header line) should have the following structure: the first column corresponds to the temperature T. Subsequent columns represent the numerical values of the unit cell parameters (real numbers with a “.” symbol for the decimal mark used to separate the integer from the fractional part). The lattice parameters can be given either with or without estimated standard uncertainties (e.s.u.). In the case that the e.s.u. have been determined, they can be provided directly following the fractional part of the relevant lattice parameters enclosed by round brackets “()”. For example, 9.335(12) corresponds to 9.335 ± 0.012. If present, the e.s.u. will be used as weights for the least-squares fitting procedure of the polynomials. TEV will automatically recognize whether e.s.u. have been provided or not. However, it is not allowed to use “mixed” data, i.e., lattice parameters with and without uncertainties cannot be contained within the same data set.
Data of different columns are separated by a “;” symbol. The number of columns depends on the crystallographic coordinate system:
TriclinicT1; a1; b1; c1; α1; β1; γ1
T2; a2; b2; c2; α2; β2; γ2
MonoclinicT1; a1; b1; c1; oblique angle β1 or γ1
T2; a2; b2; c2; oblique angle β2 or γ2
OrthorhombicT1; a1; b1; c1
T2; a2; b2; c2
RhombohedralT1; a1; α1
T2; a2; α2
Hexagonal/TetragonalT1; a1; c1
T2; a2; c2
CubicT1; a1
T2; a2
When entering already known polynomial coefficients for method (ii) these values must be separated by a vertical bar “|” (also referred to as the “pipe” symbol), i.e., the coefficients of the function a ( T ) = p 0 + p 1 T + p 2 T 2 + p 3 T 3 must be provided as p 0   |   p 1   |   p 2   |   p 3 .
For testing of option (i), three data sets (triclinicESU.crs, monoclinic.crs and hexagonal.crs) are available. For testing of option (ii), existing polynomials from the literature have been implemented as default values for the triclinic and monoclinic case. The triclinic data refer to the values given in the paper of Paufler and Weber [6] and can be used for direct comparison of the results.

2.3. Examples

The data of the first example refer to the high-temperature behavior of a hexagonal sulfate apatite with composition Na2Ca3(SO4)3F [17] (point group 6/m). In the range between 25 °C and 600 °C both lattice parameters were fitted with second-order polynomials (see Figure 1).
Figure 1. Evolution of the (a) a-; and (b) c-lattice parameters for hexagonal Na2Ca3(SO4)3F.
Crystals 05 00143 g001
Subsequently, the evolution of the two symmetry independent tensor components α11 and α33 has been calculated in steps 25 °C. It is obvious from Figure 2 that at temperatures below ≈ 190 °C the thermal expansion parallel to [001] is smaller than perpendicular to [001]. Above 190 °C, however, this trend is reversed. This observation is also reflected in the comparison between the shapes of the representation surfaces at ambient temperature and 600 °C, for example, which change from an oblate to a prolate form (see Figure 3). For hexagonal symmetry, these surfaces must be rotationally symmetric along the direction of the sixfold rotation axis of the point group.
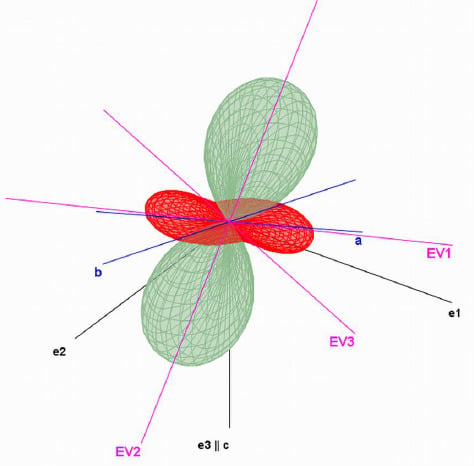
The second example is based on the low-temperature investigations of Weber et al. [18] on triclinic α-CuMoO4 (point group 1 ¯ ). The coefficients of the polynomials up to third order for all six metrical parameters have been directly taken from their publication. The following Figure 4 shows the 3-D representation surface of the thermal expansion tensor for 70 K.
Figure 2. Temperature dependency of α11 and α33. The figure has been produced from the numerical output of Thermal Expansion Visualizing (TEV) using the program Gnuplot [19].
Crystals 05 00143 g002
Figure 3. Representation surfaces for the tensor of thermal expansion at (a) 25 °C; and (b) 600 °C.
Crystals 05 00143 g003
Figure 4. Representation surface of the thermal expansion tensor for α-CuMoO4 at 70 K. Red parts of the surface indicate directions with negative values of thermal expansion. The crystallographic system {a, b, c}, the orthonormal system {e1, e2, e3} and the coordinate system of the eigenvectors {EV1, EV2, EV3} are indicated as well.
Crystals 05 00143 g004
For the interpretation of the tensor data it is often helpful to consider sections through the 3-D representation surface. The Figure 5a–d shows the corresponding default sections (defined by the e1-e2, e2-e3, e3-e1 planes) and a section that was explicitly defined by the two crystallographic directions [111] and [120], for example. The latter option can be of special interest for the interpretation of thermal expansion data in terms of the atomic arrangements in a given crystal structures, e.g., anisotropy of thermal expansion within a specific plane defined by layer-like building units. Surface plots and sections can be saved in a bitmap format (PNG).
Figure 5. Three default (ac) and specific (d) sections through the 3-D representation surface for α-CuMoO4 at 70 K.
Crystals 05 00143 g005
The variation of the orientation of the thermal expansion tensor with temperature can be observed in the changes of the angles between the eigenvectors {EV1, EV2, EV3} and the crystallographic axes {a, b, c}, for example. Figure 6 shows the temperature dependency of the angle between eigenvector EV2 and the three basis vectors {a, b, c}. While <(EV2, b) and <(EV2, c) show only relatively small changes as a function of T, the angle <(EV2, a) exhibits a strong variation and a pronounced non-linear behavior.
According to our own investigations on the high-temperature behavior of oxide materials polynomials of second order are in many cases sufficient for the description of the lattice parameters as a function of T. However, for low-temperature data sets with data points close to absolute zero higher orders may be necessary. Figure 7 shows the temperature dependency of the a unit cell parameter of monoclinic crocoite (PbCrO4) taken from Knight [7]. For comparison, data were fitted using an Einstein-function with three variable parameters as well as polynomials of orders two, three and four. In this case fitting was performed with the program Gnuplot [19]. It is obvious that a second order polynomial cannot be used to model the data adequately. However, the inclusion of third and fourth order terms resulted in a fit that is almost indistinguishable from the Einstein function. In summary, one can say that polynomial functions offer a great variability of applications concerning the coverage of different temperature regions.
Figure 6. Variation of the angle between eigenvector EV2 and a (triangles), b (spheres) and c (rhombs) for the T-range from 20 to 300 K.
Crystals 05 00143 g006
Figure 7. Comparison between an Einstein-type function and polynomials of order two, three and four for the modeling of the low-temperature behavior of the a lattice parameter of crocoite (PbCrO4).
Crystals 05 00143 g007

2.4. Final Remarks

In the present TEV version 0.9.4 only polynomials can be used for the evaluation of the T-dependence of the lattice parameters. The user should keep in mind that this description is ONLY valid for the temperature interval for which experimental data have been collected. Therefore, it does not make any sense to use the program for the derivation of the thermal expansion tensor components or other related quantities for temperatures outside this interval. An extended version of the program which will include other expressions for fitting such as Einstein- or Debye-functions is currently in progress. Furthermore, it is worth mentioning that compressibilities derived from pressure dependent diffraction data are second rank tensors as well and could be principally visualized using the same approach although other expressions such as Birch-Murnaghan equations of state of different orders have to be used for this purpose. This topic may be addressed in future versions.
TEV is written in JAVA. The program uses several libraries that are listed under the menu point “Help”. A pre-requisite for working with TEV is the installation of the JAVA runtime environment of at least version 7 which can be downloaded from the following link: http://www.java.com/en/download/ [20]. The distribution contains an EXE-file for Windows users and a system independent JAR-file for running the software under Linux and Mac OS X. Furthermore, three test files containing temperature dependent data sets from hexagonal, monoclinic and triclinic compounds, a short manual and several license files for the libraries are included. The distribution can be downloaded from the following link: http://www.uibk.ac.at/mineralogie/downloads/TEV.html [21].

Acknowledgments

The authors are thankful for the comments and suggestions of three anonymous reviewers.

Author Contributions

Thomas Langreiter wrote the program TEV as a part of his Master thesis. Volker Kahlenberg conceived and designed the project.

Conflicts of Interest

The authors declare no conflict of interest.

References

  1. Jessen, S.M.; Küppers, H. The precision of thermal-expansion tensors of triclinic and monoclinic crystals. J. Appl. Cryst. 1991, 24, 239–242. [Google Scholar] [CrossRef]
  2. Lonappan, M.A. Thermal expansion of boric acid. Proc. Indian Acad. Sci. A 1955, 42, 10–21. [Google Scholar]
  3. Haussühl, S. Physical Properties of Crystals—An Introduction; Wiley-VCH: Weinheim, Germany, 2007; pp. 159–164. [Google Scholar]
  4. Schlenker, J.L.; Gibbs, G.V.; Boisen, M.B. Thermal expansion coefficients for monoclinic crystals: A phenomenological approach. Am. Mineral. 1975, 60, 828–833. [Google Scholar]
  5. Schlenker, J.L.; Gibbs, G.V.; Boisen, M.B. Strain-tensor components expressed in terms of lattice parameters. Acta Cryst. A 1978, 34, 52–54. [Google Scholar] [CrossRef]
  6. Paufler, P.; Weber, Z. On the determination of linear thermal expansion coefficients of triclinic crystals using X-ray diffraction. Eur. J. Mineral. 1999, 11, 721–730. [Google Scholar] [CrossRef]
  7. Knight, K.S. A neutron powder diffraction determination of the thermal expansion tensor of crocoite (PbCrO4) between 60 K and 290 K. Mineral. Mag. 1996, 60, 963–972. [Google Scholar] [CrossRef]
  8. Knight, K.S.; Stretton, I.C.; Schofield, P.F. Temperature evolution between 50 K and 230 K of the thermal expansion tensor of gypsum derived from neutron powder diffraction data. Phys. Chem. Minerals 1999, 26, 477–483. [Google Scholar] [CrossRef]
  9. Ballirano, P.; Melis, E. Thermal behaviour and kinetics of dehydration of gypsum in air from in situ real-time laboratory parallel-beam X-ray powder diffraction. Phys. Chem. Minerals 2009, 7, 391–402. [Google Scholar] [CrossRef]
  10. Knight, K.S. Low temperature thermoelastic and structural properties of LaGaO3 perovskite in the Pbnm phase. J. Solid State Chem. 2012, 194, 286–296. [Google Scholar] [CrossRef]
  11. Knight, K.S. A high-resolution powder neutron diffraction study of the crystal structure of neighborite (NaMgF3) between 9 K and 440 K. Am. Mineral. 2014, 99, 824–838. [Google Scholar] [CrossRef]
  12. Fortes, A.D.; Wood, I.G.; Knight, K.S. The crystal structure and thermal expansion tensor of MgSO4–11D2O (meridianite) determined by neutron powder diffraction. Phys. Chem. Minerals 2008, 35, 207–221. [Google Scholar] [CrossRef]
  13. Fortes, A.D.; Suard, E.; Knight, K.S. Negative linear compressibility and massive anisotropic thermal expansion in methanol monohydrate. Science 2011, 331, 742–746. [Google Scholar] [CrossRef] [PubMed]
  14. David, W.I.F.; Evans, J.S.O. Parametric Powder Diffraction. In Uniting Electron Crystallography and Powder Diffraction; NATO Science for Peace and Security Series B. Physics and Biophysics; Kolb, U., Shankland, K., Meshi, L., Avilov, A., David, W., Eds.; Springer Science + Business Media: Dordrecht, The Netherlands, 2012; pp. 149–163. [Google Scholar]
  15. Senyshyn, A.; Boysen, H.; Niewa, R.; Banys, J.; Kinka, M.; Burak, Ya.; Adamiv, V.; Izumi, F.; Chumak, I.; Fuess, H. High-temperature properties of lithium tetraborate Li2B4O7. J. Phys. D Appl. Phys. 2012, 45, 1–15. [Google Scholar] [CrossRef]
  16. Fey, Y. Thermal expansion. In Mineral Physics & Crystallography: A Handbook of Physical Constants; Ahrens, T.J., Ed.; American Geophysical Union: Washington, DC, USA, 1995; pp. 29–44. [Google Scholar]
  17. Botta, C.; Kahlenberg, V.; Hejny, C.; Többens, D.M.; Bykov, M.; van Smaalen, S. Structural investigations, high temperature behaviour and phase transition of Na6Ca4(SO4)6F2. Mineral. Petrol. 2014, 108, 487–501. [Google Scholar]
  18. Weber, Th.; Harz, M.; Wehner, B.; Zahn, G.; Paufler, P. Thermal expansion of CuMoO4 below room temperature. Z. Kristallogr. 1998, 213, 210–216. [Google Scholar] [CrossRef]
  19. Williams, T.; Kelley, C.; et al. Gnuplot 4.6.6: An Interactive Plotting Program. Available online: http://gnuplot.info (accessed on 8 October 2014).
  20. Download Free Java Software. Available online: http://www.java.com/en/download/ (accessed on 9 February 2015).
  21. Langreiter, T.; Kahlenberg, V. Thermal Expansion Visualizing—A program for the determination of the thermal expansion tensor from diffraction data. Available online: http://www.uibk.ac.at/mineralogie/downloads/TEV.html (accessed on 12 December 2014).