Article

Technique for High-Quality Protein Crystal Growth by Control of Subgrain Formation under an External Electric Field

1
Institute for Materials Research, Tohoku University, 2-1-1 Katahira, Aoba-ku, Sendai 980-8577, Japan
2
Graduate School of Nanobioscience, Yokohama City University, 22-2 Seto, Kanazawa-ku, Yokohama 236-0027, Japan
3
Department of Education, Yokohama Soei University, 1 Miho-tyou, Midori-ku, Yokohama 226-0015, Japan
*
Author to whom correspondence should be addressed.
Crystals 2016, 6(8), 95; https://doi.org/10.3390/cryst6080095
Submission received: 30 March 2016 / Revised: 4 August 2016 / Accepted: 6 August 2016 / Published: 16 August 2016
(This article belongs to the Special Issue Crystal Dislocations)

Abstract

:
X-ray diffraction (XRD) rocking-curves were measured for tetragonal hen egg white (HEW) lysozyme crystals grown with and without application of an external electric field, and the crystal quality was assessed according to the full width at half-maximums (FWHMs) of each rocking-curve profile. The average FWHMs for tetragonal HEW lysozyme crystals grown with an external electric field at 1 MHz were smaller than those for crystals grown without, especially for the 12 12 0 reflection. The crystal homogeneity of the tetragonal HEW lysozyme crystals was also improved under application of an external electric field at 1 MHz, compared to that without. Improvement of the crystal quality of tetragonal HEW lysozyme crystals grown under an applied field is discussed with a focus on subgrain formation. In addition, the origin of subgrain misorientation is also discussed with respect to the incorporation of impurities into protein crystals.

Graphical Abstract

1. Introduction

The structural analysis of protein molecules using X-ray diffraction (XRD) analysis is actively performed in order to achieve structure-guided drug design and controlled drug delivery. Accurate 3D structures of molecules by XRD analysis are obtained by using high-quality single crystals. However, the growth of high-quality single crystals of proteins is difficult, which is an impediment to accurate elucidation of the 3D structures of protein molecules. Therefore, the establishment of crystallization techniques to obtain high-quality single crystals of proteins has been intensively pursued using magnetic fields [1,2,3,4,5,6,7,8], microgravity [9,10,11,12,13,14,15,16], electric fields [17,18,19,20,21], solution flow [22,23,24,25] and gel as a growth host media [26,27,28,29,30,31,32]. In this article, the improvement of the crystal quality of tetragonal hen egg white (HEW) lysozyme crystals as a model protein is demonstrated by applying an external electric field.
It is also difficult to control the nucleation process of proteins, and therefore some research that has employed the application of electric fields to protein solutions [17,33,34,35,36,37,38,39,40,41,42,43,44,45,46,47,48] has been actively performed. Almost all of this research used a DC electric field, and it was reported that the nucleation rate for protein crystals decreased. However, the enhancement of the nucleation process is desired for proteins because it is difficult to nucleate protein crystals. That is, satisfactory control of the nucleation rate for protein crystals was not previously achieved using an electric field.
On the other hand, we tried to control the nucleation process of proteins, focusing on the effect of an electric field from a thermodynamic perspective. As a result, we have succeeded in the control of both an increase and a decrease in the nucleation rate for tetragonal HEW lysozyme crystals, by applying an external electric field with different frequencies [49]. Additionally, we have demonstrated that this crystallization technique can also be adapted to the crystallization of porcine insulin [50]. This is attributed to the difference in the magnitude of the electrostatic energy added to the chemical potentials between the liquid and solid phases. Furthermore, analyzing the strength of an external electric field necessary to control such a change in the nucleation thermodynamically, we have revealed that it is estimated to be 10 4 V/cm, which is significantly larger than that used experimentally (800 V/cm) [51]. In our experimental arrangement, the large difference between the electrical permittivities of the solution and the oil plays an important role in the formation of a large electric potential gradient at the inner surface of a drop of the solution in oil [52,53,54]. This is known as the electric double layer (EDL).
Such an electrostatic energy is added not only to the chemical potentials, but also to the entropy of the liquid and solid phases [18]. In particular, it is thermodynamically analyzed that the entropy of the solid decreases under an applied electric field at 1 MHz, and therefore, a decrease of disorder in the crystal could be expected. Several groups have actively attempted the elucidation of the origins of disorder, i.e., imperfection in protein crystals [11,55,56,57,58,59,60,61,62,63,64,65,66], leading to the results that impurities and dislocations have an undesirable influence on the crystal quality of proteins. However, the origins of imperfections in protein crystals are not completely comprehended. From previous pioneering works, it has been suggested that one possibility may be fluctuations in the orientation of protein molecules or smaller perfect blocks in the crystal [55,60,61], which leads to broadening of the full width at half-maximum (FWHM) of the rocking curves, i.e., a decrease of crystal quality.
XRD rocking curve measurement is a powerful tool to appraise the crystal quality of grown crystals in a nondestructive way. Here, we report on an improvement in the crystal quality of tetragonal HEW lysozyme crystals by application of an external electric field at 1 MHz. Moreover, the origin of imperfections for tetragonal HEW lysozyme crystals is revealed by focus on the subgrain formation in the grown crystals. This article also demonstrates that improvement of the quality of crystals grown under a 1 MHz applied field is achieved by a decrease in the misorientation between subgrains in the crystals. Additionally, we discuss the improvement of the crystal quality under an applied field at 1 MHz in the light of the ordering of water molecules around lysozyme molecules.

2. Experimental Procedure

HEW lysozyme (Wako Pure Chemical Industries, Ltd., Osaka, Japan) was used as-received without further purification. Solutions of 114 mg/mL HEW lysozyme and 1.0 M NaCl were prepared using 100 mM sodium acetate buffer, which were passed through a filter with a pore size of 0.20 μ m to remove any foreign matter or large protein aggregates. Then, they were mixed in equal volumes. The resulting solutions containing 57 mg/mL HEW lysozyme, 0.5 M NaCl and 100 mM sodium acetate buffer at pH 4.3 were employed for the crystallization experiments. Crystallization experiments were performed at 21 ± 0.2 °C using the batch method. The effect of the external electric field on the unit cell parameters of the grown crystals was not observed using X-ray diffraction [18,20].
Figure 1 shows a schematic illustration of the crystallization system with electrodes on both sides of a plastic cell for application of the electrostatic field to the protein solution. The electrode surface dimension was 12 × 45 mm2. It is considered that a large electric potential difference generates at the interface between the plastic cell and the protein solution, leading to the formation of an EDL, as described in our previous works [51,53,54]. Thus, tetragonal HEW lysozyme crystals grown on the sides of electrodes were used to obtain XRD rocking-curve profiles. The distance between the electrodes was 12 mm, and the solution volume was 2.7 mL. An external electric field of 400 V/cm was applied at 1 MHz. Crystals were grown with and without application of the external electric field for nine days.
Room temperature XRD rocking-curve measurements were performed at the BL15B1 beamline at the Photon Factory (PF) of the High Energy Accelerator Research Organization (KEK). A two-crystal monochromator with Si(111) crystals was located 24 m from the source and was used to select an X-ray wavelength of λ = 1.2 Å. The horizontal source size σ x , and the source-to-instrument distance L , were 0.206 mm and 35 m, respectively. The Si(111) monochromator wavelength bandpath Δ λ / λ , was 1.3 × 10 4 . The instrumental resolution function (IRF) can be calculated to be 1.64 × 10 3 ° using the following equation [67]:
I R F 2 = ( 2.3 σ x / L ) 2 + ( Δ λ / λ ) 2 tan 2 Θ ,
where Θ is the Bragg angle of the monochromator. The crystal sample size for measurements was approximately 1.2 mm. A crystal in the plastic cell was carefully transferred to a quartz capillary, which is transparent to synchrotron radiation, and then the [001] crystallographic direction was pre-aligned using a microscope to be almost parallel to the incident beam. Samples were measured with a high-resolution step by mounting on a precision goniometer (minimum angular step width: 5.3 × 10 5 °). Under such a condition, the reflected images of entire crystals for the 110 family of reflections were detected using a high spatial resolution, two-dimensional digital CCD camera (Photonic Science X-RAY FDI 1.00:1, effective pixel: 6.45 × 6.45 μ m 2 , Robertsbridge, UK).
To assess the local crystal quality and the crystal homogeneity, XRD rocking-curve profiles for the 110 family of reflections were first reconstructed from the reflected intensities using each region of the crystals with a beam spot diameter of 387 μ m (60 pixels). Therefore, IRF, which takes into account the dimension of the sample C v , and the horizontal beam divergence w d (0.178 mrad), can be calculated to be 1.75 × 10 3 ° using the following equation [67]:
I R F 2 = I R F 2 + m i n [ w d 2 , ( C v / L ) 2 ] .
Figure 2 shows typical XRD rocking-curves of the 440 reflection for a tetragonal HEW lysozyme crystal prepared with an external electric field at 1 MHz, which were obtained by partitioning the entire crystal into nine or sixteen regions. Both single and multiple peaks were observed from each region of the crystal. In the case of multiple peaks, each peak was fitted using a Gaussian function, and the FWHM of the multiple peak was then estimated as a sum of the FWHMs for each single peak. In this experiment, seven crystals grown without an electric field and five crystals grown under an electric field at 1 MHz were analyzed.
To reveal the mechanism for improvement of the crystal quality under an applied field at 1 MHz, XRD rocking-curves for the 110 family of reflections were also reconstructed from the reflected intensities over a region corresponding to a beam spot diameter of 896.55 μ m (139 pixels). Based on the above procedure, the instrumental resolution function ( IRF ) [67], which takes into account the dimensions of the sample and the horizontal beam divergence (0.178 mrad), can be calculated to be 2.20 × 10 3 °. All of the XRD rocking-curves were observed to contain only single peaks. The FWHM of each rocking-curve profile measured for samples prepared with and without the external electric field was evaluated using a Gaussian function. In this study, two series of five tetragonal HEW lysozyme crystals, prepared with and without application of an external electric field, were investigated.
Monochromatic-beam X-ray topography was also conducted at room temperature using synchrotron radiation at the BL20B beamline at the PF. The X-ray wavelength and the distance between sample and X-ray film were 1.2 Å and 20 cm, respectively. Monochromatic-beam topographs were recorded on X-ray film (Agfa D2, Agfa, Mortsel, Belgium) with exposure times of approximately 3 min.
Additionally, the ordering of internal water molecules in tetragonal HEW lysozyme crystals was observed by using Raman spectroscopy. The Raman spectra of a tetragonal HEW lysozyme crystal in growth cells was measured at room temperature, by using a micro-Raman system (NRS-3100, JASCO, Tokyo, Japan) composed of an optical microscope, a notch filter, a single spectrometer and a CCD detector. The spectra excitation was provided with a semiconducting laser of a wavelength of 532 nm.

3. Results and Discussion

3.1. Improvement of Crystal Quality under an Applied Electric Field

Table 1 shows the average FWHM values measured for the 440 and 12 12 0 reflections from tetragonal HEW lysozyme crystals prepared with and without an external electric field, which were analyzed using a beam spot diameter of 387 μ m. We first focus on the average FWHMs obtained from crystals grown without an external electric field. Table 1 shows that the average FWHM for the 12 12 0 reflection was larger than that for the 440 reflection. This suggests that strain could be accumulated in tetragonal HEW lysozyme crystals grown without an external electric field. In contrast, for crystal growth with an external electric field at 1 MHz, only a slight increase in the average FWHMs from the 440 to the 12 12 0 reflections was observed (Table 1). The average FWHMs of the crystals grown with an external electric field were also smaller than those grown without, which indicates that the local crystal quality of tetragonal HEW lysozyme crystals was improved by application of the external electric field at 1 MHz. Moreover, not only was there a reduction of the average FWHMs, but a decrease in the standard deviations was also statistically observed for the 440 and 12 12 0 reflections of crystals grown with the external electric field at 1 MHz (Table 1). This indicates that the crystal homogeneity would also be improved under an applied electric field at 1 MHz.
The effect of the external electric field on the crystal homogeneity of all the tetragonal HEW lysozyme crystals was evaluated. Figure 3 shows representative two-dimensional maps of the FWHMs measured for the 440 and the 12 12 0 reflections from tetragonal HEW lysozyme crystals prepared with and without an external electric field.
Figure 3a shows that the two-dimensional map for the FWHMs of the 440 reflection for crystals prepared without an external electric field were gradually changed. In addition, the homogeneity of the crystals determined from the 12 12 0 reflection was inferior to that determined from the 440 reflection, as shown in Figure 3c. This result is consistent with that observed for the FWHMs (see Table 1) and is due to the sensitivity of the high-order reflections to strain in the crystals. Thus, the inferior homogeneity observed for the 12 12 0 reflection could reflect the fact that the crystals prepared without an external electric field have significant strain. Accordingly, the overall crystal quality for the crystals prepared without an external electric field was inhomogeneous.
In contrast, under an applied field at 1 MHz, the homogeneity of the FWHM values was improved for the 440 reflection compared with those without an external electric field, as shown in Figure 3a,b. This tendency was also the same for the 12 12 0 reflection, as shown in Figure 3c,d. In addition, the two-dimensional map for the 12 12 0 reflection maintained almost the same homogeneity as that for the 440 reflection under application of the external electric field at 1 MHz. This suggests that the strain in the crystal is significantly decreased by application of the external electric field at 1 MHz. Therefore, the data suggests that the crystal homogeneity of all the tetragonal HEW lysozyme crystals was improved by the application of an external electric field at 1 MHz.
Figure 4 shows the populations of single and multiple peaks obtained from the 12 12 0 reflections of tetragonal HEW lysozyme crystals prepared with and without an external electric field. The majority of peaks in the XRD rocking-curve profiles were multiple peaks when the electric field was not applied, as shown in Figure 4a. Such multiple peaks in XRD rocking-curve profiles have often been observed for protein crystals [6,11]. This can be attributed to crystal lattices that have slightly different orientations than the main part of the sample (mosaic blocks). Therefore, the imperfection in protein crystals could be responsible for many subgrains in the crystals. In contrast, the majority of peaks in the XRD rocking-curve profiles were single peaks when an external electric field at 1 MHz was applied, as shown in Figure 4b. This suggests that the orientation between mosaic blocks is improved by the effect of the external electric field.

3.2. Control of Subgrain Formation under an Applied Electric Field

Finally, let us consider the imperfection in protein crystals with a focus on subgrain formation in the crystal. The peaks in X-ray rocking curves may be broadened due to various factors. Assuming that the profiles are Gaussian in shape, and that the components due to lattice tilting, lattice strain and particle size have Gaussian distributions, each experimentally-derived FWHM β M , may be expressed as [68,69]:
β M 2 = β 0 2 + β i n s 2 + β α 2 + β ϵ 2 + β L 2 + β r 2 ,
where β 0 is the intrinsic FWHM of the rocking curve for a perfect crystal, β i n s is the broadening contribution due to IRF, and β α , β ϵ , β L , and β r represent the line broadening due to lattice tilting, local strain, particle size, and uniform lattice bending, respectively. For the symmetrical Laue case, the intrinsic FWHM of the rocking curve of a perfect crystal β 0 , is expressed as [70,71,72]:
β 0 = 2 r e s i n 2 θ λ 2 | F h k l | π V c ,
where θ is the Bragg angle, r e is the classical electron radius (2.82 × 10 5 Å), λ is the wavelength of X-ray radiation, | F h k l | is the structure factor, and V c is the volume of the unit cell. The remaining parameters, β α , β ϵ , β L and β r , may be expressed as [68,69]:
β α 2 = 2 π l n 2 | θ - φ | 2 = K α ,
β ϵ 2 = 8 l n 2 < ϵ > 2 tan 2 θ = K ϵ tan 2 θ ,
β L 2 = 4 l n 2 π L 2 λ 2 sin 2 2 θ = K L λ 2 sin 2 2 θ ,
β r 2 = w 2 r 2 sin 2 θ = K r sin 2 θ ,
where | θ - φ | is the misorientation between subgrains, < ϵ > is the local strain, L is the size of subgrains, w is the width of the X-ray beam in the diffraction plane, and r is the radius of curvature of the specimen. Substituting Equations (4)–(8) into Equation (3), the sum of the broadening contributions β a d j , is expressed as:
β a d j 2 = β M 2 - β 0 2 - β i n s 2 = K α + K ϵ tan 2 θ + K L λ 2 sin 2 2 θ + K r sin 2 θ ,
where β a d j 2 is the FWHM adjusted to account for the intrinsic FWHM. For example, if the local strain and the particle size both make significant contributions to the increase in the FWHM, then the two contributions can be separated by measuring the FWHM for three or more rocking curves at different Bragg angles θ. Consequently, a straight line, which represents the well-known Williamson–Hall plot, with an intercept K L and a slope K ϵ , is obtained, which provides the local strain and the particle size in the crystal. Therefore, the dominant broadening contribution can be identified by focusing on the two broadening contributions. Here, we separate the experimentally determined FWHM for protein crystals into the effects of local strain < ϵ > , and the misorientation between subgrains | θ - φ | , as follows:
β a d j 2 K α + K ϵ t a n 2 θ .
The detailed discussion is provided in reference [18].
Figure 5 shows the relationship between β a d j 2 and tan 2 θ for tetragonal HEW lysozyme crystals prepared with and without an external electric field. We first focus on subgrain formation in the crystals grown without an external electric field. Based on the straight line fit to the data, the intercept K α , and the slope K ϵ , were calculated to be 1.25 × 10 8 rad 2 and 1.05 × 10 7 rad 2 , respectively. According to Equations (5) and (6), the misorientation between subgrains | θ - φ | , and the local strain < ϵ > , were estimated to be 0.0031° and 137 μ ϵ , respectively. From these data, the individual broadening contributions of β α and β ϵ were calculated using Equations (5) and (6), whereby that of β α (= 0.0064°) was larger than that of β ϵ (= 0.0024° for the 12 12 0 reflection). This indicates that imperfections in the protein crystals are primarily the result of misorientation between subgrains.
On the other hand, for the tetragonal HEW lysozyme crystals prepared with an external electric field at 1 MHz, the misorientation between subgrains | θ - φ | , and the local strain < ϵ > , were estimated to be 0.0019° and 107 μ ϵ , respectively. These results suggest that both the misorientation between subgrains and the local strain were reduced by application of an external electric field at 1 MHz. In addition, the broadening contribution of β α (= 0.0039°) was also larger than that of β ϵ (= 0.0019° for the 12 12 0 reflection). Thus, the improvement of the crystal quality under a 1 MHz applied field is achieved by a decrease in the misorientation between subgrains in the crystal.
Next, let us consider the origin of the misorientation between subgrains in protein crystals. Such misorientation can generally be attributed to dislocations in the crystals, and therefore a decrease in the dislocation density is expected under application of an external electric field at 1 MHz. X-ray topography is one of the most powerful tools to observe dislocations in the crystals. Thus, large tetragonal HEW lysozyme crystals were grown by using cross-linked seed crystals in order to detect clear dislocation contrasts, although the cross-linked seed crystals were not used in XRD rocking curve measurements. Figure 6 shows synchrotron monochromatic-beam X-ray topographs of tetragonal HEW lysozyme crystals prepared with and without an external electric field, taken using the 0 4 ¯ 0 reflection with the incident beam almost parallel to the [001] crystallographic direction of crystals grown from cross-linked seed crystals. Clear straight dislocations were observed to extend from the interface with the seed crystals to the outer surface of the larger grown crystals. This is similar to that observed for glucose isomerase crystals grown from the cross-linked seed crystals [73]. However, the generation of dislocations occurred during the middle of growth for tetragonal HEW lysozyme crystals prepared without an external electric field (see Figure 6a), whereas no dislocations were generated for tetragonal HEW lysozyme crystals prepared with an external electric field at 1 MHz (see Figure 6b). This indicates that the dislocation density in tetragonal HEW lysozyme crystals was decreased under an applied field at 1 MHz.
The dislocation density D , can be estimated from the misorientation between subgrains as follows [69]:
D = K α / 4.36 b 2 ,
where b is the magnitude of the Burgers vector. For tetragonal HEW lysozyme crystals grown without an external electric field, dislocations with a <110> Burgers vector (111.8 Å) have been observed, which represents a screw character [74]. Therefore, the dislocation density in tetragonal HEW lysozyme crystals grown without an external electric field can be estimated from Equation (11) to be approximately 2 × 10 3 cm - 2 . However, the actual dislocation density observed using X-ray topography is ∼ 10 2 cm - 2 for tetragonal HEW lysozyme crystals [74], which is smaller than that estimated by one order of magnitude. This discrepancy is quite large, although the dislocation density that can be accurately determined using the XRD rocking-curve technique ranges from 10 5 to 10 9 cm - 2 . These results suggest that the origin of the misorientation between subgrains in protein crystals cannot be explained solely by the presence of dislocations in the crystals.
Lysozyme solutions are known to include lysozyme dimers that act as impurities and are incorporated into the steps on the surface during crystal growth [75,76]. It is also considered that these incorporated impurities could cause the generation of dislocations in crystals. The misorientation between subgrains was estimated to be 0.0031° for the crystals grown without an external electric field, which leads to a gap between subgrains of 10.8−32.5 nm because the size of the subgrains was determined to be 200−600 μ m in previous work [20]. The dimensions of lysozyme molecules are 4.5 × 3.0 × 3.0 nm 3 ; therefore, the size of the dimers would be approximately 3–9 nm, which is almost the same as the calculated gap between two subgrains. The coincidence between these two values suggests that the misorientation between subgrains could be attributed to the incorporation of lysozyme dimers between adjacent subgrains, as shown in Figure 7.
It was also determined that the misorientation between subgrains is reduced in the case of tetragonal HEW lysozyme crystals prepared with an external electric field at 1 MHz. Using Equation (11), the dislocation density in crystals grown with the external electric field at 1 MHz can be estimated to be approximately 8 × 10 2 cm - 2 , based on the misorientation between subgrains (0.0019°). However, there were no dislocations generated during the middle of growth for tetragonal HEW lysozyme crystals prepared with an external electric field. This suggests that the decrease in the misorientation between subgrains under a 1 MHz applied field could be predominantly caused by incorporated impurities. A pioneering work has been performed by focusing on the repartitioning of the precipitant ions, which concludes that the incorporation of the precipitants is coupled to protein impurities [77]. Moreover, it is also indicated that the incorporation of the precipitant ions decreases with increasing the driving force (supersaturation) [77]. We have previously observed the increase in the nucleation rate under a 1 MHz applied field, which means an increment of the driving force [21,49]. This suggests that the incorporation of the precipitant ions decrease by applying an external electric field at 1 MHz. Thus, the external electric field could prevent the lysozyme dimers (impurities) from being incorporated into the steps on the surface during crystal growth, which leads to a decrease in the misorientation between subgrains, as shown in Figure 7. However, this model (Figure 7) is not by direct observation, but analytical results from XRD rocking curve measurements. Thus, in situ observations of the crystal growth of tetragonal HEW lysozyme crystals both with and without the application of an external electric field are now underway in our laboratory.
Additionally, let us discuss the reduction in the misorientation between subgrains and the local strain under an applied field at 1 MHz from the perspective of thermodynamics. We have thermodynamically analyzed that the entropy of the solid decreases by applying an external field at 1 MHz [18], and we consider that the change in the entropy corresponds to the ordering of internal water molecules in protein crystals. The intermolecular bonding in protein crystals can be assessed by using Raman spectroscopy, which is composed of symmetric stretch vibrations of C–H and O–H groups in the range from 2600 to 4000 cm - 1 . In particular, it is identified that the spectra line around 3300 cm - 1 in symmetric stretch vibrations of O–H group is related to the ordering of internal water molecules in protein crystals [78]. Table 2 shows FWHMs of the spectra line around 3300 cm - 1 obtained from tetragonal HEW lysozyme crystals with and without an external electric field at 1 MHz. As shown in Table 2, the FWHM value slightly decreased when applying an external electric field at 1 MHz. This indicates the ordering of internal water molecules in protein crystals. In the case of tetragonal HEW lysozyme crystals, it has been revealed that eight or nine water molecules are trapped on the surface of each lysozyme molecule when they are incorporated into the crystals grown [79]. Therefore, the ordering of internal water molecules could be an important factor to grow high-quality tetragonal HEW lysozyme crystals, and this might prevent the precipitant ions from being incorporated into the grown crystals.

Acknowledgments

This work was supported in part by Grants-in-Aid for Challenging Exploratory Research (Nos. 25650017 and 15K14484) from the Ministry of Education, Culture, Sports, Science and Technology of Japan. X-ray diffraction rocking-curve measurements were performed at the Photon Factory (PF) under the auspices of the Photon Factory Program Advisory Committee of KEK (Proposal Nos. 2011G073, 2012G504, 2014G601, 2015G142).

Author Contributions

The study was designed by Haruhiko Koizumi; The experimental results were discussed by all authors.

Conflicts of Interest

The authors declare no conflicts of interests.

References

  1. Sato, T.; Yamada, Y.; Saijo, S.; Hori, T.; Hirose, R.; Tanaka, N.; Sazaki, G.; Nakajima, K.; Igarashi, N.; Tanaka, M.; et al. Enhancement in the perfection of orthorhombic lysozyme crystals grown in a high magnetic field (10 T). Acta Crystallogr. 2000, D56, 1079–1083. [Google Scholar] [CrossRef]
  2. Lin, S.; Zhou, M.; Azzi, A.; Xu, G.; Wakayama, N.; Ataka, M. Magnet used for protein crystallization: Novel attempts to improve the crystal quality. Biochem. Biophys. Res. Commun. 2000, 275, 274–278. [Google Scholar] [CrossRef] [PubMed]
  3. Ataka, M.; Wakayama, N. Effects of a magnetic field and magnetization force on protein crystal growth. Why does a magnet improve the quality of some crystals? Acta Crystallogr. 2002, D58, 1708–1710. [Google Scholar] [CrossRef]
  4. Wakayama, N. Effects of a strong magnetic field on protein crystal growth. Cryst. Growth Des. 2003, 3, 17–24. [Google Scholar] [CrossRef]
  5. Kinoshita, T.; Ataka, M.; Warizaya, M.; Neya, M.; Fujii, T. Improving quality and harvest period of protein crystals for structure-based drug design: Effects of a gel and a magnetic field on bovine adenosine deaminase crystals. Acta Crystallogr. 2003, D59, 1333–1335. [Google Scholar] [CrossRef]
  6. Lübbert, D.; Meents, A.; Weckert, E. Accurate rocking-curve measurements on protein crystals grown in a homogeneous magnetic field of 2.4 T. Acta Crystallogr. 2004, D60, 987–998. [Google Scholar]
  7. Moreno, A.; Quiroz-García, B.; Yokaichiya, F.; Stojanoff, V.; Rudolph, P. Protein crystal growth in gels and stationary magnetic fields. Cryst. Res. Technol. 2007, 42, 231–236. [Google Scholar] [CrossRef]
  8. Heijna, M.; Poodt, P.; Tsukamoto, K.; de Grip, W.; Christianen, P.; Maan, J.; Hendrix, J.; van Enckevort, W.; Vlieg, E. Magnetically controlled gravity for protein crystal growth. Appl. Phys. Lett. 2007, 90, 264105. [Google Scholar] [CrossRef] [Green Version]
  9. DeLucas, L.; Smith, C.; Smith, H.; Vijay-Kumar, S.; Senadhi, S.; Ealick, S.; Carter, D.; Snyder, R.; Weber, P.; Salemme, F. Protein crystal growth in microgravity. Science 1989, 246, 651–654. [Google Scholar] [CrossRef] [PubMed]
  10. McPherson, A. Virus and protein crystal growth on earth and in microgravity. J. Phys. D 1993, 26, B104–B112. [Google Scholar] [CrossRef]
  11. Snell, E.; Weisgerber, S.; Helliwell, J.; Weckert, E.; Holzer, K.; Schroer, K. Improvements in lysozyme protein crystal perfection through microgravity growth. Acta Crystallogr. 1995, D51, 1099–1102. [Google Scholar] [CrossRef] [PubMed]
  12. Sato, M.; Tanaka, H.; Inaka, K.; Shinozaki, S.; Yamanaka, A.; Takahashi, S.; Yamanaka, M.; Hirota, E.; Sugiyama, S.; Kato, M.; et al. JAXA-GCF project-high-quality protein crystals grown under microgravity environment for better understanding of protein structure. Microgravity Sci. Technol. 2006, 18, 184–189. [Google Scholar] [CrossRef]
  13. Takahashi, S.; Tsurumura, T.; Aritake, K.; Furubayashi, N.; Sato, M.; Yamanaka, M.; Hirota, E.; Sano, S.; Kobayashi, T.; Tanaka, T.; et al. High-quality crystals of human haematopoietic prostaglandin D synthase with novel inhibitors. Acta Crystallogr. 2010, F66, 846–850. [Google Scholar] [CrossRef] [PubMed]
  14. Inaka, K.; Takahashi, S.; Aritake, K.; Tsurumura, T.; Furubayashi, N.; Yan, B.; Hirota, E.; Sano, S.; Sato, M.; Kobayashi, T.; et al. High-quality protein crystal growth of mouse lipocalin-type prostaglandin D synthase in microgravity. Cryst. Growth Des. 2011, 11, 2107–2111. [Google Scholar] [CrossRef] [PubMed]
  15. Yoshikawa, S.; Kukimoto-Niino, M.; Parker, L.; Handa, N.; Terada, T.; Fujimoto, T.; Terazawa, Y.; Wakiyama, M.; Sato, M.; Sano, S.; et al. Structural basis for the altered drug sensitivities of non-small cell lung cancer-associated mutants of human epidermal growth factor receptor. Oncogene 2012, 32, 27–38. [Google Scholar] [CrossRef] [PubMed]
  16. Adawy, A.; Rebuffet, E.; Törnroth-Horsefield, S.; de Grip, W.J.; van Enckevort, W.J.; Vlieg, E. High resolution protein crystals using an efficient convection-free geometry. Cryst. Growth Des. 2013, 13, 775–781. [Google Scholar] [CrossRef]
  17. Taleb, M.; Didierjean, C.; Jelsch, C.; Mangeot, J.; Capelle, B.; Aubry, A. Crystallization of proteins under an external electric field. J. Cryst. Growth 1999, 200, 575–582. [Google Scholar] [CrossRef]
  18. Koizumi, H.; Uda, S.; Fujiwara, K.; Tachibana, M.; Kojima, K.; Nozawa, J. Improvement of Crystal Quality for Tetragonal Hen-Egg White Lysozyme Crystals under Application of an External AC Electric Field. J. Appl. Crystallogr. 2013, 46, 25–29. [Google Scholar] [CrossRef]
  19. Koizumi, H.; Uda, S.; Fujiwara, K.; Tachibana, M.; Kojima, K.; Nozawa, J. Enhancement of crystal homogeneity of protein crystals under application of an external alternating current electric field. AIP Conf. Proc. 2014, 1618, 265–268. [Google Scholar]
  20. Koizumi, H.; Uda, S.; Fujiwara, K.; Tachibana, M.; Kojima, K.; Nozawa, J. Control of Subgrain Formation in Protein Crystals by the Application of an External Electric Field. Cryst. Growth Des. 2014, 14, 5662–5667. [Google Scholar] [CrossRef]
  21. Koizumi, H.; Uda, S.; Fujiwara, K.; Tachibana, M.; Kojima, K.; Nozawa, J. Crystallization of high-quality protein crystals using an external electric field. J. Appl. Crystallogr. 2015, 48, 1507–1513. [Google Scholar] [CrossRef]
  22. Vekilov, P.G.; Thomas, B.R.; Rosenberger, F. Effects of convective solute and impurity transport in protein crystal growth. J. Phys. Chem. B 1998, 102, 5208–5216. [Google Scholar] [CrossRef]
  23. Kadowaki, A.; Yoshizaki, I.; Adachi, S.; Komatsu, H.; Odawara, O.; Yoda, S. Effects of forced solution flow on protein-crystal quality and growth process. Cryst. Growth Des. 2006, 6, 2398–2403. [Google Scholar] [CrossRef]
  24. Otálora, F.; Gavira, J.A.; Ng, J.D.; García-Ruiz, J.M. Counterdiffusion methods applied to protein crystallization. Prog. Biophys. Mol. Biol. 2009, 101, 26–37. [Google Scholar] [CrossRef] [PubMed]
  25. Maruyama, M.; Kawahara, H.; Sazaki, G.; Maki, S.; Takahashi, Y.; Yoshikawa, H.Y.; Sugiyama, S.; Adachi, H.; Takano, K.; Matsumura, H.; et al. Effects of a forced solution flow on the step advancement on {110} faces of tetragonal lysozyme crystals: Direct visualization of individual steps under a forced solution flow. Cryst. Growth Des. 2012, 12, 2856–2863. [Google Scholar] [CrossRef]
  26. Garcia-Ruiz, J.; Moreno, A. Investigations on protein crystal growth by the gel acupuncture method. Acta Crystallogr. 1994, D50, 484–490. [Google Scholar] [CrossRef] [PubMed]
  27. Vidal, O.; Robert, M.; Arnoux, B.; Capelle, B. Crystalline quality of lysozyme crystals grown in agarose and silica gels studied by X-ray diffraction techniques. J. Cryst. Growth 1999, 196, 559–571. [Google Scholar] [CrossRef]
  28. Lorber, B.; Sauter, C.; Ng, J.; Zhu, D.; Giegé, R.; Vidal, O.; Robert, M.; Capelle, B. Characterization of protein and virus crystals by quasi-planar wave X-ray topography: A comparison between crystals grown in solution and in agarose gel. J. Cryst. Growth 1999, 204, 357–368. [Google Scholar] [CrossRef]
  29. Dong, J.; Boggon, T.J.; Chayen, N.E.; Raftery, J.; Bi, R.C.; Helliwell, J.R. Bound-solvent structures for microgravity-, ground control-, gel-and microbatch-grown hen egg-white lysozyme crystals at 1.8 A resolution. Acta Crystallogr. 1999, D55, 745–752. [Google Scholar] [CrossRef]
  30. Garcıa-Ruiz, J.; Novella, M.; Moreno, R.; Gavira, J. Agarose as crystallization media for proteins: I: Transport processes. J. Cryst. Growth 2001, 232, 165–172. [Google Scholar] [CrossRef]
  31. Gavira, J.A.; García-Ruiz, J.M. Agarose as crystallisation media for proteins II: Trapping of gel fibres into the crystals. Acta Crystallogr. 2002, D58, 1653–1656. [Google Scholar] [CrossRef]
  32. Sugiyama, S.; Maruyama, M.; Sazaki, G.; Hirose, M.; Adachi, H.; Takano, K.; Murakami, S.; Inoue, T.; Mori, Y.; Matsumura, H. Growth of protein crystals in hydrogels prevents osmotic shock. JACS 2012, 134, 5786–5789. [Google Scholar] [CrossRef] [PubMed]
  33. Taleb, M.; Didierjean, C.; Jelsch, C.; Mangeot, J.; Aubry, A. Equilibrium kinetics of lysozyme crystallization under an external electric field. J. Cryst. Growth 2001, 232, 250–255. [Google Scholar] [CrossRef]
  34. Nanev, C.; Penkova, A. Nucleation of lysozyme crystals under external electric and ultrasonic fields. J. Cryst. Growth 2001, 232, 285–293. [Google Scholar] [CrossRef]
  35. Charron, C.; Didierjean, C.; Mangeot, J.; Aubry, A. TheOctopus’ plate for protein crystallization under an electric field. J. Appl. Crystallogr. 2003, 36, 1482–1483. [Google Scholar] [CrossRef]
  36. Mirkin, N.; Frontana-Uribe, B.; Rodríguez-Romero, A.; Hernández-Santoyo, A.; Moreno, A. The influence of an internal electric field upon protein crystallization using the gel-acupuncture method. Acta Crystallogr. 2003, D59, 1533–1538. [Google Scholar] [CrossRef]
  37. Moreno, A.; Sazaki, G. The use of a new ad hoc growth cell with parallel electrodes for the nucleation control of lysozyme. J. Cryst. Growth 2004, 264, 438–444. [Google Scholar] [CrossRef]
  38. Penkova, A.; Gliko, O.; Dimitrov, I.; Hodjaoglu, F.; Nanev, C.; Vekilov, P. Enhancement and suppression of protein crystal nucleation due to electrically driven convection. J. Cryst. Growth 2005, 275, e1527–e1532. [Google Scholar] [CrossRef]
  39. Penkova, A.; Pan, W.; Hodjaoglu, F.; Vekilov, P. Nucleation of protein crystals under the influence of solution shear flow. Ann. N. Y. Acad. Sci. 2006, 1077, 214–231. [Google Scholar] [CrossRef] [PubMed]
  40. Al-Haq, M.; Lebrasseur, E.; Choi, W.; Tsuchiya, H.; Torii, T.; Yamazaki, H.; Shinohara, E. An apparatus for electric-field-induced protein crystallization. J. Appl. Crystallogr. 2007, 40, 199–201. [Google Scholar] [CrossRef]
  41. Al-Haq, M.; Lebrasseur, E.; Tsuchiya, H.; Torii, T. Protein crystallization under an electric field. Crystallogr. Rev. 2007, 13, 29–64. [Google Scholar] [CrossRef]
  42. Hammadi, Z.; Astier, J.; Morin, R.; Veesler, S. Protein Crystallization Induced by a Localized Voltage. Cryst. Growth Des. 2007, 7, 1472–1475. [Google Scholar] [CrossRef]
  43. Pérez, Y.; Eid, D.; Acosta, F.; Marín-García, L.; Jakoncic, J.; Stojanoff, V.; Frontana-Uribe, B.; Moreno, A. Electrochemically Assisted Protein Crystallization of Commercial Cytochrome c without Previous Purification. Cryst. Growth Des. 2008, 8, 2493–2496. [Google Scholar]
  44. Mirkin, N.; Jaconcic, J.; Stojanoff, V.; Moreno, A. High resolution X-ray crystallographic structure of bovine heart cytochrome c and its application to the design of an electron transfer biosensor. Proteins Struct. Funct. Bioinform. 2008, 70, 83–92. [Google Scholar] [CrossRef] [PubMed]
  45. Hou, D.; Chang, H. ac field enhanced protein crystallization. Appl. Phys. Lett. 2008, 92, 223902. [Google Scholar] [CrossRef]
  46. Revalor, E.; Hammadi, Z.; Astier, J.; Grossier, R.; Garcia, E.; Hoff, C.; Furuta, K.; Okustu, T.; Morin, R.; Veesler, S. Usual and unusual crystallization from solution. J. Cryst. Growth 2010, 312, 939–946. [Google Scholar] [CrossRef]
  47. Wakamatsu, T. Transparent Cell for Protein Crystallization under Low Applied Voltage. Jpn. J. Appl. Phys. 2011, 50, 048003. [Google Scholar] [CrossRef]
  48. Wakamatsu, T.; Toyoshima, S.; Shimizu, H. Observation of electric-field induced aggregation in crystallizing protein solutions by forward light scattering. Appl. Phys. Lett. 2011, 99, 153701. [Google Scholar] [CrossRef]
  49. Koizumi, H.; Fujiwara, K.; Uda, S. Control of Nucleation Rate for Tetragonal Hen-Egg White Lysozyme Crystals by Application of an Electric Field with Variable Frequencies. Cryst. Growth Des. 2009, 9, 2420–2424. [Google Scholar] [CrossRef]
  50. Koizumi, H.; Tomita, Y.; Uda, S.; Fujiwara, K.; Nozawa, J. Nucleation Rate Enhancement of Porcine Insulin by Application of an External AC Electric Field. J. Cryst. Growth 2012, 352, 155–157. [Google Scholar] [CrossRef]
  51. Koizumi, H.; Fujiwara, K.; Uda, S. Role of the Electric Double Layer in Controlling the Nucleation Rate for Tetragonal Hen Egg White Lysozyme Crystals by Application of an External Electric Field. Cryst. Growth Des. 2010, 10, 2591–2595. [Google Scholar] [CrossRef]
  52. Uda, S.; Koh, S.; Huang, X. The electric field-induced transformation of the melting state of langasite from incongruent into congruent. J. Cryst. Growth 2006, 292, 1–4. [Google Scholar] [CrossRef]
  53. Koizumi, H.; Uda, S.; Fujiwara, K.; Nozawa, J. Effect of various precipitants on the nucleation rate of tetragonal hen egg-white lysozyme crystals in an AC external electric field. J. Cryst. Growth 2010, 312, 3503–3508. [Google Scholar] [CrossRef]
  54. Koizumi, H.; Uda, S.; Fujiwara, K.; Nozawa, J. Control of Effect on the Nucleation Rate for Hen Egg White Lysozyme Crystals under Application of an External ac Electric Field. Langmuir 2011, 27, 8333–8338. [Google Scholar] [PubMed]
  55. Dobrianov, I.; Finkelstein, K.; Lemay, S.; Thorne, R. X-ray topographic studies of protein crystal perfection and growth. Acta Crystallogr. 1998, D54, 922–937. [Google Scholar] [CrossRef]
  56. Izumi, K.; Taguchi, K.; Kobayashi, Y.; Tachibana, M.; Kojima, K.; Ataka, M. Screw dislocation lines in lysozyme crystals observed by Laue topography using synchrotron radiation. J. Cryst. Growth 1999, 206, 155–158. [Google Scholar] [CrossRef]
  57. Fourme, R.; Ducruix, A.; Riès-Kautt, M.; Capelle, B. Probing the quality of crystals of biological macromolecules using maximum resolution of diffraction data, Bragg reflection profiles and X-ray topographs. J. Cryst. Growth 1999, 196, 535–545. [Google Scholar] [CrossRef]
  58. Otálora, F.; García-Ruiz, J.M.; Antonio Gavira, J.; Capelle, B. Topography and high resolution diffraction studies in tetragonal lysozyme. J. Cryst. Growth 1999, 196, 546–558. [Google Scholar] [CrossRef]
  59. Caylor, C.; Dobrianov, I.; Lemay, S.; Kimmer, C.; Kriminski, S.; Finkelstein, K.; Zipfel, W.; Webb, W.; Thomas, B.; Chernov, A.; et al. Macromolecular impurities and disorder in protein crystals. Proteins Struct. Funct. Bioinform. 1999, 36, 270–281. [Google Scholar] [CrossRef]
  60. Boggon, T.; Helliwell, J.; Judge, R.; Olczak, A.; Siddons, D.; Snell, E.; Stojanoff, V. Synchrotron X-ray reciprocal-space mapping, topography and diffraction resolution studies of macromolecular crystal quality. Acta Crystallogr. 2000, D56, 868–880. [Google Scholar] [CrossRef]
  61. Capelle, B.; Epelboin, Y.; Hartwig, J.; Moraleda, A.; Otálora, F.; Stojanoff, V. Characterization of dislocations in protein crystals by means of synchrotron double-crystal topography. J. Appl. Crystallogr. 2004, 37, 67–71. [Google Scholar] [CrossRef]
  62. Hu, Z.; Chu, Y.; Lai, B.; Thomas, B.; Chernov, A. Diffraction and imaging study of imperfections of crystallized lysozyme with coherent X-rays. Acta Crystallogr. 2004, D60, 621–629. [Google Scholar] [CrossRef] [PubMed]
  63. Yoshizaki, I.; Fukuyama, S.; Koizumi, H.; Tachibana, M.; Kojima, K.; Matsuura, Y.; Tanaka, M.; Igarashi, N.; Kadowaki, A.; Rong, L.; et al. Impurity-induced defect and its effect on protein crystal perfection. J. Cryst. Growth 2006, 290, 185–191. [Google Scholar] [CrossRef]
  64. Koishi, M.; Ohya, N.; Mukobayashi, Y.; Koizumi, H.; Kojima, K.; Tachibana, M. Observation of Clear Images of Dislocations in Protein Crystals by Synchrotron Monochromatic-Beam X-ray Topography. Cryst. Growth Des. 2007, 7, 2182–2186. [Google Scholar] [CrossRef]
  65. Mukobayashi, Y.; Kitajima, N.; Yamamoto, Y.; Kajiwara, K.; Sugiyama, H.; Hirano, K.; Kojima, K.; Tachibana, M. Observation of dislocations in hen egg-white lysozyme crystals by synchrotron monochromatic-beam X-ray topography. Phys. Status Solidi A 2009, 206, 1825–1828. [Google Scholar] [CrossRef]
  66. Sawaura, T.; Fujii, D.; Shen, M.; Yamamoto, Y.; Wako, K.; Kojima, K.; Tachibana, M. Characterization of dislocations in monoclinic hen egg-white lysozyme crystals by synchrotron monochromatic-beam X-ray topography. J Cryst. Growth 2011, 318, 1071–1074. [Google Scholar] [CrossRef]
  67. Colapietro, M.; Cappuccio, G.; Marciante, C.; Pifferi, A.; Spagna, R.; Helliwell, J. The X-ray diffraction station at the ADONE wiggler facility: Preliminary results (including crystal perfection). J. Appl. Crystallogr. 1992, 25, 192–194. [Google Scholar] [CrossRef]
  68. Hordon, M.; Averbach, B. X-ray measurements of dislocation density in deformed copper and aluminum single crystals. Acta Metall. 1961, 9, 237–246. [Google Scholar] [CrossRef]
  69. Ayers, J. The measurement of threading dislocation densities in semiconductor crystals by X-ray diffraction. J. Cryst. Growth 1994, 135, 71–77. [Google Scholar] [CrossRef]
  70. Klapper, H. Crystals; Freyhardt, H.C., Ed.; Springer-Verlag: Berlin, Germany, 1991; Volume 13. [Google Scholar]
  71. Bowen, D.; Tanner, B. High Resolution X-Ray Diffraction and Topography; Teylor & Francis: London, UK, 1998; Chapter 8; p. 172. [Google Scholar]
  72. Authier, A. Dynamical Theory of X-Ray Diffraction; Springer: Berlin, Germany, 2001. [Google Scholar]
  73. Koizumi, H.; Tachibana, M.; Yoshizaki, I.; Fukuyama, S.; Tsukamoto, K.; Suzuki, Y.; Uda, S.; Kojima, K. Dislocations in High-Quality Glucose Isomerase Crystals Grown from Seed Crystals. Cryst. Growth Des. 2014, 14, 5111–5116. [Google Scholar] [CrossRef]
  74. Tachibana, M.; Koizumi, H.; Izumi, K.; Kajiwara, K.; Kojima, K. Identification of dislocations in large tetragonal hen egg-white lysozyme crystals by synchrotron white-beam topography. J. Synchrotron Radiat. 2003, 10, 416–420. [Google Scholar] [CrossRef] [PubMed]
  75. Matsuzuki, Y.; Kubota, T.; Liu, X.; Ataka, M.; Takano, K. AFM observation of the surface morphology and impurity effects on orthorhombic hen egg-white lysozyme crystals. J. Cryst. Growth 2002, 242, 199–208. [Google Scholar] [CrossRef]
  76. Yoshizaki, I.; Kadowaki, A.; Iimura, Y.; Igarashi, N.; Yoda, S.; Komatsu, H. Impurity effects on lysozyme crystal growth. J. Synchrotron Radiat. 2003, 11, 30–33. [Google Scholar] [CrossRef] [PubMed]
  77. Vekilov, P.G.; Monaco, L.A.; Thomas, B.R.; Stojanoff, V.; Rosenberger, F. Repartitioning of NaCl and protein impurities in lysozyme crystallization. Acta Crystallogr. 1996, D52, 785–798. [Google Scholar] [CrossRef]
  78. Kudryavtsev, A.; Christopher, G.; Smith, C.; Mirov, S.; Rosenblum, W.; DeLucas, L. The effect of ordering of internal water in thaumatin and lysozyme crystals as revealed by Raman method. J. Cryst. Growth 2000, 219, 102–114. [Google Scholar] [CrossRef]
  79. Vekilov, P.G.; Feeling-Taylor, A.; Yau, S.T.; Petsev, D. Solvent entropy contribution to the free energy of protein crystallization. Acta Crystallogr. 2002, D58, 1611–1616. [Google Scholar] [CrossRef]
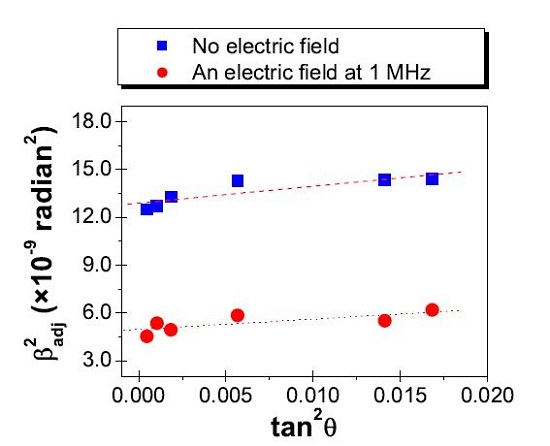
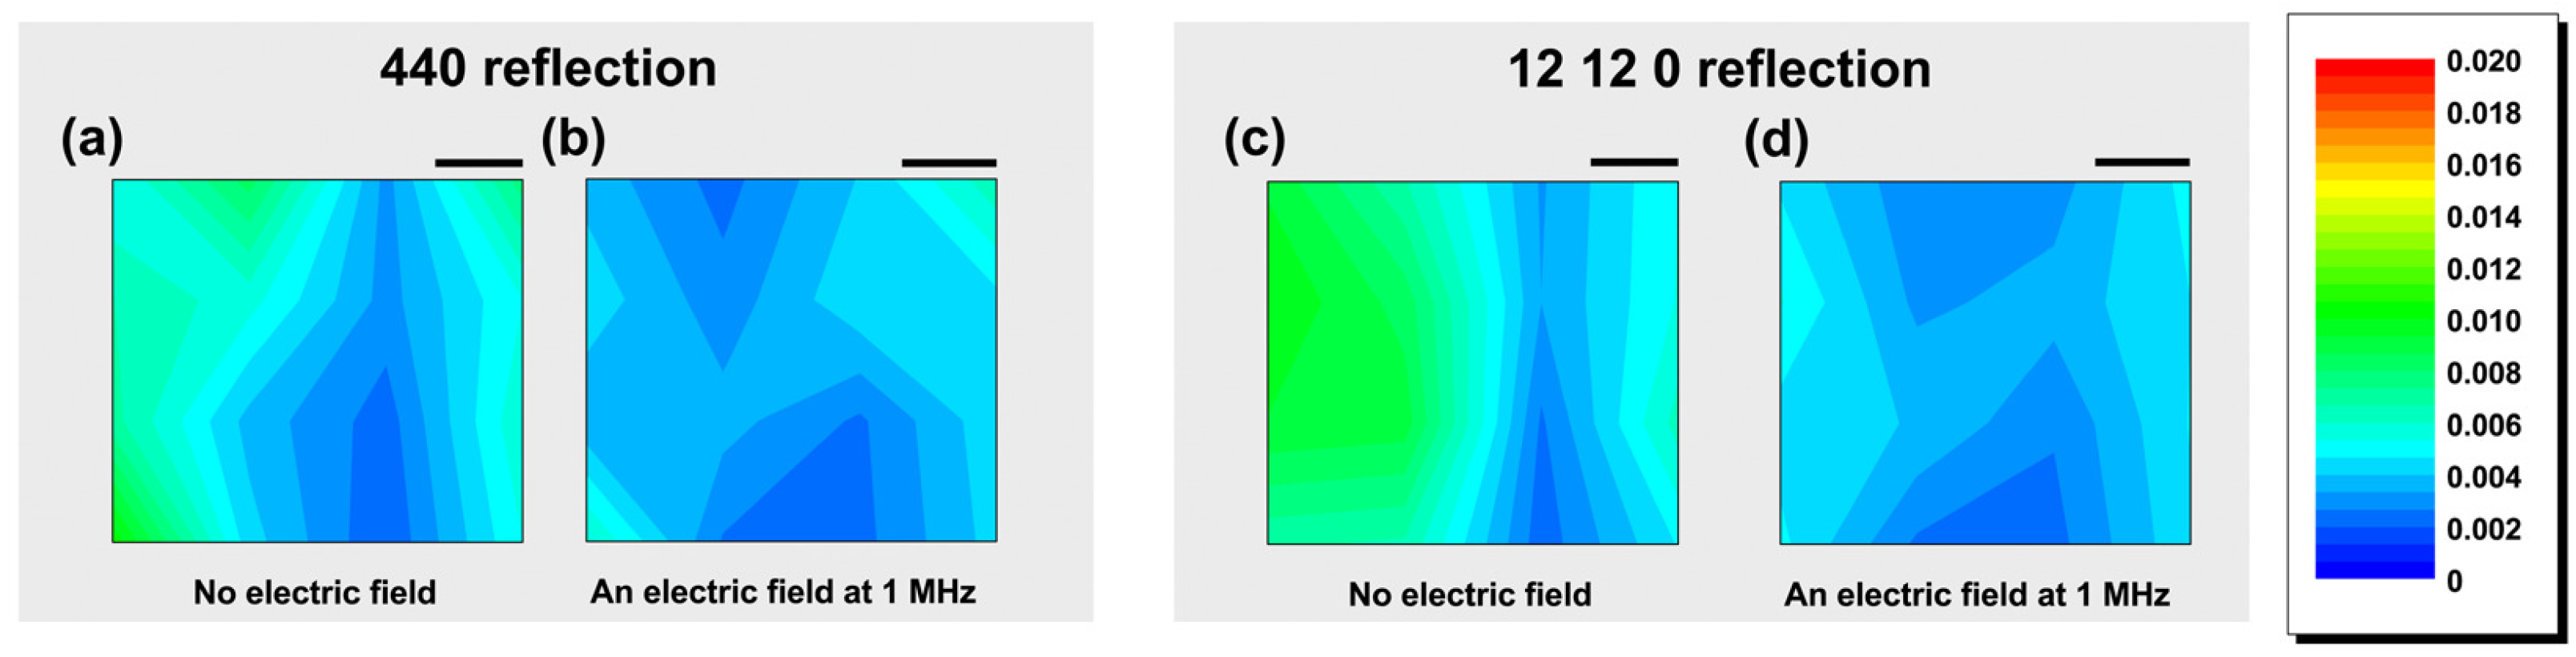
Figure 1. Schematic illustration of the batch arrangement with electrodes on both sides of a plastic cell. Reproduced from reference [18], with permission of the International Union of Crystallography.
Crystals 06 00095 g001
Figure 2. Typical XRD rocking-curve for a tetragonal HEW lysozyme crystal grown under application of an external electric field at 1 MHz. These XRD rocking-curves were obtained for the 440 reflection. Profiles were acquired using a beam spot diameter of 387 μ m (60 pixels). Reproduced from reference [19], with the permission of AIP Publishing.
Crystals 06 00095 g002
Figure 3. Representative two-dimensional maps of FWHMs measured for the 440 and 12 12 0 reflections from tetragonal HEW lysozyme crystals prepared (a,c) with and (b,d) without an external electric field at 1 MHz. The upper-right scale bar for each two-dimensional map represents 0.3 mm. Reproduced from reference [19], with the permission of AIP Publishing.
Crystals 06 00095 g003
Figure 4. Populations of single and multiple peaks obtained from the 12 12 0 reflection (a) without application of an external electric field and (b) with an applied field at 1 MHz. Reproduced from reference [19], with the permission of AIP Publishing.
Crystals 06 00095 g004
Figure 5. Relationship between β a d j 2 and tan 2 θ for tetragonal HEW lysozyme crystals prepared with and without an external electric field at 1 MHz. The FWHMs were analyzed using a beam spot diameter of 896.55 μ m (139 pixels).
Crystals 06 00095 g005
Figure 6. Synchrotron monochromatic-beam X-ray topographs of tetragonal HEW lysozyme crystals prepared (a) without and (b) with an applied field at 1 MHz taken using the 0 4 ¯ 0 reflection with the incident beam almost parallel to the [001] crystallographic direction.
Crystals 06 00095 g006
Figure 7. Model demonstrating the origin of misorientation between sub-grains in protein crystals and the effect of an external electric field on the misorientation. Reprinted with permission from reference [20]. Copyright 2014 American Chemical Society.
Crystals 06 00095 g007
Table 1. Comparison of the average FWHMs measured for the 440 and 12 12 0 reflections from tetragonal HEW lysozyme crystals prepared with and without an external electric field. Standard deviations are given in parentheses. The average FWHMs are the deconvoluted values from the measured FWHMs. The number of FWHMs analyzed for crystals grown with and without an electric field at 1 MHz were 80 and 112, respectively.
ReflectionAverage FWHMs (Standard Deviation)
No Electric FieldApplied Field at 1 MHz
440 reflection0.0054° (27)0.0032° (18)
12 12 0 reflection0.0060° (29)0.0034° (19)
Table 2. Change in FWHMs of the band related to the ordering of internal water molecules in protein crystals.
ConditionFWHM ( cm - 1 )Entropy Change
No electric field407.3 ± 3.9
Applied field at 1 MHz394.8 ± 3.2Decrease

