3. Magnetically Soft Nanocrystalline Glass-Coated Microwires
As mentioned in the introduction, the GMI effect is one of the most promising properties of soft magnetic materials [
14,
15,
16,
17].
The origin of the GMI effect is satisfactory explained in terms of classical electrodynamics considering the dependence of the circumferential magnetic permeability upon the
dc magnetic field and the skin effect of a magnetically soft conductor. The largest GMI ratio (up to 600%) is reported for nearly-zero magnetostrictive Co-rich amorphous glass-coated microwires [
17,
51,
52].
In spite of elevated cost, Co-rich amorphous microwires are quite appropriate materials for applications in magnetic sensors and magnetometers since only a small amount of magnetic wires is needed for these applications. Less expensive Fe-rich microwires are preferable for the applications in which large amount of the samples is needed (i.e., tunable metamaterials or metacomposites). But amorphous Fe-rich materials exhibit a rather high magnetostriction coefficient and consequently present quite low GMI effect [
17]. Nevertheless, recently, a few reports related to the optimization of magnetic properties and GMI effect after nanocrystallization of Fe-rich microwires are well documented [
45,
46,
47].
As is explained in the introduction, the excellent soft magnetic properties observed in devitrified FeSiBNbCu alloys are usually attributed to the vanishing magnetocrystalline anisotropy, as well as to the nearly-zero magnetostriction value of the devitrified materials.
On the other hand, so-called HITPERM alloys (Fe-Co based) nanocrystalline materials with improved magnetic softness have been introduced at the end of 90s [
20,
53,
54]. In our first attempt for the HITPERM-type microwires preparation we substituted Zr (not suitable for being prepared using the Taylor–Ulitovsky technique) by
Hf [
55]. More recently we studied Fe
38.5Co
38.5B
18Mo
4Cu
1 microwires presenting positive magnetostriction and therefore rectangular hysteresis loop [
49].
Consequently, the nanocrystallization of amorphous microwires can be one useful tool for optimization of their magnetic properties. Therefore, we studied the influence of nanocrystallization on magnetic properties and GMI effect in two different alloy systems.
Composition and geometries of the studied microwires presenting nanocrystalline structure are collected in
Table 2.
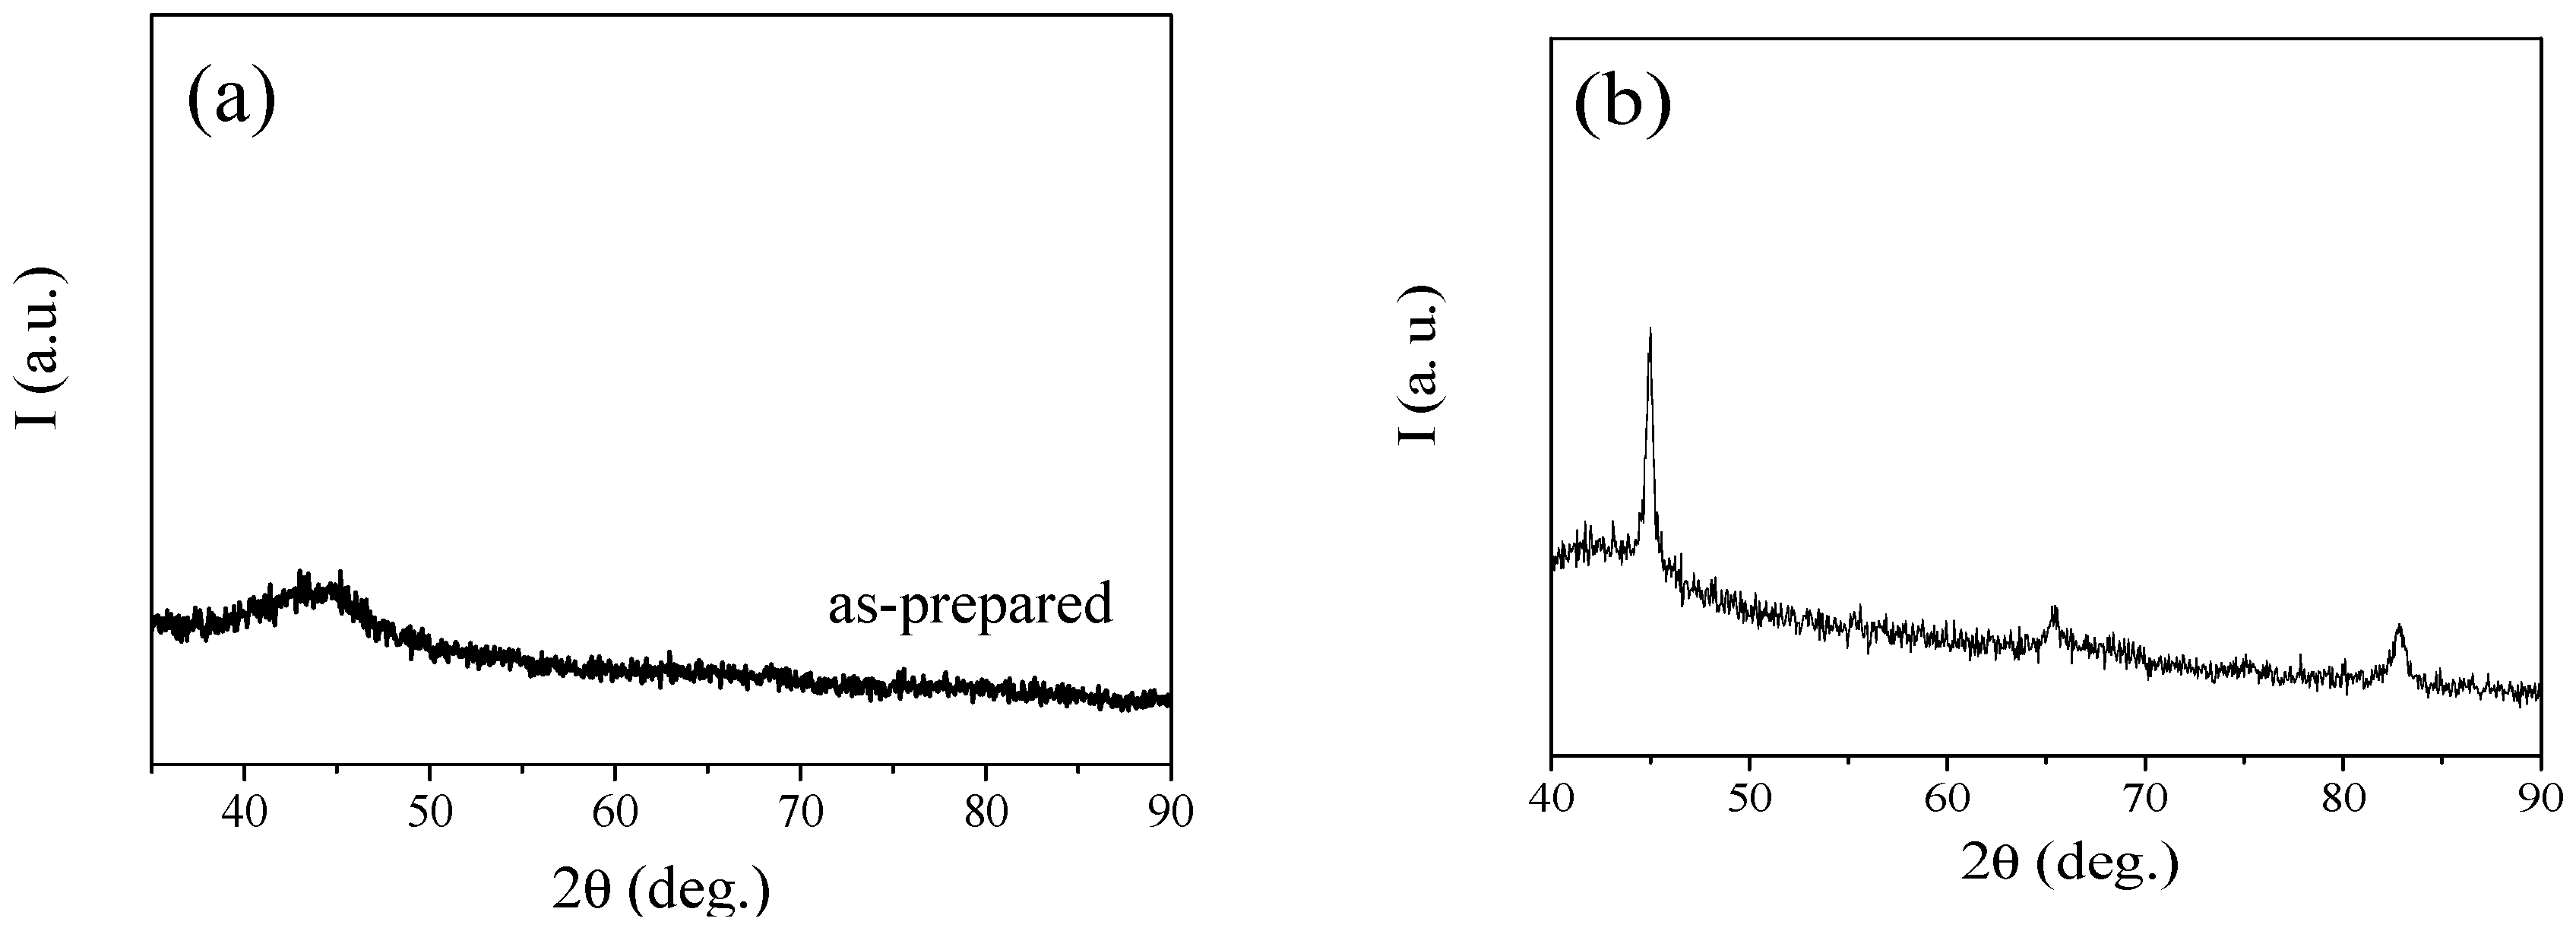
Most of the as-prepared Finemet-type microwires here studied present an amorphous structure (see
Figure 2a the XRD patterns of one of the as-prepared Fe
70.8Cu
1Nb
3.1Si
14.5B
10.6). In contrast, a nanocrystalline structure has been achieved in the as-prepared Hitperm-type microwires (
Figure 2b).
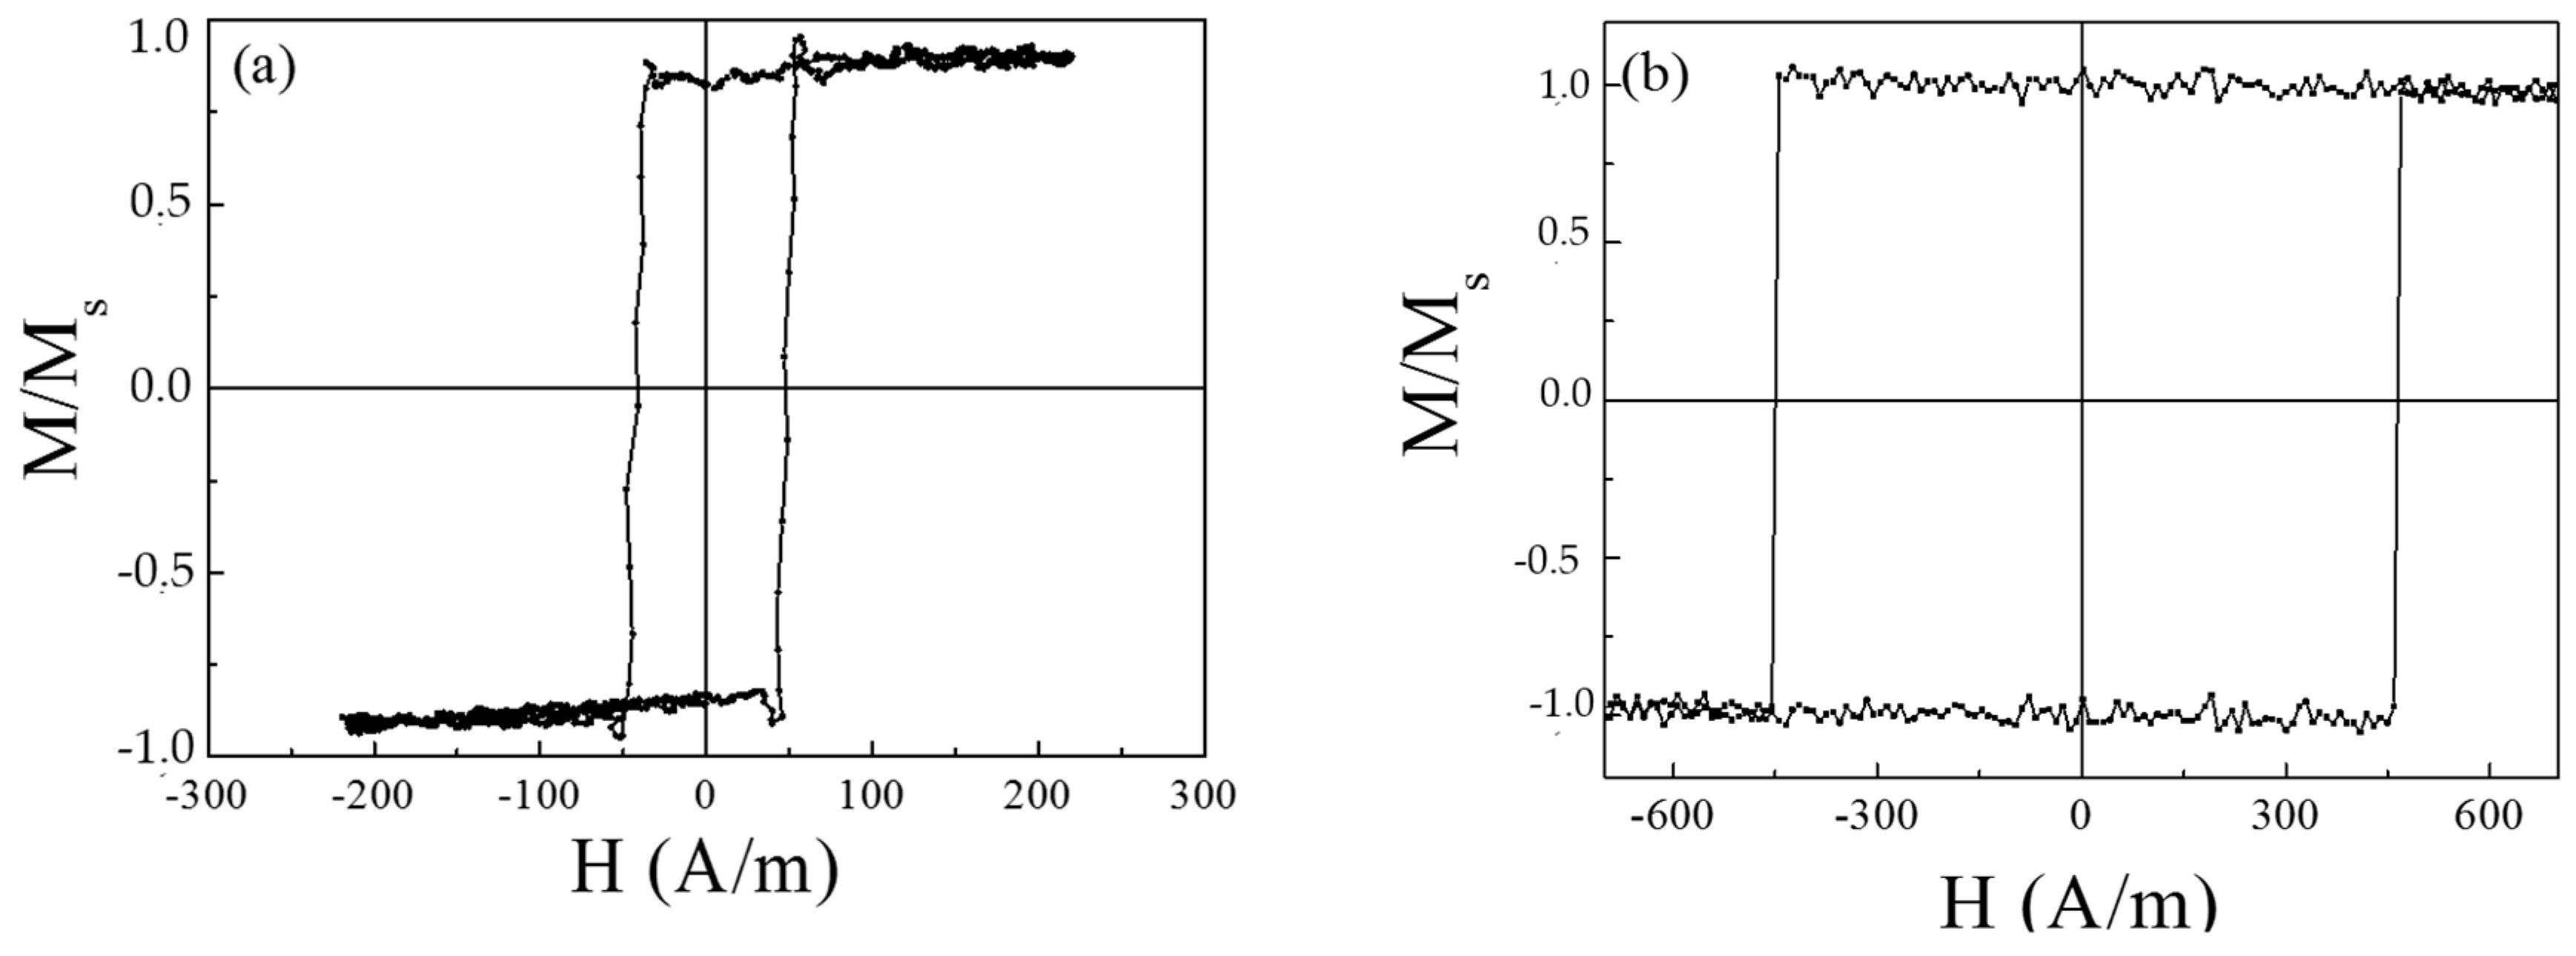
Hysteresis loops of all as-prepared microwires present a rectangular shape typical for Fe-rich amorphous microwires (see
Figure 3).
Higher coercivity values have been observed in as-prepared Hitperm-type microwires, as–compared to Finemet-type microwires (see
Figure 3a,b). Here we have compared microwires with similar
ρ-ratio, i.e., with similar internal stresses values.
Considering rather different magnetic properties and structure of these two families of magnetic microwires we overviewed their properties separately.
3.1. Optimization of the GMI Effect through the Nanocrystallization of Finemet-Type Fe-Rich Microwires
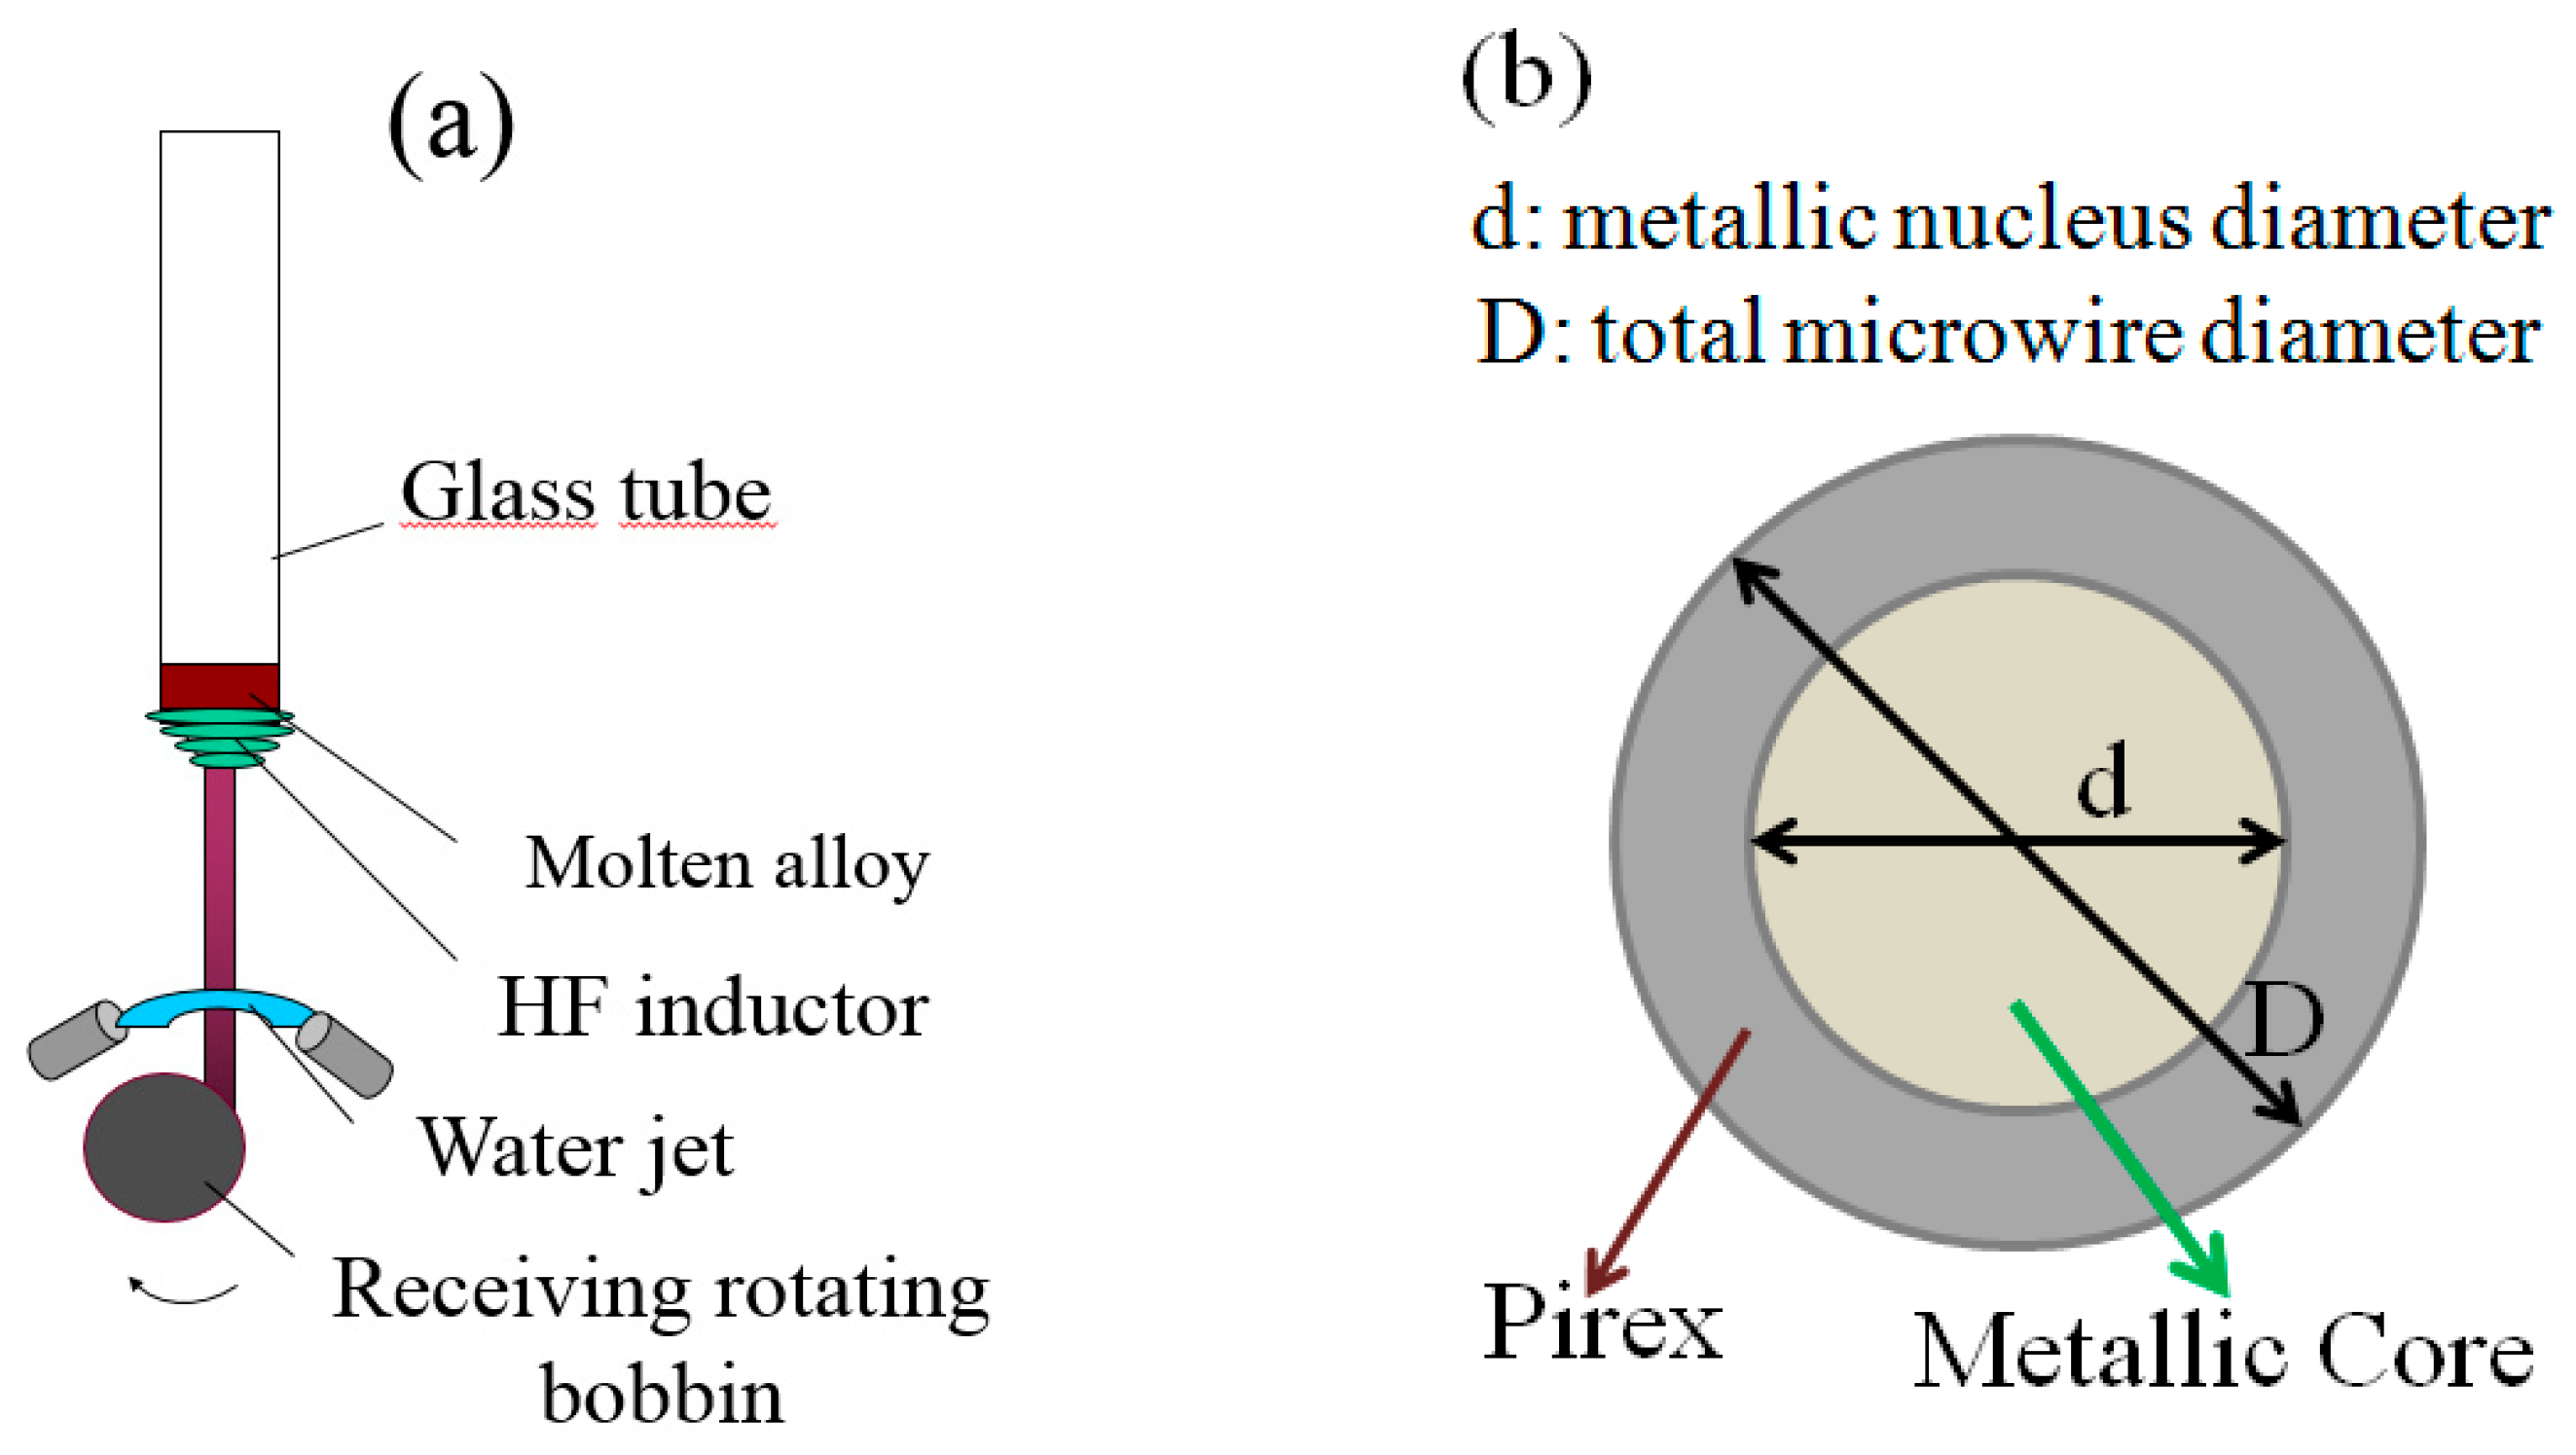
The difference in thermal expansion coefficients of metallic nucleus and glass coating, together with the rapid solidification from metallic nucleus surface given rise to a specific internal stresses distribution [
9,
40,
50]. Internal stresses strength is related to the mentioned difference depending on the geometric ratio,
ρ, between metallic nucleus diameter, d, and total diameter, D [
9,
40,
50]. Through the magnetostriction coefficient, internal stresses determine the magnetoelastic anisotropy,
Kme, given by
where
λs is the magnetostriction coefficient and
σi is the internal stress. It should be remarked that the magnetostriction value depends mostly on the alloy chemical composition.
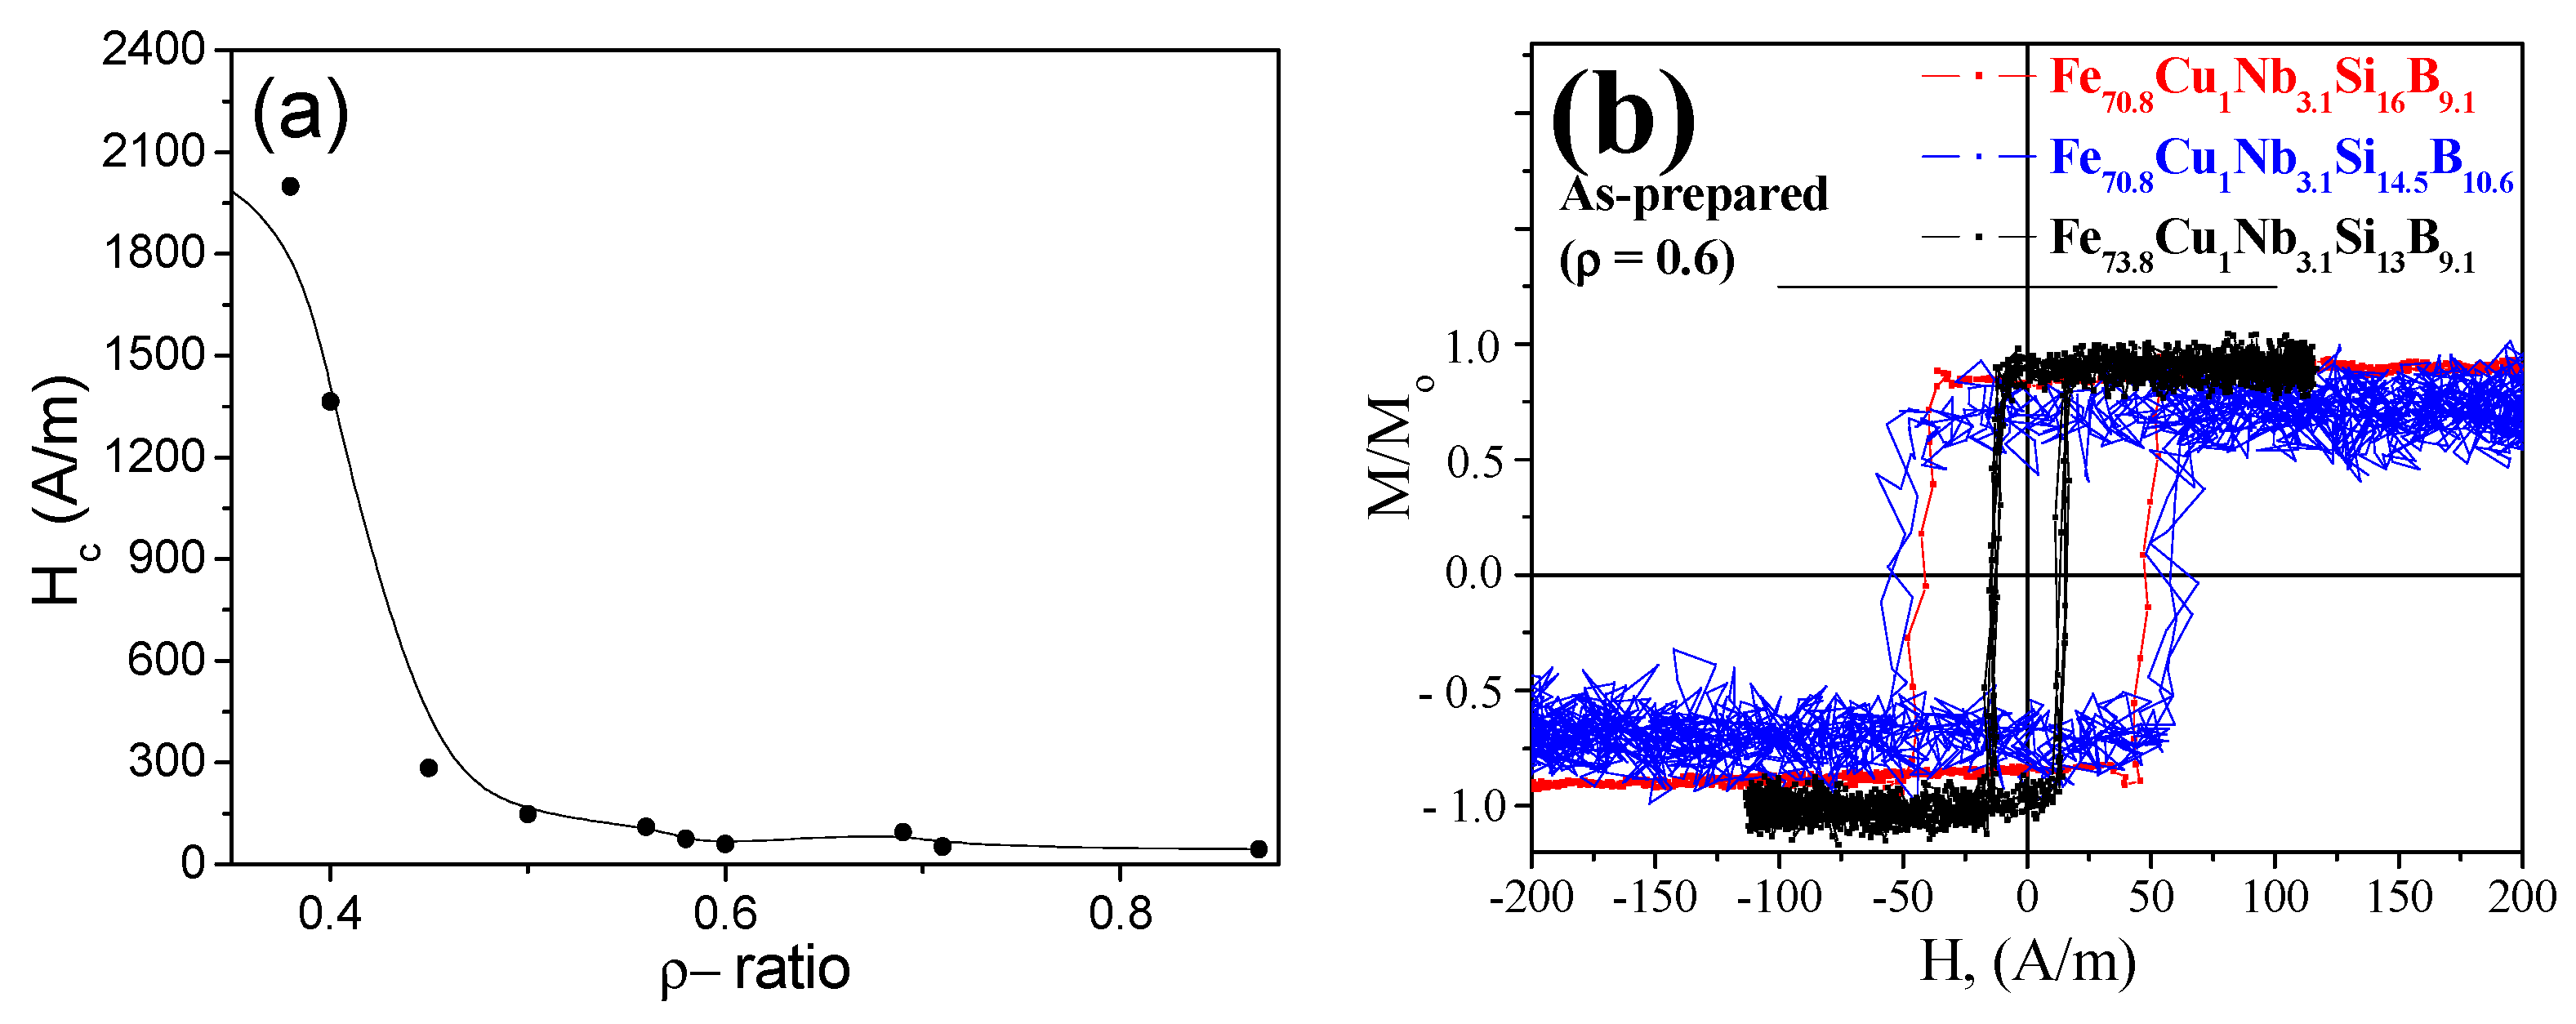
The magnetoelastic anisotropy gives rise to different values of coercive fields as it is evidenced from the dependence of coercivity and hysteresis loops on
ρ-ratio represented in
Figure 4a,b.
Figure 4a supports the fact that the higher internal stresses strength (ascribed to the low geometric ratio), causes the higher the magnetoelastic anisotropy,
Kme. Thus for instance, the coercivity strongly increases from 50
A/m for
ρ = 0.7 up to 1900
A/m for
ρ = 0.4.
Several factors affect the soft magnetic behavior of amorphous materials. In the absence of defects (dislocations, grain boundaries…) in this kind of materials there are at least other five contributions to the total coercivity identified and discussed by Kronmüller [
56]:
- (1).
Intrinsic fluctuations of exchange energies and local anisotropies, Hc(i).
- (2).
Clusters and chemical short ordered regions, Hc(SO).
- (3).
Surface irregularities, Hc(surf).
- (4).
Relaxation effects due to local structural rearrangements, Hc(rel).
- (5).
Volume pinning of domain walls in magnetostrictive alloys, Hc(σ).
From the analysis of each term [
56] it can be concluded that the magnetostriction is a key factor affecting the amorphous materials coercivity. For glass-coated microwires the contribution coming from the magnetoelastic anisotropy is still more relevant than in conventional amorphous materials [
9,
50].
All studied Finemet-type samples display rectangular hysteresis loops (
Figure 4b) typical for all Fe-based amorphous glass-coated microwires. For comparison, we present here three samples with the same
ρ-ratio = 0.6, but different chemical composition. Surprisingly, a rather lower coercive field of about 12
A/m is obtained for Fe
73.8Cu
1Nb
3.1Si
13B
9.1, while Fe
70.8Cu
1Nb
3.1Si
16B
9.1 and Fe
70.8Cu
1Nb
3.1Si
14.5B
10.6 samples present a higher coercivity (about 50
A/m). Structural investigation of all studied Finemet microwires has been performed in order to elucidate this difference in coercivity values.
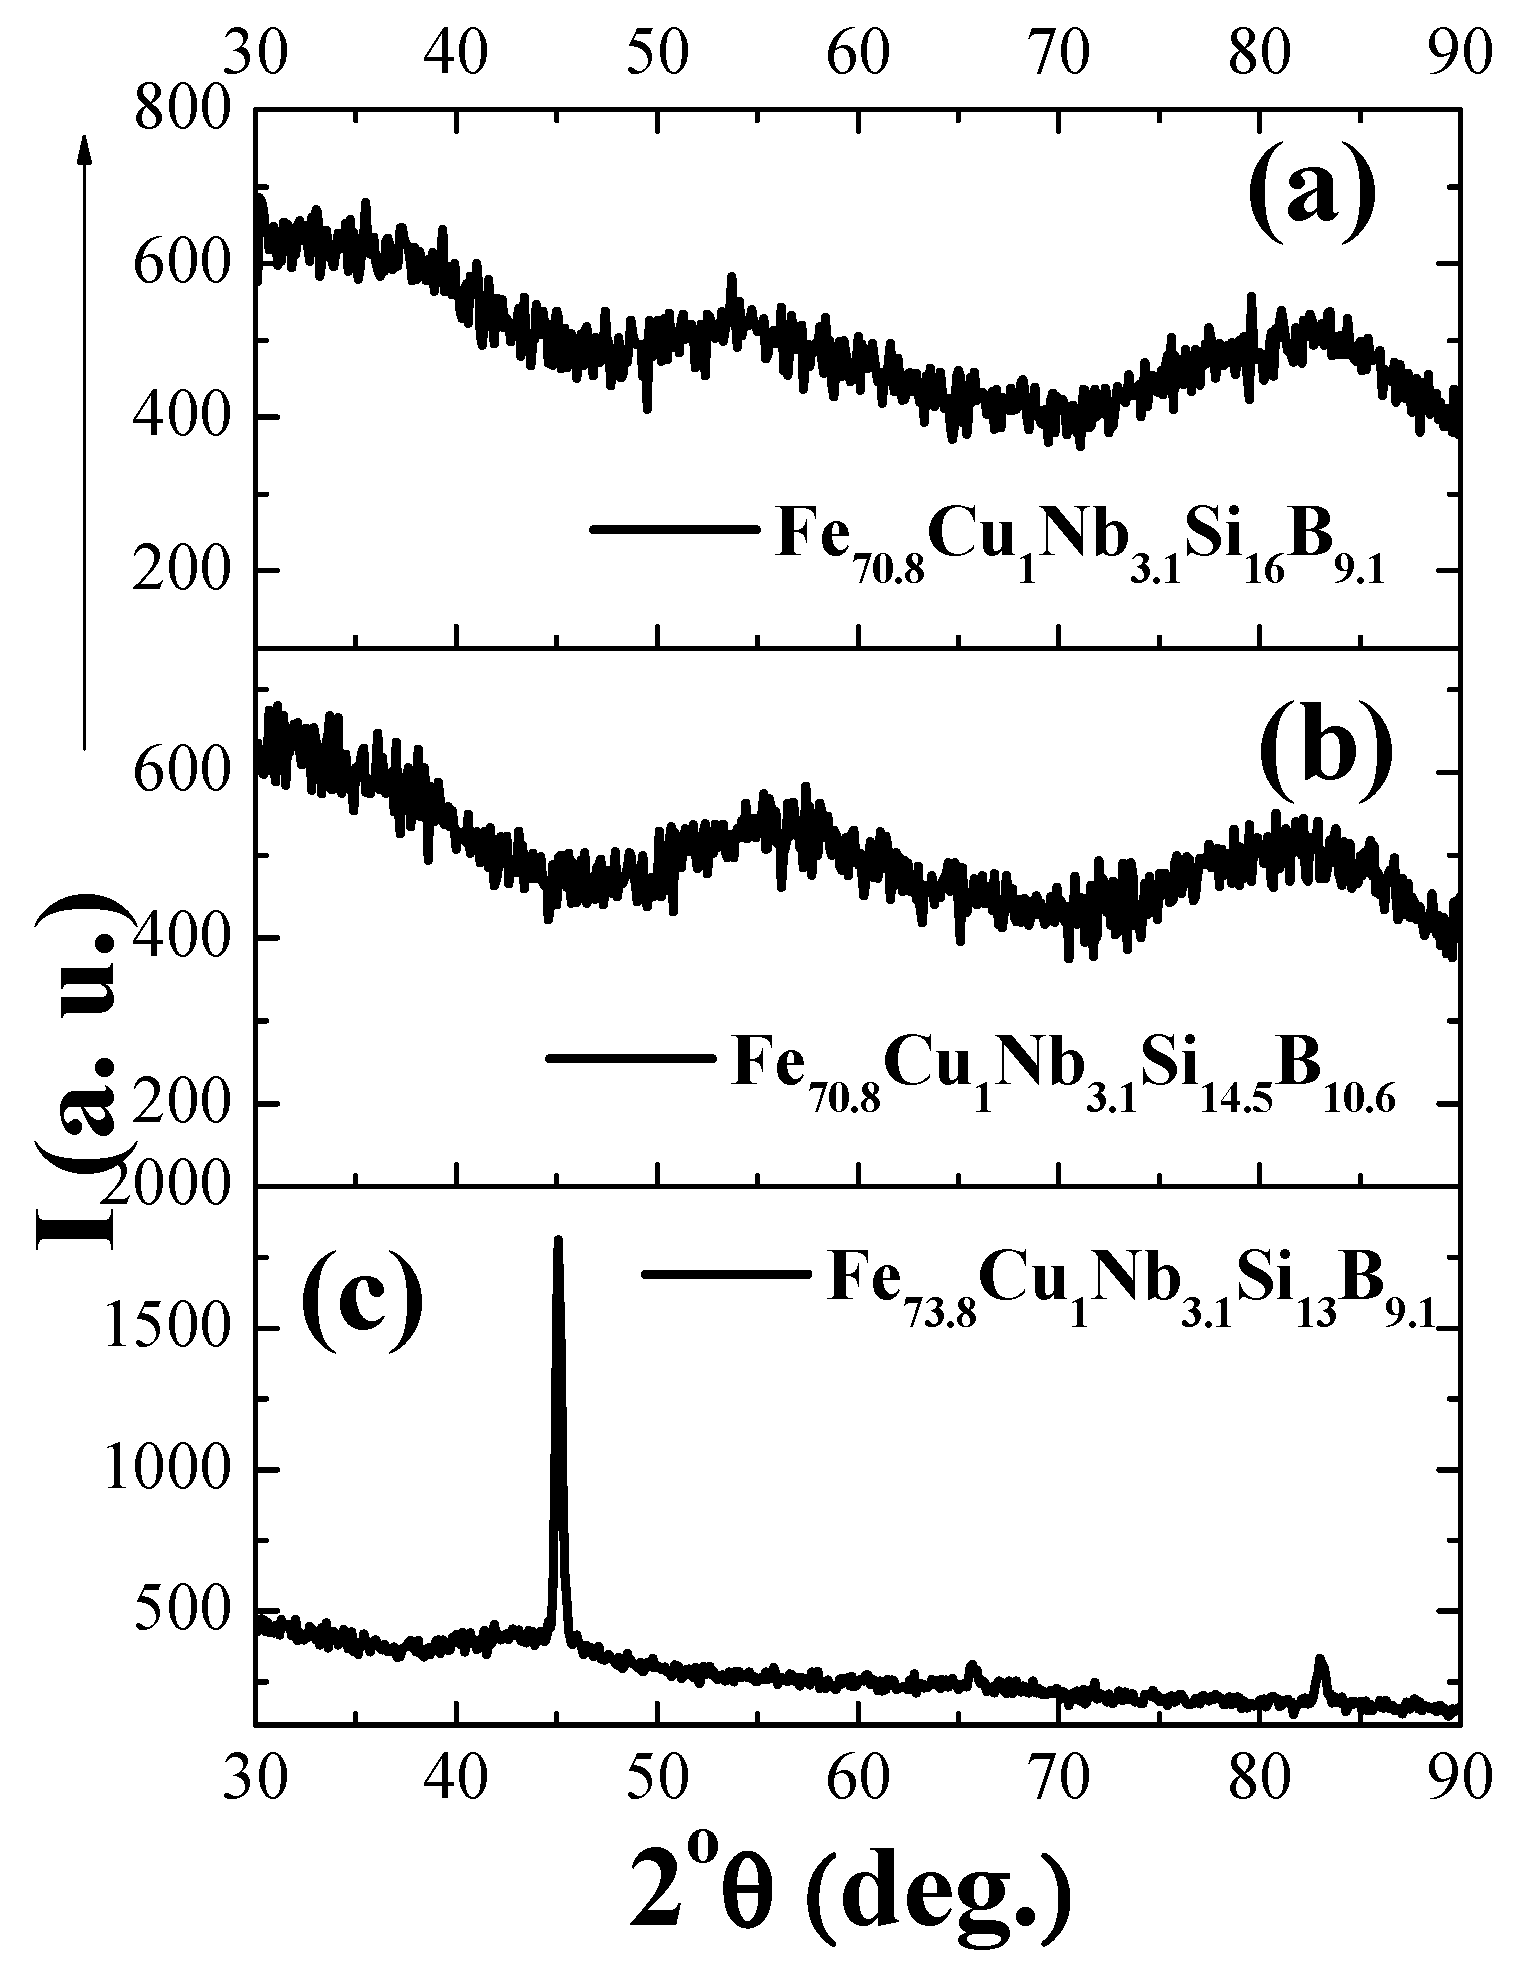
XRD patterns of the three as-prepared aforementioned Finemet glass-coated microwires are shown in
Figure 5. Fe
70.8Cu
1Nb
3.1Si
16B
9.1 and Fe
70.8Cu
1Nb
3.1Si
14.5B
10.6 present wide diffuse amorphous halos typical for the amorphous structure (
Figure 5a,b). Nevertheless, for Fe
73.8Cu
1Nb
3.1Si
13B
9.1 a main crystalline peak appears at a diffraction angle of about 2Ө ≈ 45° corresponding to BCC α-Fe-Si crystallites [
57]. Analyzing this peak features (maximum position and width), the crystalline grain size diameter,
Dg, can be easily estimated beyond the well-established Debye-Scherrer formula [
58]:
where
K is a dimensionless shape factor close to unity.
ε, is the half height width of the crystalline peak, and
2θ is the angular position of maximum crystalline peak.
This evaluation gives us an average grain size,
Dg ≈ 16 nm. Therefore, we must assume that Fe
73.8Cu
1Nb
3.1Si
13B
9.1 microwire displays a lower coercivity (
Figure 4b) because the nanocrystallization in this as-prepared sample is directly achieved (without a previous annealing).
As it has been reported [
49,
59], crystalline phases embedded in an amorphous metallic matrix (nanocrystalline materials) can be obtained in two different ways: either by controlling the crystallization kinetics through optimization of heat treatment conditions (annealing temperature and time, heating and cooling rate, etc.), or by decreasing the quenching rate velocity during the casting process. In particular, the decrease in the critical quenching rate leads to the crystal nucleation [
59]. The quenching rate can be affected by the thermal conductivity as well as by the chemical composition of metallic nucleus, d, for a given glass-coating thickness [
60].
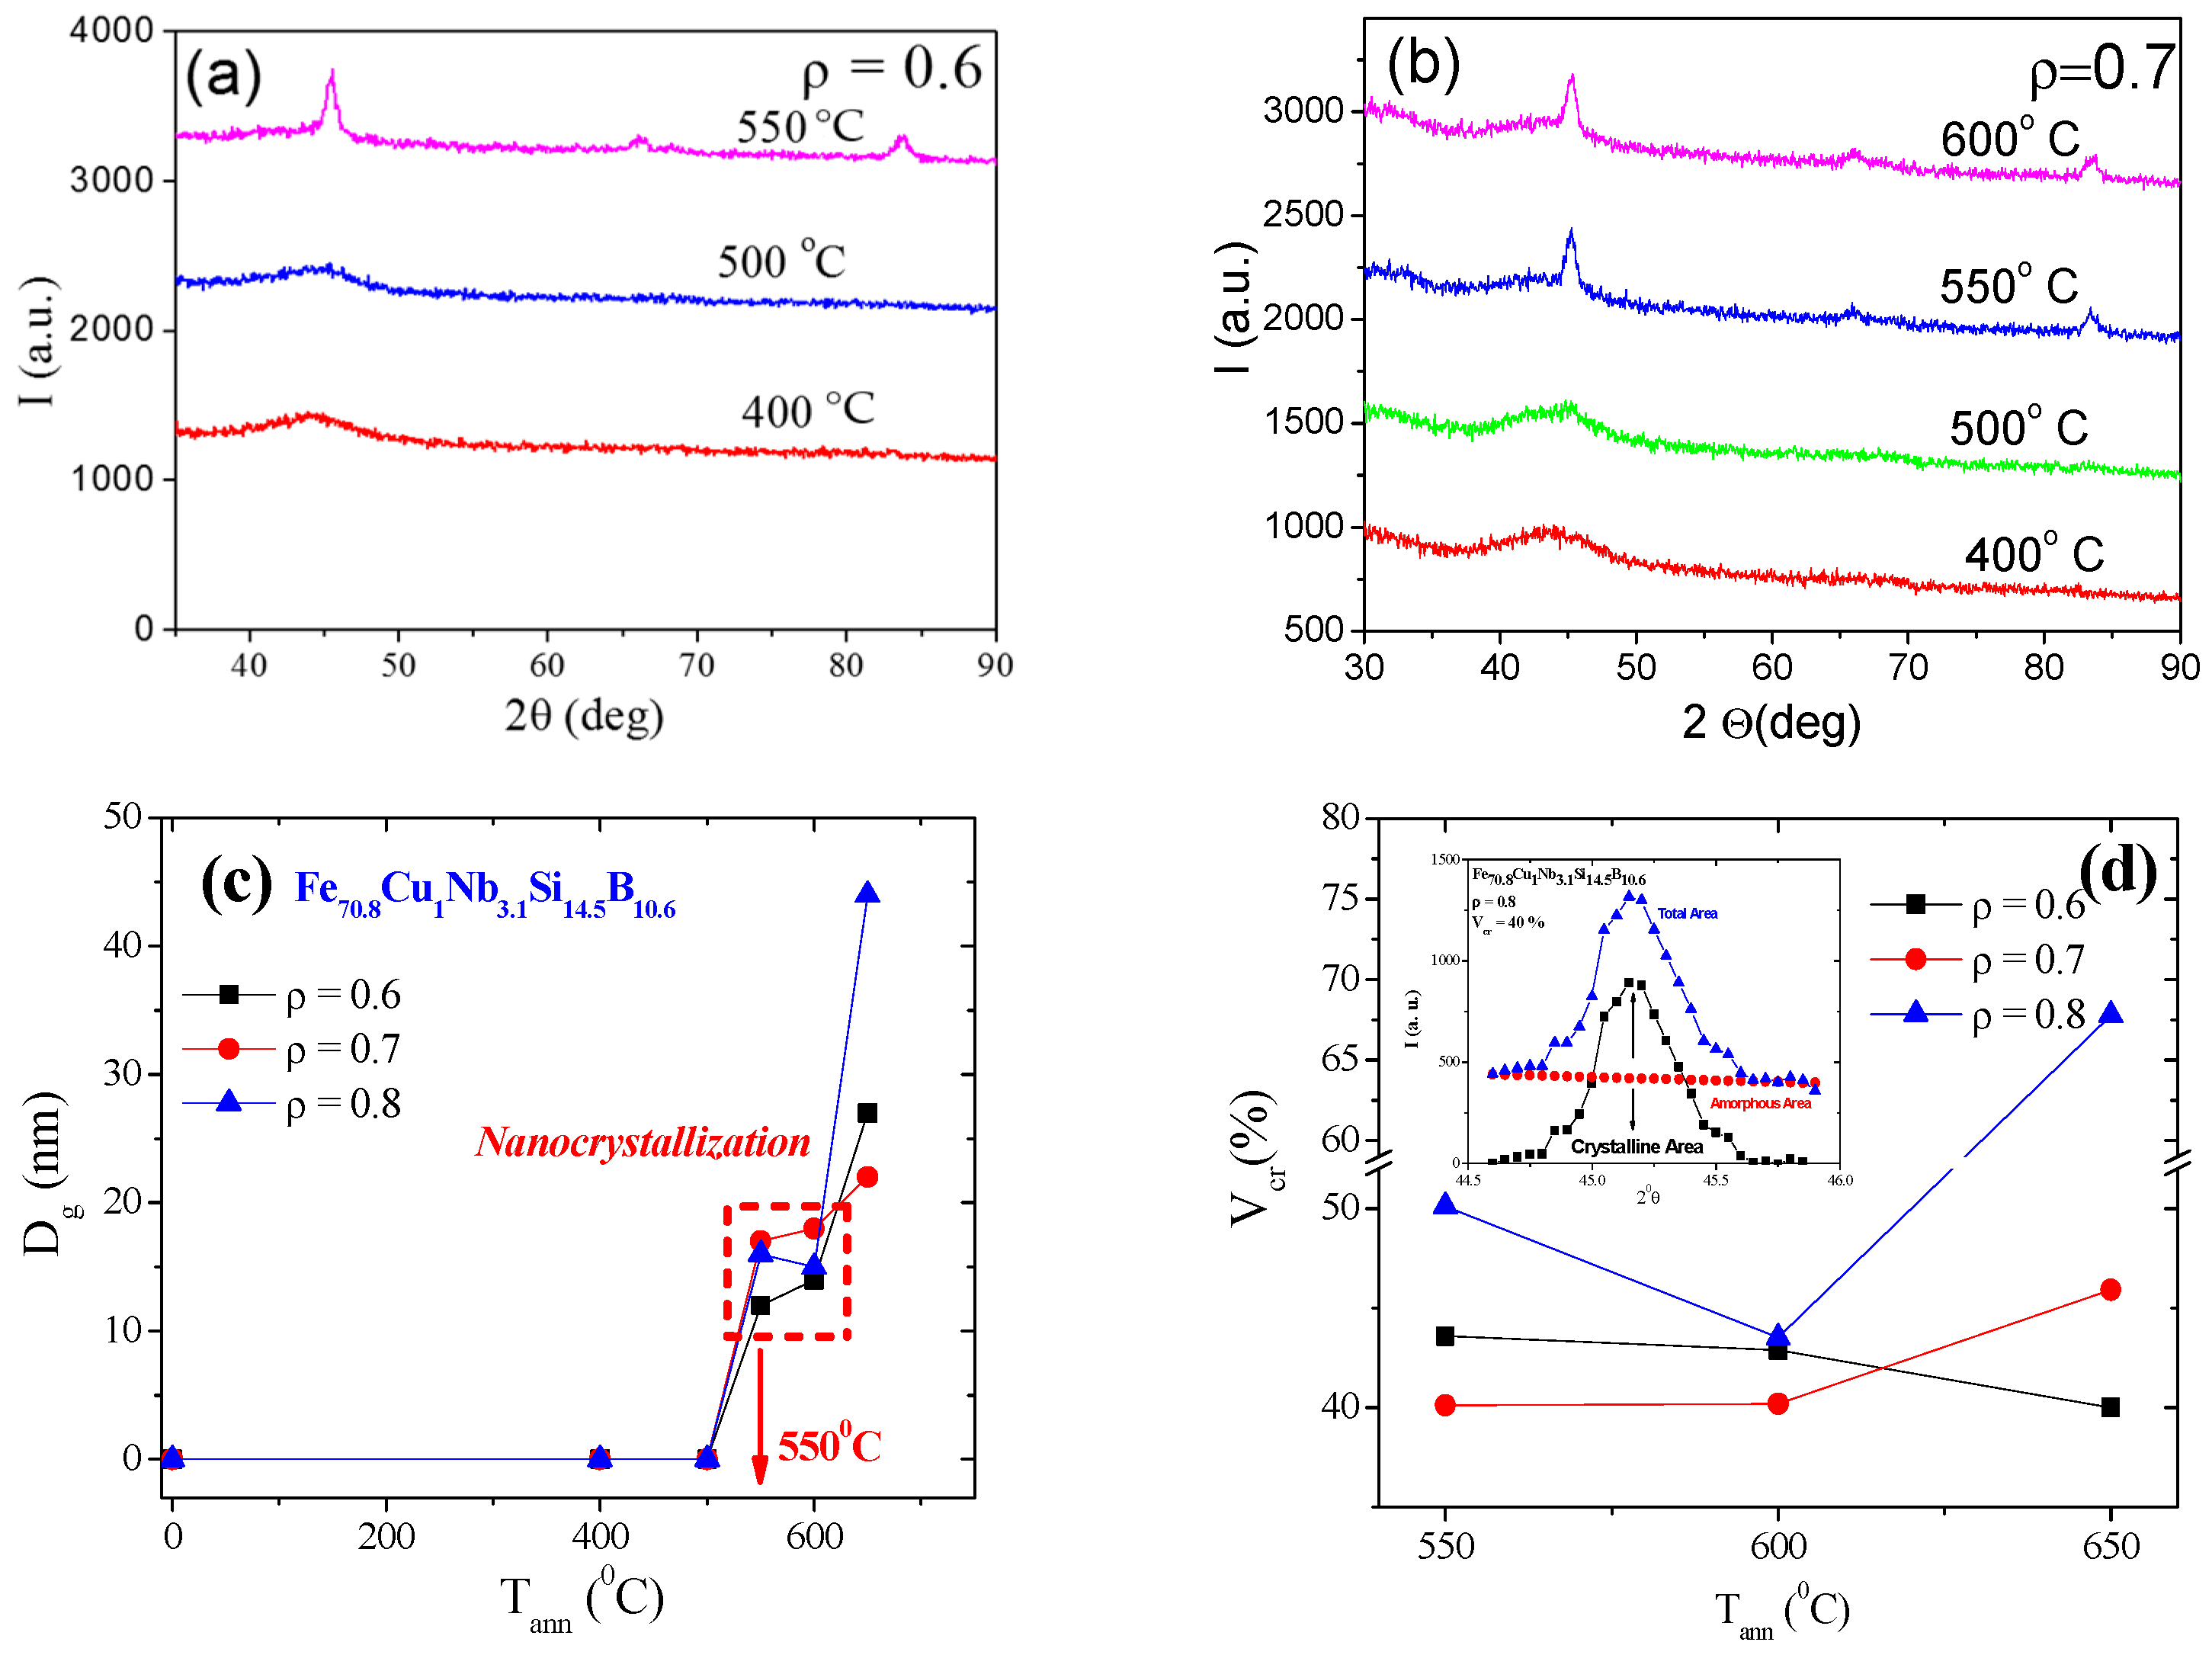
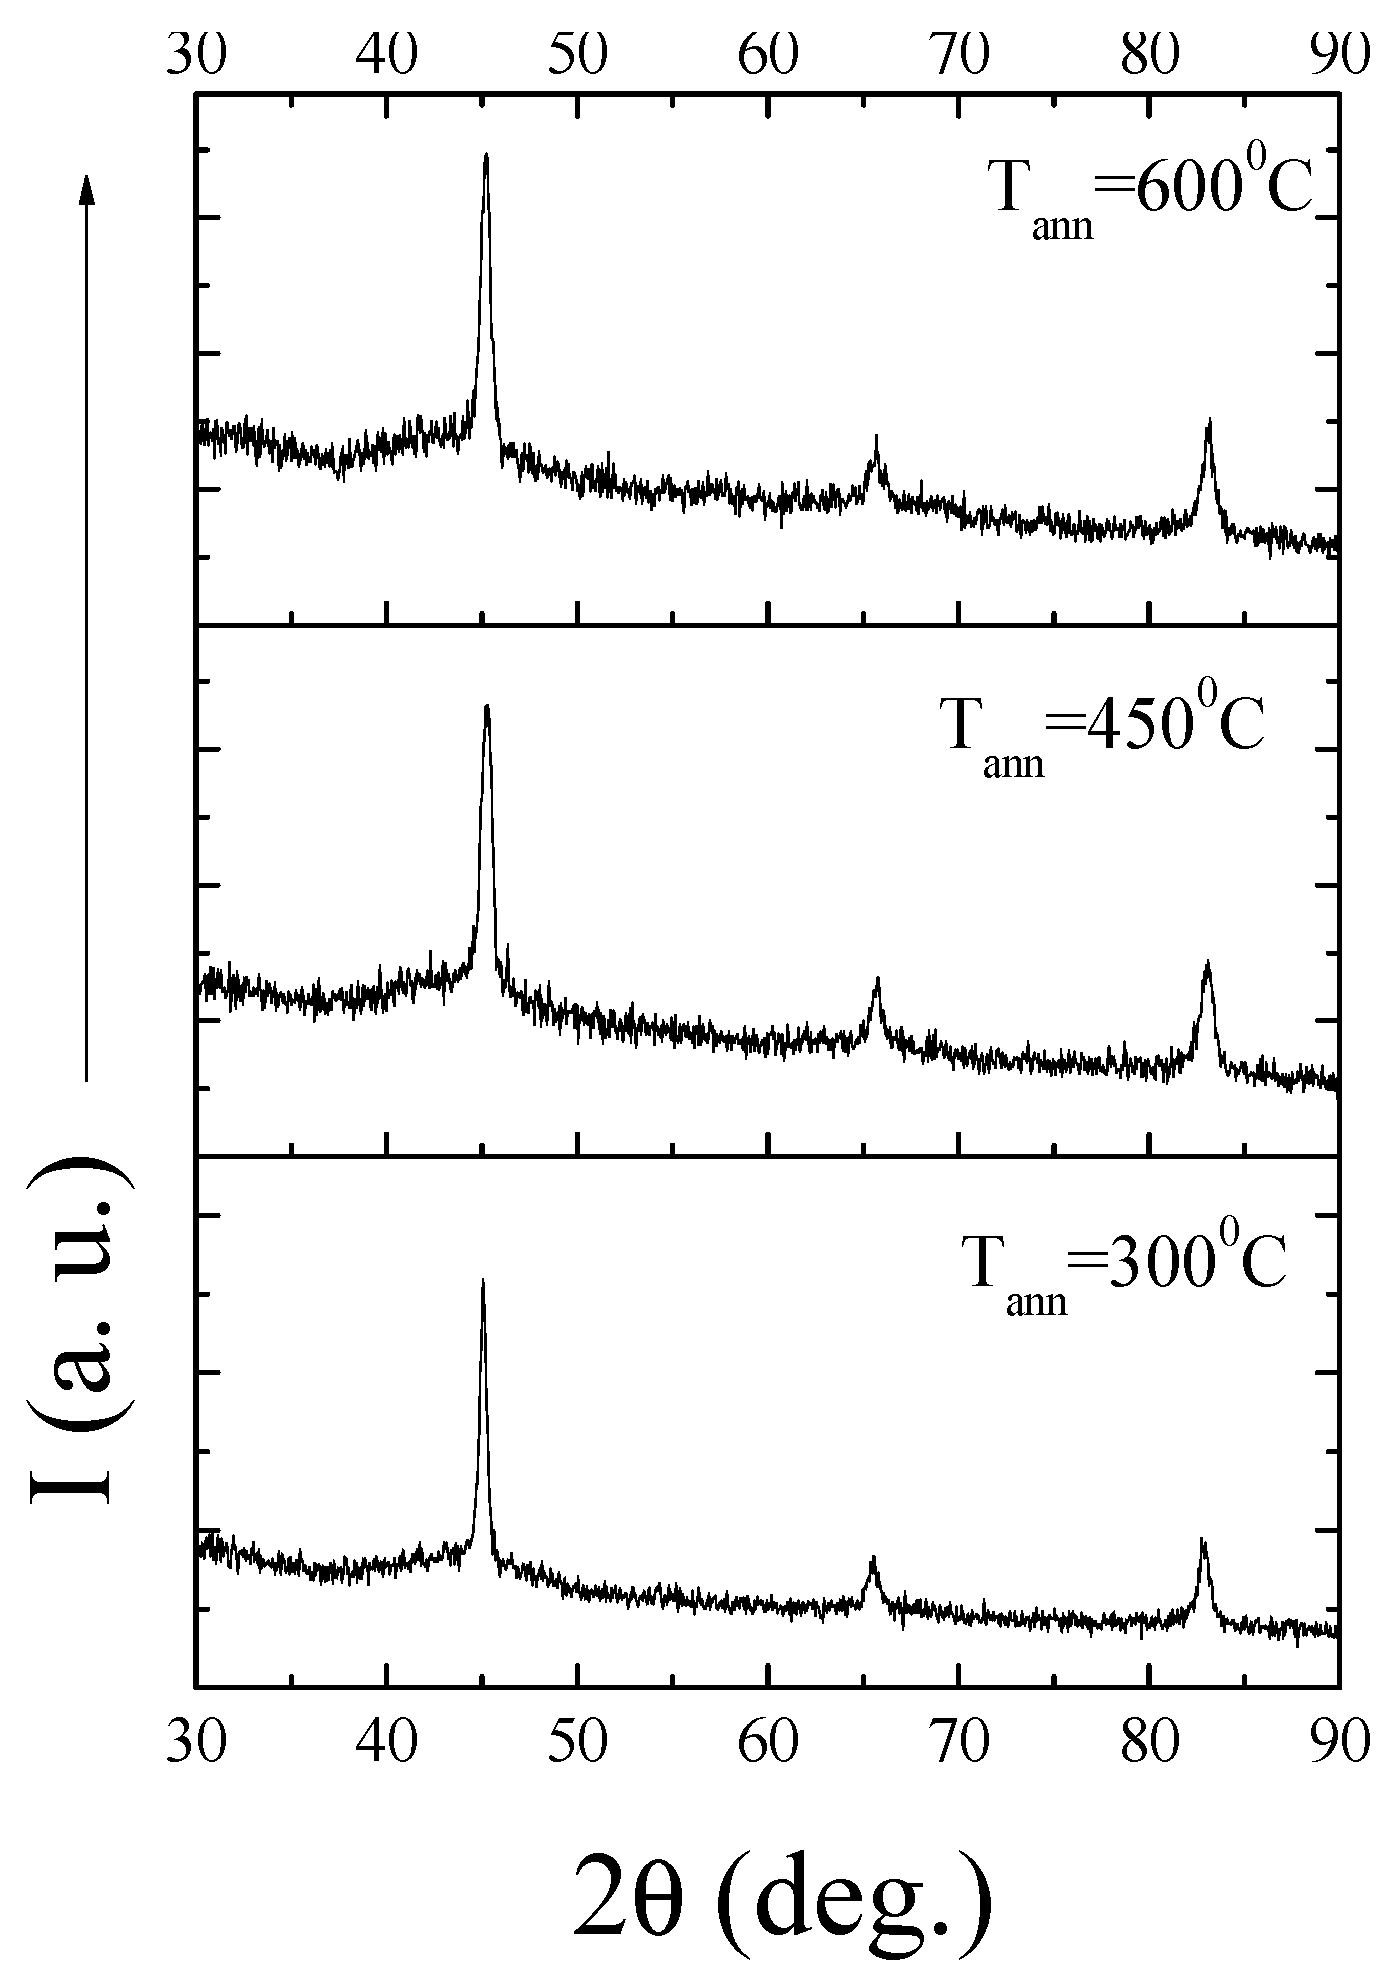
To achieve the nanocrystallization of microwires exhibiting amorphous structure in as-prepared state, we annealed them at annealing temperature,
Tann, ranging between 400–650 °C for 1 h. XRD patterns of annealed Finemet samples are visible in
Figure 6a,b. The devitrification process of Fe
70.8Cu
1Nb
3.1Si
14.5B
10.6 (with
ρ-ratio = 0.6 and 0.7) starts at 500 °C, where a noticeable crystalline peak grows up (
Figure 6). Similarly to the as-prepared Fe
73.8Cu
1Nb
3.1Si
13B
9.1, a BCC α-Fe-Si crystalline peak appears at a diffraction angle about 45° by reaching
Tann = 550 °C. By increasing the annealing temperature such peak becomes higher and narrower indicating an increase in the grain size, and the crystalline volume fraction, respectively. The average grain size,
Dg, (evaluated using equation (4)) for each Fe
70.8Cu
1Nb
3.1Si
14.5B
10.6 microwires is between 12 and 17 nm in the range of 550 °C ≤
Tann ≤ 600 °C and rapidly increases at
Tann ≥ 650 °C reaching a value about 40 nm (
Figure 6c).
It is worth noting that not only the average grain size, but also the crystalline volume fraction,
Vcr, of the precipitating nanocrystalline phase modifies the magnetic properties of devitrified materials [
60,
61]. Several methods for estimating the volume fraction of precipitated nanocrystallites have been reported [
60,
61]. An additional problem arises from the existence of a high number of interfaces with random orientation relationships present in the sample, and as a consequence, the substantial fraction of atoms lies in the interfaces [
62]. Therefore, knowledge of size, precipitating grains distribution, and the average thickness of the grain boundary phase, are required in a combined way for the accurate estimation of the crystalline volume fraction,
Vcr [
60,
61,
62,
63]. Such information cannot be correctly evaluated only from the XRD performed in the present study. Therefore, we paid attention on an alternative method for its estimation based on a reported model for mixed Finemet amorphous/crystalline materials [
64,
65].
This model suggests that a XRD diffraction scan is the sum of the total peak area consisting of crystalline and amorphous diffractograms. The true area of the crystalline peaks can be determined from the following equation:
where
, being
I = Iam + IC at a given point the sum of the amorphous contribution,
Iam, and the crystalline contribution,
IC.
By calculating the total area under the whole peak, taking into account the amorphous phase content, finally one can obtain the crystalline phase volume fraction (see the inset of
Figure 6d). The crystalline volume fraction dependence on annealing temperature of Fe
70.8Cu
1Nb
3.1Si
14.5B
10.6 microwire samples for three different
ρ-ratios is shown in
Figure 6d. This estimation does not distinguish precipitating grains and grain boundaries [
64]. Consequently, obtained crystalline volume fractions are lower in comparison with those reported for annealed nanocrystalline ribbons at similar conditions [
60,
61,
62,
63]. Furthermore, the existence of the glass coating in Finemet microwire samples might be responsible of these discrepancies. Thus the influence of glass coating can be correlated to internal stresses distribution as well as to the low thermal conductivity of the glass itself. Therefore, our estimation can be used only for a first approximation.
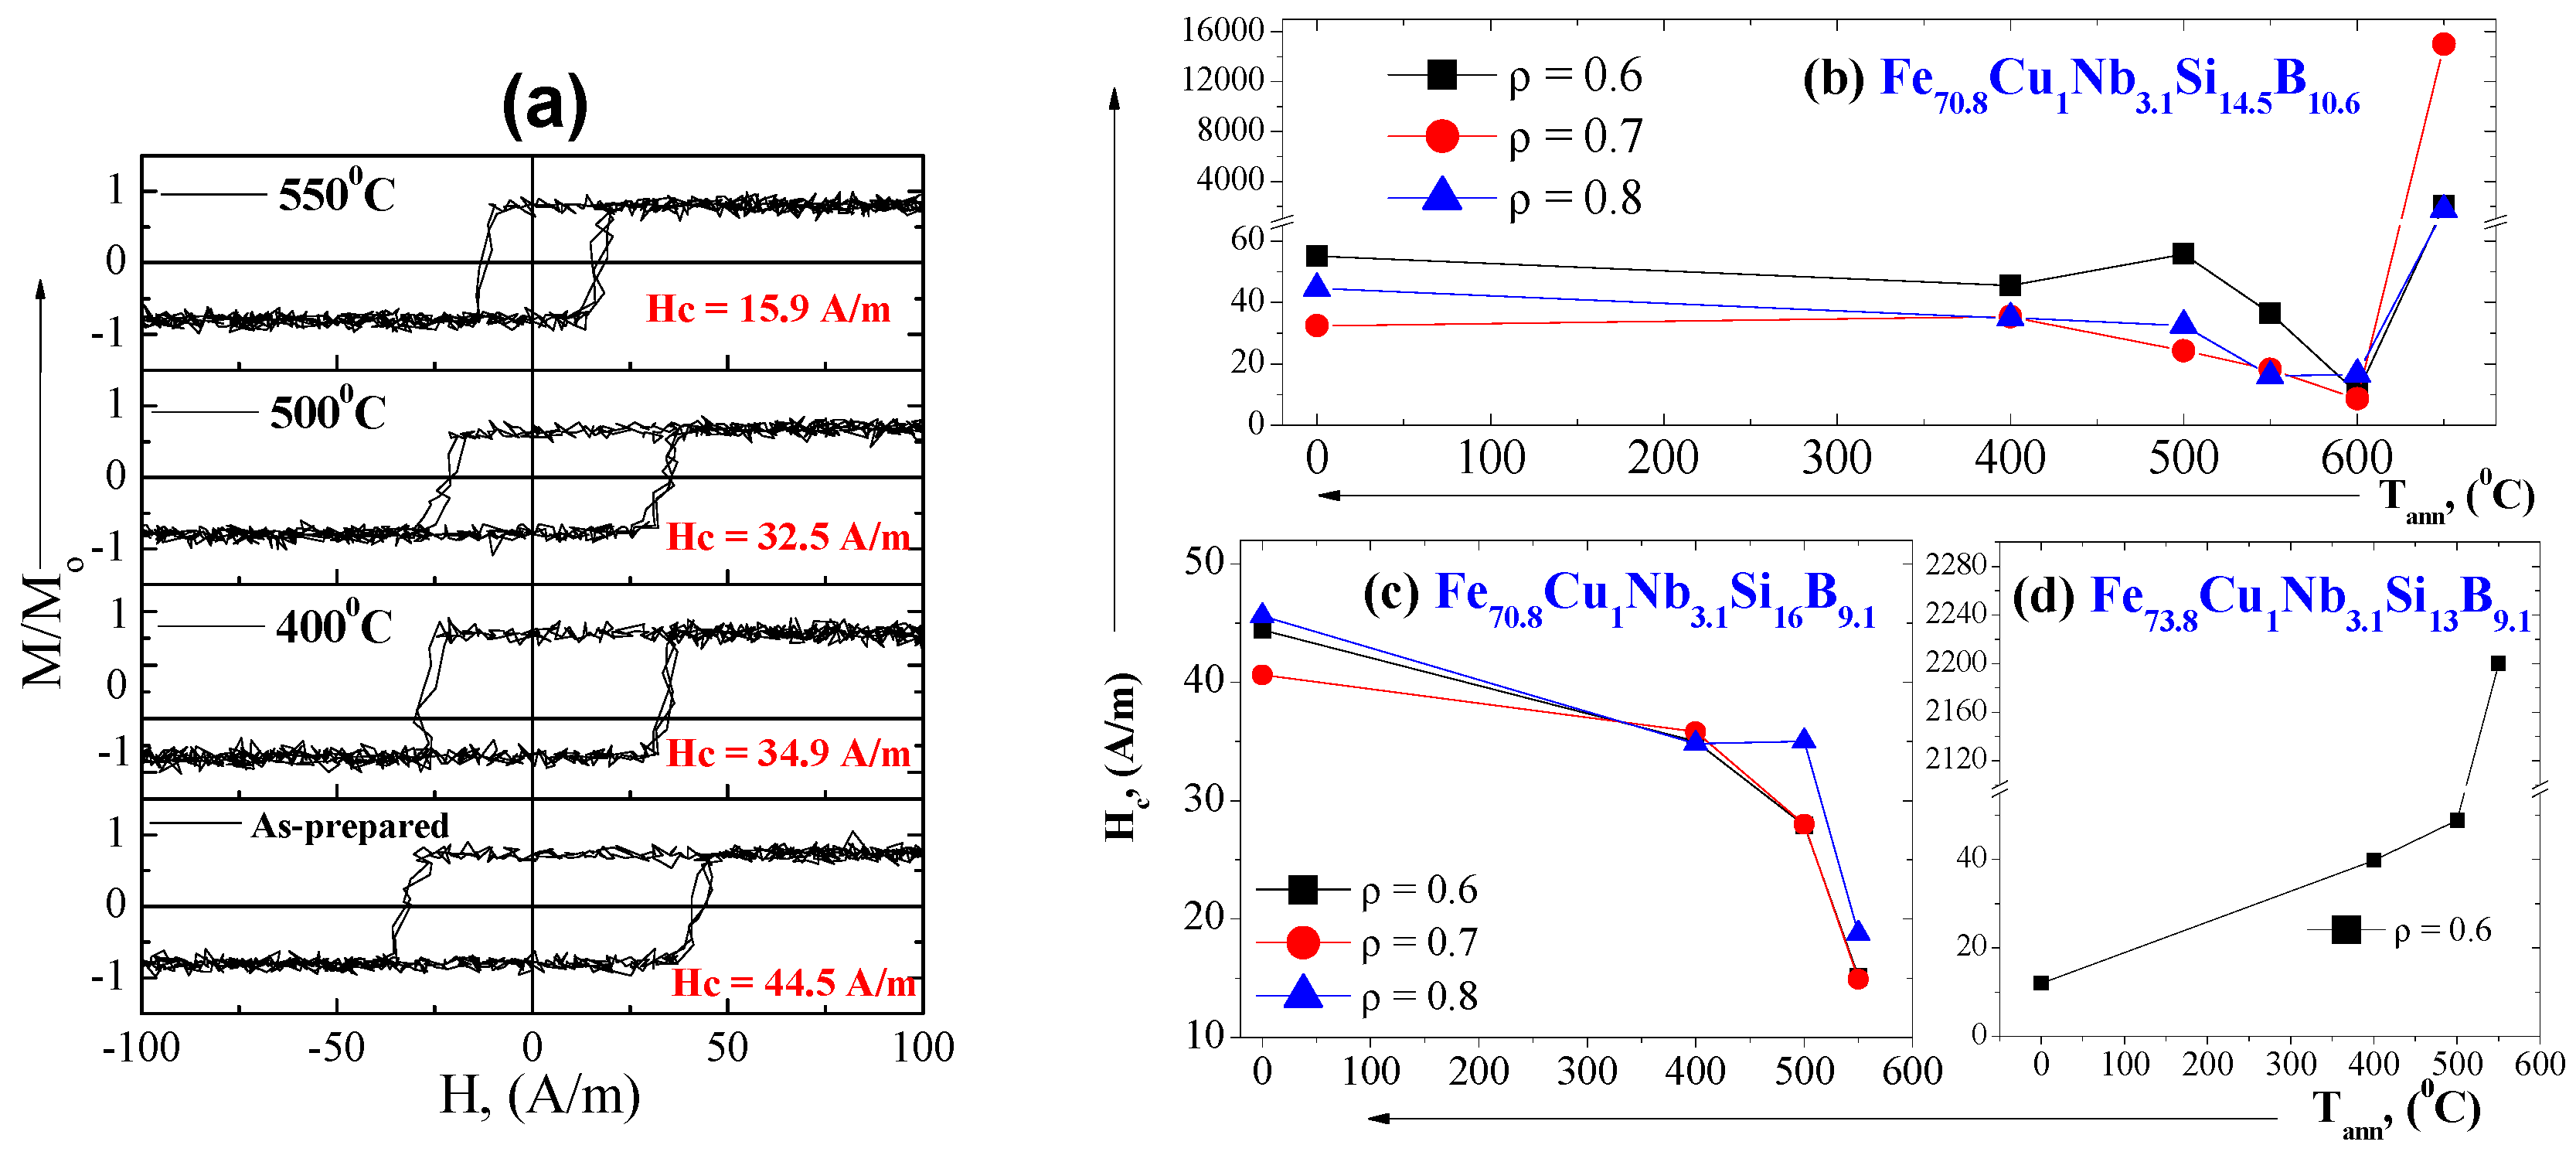
Figure 7a presents hysteresis loops of as-prepared and annealed Fe
70.8Cu
1Nb
3.1Si
14.5B
10.6 microwire samples for
ρ-ratio = 0.8. A rectangular character of hysteresis loops for as-prepared and annealed microwires is observed. As can be deduced from
Figure 7a,b, the coercivity,
Hc, decreases with annealing temperature increasing (
Hc decreases from 44.5
A/m for as-prepared amorphous microwire to 15.9
A/m for the one annealed at
Tann = 550 °C).
The coercivity dependence on annealing temperature of Fe
70.8Cu
1Nb
3.1Si
14.5B
10.6 microwires for different
ρ-ratios is shown in
Figure 7b. The optimal soft magnetic behavior with coercivities values down to 10 A/m is obtained for
Tann = 600ºC (
Figure 7b). A similar tendency has been also observed for Fe
70.8Cu
1Nb
3.1Si
16B
9.1 Finemet microwires with different
ρ-ratios (
Figure 7c) for
Tann ≤ 550 °C. Further increasing of the annealing temperature for Fe
73.8Cu
1Nb
3.1Si
13B
9.1 led to an abrupt increase of the coercivity up to 2200
A/m and deterioration of magnetic softness (
Figure 7d). An increase in the coercive field is also observed for Fe
70.8Cu
1Nb
3.1Si
14.5B
10.6 microwires treated at
Tann = 650 °C (
Figure 7b), being usually associated to the precipitation of Fe
2B phase and a noticeable magnetic hardening [
64].
It is commonly accepted the direct correlation between the nanocrystallization, as is specifically detailed throughout the random anisotropy, and magnetic softening [
19,
66]. Thus, this behavior with the lowest coercivity value is displayed for all studied Fe
70.8Cu
1Nb
3.1Si
16B
9.1 and Fe
70.8Cu
1Nb
3.1Si
14.5B
10.6 Finemet microwires annealed at
Tann = 550 °C, and for the as-prepared Fe
73.8Cu
1Nb
3.1Si
13B
9.1 being already nanocrystallized after casting. These results are ascribed to the fact that the first nanocrystallization stage has been developed, leading to precipitation of α-Fe-Si nanocrystallites with a grain size,
Dg, of 10–20 nm (
Figure 6c). This behavior is in agreement with the one widely reported in ribbons and glass-coated microwires Finemet-like nanocrystalline materials [
41,
42,
43,
44,
45,
46,
47].
After annealing, a variation of the magnetoelastic anisotropy should be also taken into account. Thus, after the optimum annealing for detecting the nanocrystalline structure, the magnetostriction coefficient of all microwires should be compensated among structural phases present in the nanocrystalline state [
66]. In a broad sense, the existence of two different phases gives a good balance of a negative magnetostriction of α-Fe-Si nanocrystallites about (
−6 × 10
−6) [
65,
67] and a positive one for the amorphous matrix about (
20 × 10
−6) [
67] resulting finally in very low net magnetostriction values, according to [
65]:
being
λseff the saturation magnetostriction coefficient, and
Vcr the crystalline volume fraction.
Consequently, we evaluated the magnetostriction coefficient by a direct measurement of Fe73.8Cu1Nb3.1Si13B9.1 microwire exhibiting nanocrystalline structure in as-prepared state using the small angle magnetization rotation (SAMR) method. After several measurements, three reasonable values 0.021 × 10⁻⁶, 0.054 × 10⁻⁶ and 0.075 × 10⁻⁶ according to above mentioned correlations were obtained.
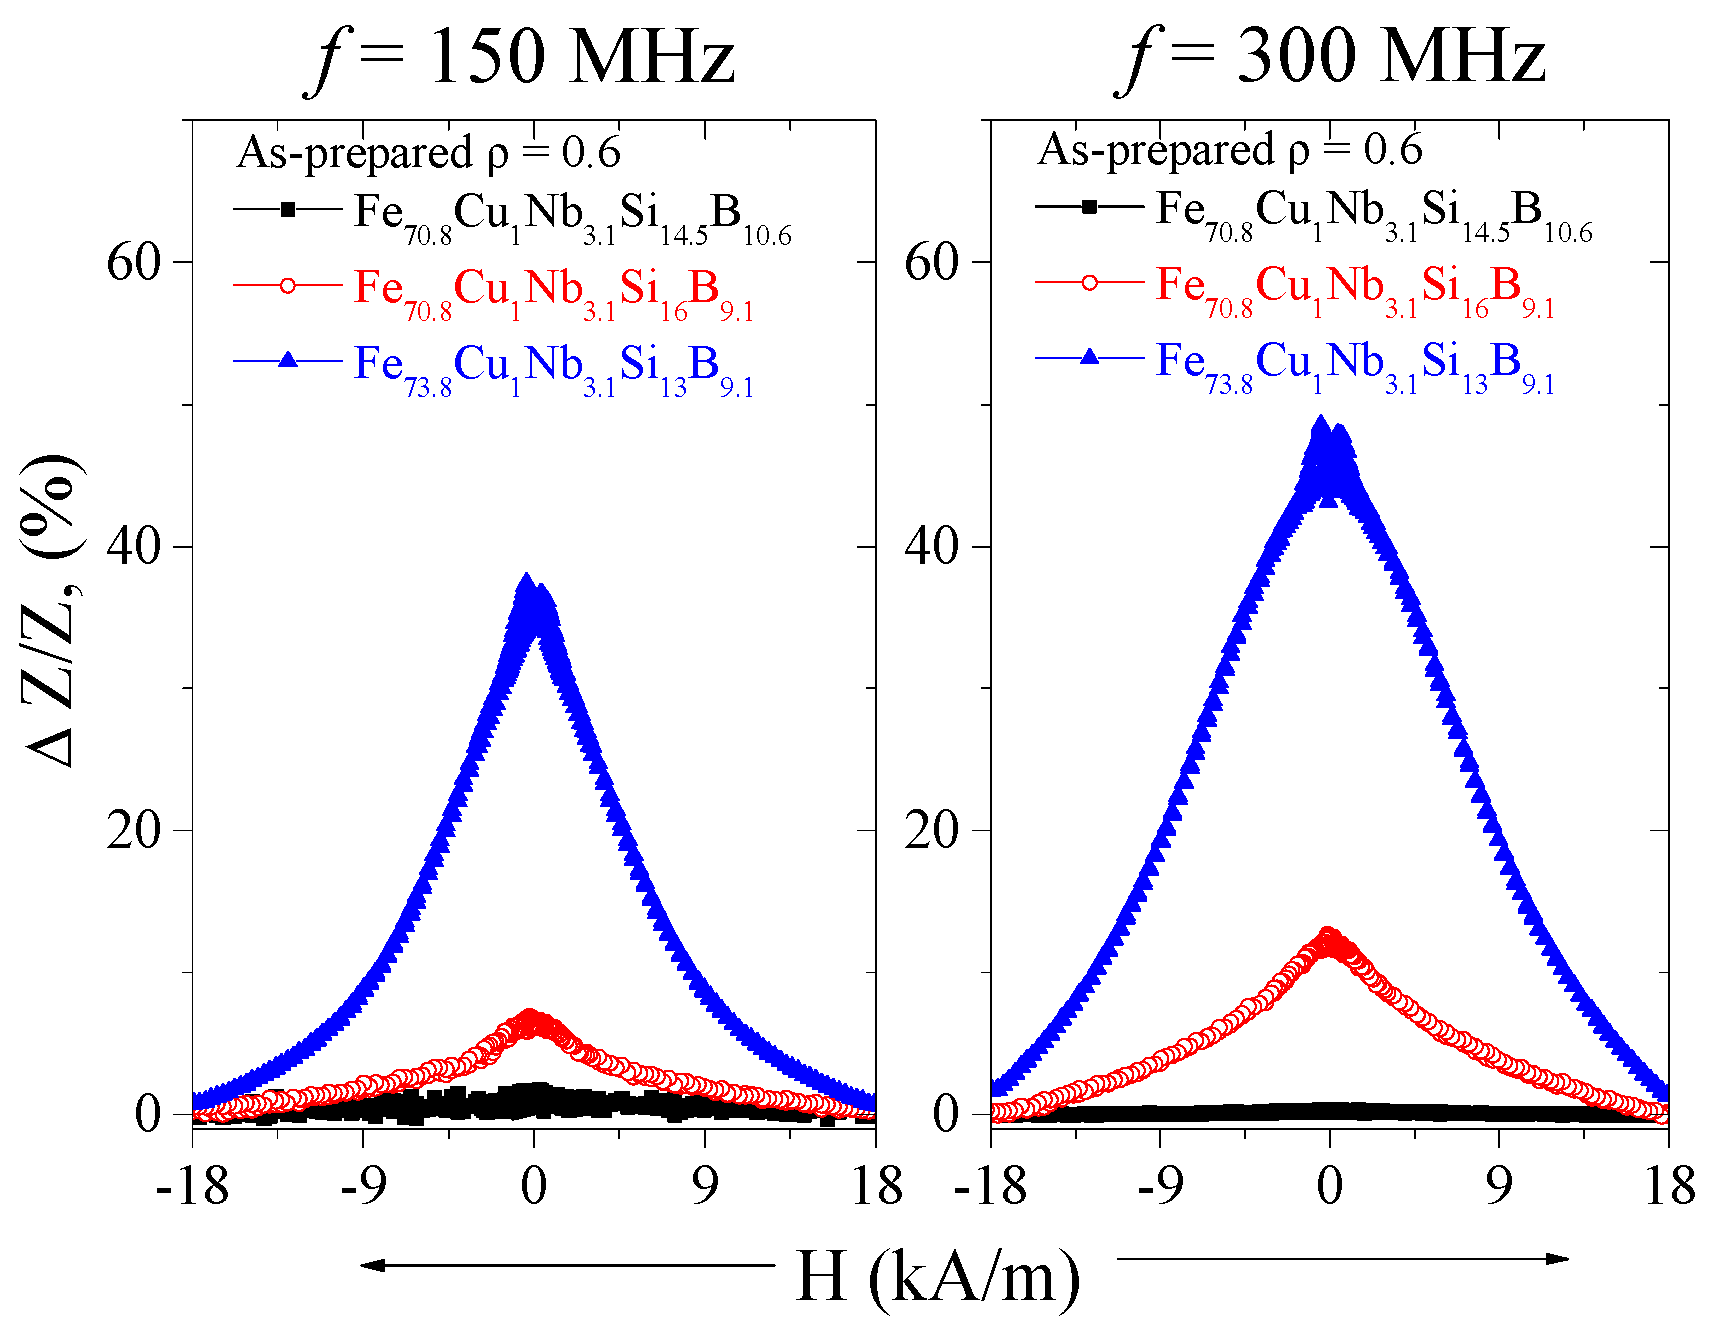
After devitrification of studied samples we measured the GMI effect.
Figure 8 displays
ΔZ/Z (H) dependence of all as-prepared microwires, two amorphous Fe
70.8Cu
1Nb
3.1Si
16B
9.1 and Fe
70.8Cu
1Nb
3.1Si
14.5B
10.6, and the one nanocrystalline Fe
73.8Cu
1Nb
3.1Si
13B
9.1 having the same
ρ-ratio = 0.6. As expected, amorphous microwires exhibit a rather poor GMI response (≈1
% for Fe
70.8Cu
1Nb
3.1Si
14.5B
10.6 and
5
% for Fe
70.8Cu
1Nb
3.1Si
16B
9.1) similar to Fe-based glass-coated microwires with highly positive magnetostriction. In contrast, good GMI values about 38
% for
f = 150
MHz and about 50
% for
f = 300
MHz are observed for as-prepared nanocrystalline Fe
73.8Cu
1Nb
3.1Si
13B
9.1 microwire. This result is definitely, a consequence of the nanocrystalline structure as well as of the nearly zero magnetostriction coefficient (0.021 × 10
−6).
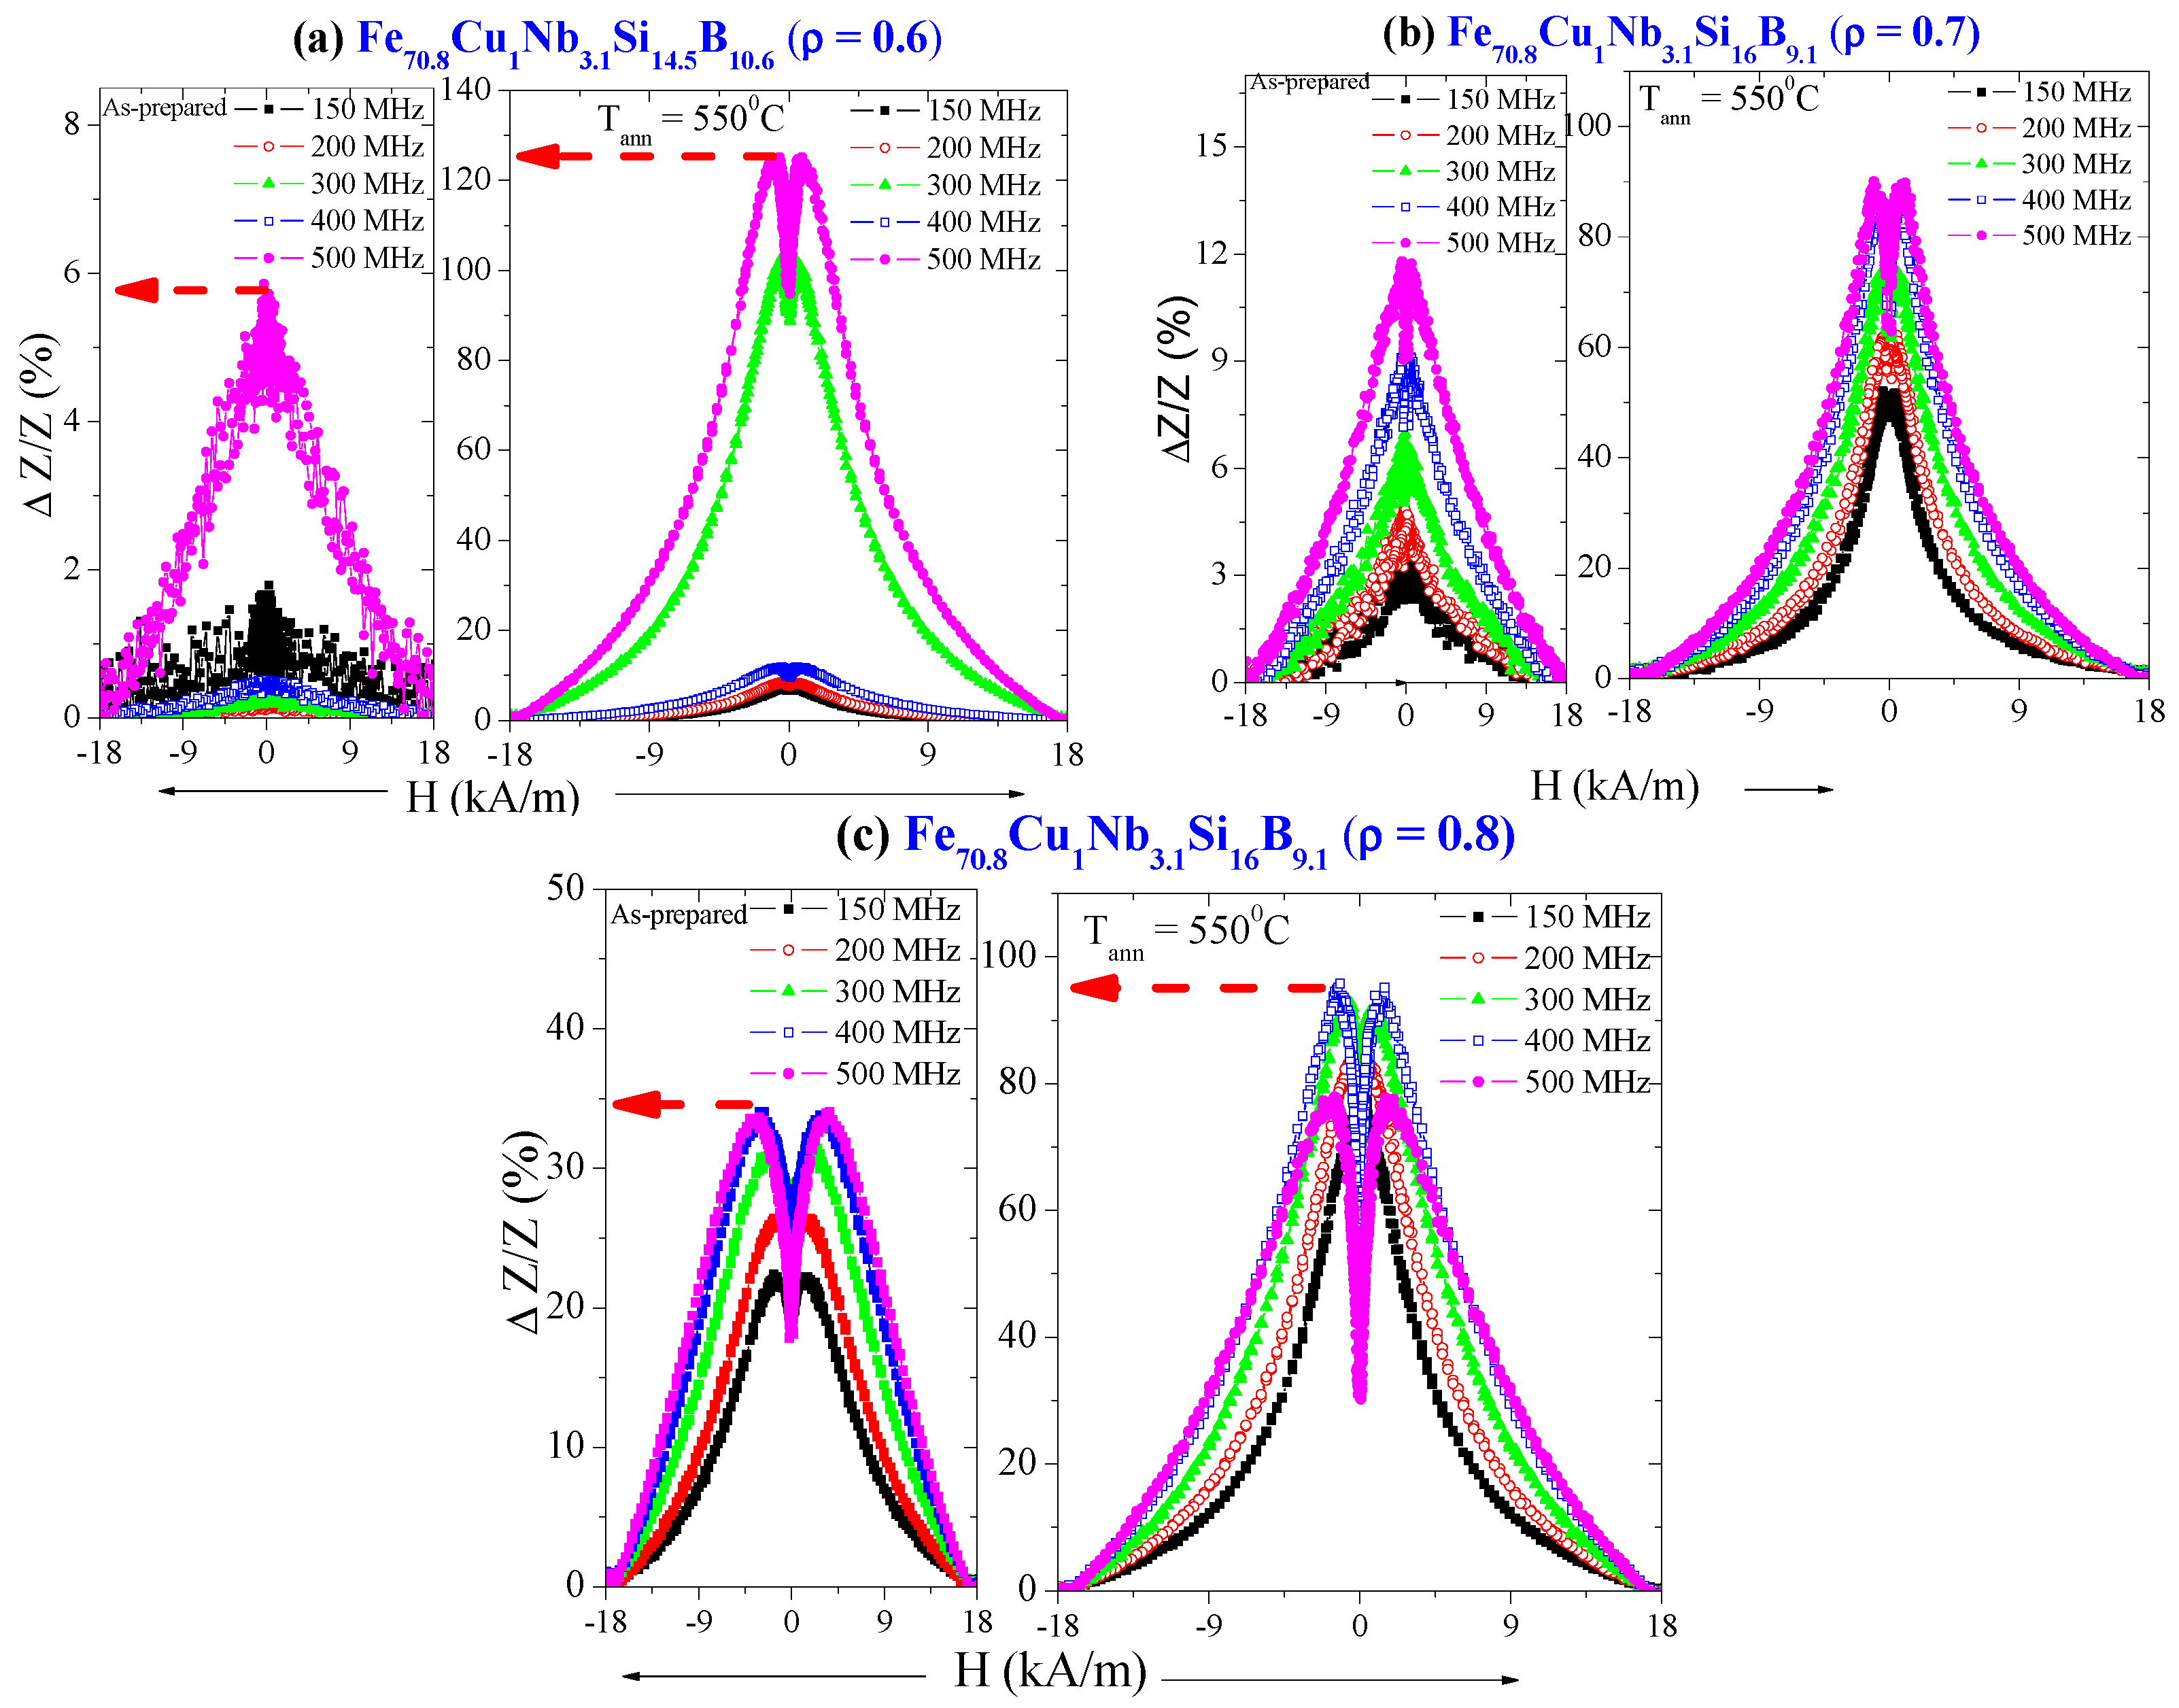
In addition, the stress distribution arising from the coupling between the internal stresses resulting from the simultaneous rapid quenching of the metallic nucleus inside the glass coating and of the positive magnetostriction coefficient induces a longitudinal magnetization easy axis for Fe-based alloys. Their peculiar domain structure, characterized by a low circular magnetic permeability is not usually favorable to exhibit a GMI effect. As a consequence, the GMI effect in the as-prepared glass-coated Finemet microwires with positive magnetostriction is small. The significant influence of the nanocrystallization on optimizing GMI effect is visible in
Figure 9. Interestingly, GMI responses show a remarkable improvement for Fe
70.8Cu
1Nb
3.1Si
14.5B
10.6 microwires annealed at
Tann = 550 °C, being GMI considerably enhanced from 6
% to 125
% for
f = 500 MHz (
Figure 9a). In a similar way, for annealed Fe
70.8Cu
1Nb
3.1Si
16B
9.1, GMI increases from 12
% up to 90
% for
ρ-ratio = 0.7 (
Figure 9b) and reaches about 93% for
ρ-ratio = 0.8 (
Figure 9c).
The GMI enhancement achieved after the devitrification of Fe-rich microwires is, indeed, of practical interest for GMI related-applications. It must be noted that GMI effect is suitable for magnetic sensors, allowing measurements of low magnetic fields. The DC magnetic field dependence of the GMI ratio, (
Figure 9), is typical for samples with circular magnetic anisotropy, i.e., with a maximum at certain DC axial magnetic field,
Hm. [
14,
15,
16]. This
Hm value is associated with the anisotropy field.
We assume that since the magnetostriction value after nanocrystallization is reduced, microwires present better magnetic softness, higher permeability and therefore a higher GMI effect.
Generally the cylindrical geometry, and high circumferential permeability observed in Co-rich amorphous wires are quite favorable for achievement of high GMI effect. Therefore, the highest GMI ratios are reported for different families of amorphous wires [
14,
15,
16,
17,
51,
52].
Although reported GMI ratios for Co-based microwires are much higher than currently presented GMI ratios, the affordable commercial cost of Finemet alloys is still one of the most desirable prerequisites for the GMI applications point of view. It is worth noting that in a few papers, higher GMI ratios and softer magnetic properties have been reported for nanocrystalline ribbons [
46]. These results have been be related to the absence of glass-coating that introducing internal stresses in microwires that can affect the devitrification process [
41,
42,
43,
44,
45].
Consequently, we are able to improve GMI effect from few (1–2)% up to 125% after the devitrification of Finemet-type FeCuNbSiB microwires. Although the obtained nanocrystalline microwires are more brittle than the amorphous ones, they can be interesting for applications where cut microwires are used, i.e., in tunable metamaterials with embedded magnetically soft cut microwires [
16,
68].
3.2. Hitperm-Like Glass-Coated Microwires Exhibiting Magnetic Bistability
As mentioned above, for as-prepared Fe
38.5Co
38.5B
18Mo
4Cu
1 microwires (
ρ = 0.6) a noticeable peak appears at 2
θ ≈ 45° that corresponds to α-FeCo phase with an average grain size about 33.3 nm randomly distributed in an amorphous matrix (
Figure 2b). The diffraction pattern must be attributed to the superposition of peaks corresponding to the crystalline and amorphous phases.
Figure 10 shows XRD patterns of Fe
38.5Co
38.5B
18Mo
4Cu
1 microwires (
ρ = 0.6) annealed at different temperatures,
Tann, for 1 h. As it can be appreciated, the nanocrystalline structure maintains its features after annealing at
Tann ≤ 600 °C. From the peak shape, and in particular from the peak’s half-width, a useful information of the average grain size of the corresponding crystalline phase using the Debye-Scherrer formula (Equation (4)) can be obtained, achieving values between 20 ≤ D ≤ 30 nm.
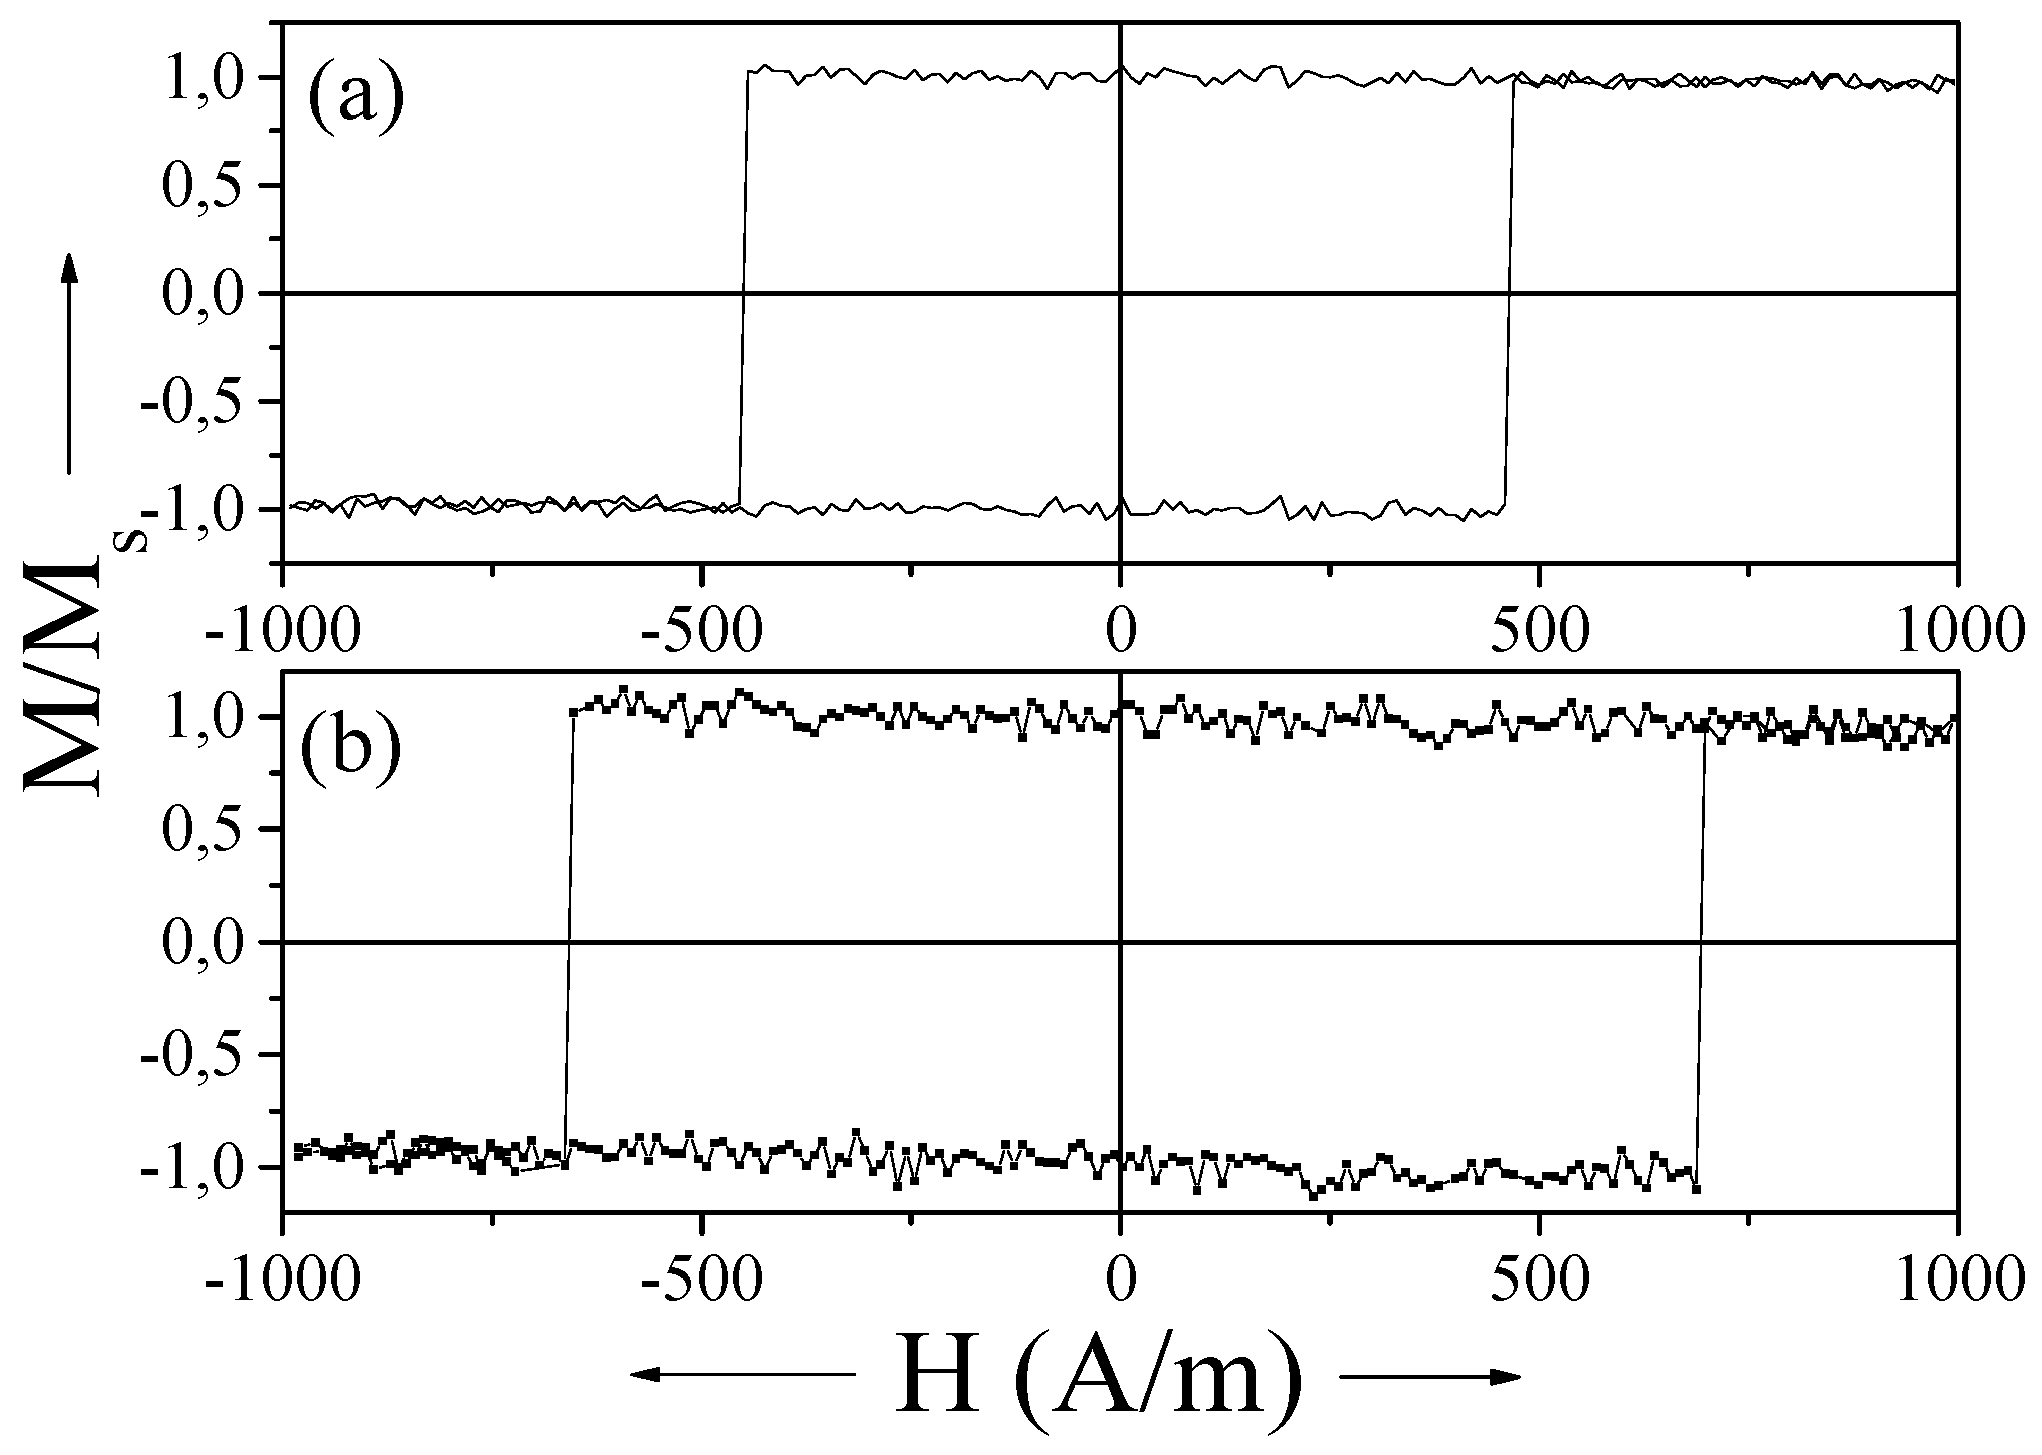
Figure 11 shows hysteresis loops of as-prepared Fe
38.5Co
38.5B
18Mo
4Cu
1 microwires with different
ρ. The higher coercivity,
Hc, of the sample with
ρ = 0.6, compared with sample having
ρ = 0.41 can be due to the difference in average grain size. The rectangular character of hysteresis loops of FeCoMoBCu (Hitperm) microwires should be attributed to the positive magnetostriction even in the nanocrystalline state, because both α-FeCo grains and amorphous matrix present positive magnetostriction coefficients [
69].
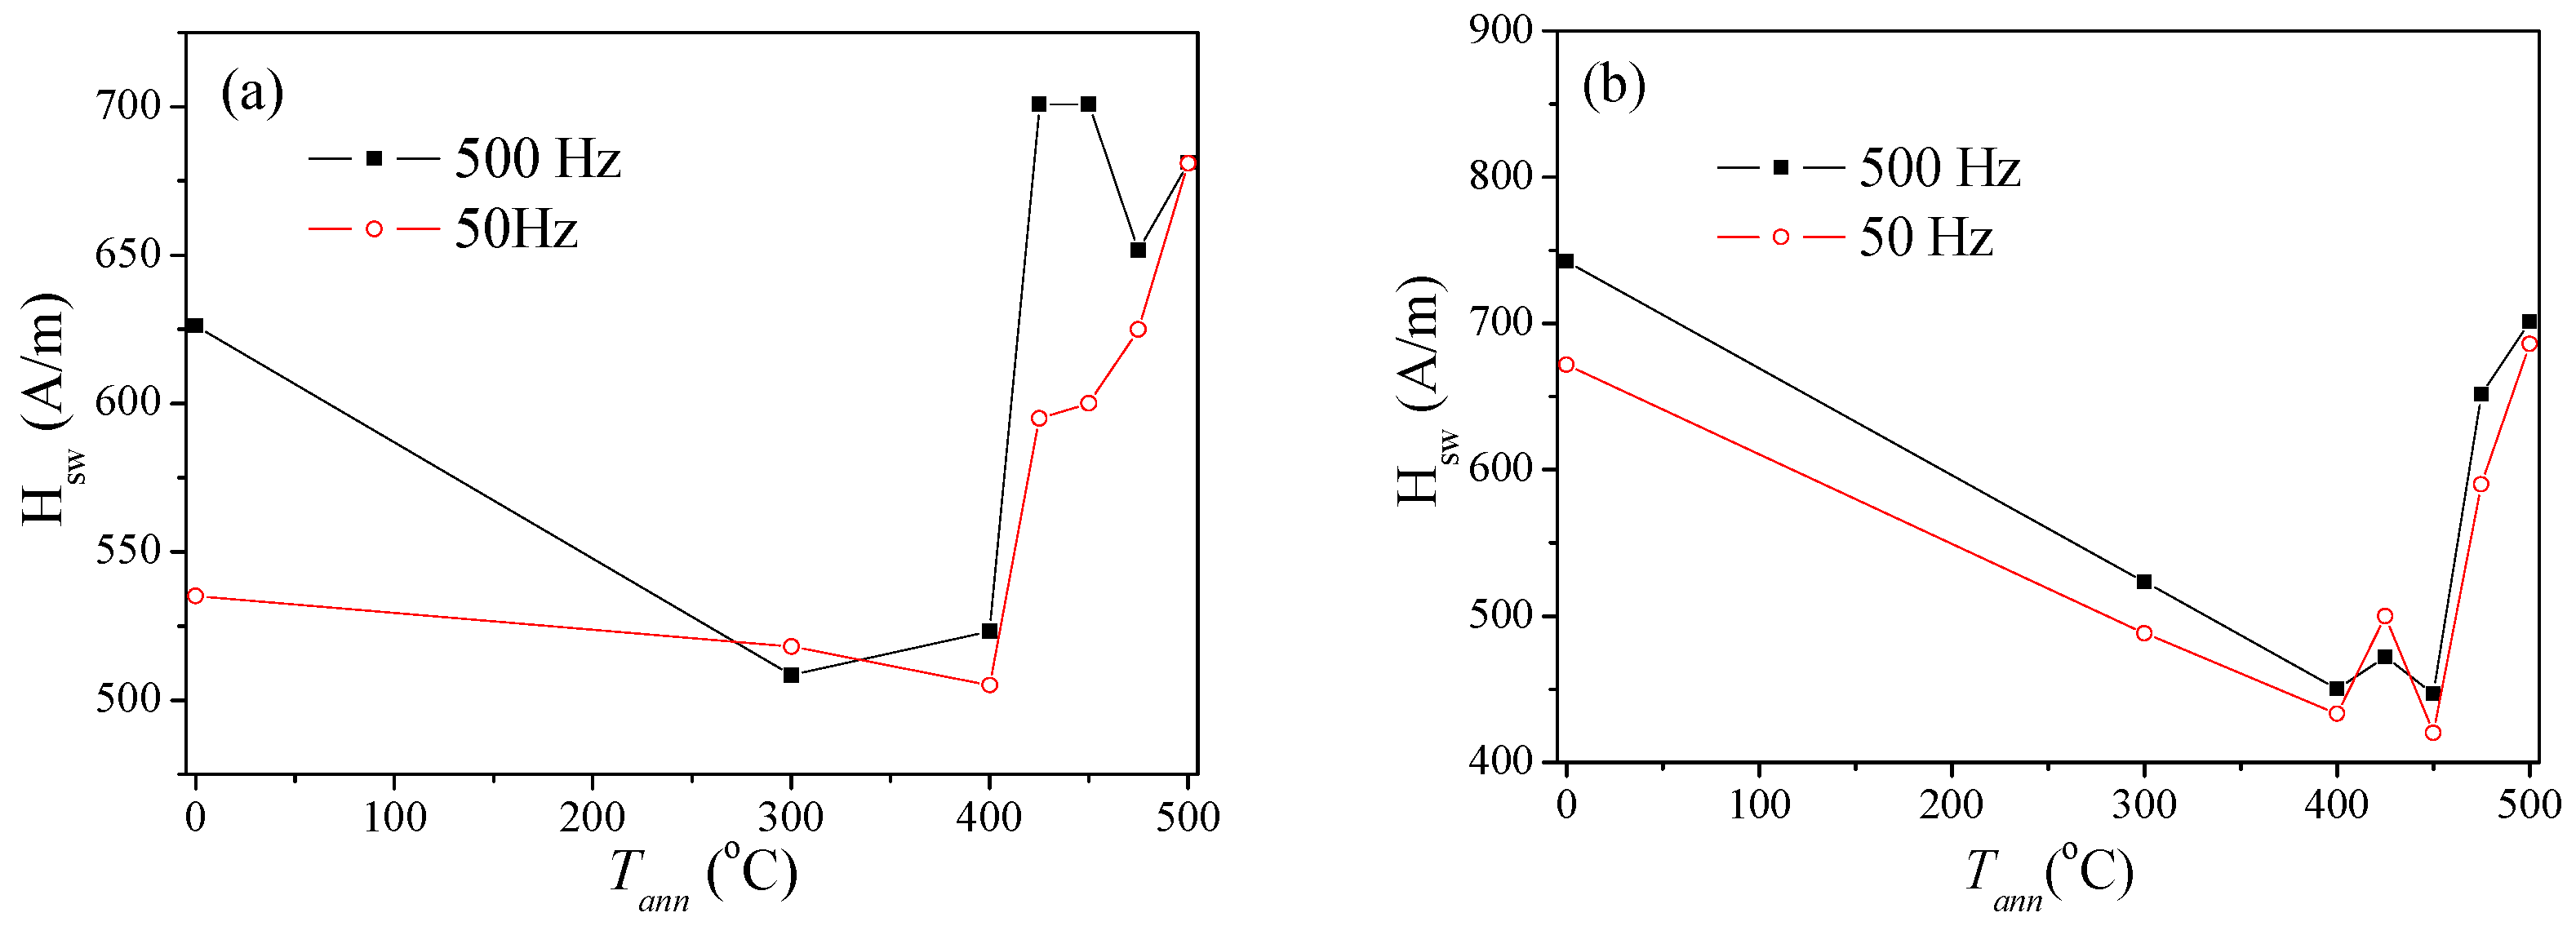
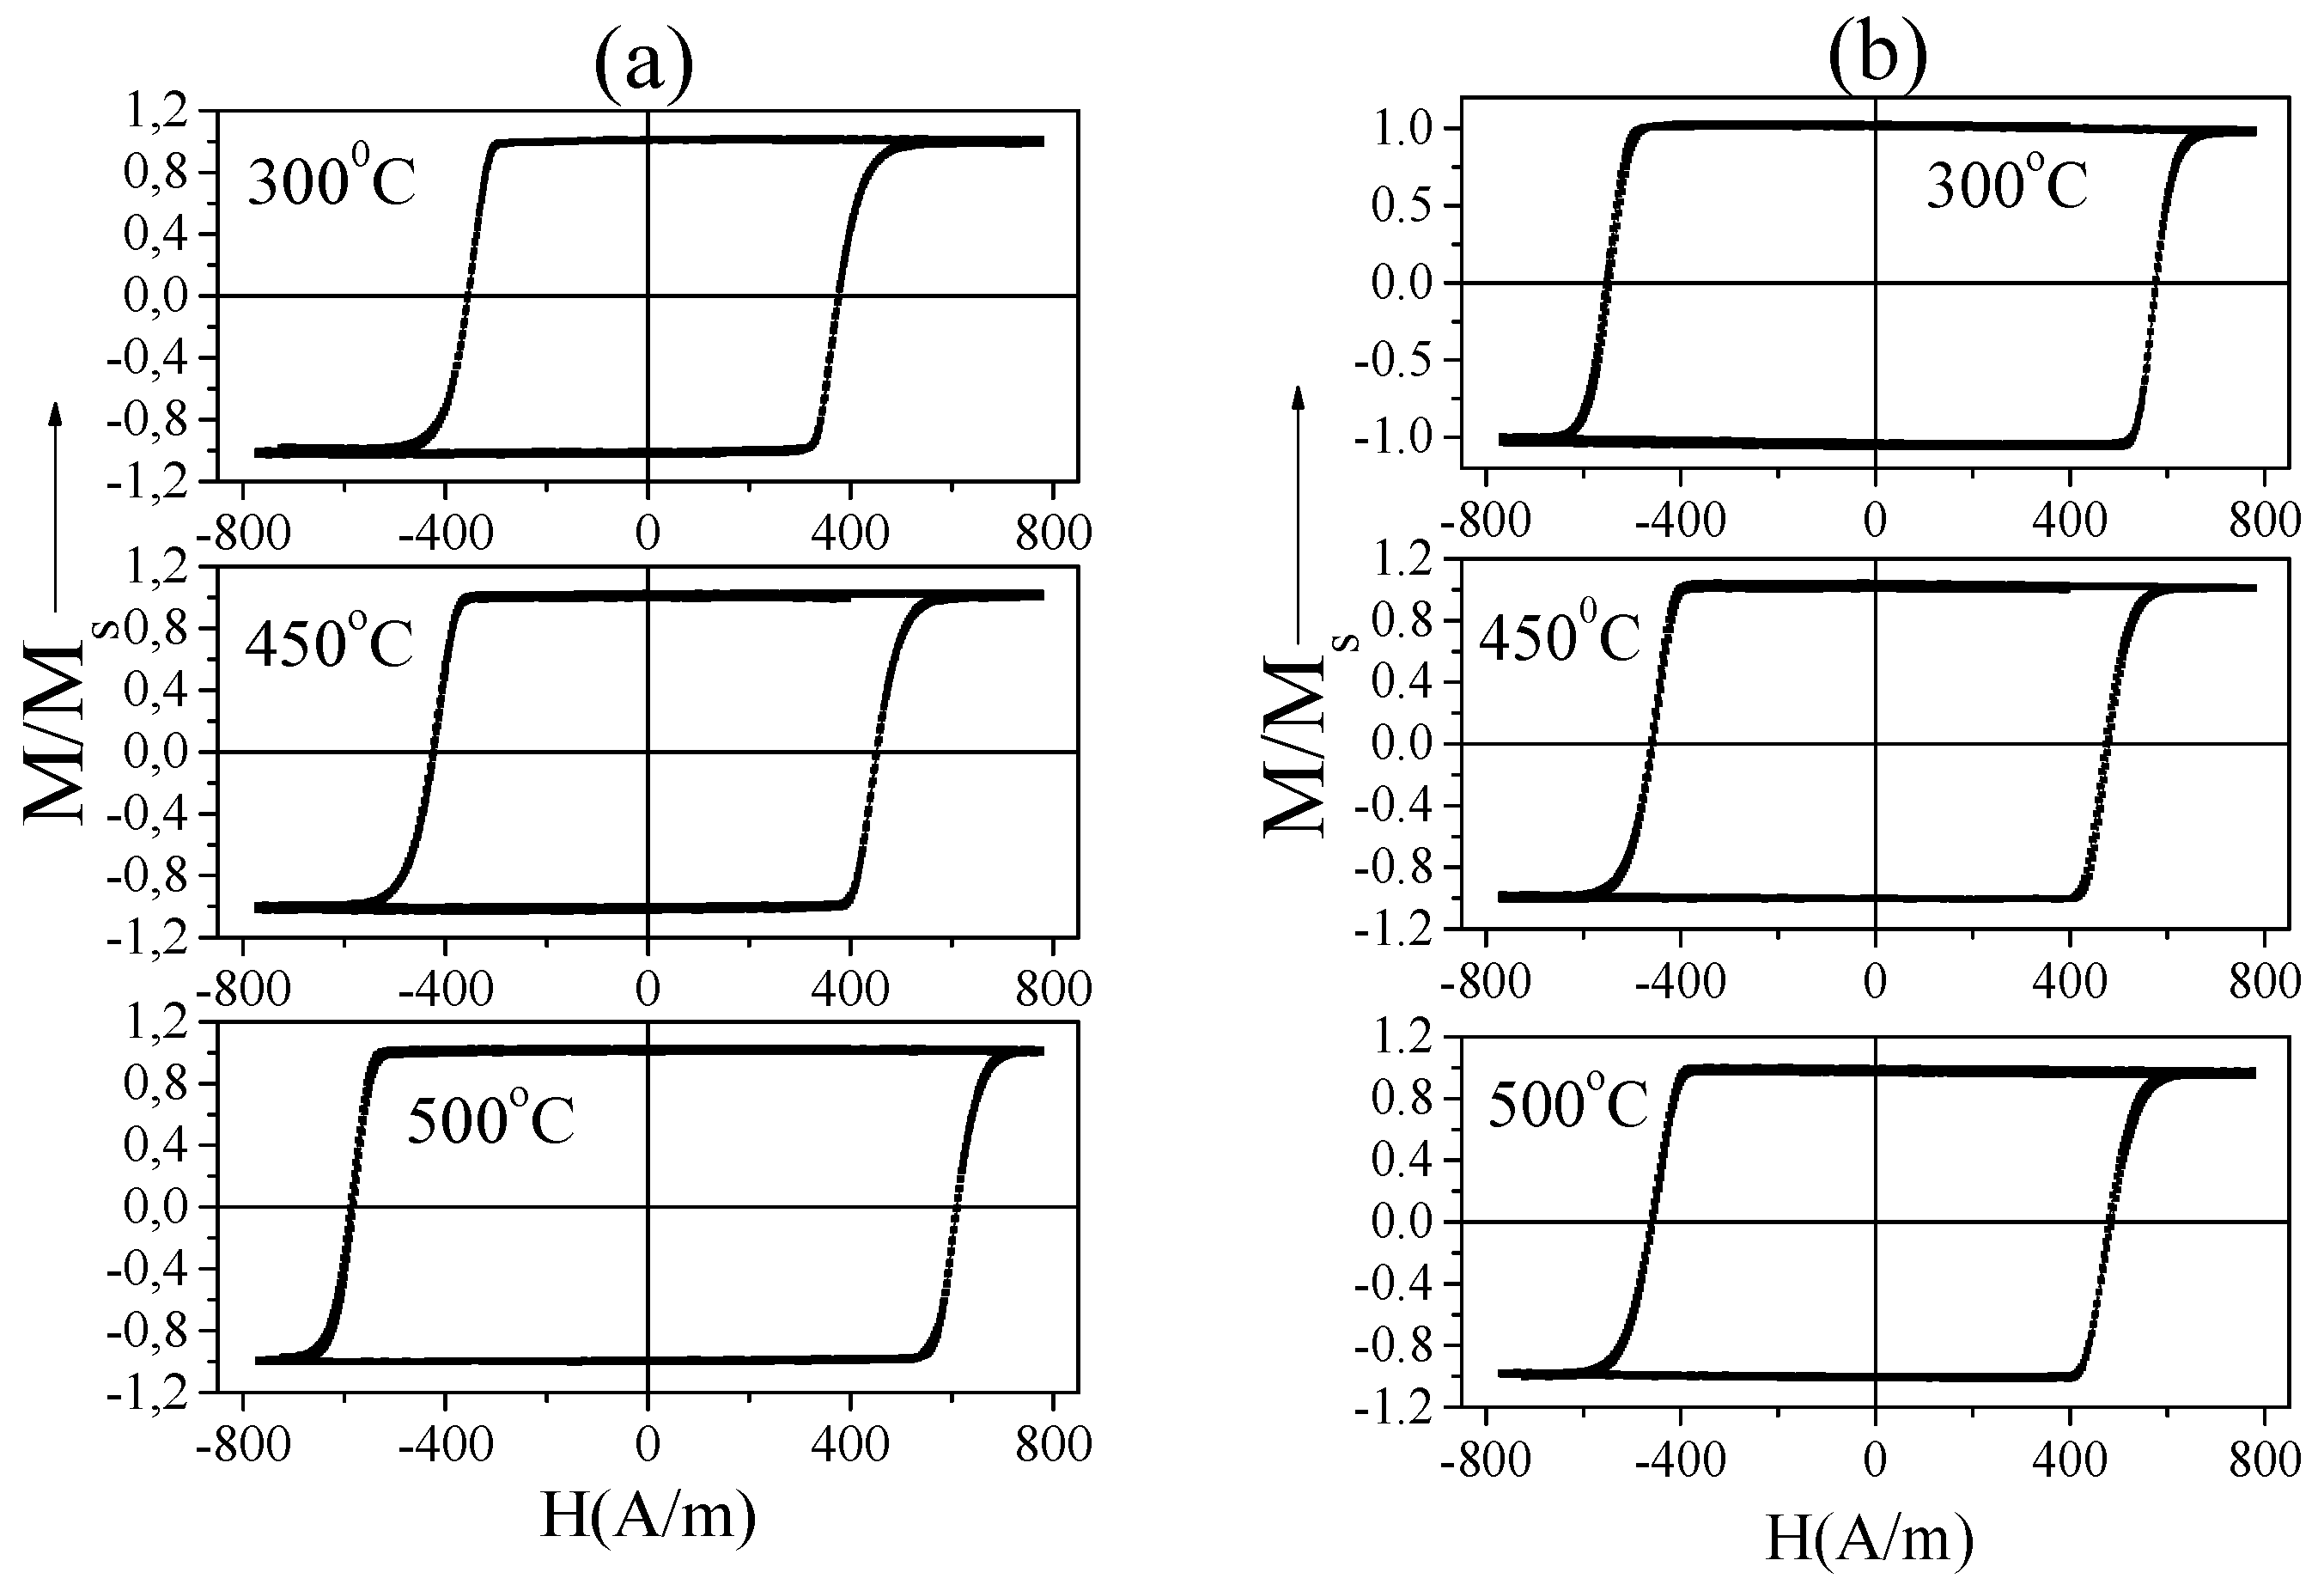
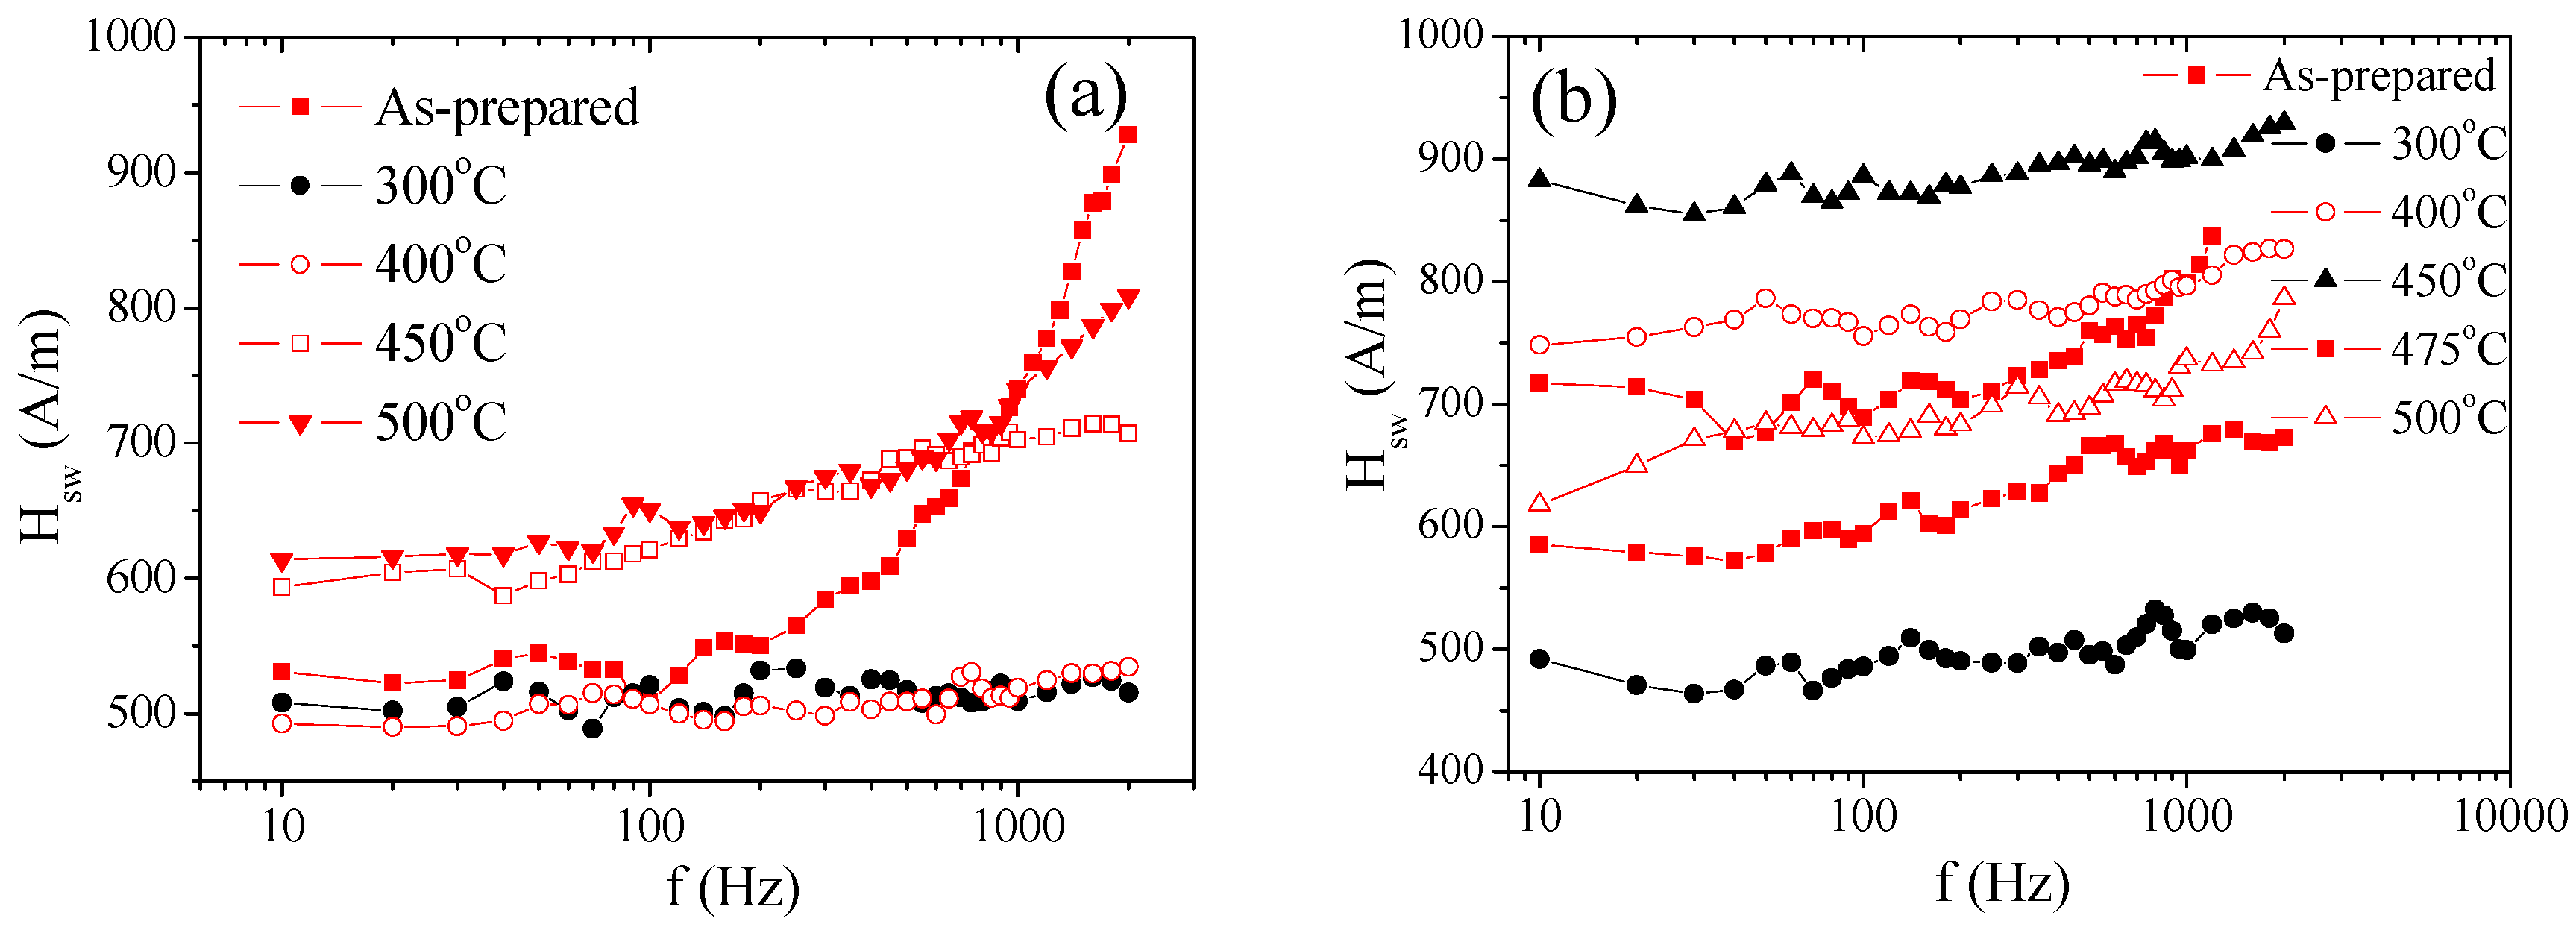
It is worth mentioning that the annealing treatment affects the switching field,
Hsw, value. The annealing temperature,
Tann, dependence of the switching field is displayed in
Figure 12. The hysteresis loop shape remains rectangular for all annealing temperatures (see hysteresis loops of samples annealed at
Tann = 300 °C, 450 °C and 500 °C in
Figure 13).
A considerable magnetic softening is observed for both microwires after annealing at
Tann = 300–400 °C (see
Figure 12 and
Figure 13). It should be remarked that the rectangular character of hysteresis loops is due to the positive magnetostriction coefficient of both amorphous matrix and the α-FeCo nanograins. Consequently, studied Fe
38.5Co
38.5B
18Mo
4Cu
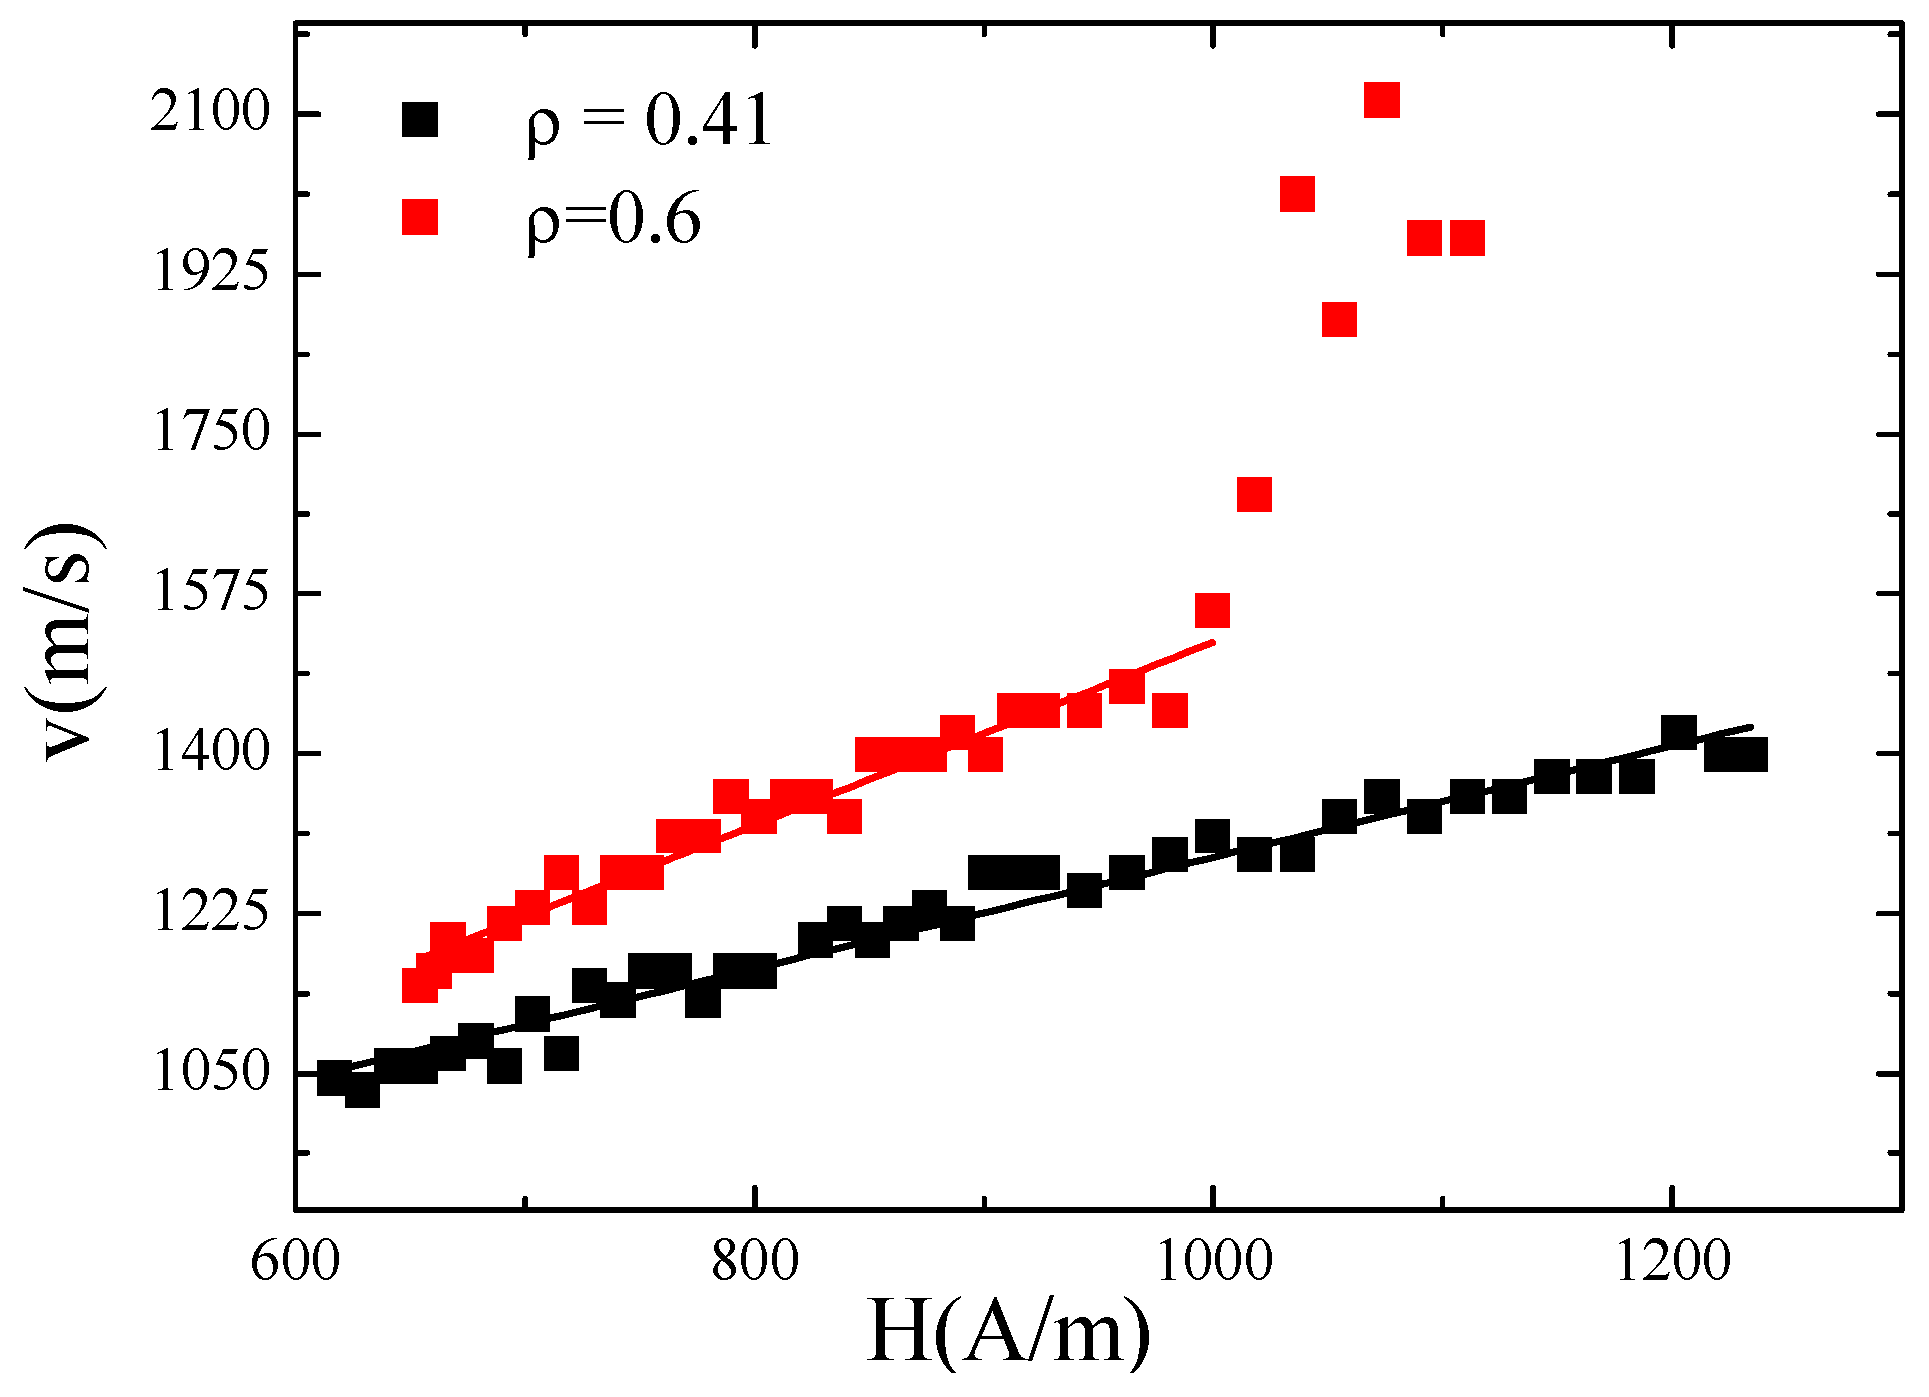
1 microwires present domain wall (DW) propagation typical for amorphous Fe-rich microwires. Dependencies of DW velocities on magnetic field of as-prepared Hitperm glass-coated microwires can be appreciated in
Figure 14. Studied Fe
38.5Co
38.5B
18Mo
4Cu
1 samples present rather fast DW velocities (above 1 km/s). Surprisingly, sample 2 presents the higher DW velocity (in spite of the higher coercivity).
Considering the above described strong influence of annealing conditions on magnetic properties of Fe
38.5Co
38.5B
18Mo
4Cu
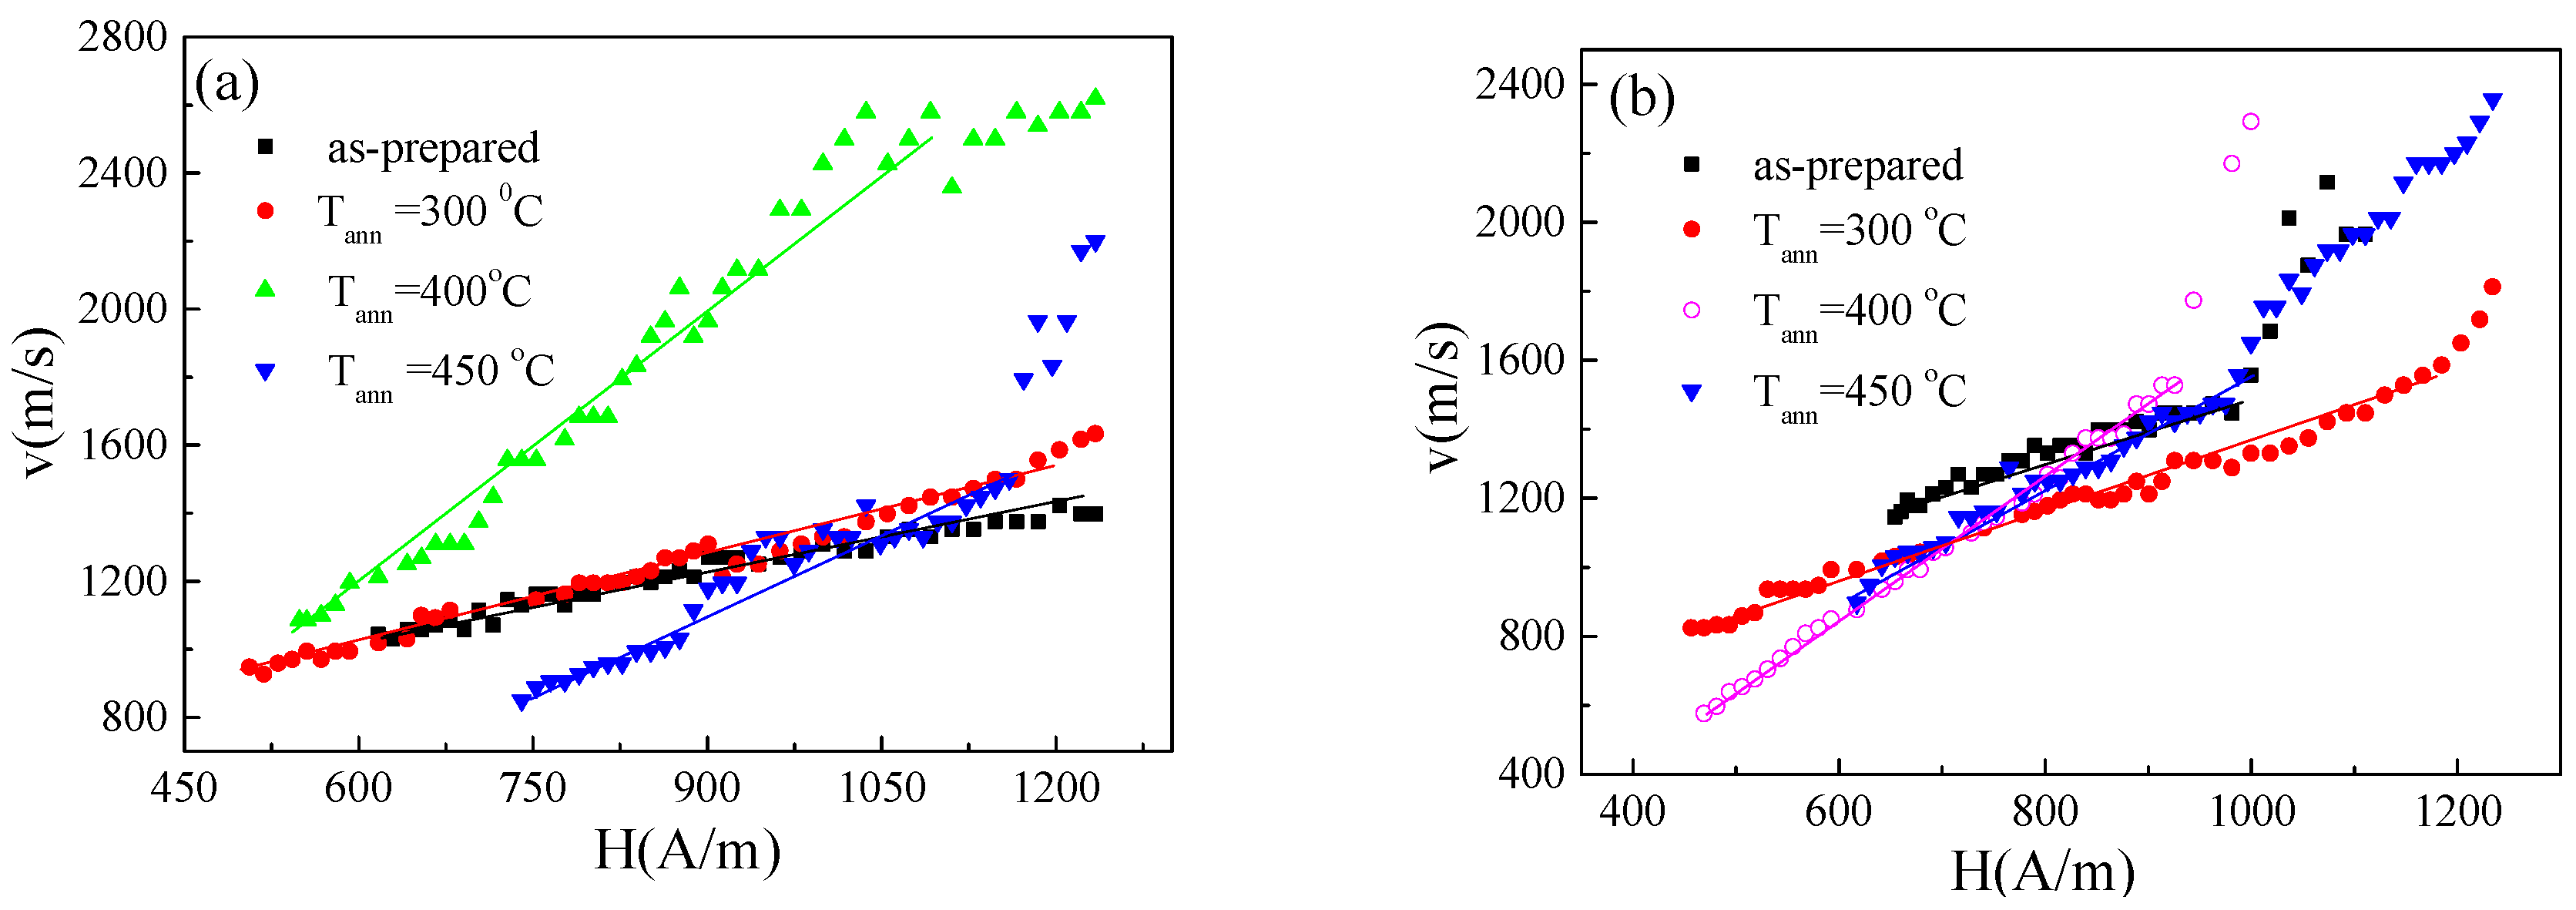
1 microwires, we studied the effect of annealing on DW dynamics (see
Figure 15).
As can be observed, the annealing process considerably affects v(H) dependencies of both studied samples. The common feature for both samples is the extended magnetic field range where linear v(H) dependencies are observed. Additionally, a great enhancement of DW velocity can be appreciated for the sample with
ρ = 0.41 annealed at 400 °C (
Figure 15a).
The non-linear v(H) dependencies observed in both samples (
Figure 14 and
Figure 15) can be ascribed either to multiple DW nucleation at defects and/or the change of the domain structure from transversal to vortex-type.
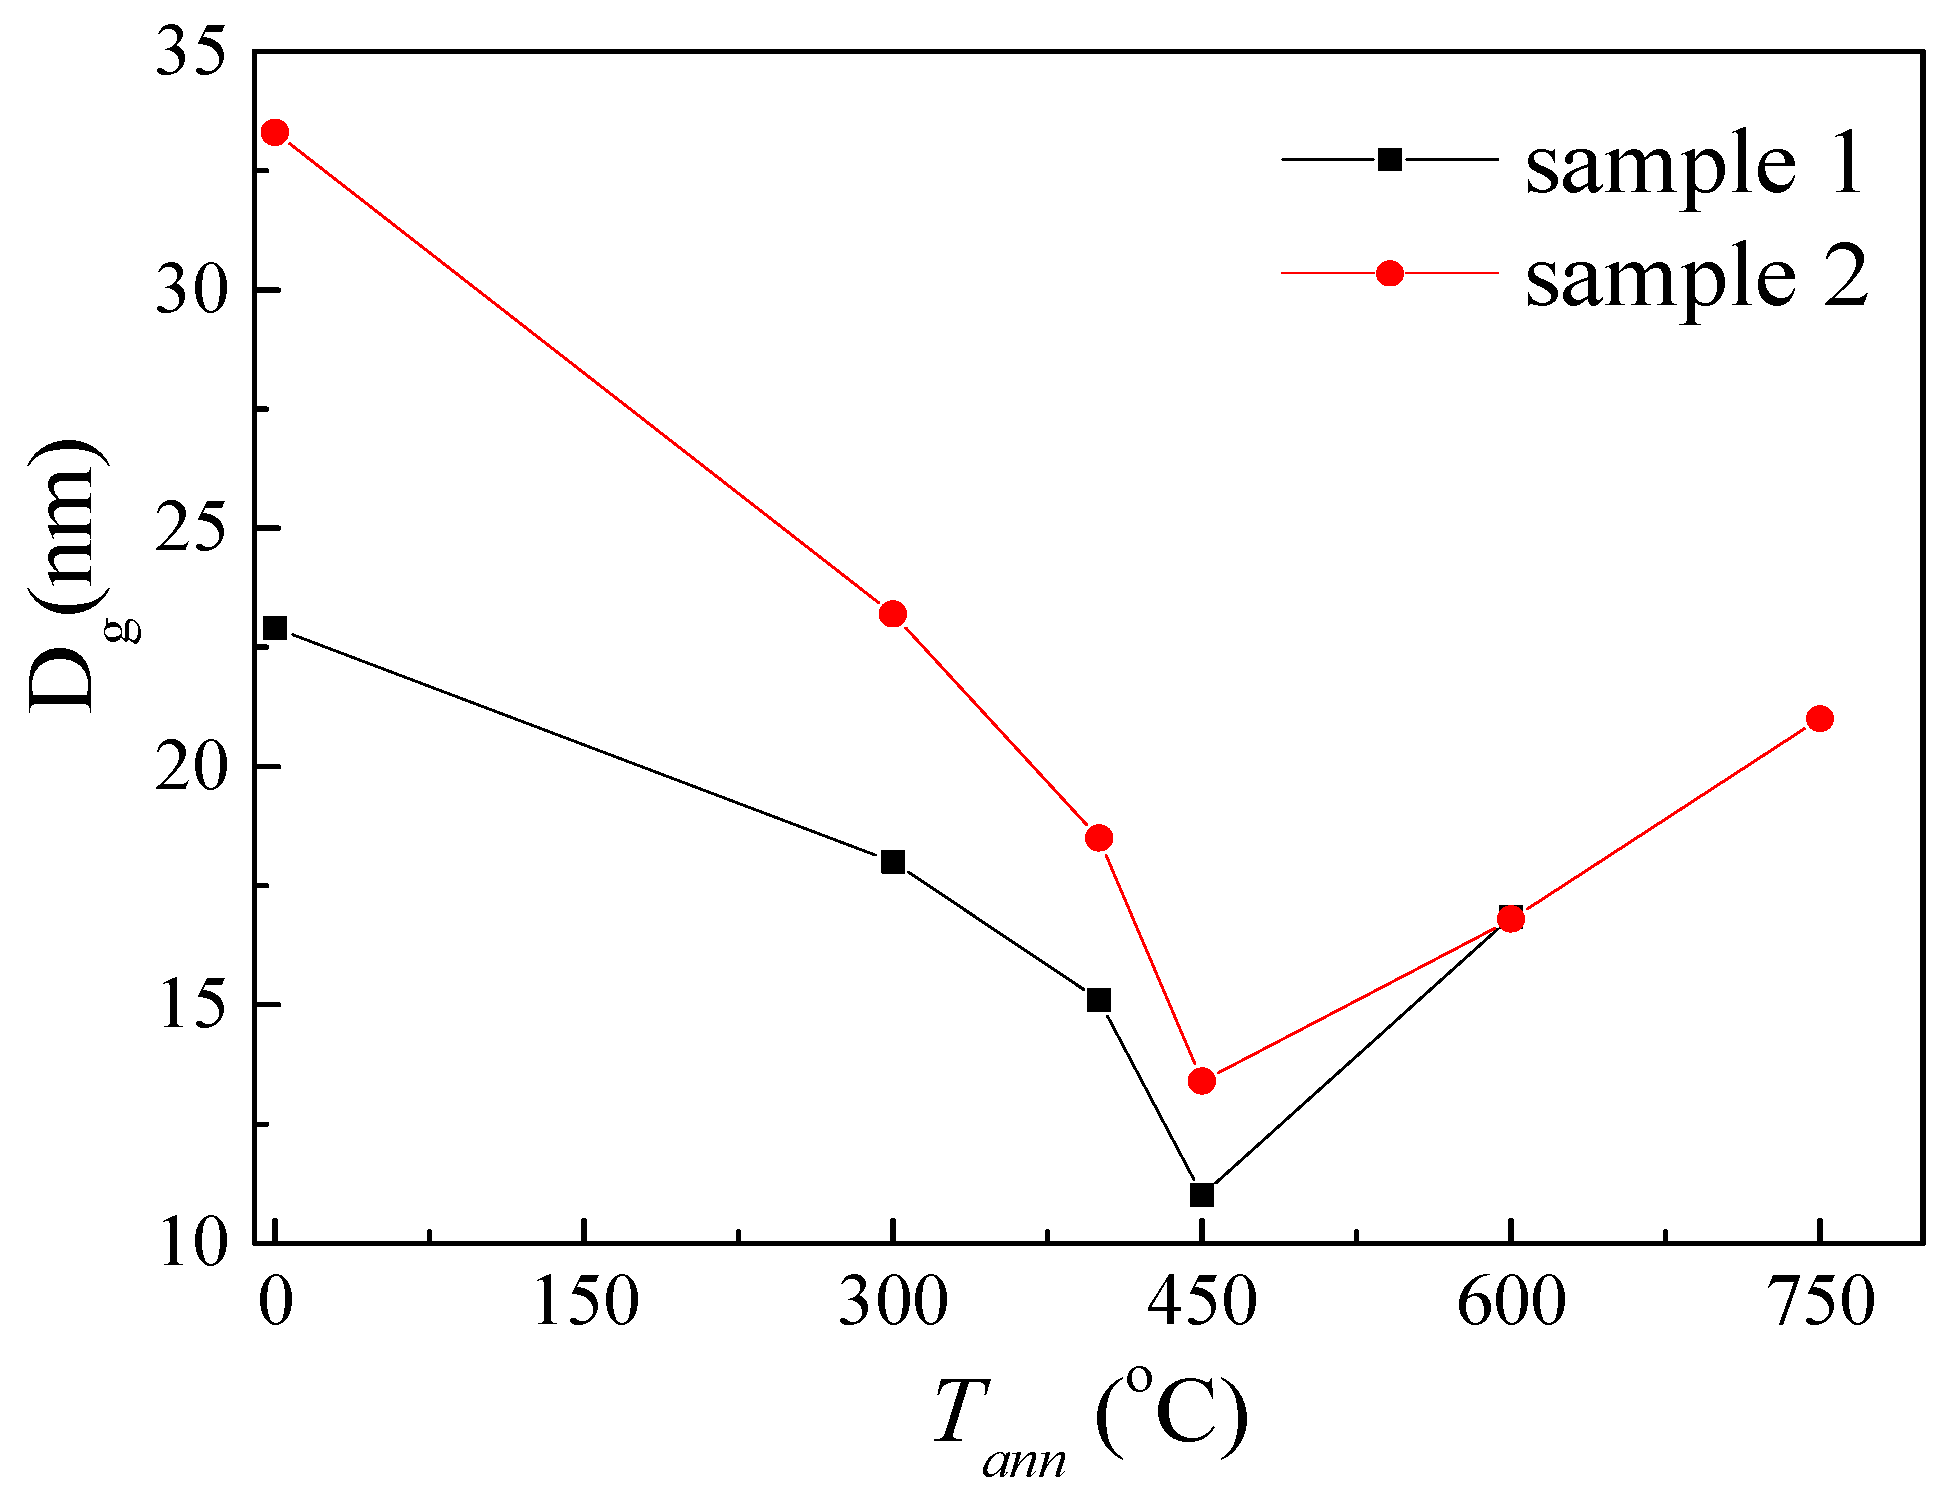
In order to understand the reason for the observed dependence of
Hsw (Tann) we evaluated (for all annealed samples) the XRD patterns measured at different annealing temperatures for 1 h. We calculated the average grain size,
Dg, following the same procedure as mentioned above. From
Figure 16, it can be appreciated that a noticeable average grain size decrease of BCC α-FeCo grains takes place after annealing.
The observed Dg(Tann) dependence can explain the considerable magnetic softening and DW velocity enhancement observed after annealing both samples.
Additionally, magnetic hardening observed in
Figure 12a,b) for
Tann ≥ 400 °C correlates well with
Dg(Tann) dependence, i.e., with average grain size increasing for T
ann ≥ 450 °C.
It is worth mentioning that the magnetic field dependence of DW velocity in a viscous regime can be described by the linear function by the following equation [
71,
72]:
where
S is the DW mobility,
H is the axial magnetic field, and
H0 is the critical propagation field, below which the domain wall propagation is not possible. The domain wall mobility
S is proportional to the domain wall width δ
w [
71]:
where
A is the exchange stiffness constant and
K is the magnetic anisotropy constant. Consequently, the DW velocity and mobility are strongly affected by the magnetic anisotropy. Observed grain size refinement can be explained considering the decreasing of the magnetocrystalline anisotropy. Indeed, it is commonly accepted that in nanocrystalline materials consisting of fine nanograins (with grain size about 10–20 nm) embedded in a residual amorphous matrix the magnetic softening is originated by vanishing of the magnetocrystalline anisotropy [
20,
21,
22,
23].
Additionally, the common way for the internal stress relaxation allowing the decreasing of the magnetoelastic anisotropy given by Equation (3) is the thermal treatment. Consequently, an enhancement of DW velocity in amorphous microwires after the internal stress relaxation is reported [
71].
Remarkable grain size refinement can be understood considering various possibilities. The first one can be related to the massive small grains nucleation in annealed samples during the devitrification giving rise to a decrease of the average grain size.
The other mechanism can be attributed to an unstable at room temperature structure of nanocrystallites obtained after rapid quenching from the melt. Consequently, development of the crystallization process after annealing can involve the dissolution of the unstable nanocrystallites, changes in the nanocrystallites composition, and the nucleation and growing of more stable nanocrystals [
73,
74]. This approach based on the thermodynamic analysis of the cluster model has been proposed for interpretation of the cluster structure evolution upon annealing. But it can be also extended for explanation of the evolution of structure of nanocrystalline Hitperm-like microwires after annealing. As a result, annealing of nanocrystalline microwires can result rather in the nucleation and growing of more stable new nanocrystals than the growing of the nanocrystallites inherited from the rapid quenching [
74].
Additionally, internal stresses arising from the glass coating, can affect the grain size of as-prepared microwires as well as the devitrification process.
It is worth mentioning that not only the switching field value,
Hsw, but also its frequency dependence is affected by annealing. Usually, for low magnetic field frequencies the
Hsw and
Hc are very close. A deviation from a perfectly rectangular hysteresis loop observed at elevated frequencies has been explained considering the counterbalance between the sweeping rate,
dH/dt, and the switching time related to the domain wall propagation through the entire microwire [
75,
76].
Figure 17 shows the switching field dependences on frequency of Fe
38.5Co
38.5B
18Mo
4Cu
1 microwires annealed at various temperatures. As can be observed from
Figure 17 annealing considerably affects
Hsw(f) dependencies of both samples: after annealing weaker
Hsw(f) dependencies are observed showing only a slight change of
Hsw upon
f increasing.
Such change in the switching field value can be understood in the terms of the internal stresses relaxation and the development of the devitrification process [
74].
Concluding, in Hitperm-type microwires prepared using Taylor-Ulitvosky method the nanocrystalline structure has been obtained directly after casting. All Hitperm-type (as-prepared and annealed) present rectangular hysteresis loops, a high DW velocity up to 2.5 km/s and relatively high DW mobility. Considerable influence of heat treatment on the DW dynamics and frequency dependence of the switching field might be interpreted considering the stress relaxation process.
A magnetic softening and a considerable enhancement of the GMI ratio after the devitrification process have been observed in FINEMET-type FeCuNbSiB with nanocrystalline structure. We believe that FINEMET-type glass-coated microwires with higher saturation magnetization are good candidates for development of magnetic sensors and metacomposites applications.
4. Glass-Coated Microwires with Granular Structure
As mentioned above, rapid quenching technique can be successfully employed for the preparation of granular materials [
21,
22,
23,
24].
These granular or inhomogeneous materials typically formed by immiscible elements (Co, Fe, Ni)-(Cu, Pt, Au, Ag) attracted considerable attention since the beginning of 90s [
77,
78]. The main interest in granular materials is related to GMR, previously discovered in magnetic multilayered films [
79]. A substantial economic difference between multilayered thin films and granular materials is the preparation cost: multilayered materials must be fabricated with multisource MBE and sputtering. The high fabrication cost is an obstacle. On the other hand, granular materials can be fabricated with much simpler technology [
21,
22,
80].
The origin of the GMR effect in granular materials has been attributed to spin-dependent scattering of conduction electrons within the magnetic granules, as well as at the interfaces between magnetic and nonmagnetic regions [
77,
78]. These granular inhomogeneous solids can be prepared by different techniques including mechanical alloying and rapid quenching techniques [
21,
22,
80].
Conventional route for optimization of the GMR effect in granular inhomogeneous materials involves appropriate recrystallization of the prepared metastable alloys through the annealing, allowing formation of a structure consisting of magnetic nano-sized precipitations into conductive metallic matrix [
21,
22]. Formation of such structure is related to the phase diagram of the immiscible elements. Typically, at room temperature the ferromagnetic metals present quite low solubility in the metallic matrix. Consequently, rapidly quenched immiscible alloys at room temperature usually form a supersaturated solid solution [
21,
22].
During the last few years we employed aforementioned Taylor-Ulitovsky method for preparation of long glass-coated microwires from immiscible elements [
23,
81,
82,
83,
84,
85].
Below we’ll review the fabrication of granular (Co-Cu and Fe-Cu) glass-coated microwires and ways of optimization of aforementioned GMR effect (see compositions in
Table 3).
Co
xCu
100-x (5 ≤ x ≤ 40 at. %) and Cu
63Fe
37 glass-coated microwires (total diameters, D, up to 80 μm) consisted of metallic nucleus (diameters, d, 1–50 μm) covered by insulating glass shell (thickness from 0.5 μm to 20 μm) have been prepared by the Taylor-Ulitovsky method [
38,
81,
82,
83,
84,
85].
Magnetoresistance (MR) has been defined as:
4.1. Granular Co-Cu Microwires
As a rule, as-prepared CoxCu100-x microwires present relatively low GMR (below 10%) effect.
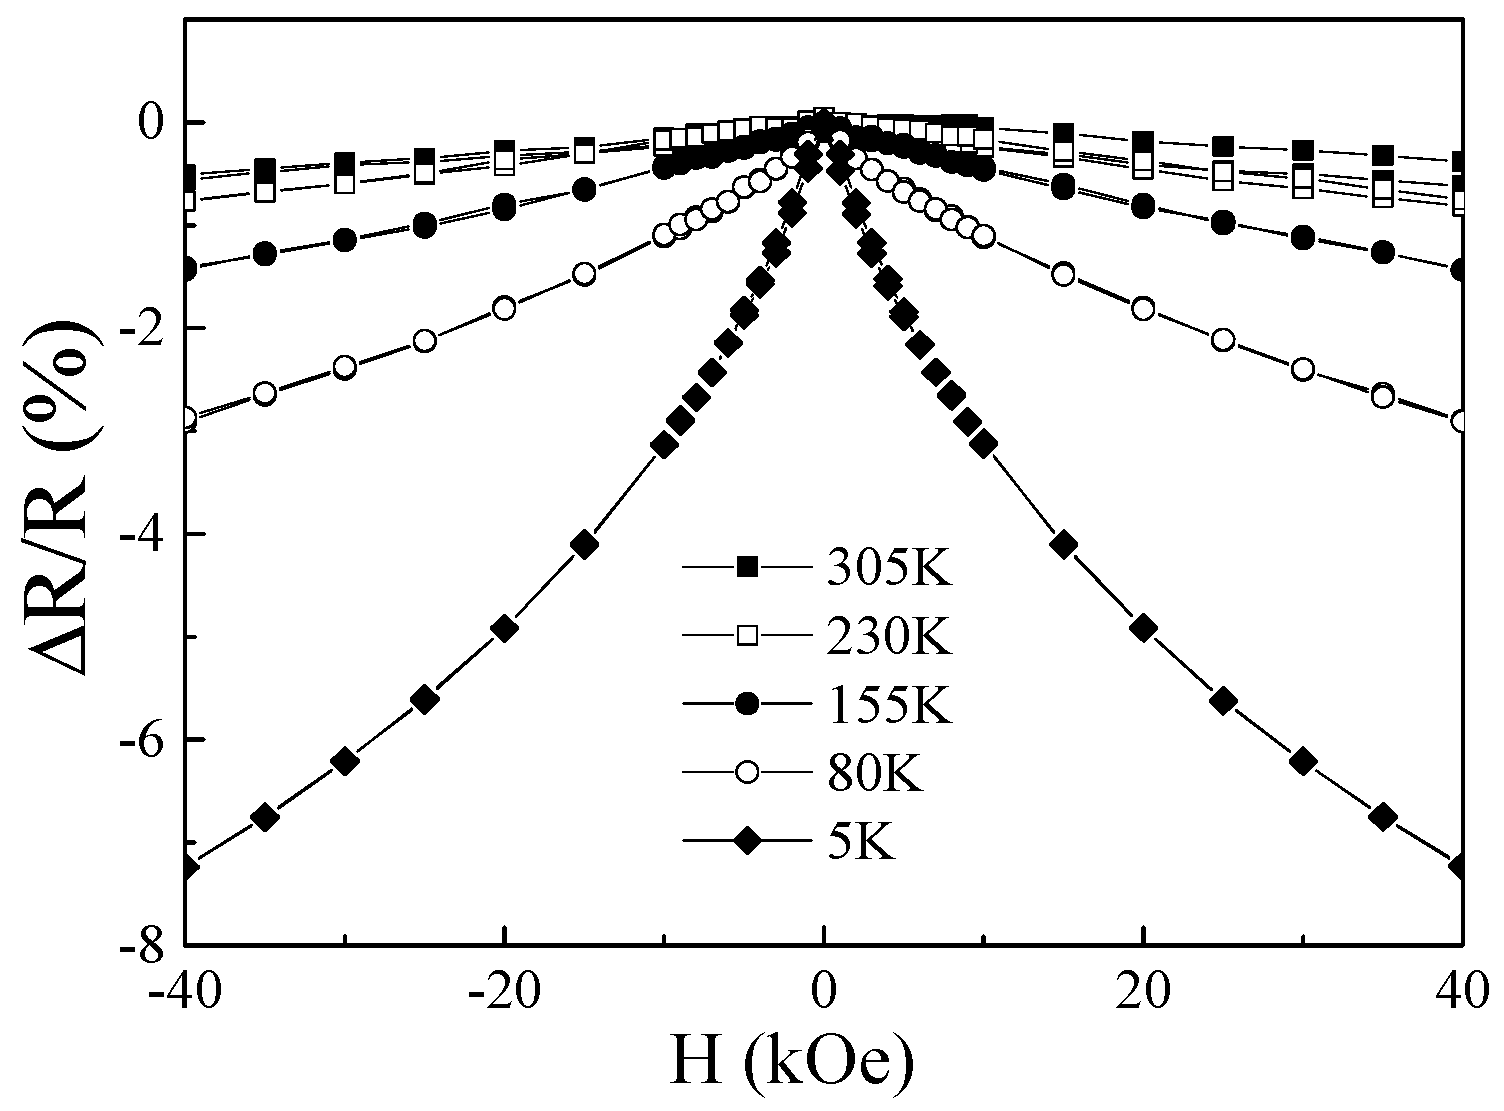
Typical ∆
R/
R(H) dependence measured in as-prepared Co
20Cu
80 microwires is shown in
Figure 18.
The observed ∆R/R(H) dependences present a monotonous decay with H, usually attributed to the existence of single domain ferromagnetic particles embedded in an immiscible medium.
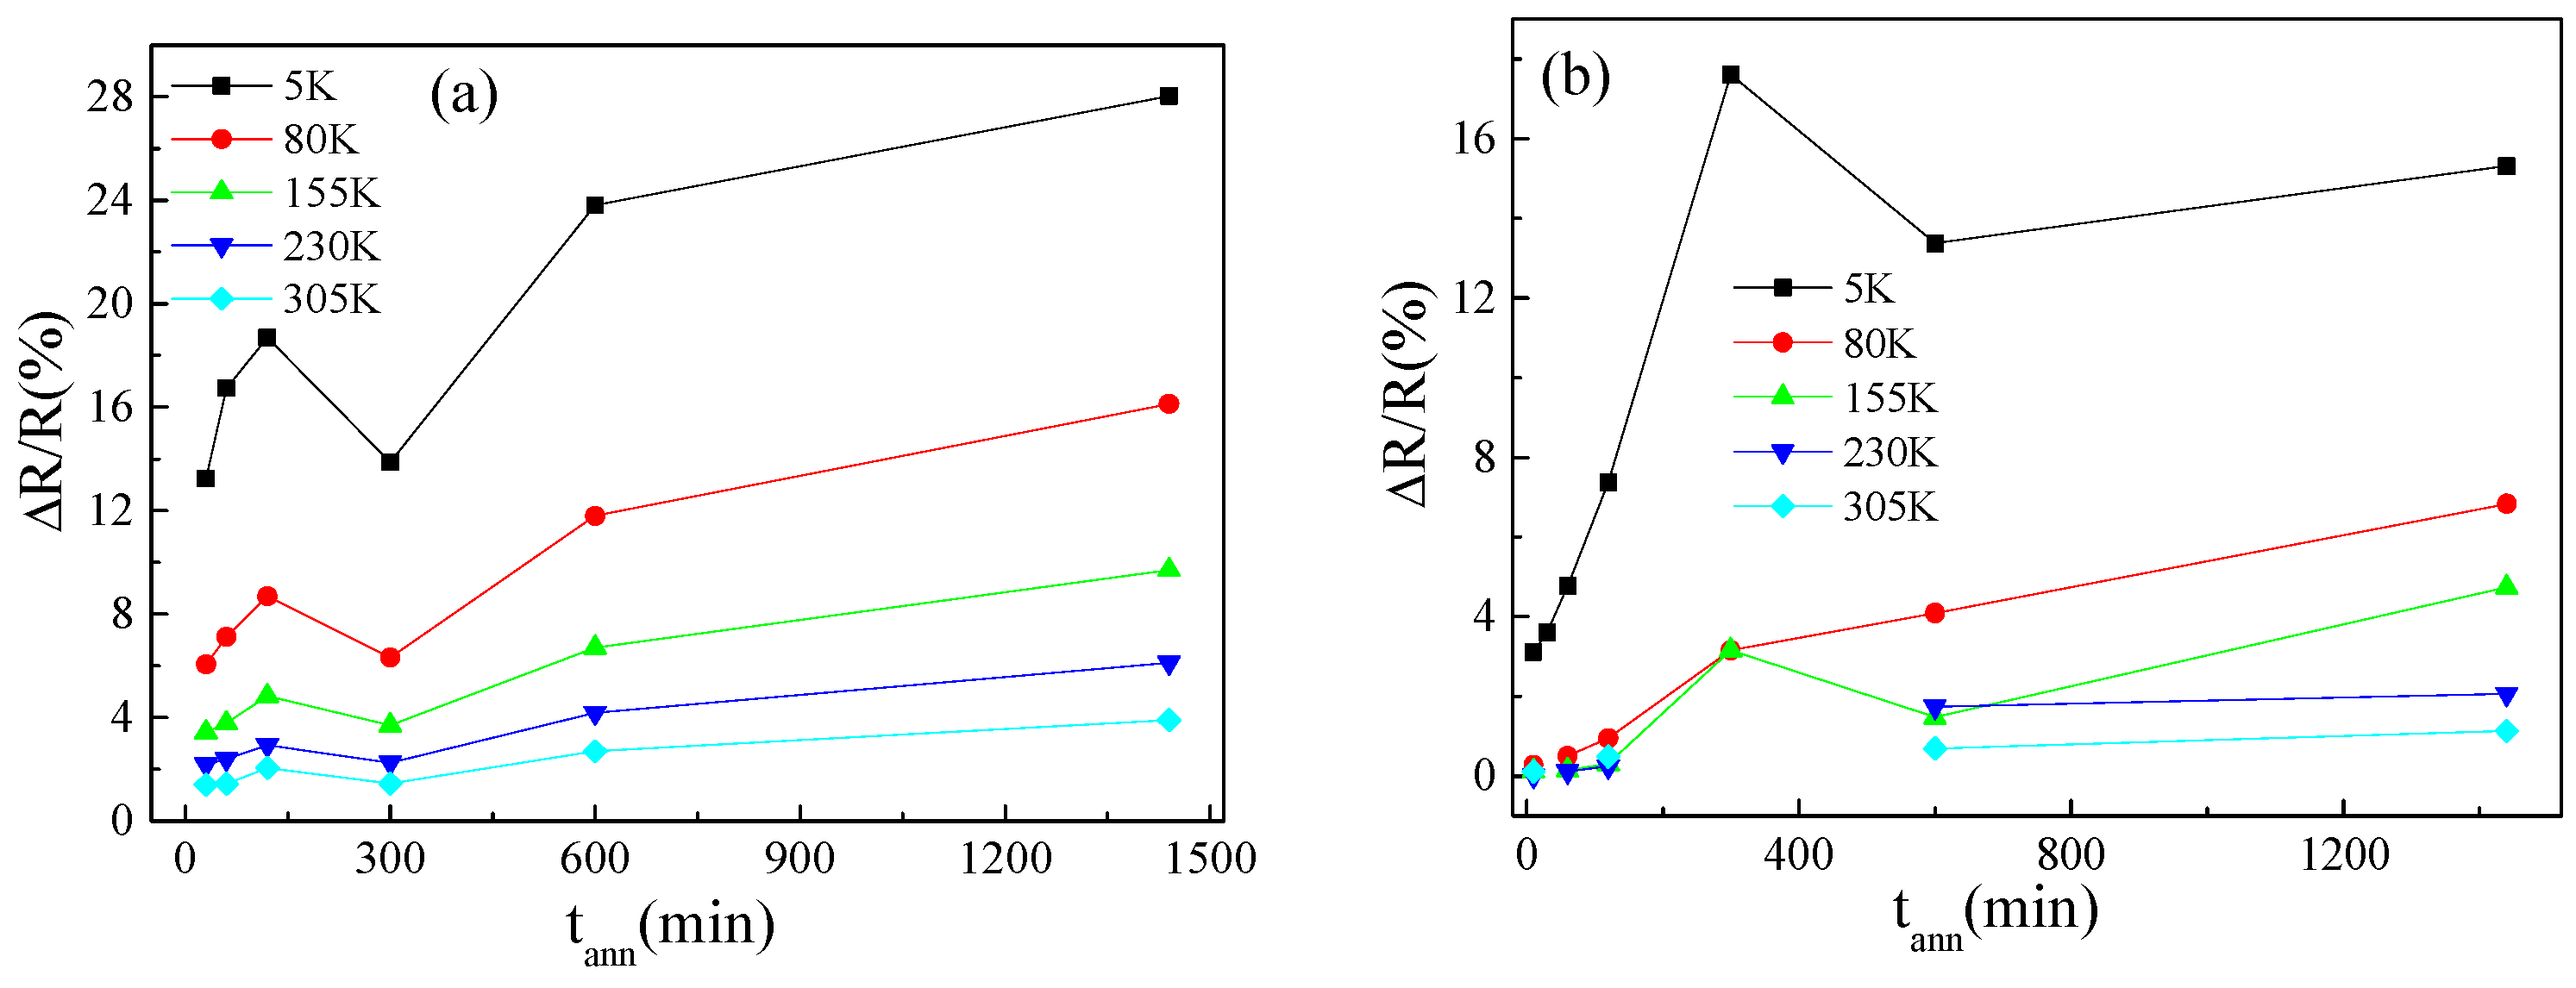
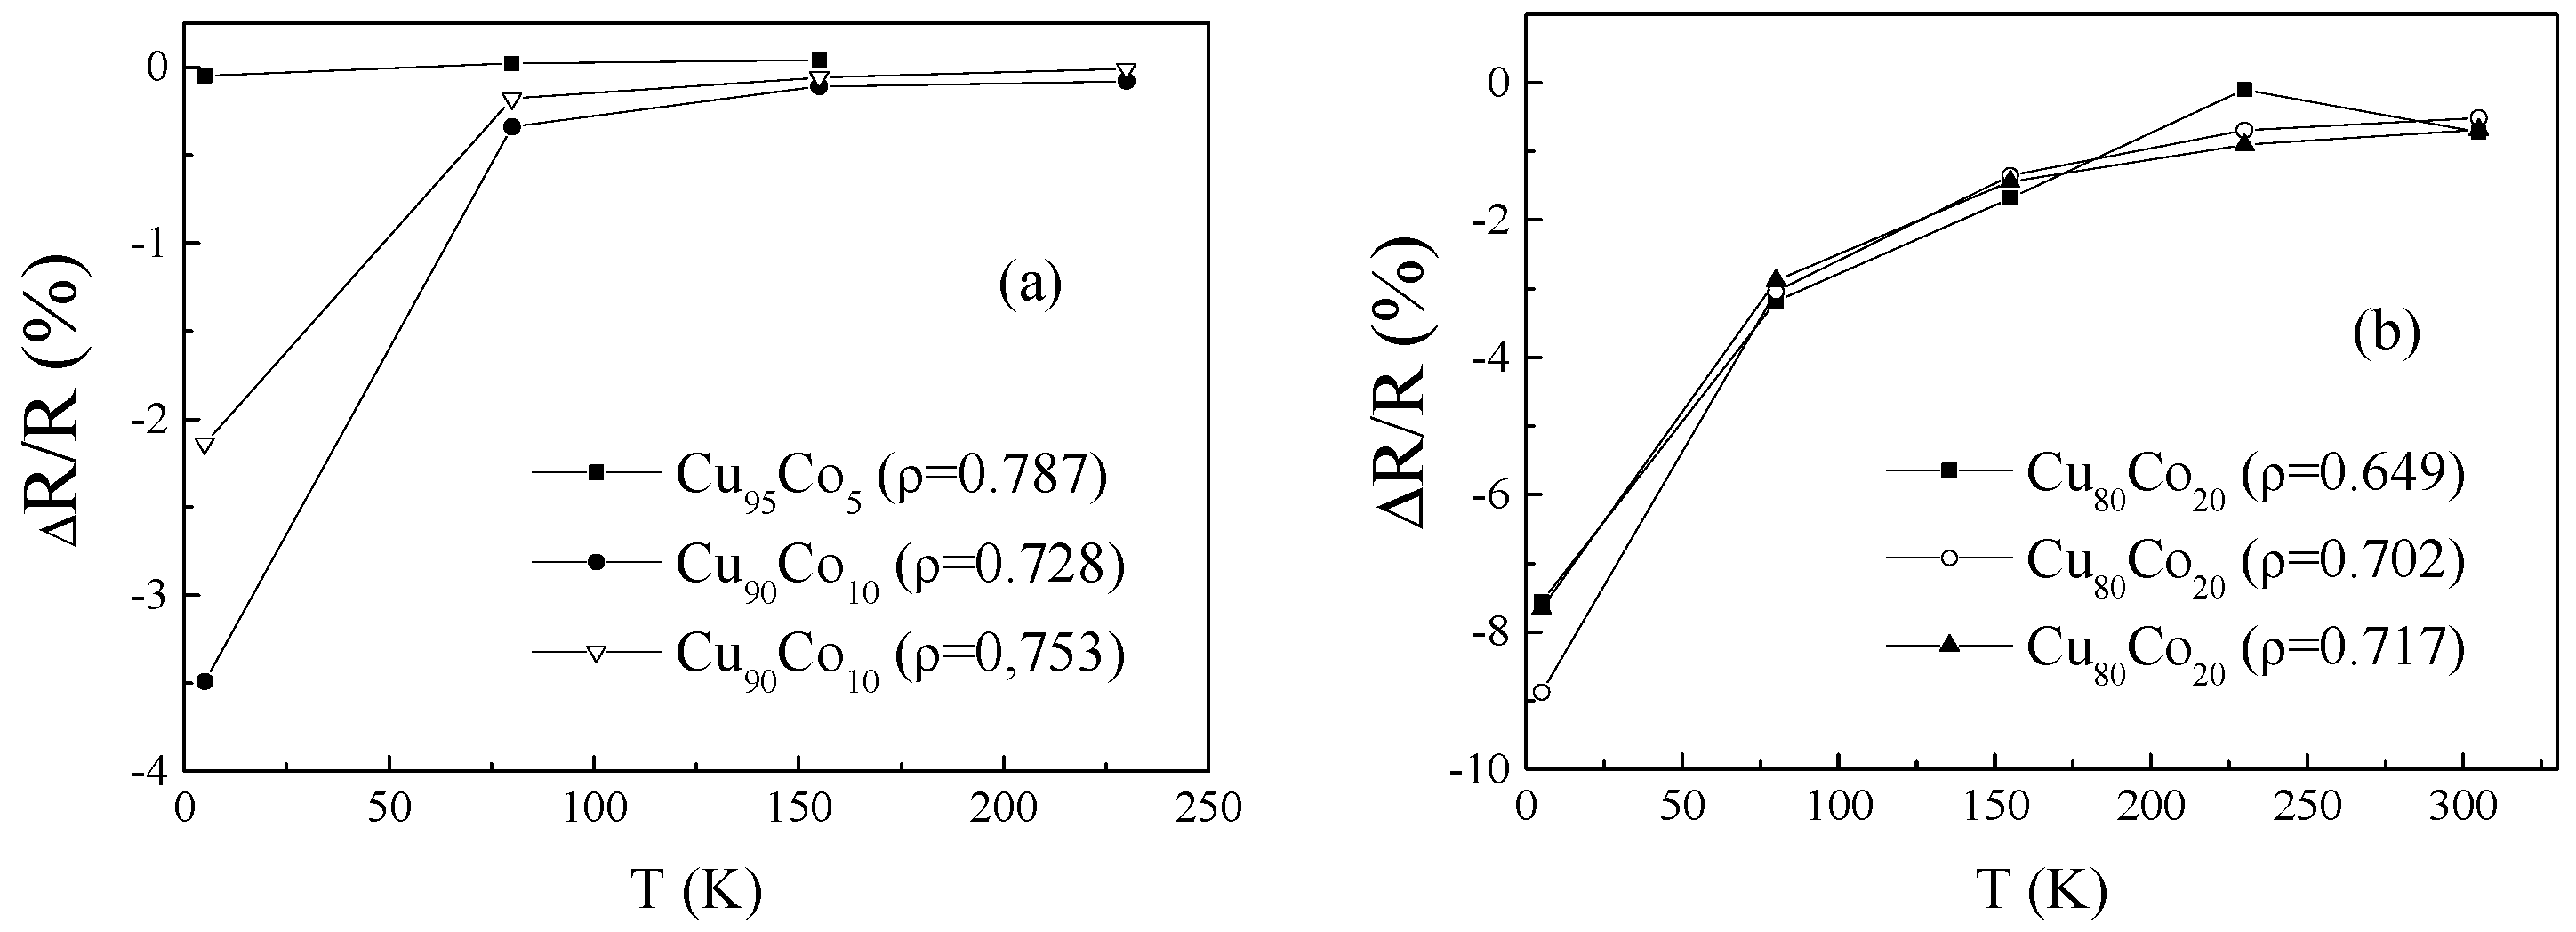
Figure 19 shows ∆
R/
R dependence with the temperature of annealing. We observed an increasing of the MR in Co
10Cu
90, Co
10Cu
90 and Co
20Cu
80 microwires with the decreasing of temperature, T (
Figure 19a,b).
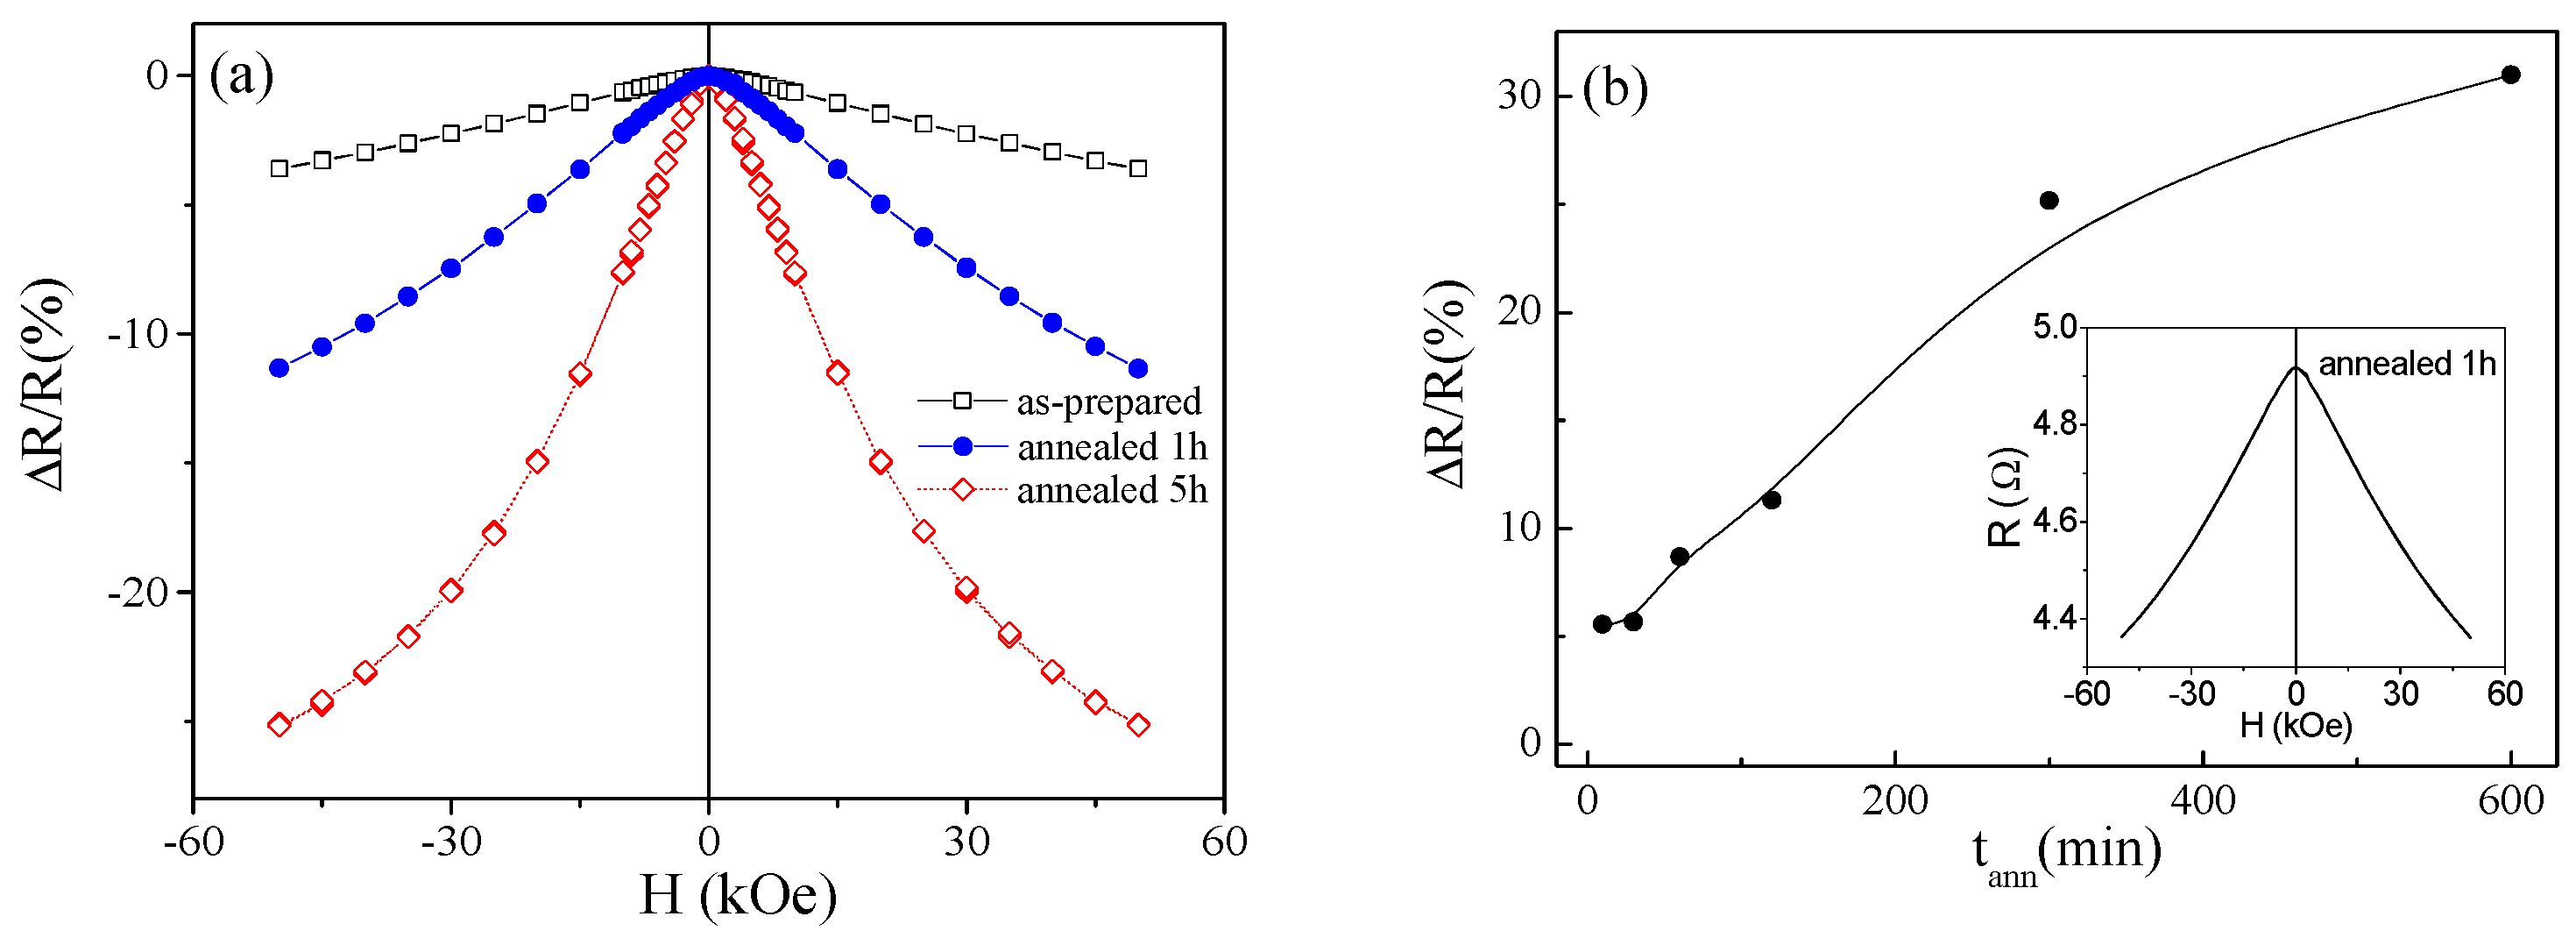
After annealing we observed gradual increasing of ∆
R/R (see in
Figure 20a a comparison of ∆
R/R(H
) for as-prepared and annealed at 400 °C for
tann = 1 h and 5 h Co
10Cu
90 microwires). After long enough annealing we observed increasing of ∆
R/R up to 32% (see
Figure 20b). Similar behavior has been observed for Cu
95Co
5 and Cu
80Co
20 microwires (
Figure 21) [
83,
84]. The highest value of ∆
R/R ≈ 32% is observed for Cu
90Co
10 microwires.
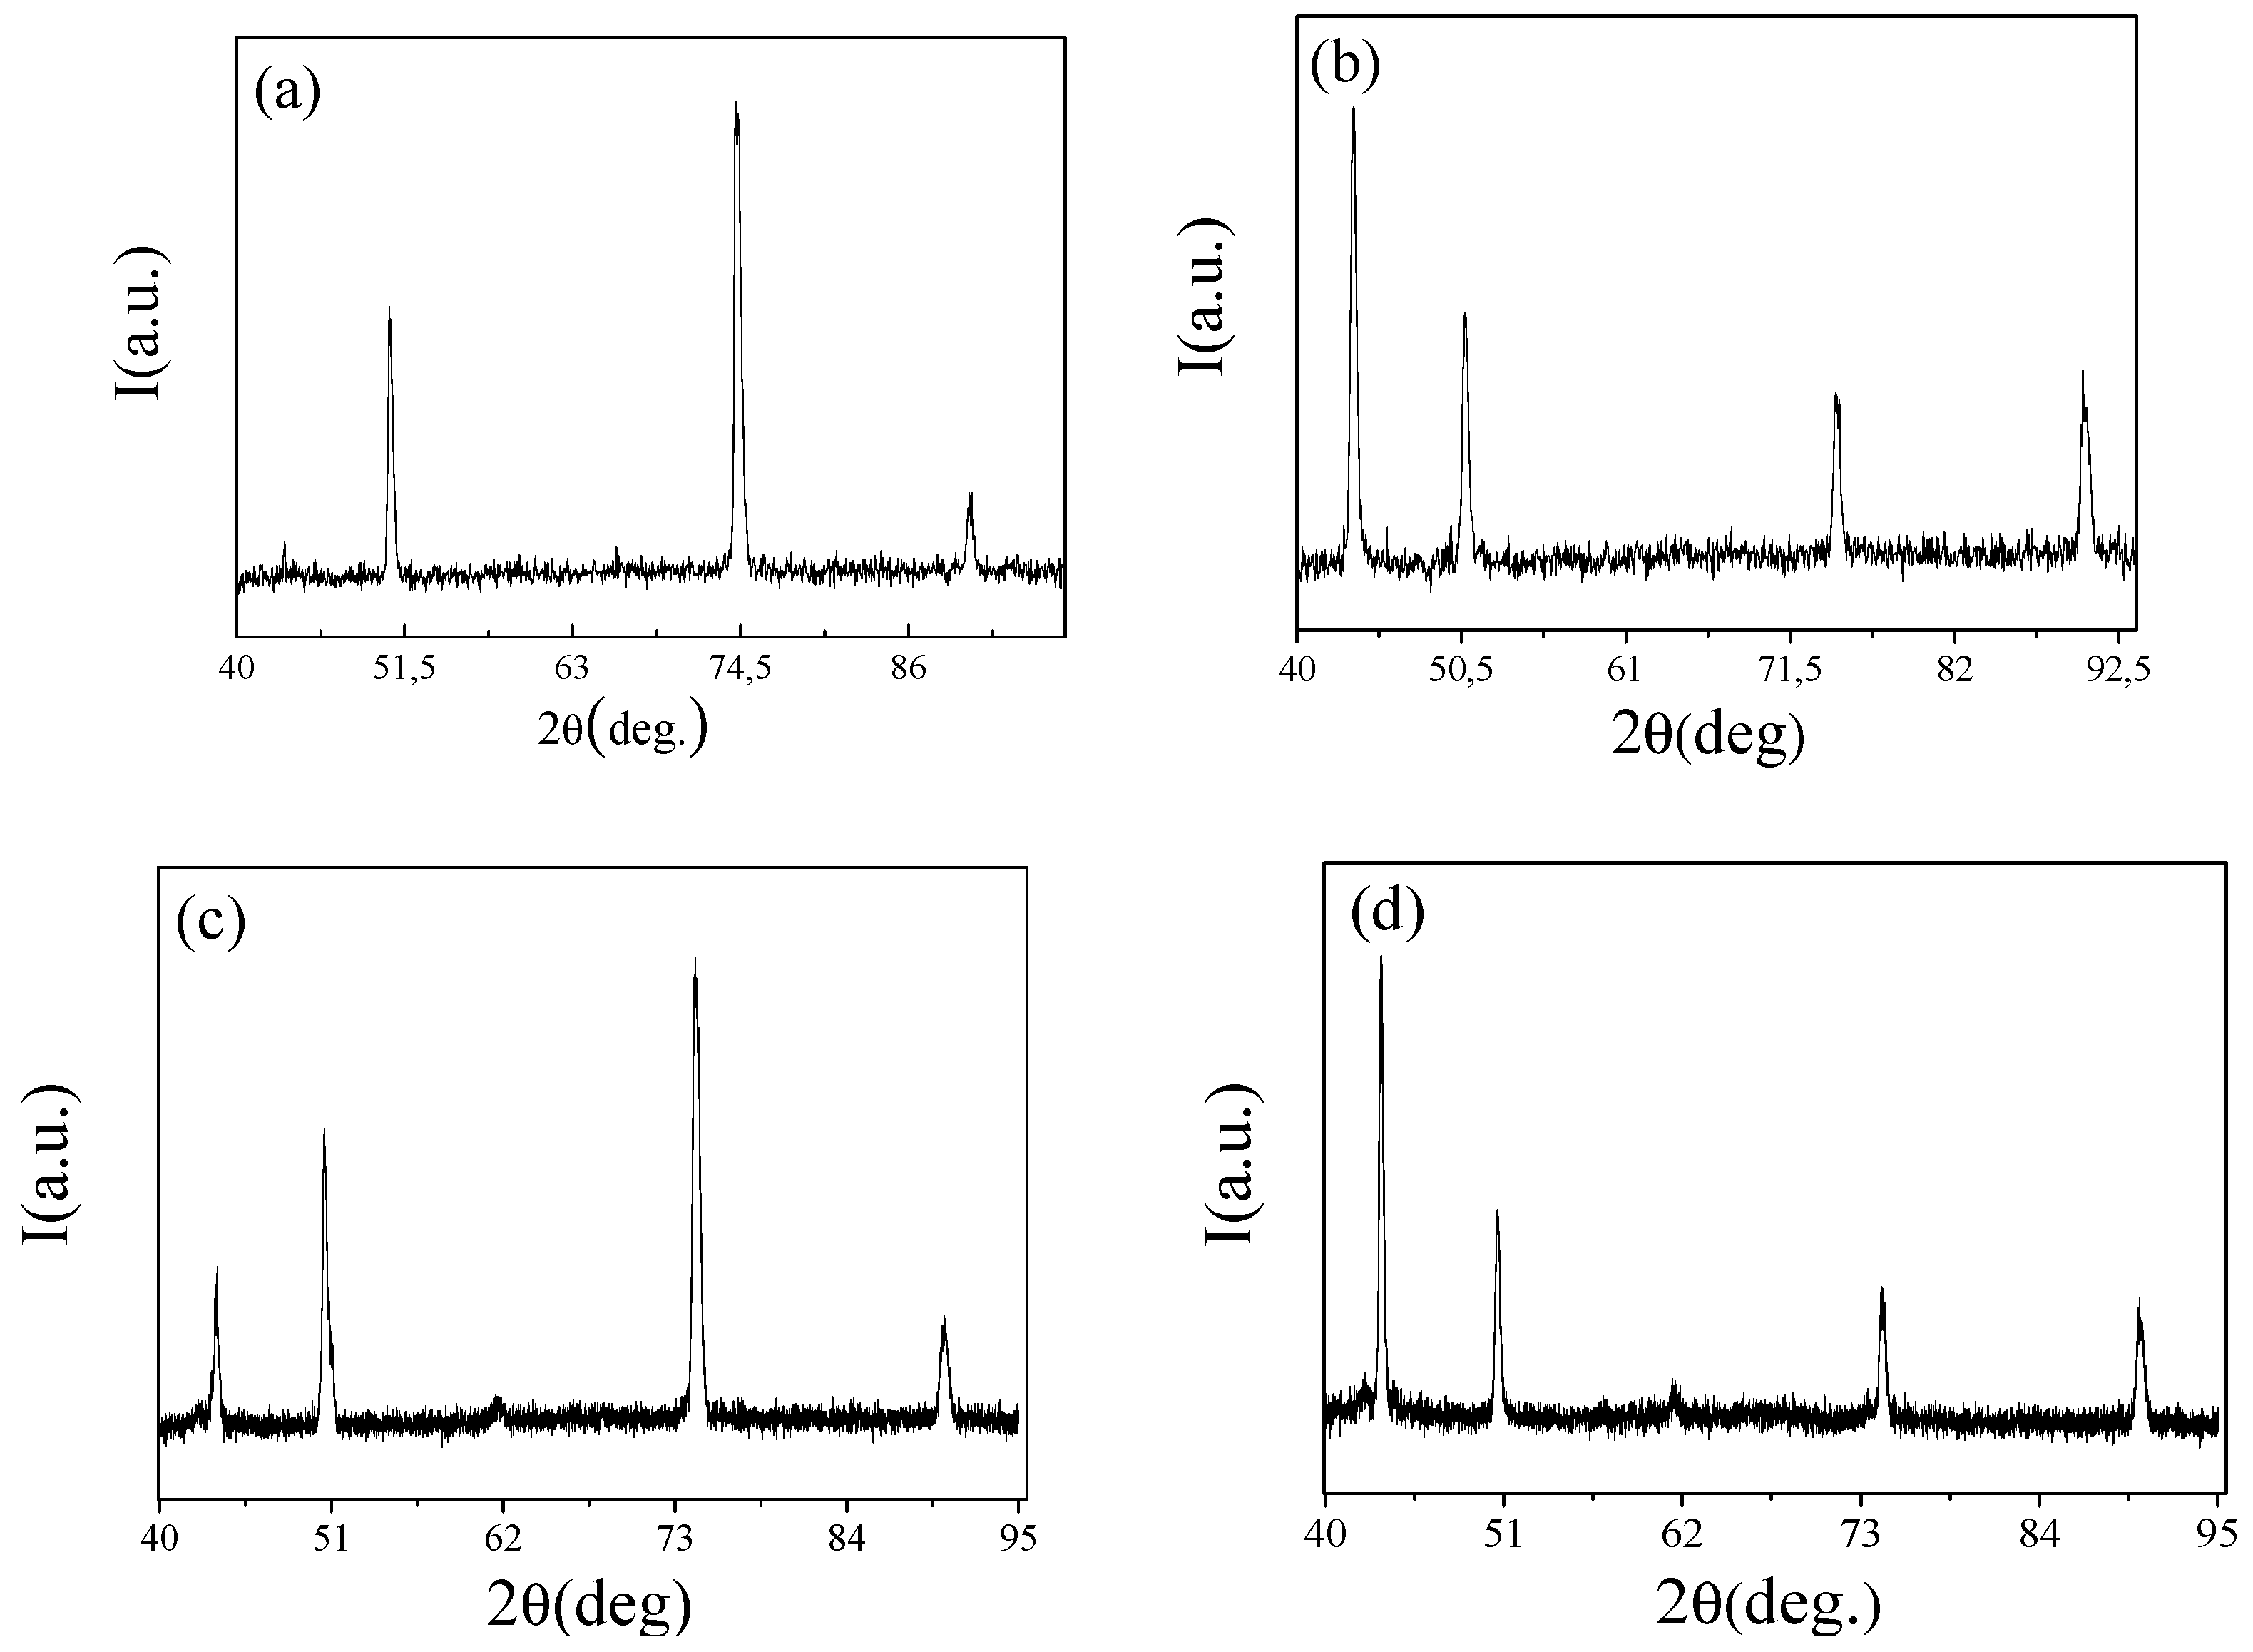
From X-ray diffraction (XRD) spectra we identified two phases: the main one, fcc Cu phase (lattice parameter 3.61 Ǻ), found in all samples and small amount of hcp Co phase (lattice parameters 2.51 Ǻ and 4.07 Ǻ), obtaining an evaluation of the grain size between 20 and 40 nm. The grain size, Dg, of the crystals formed in each case was derived using Debye- Scherrer’s Equation (4).
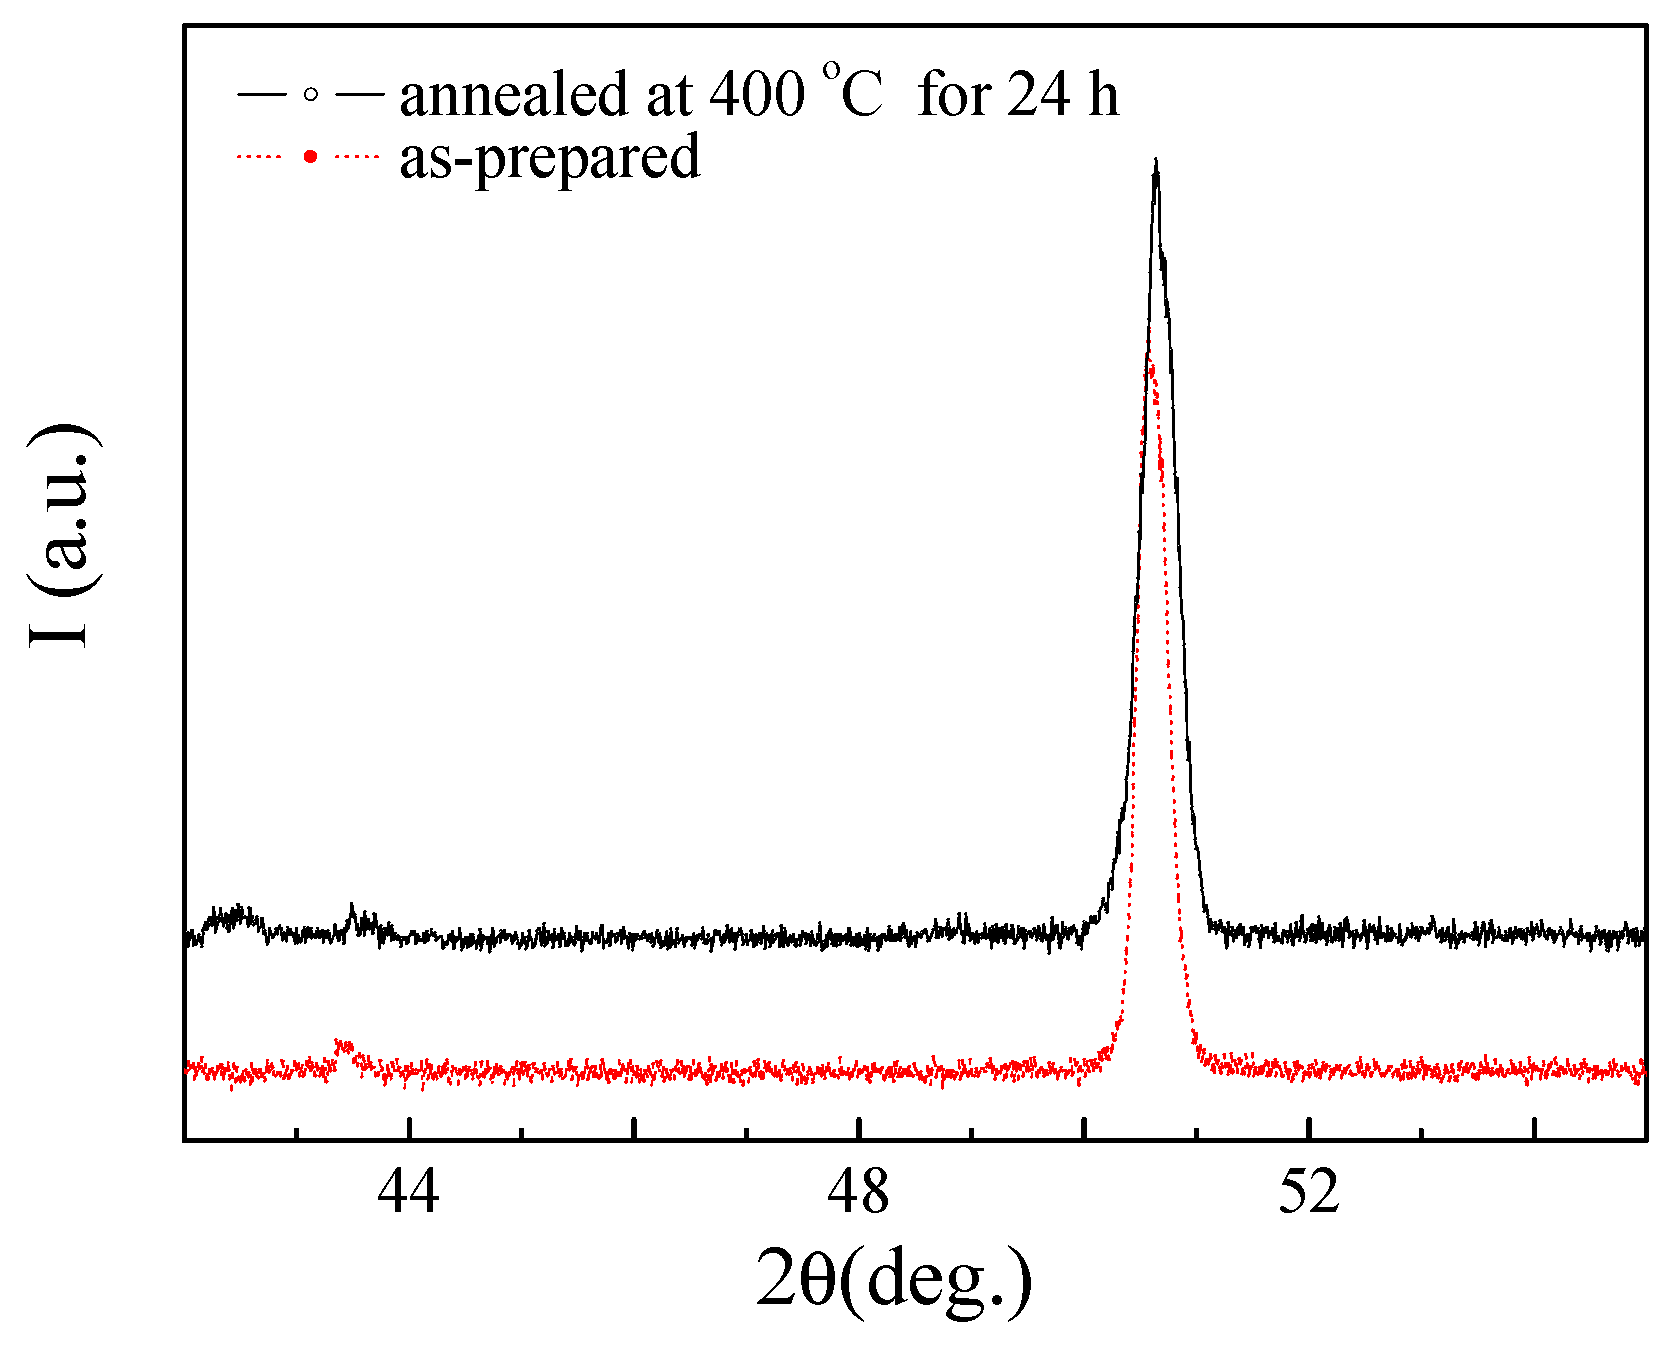
Most influenced by annealing is the sample with composition Cu
95Co
5 (
Figure 22a and
Figure 23a). After annealing of the sample Cu
95Co
5 we can observe decreasing of the preferred orientation. The first peak is appreciably increased and the relative intensities change with the annealing. In the very first peak we can observe merged peaks of both the Cu phase and the Co phase.
Annealing does not significantly affect the XRD of the Cu
80Co
20 microwire (
Figure 22b,d). The relative intensities of all the XRD peaks are almost the same in the as-prepared and annealed Cu
80Co
20 microwires. After annealing of the sample Cu
90Co
10 a remarkable preferred orientation persists. More detailed analysis of the Cu and Co peaks allowed the observation that the peaks become more separated after annealing.
The Co phase shows a diffraction peak which is very close to the Cu one (see
Figure 22 and
Figure 23) and, in fact, on those compositions with low Co concentrations, the Co peak is only seen as a shoulder in the high angle side of the Cu peak [
82]. The diffraction peaks of both phases in observed XRD scans are quite close to each other and even overlapped, as can be observed for Cu
90Co
10 microwire (see
Figure 23) and only a shoulder in the single peak corresponding to a small amount of the Co phase (presenting also small average grain size) can be observed in the main Cu peak. This fact is only observed when the peak in
Figure 23 is seen at very precise scale. The simple view of
Figure 23, where the annealed sample shows a wider peak than the as cast one in the high angle 2
θ side, leads to deduce the existence of the peak corresponding to the Co phase.
Then, we deduced considerable preferred orientation of the grains visible from the peak intensities. Usually the peaks at 2
θ ≈ 43.95° in Co-Cu granular alloys without texture present the highest intensity [
82].
After annealing, it can still be found a marked preferred orientation in the sample, although intensities of each peak change with the treatment. When we look into the details, we clearly observed a broadening of the peaks (especially for ones at 2
θ ≈ 50°, see
Figure 23) that must be attributed to the Co precipitation from the solid solution of Co in Cu matrix. This broadening has been estimated as 0.3° to 0.5° (in the high angle side of the peak) and this means that the concentration of the Co phase is increased with the annealing.
TEM investigations show granular microstructure in the case of only Cu
80Co
20 sample [
84,
85]. However, in the samples of Cu
90Co
10 and Cu
95Co
5 granular microstructures were not observed. Energy-Dispersive X-ray (EDX) analysis [
84,
85] showed that all grains belong to Cu-phase. There are areas within the Cu grains with increased Co content. Formation of the solid solution of Co in the Cu matrix that can be related to the fabrication method involving rapid quenching from the melt. The equilibrium Co-Cu phase diagram present low Co solubility in Cu (up to 8% at room temperature). Observed areas with larger Co concentration (above 10%) can be attributed to the relocated Co atoms in Cu matrix after spinodal decomposition as previously reported [
86].
Consequently, observed increasing of the GMR effect after annealing of CoCu microwires can be understood considering various processes:
- (A)
Annealing can release the internal stresses. In principle internal stresses relaxation can affect the metallic nucleus structure. However, the stress relaxation takes place at around 150–200 °C [
84,
85] and measurements made on the samples annealed at 150 °C do not show considerable change of GMR effect.
- (B)
Another potential explanation involves a spinodal decomposition in CuCo samples [
86] characterized by long parallel Co-excess stripes reported for Co-Cu ribbons.
The internal stresses are probably the source of considerable texture among all the samples.
It is worth mentioning that the maximum GMR ratio observed in annealed CoCu microwires (of about 32%) is similar to the GMR values reported for other granular and multilayered materials [
77,
78].
Reported GMR increasing does not seem to be related to the internal stress relaxation and must be related to the short range ordering processes.
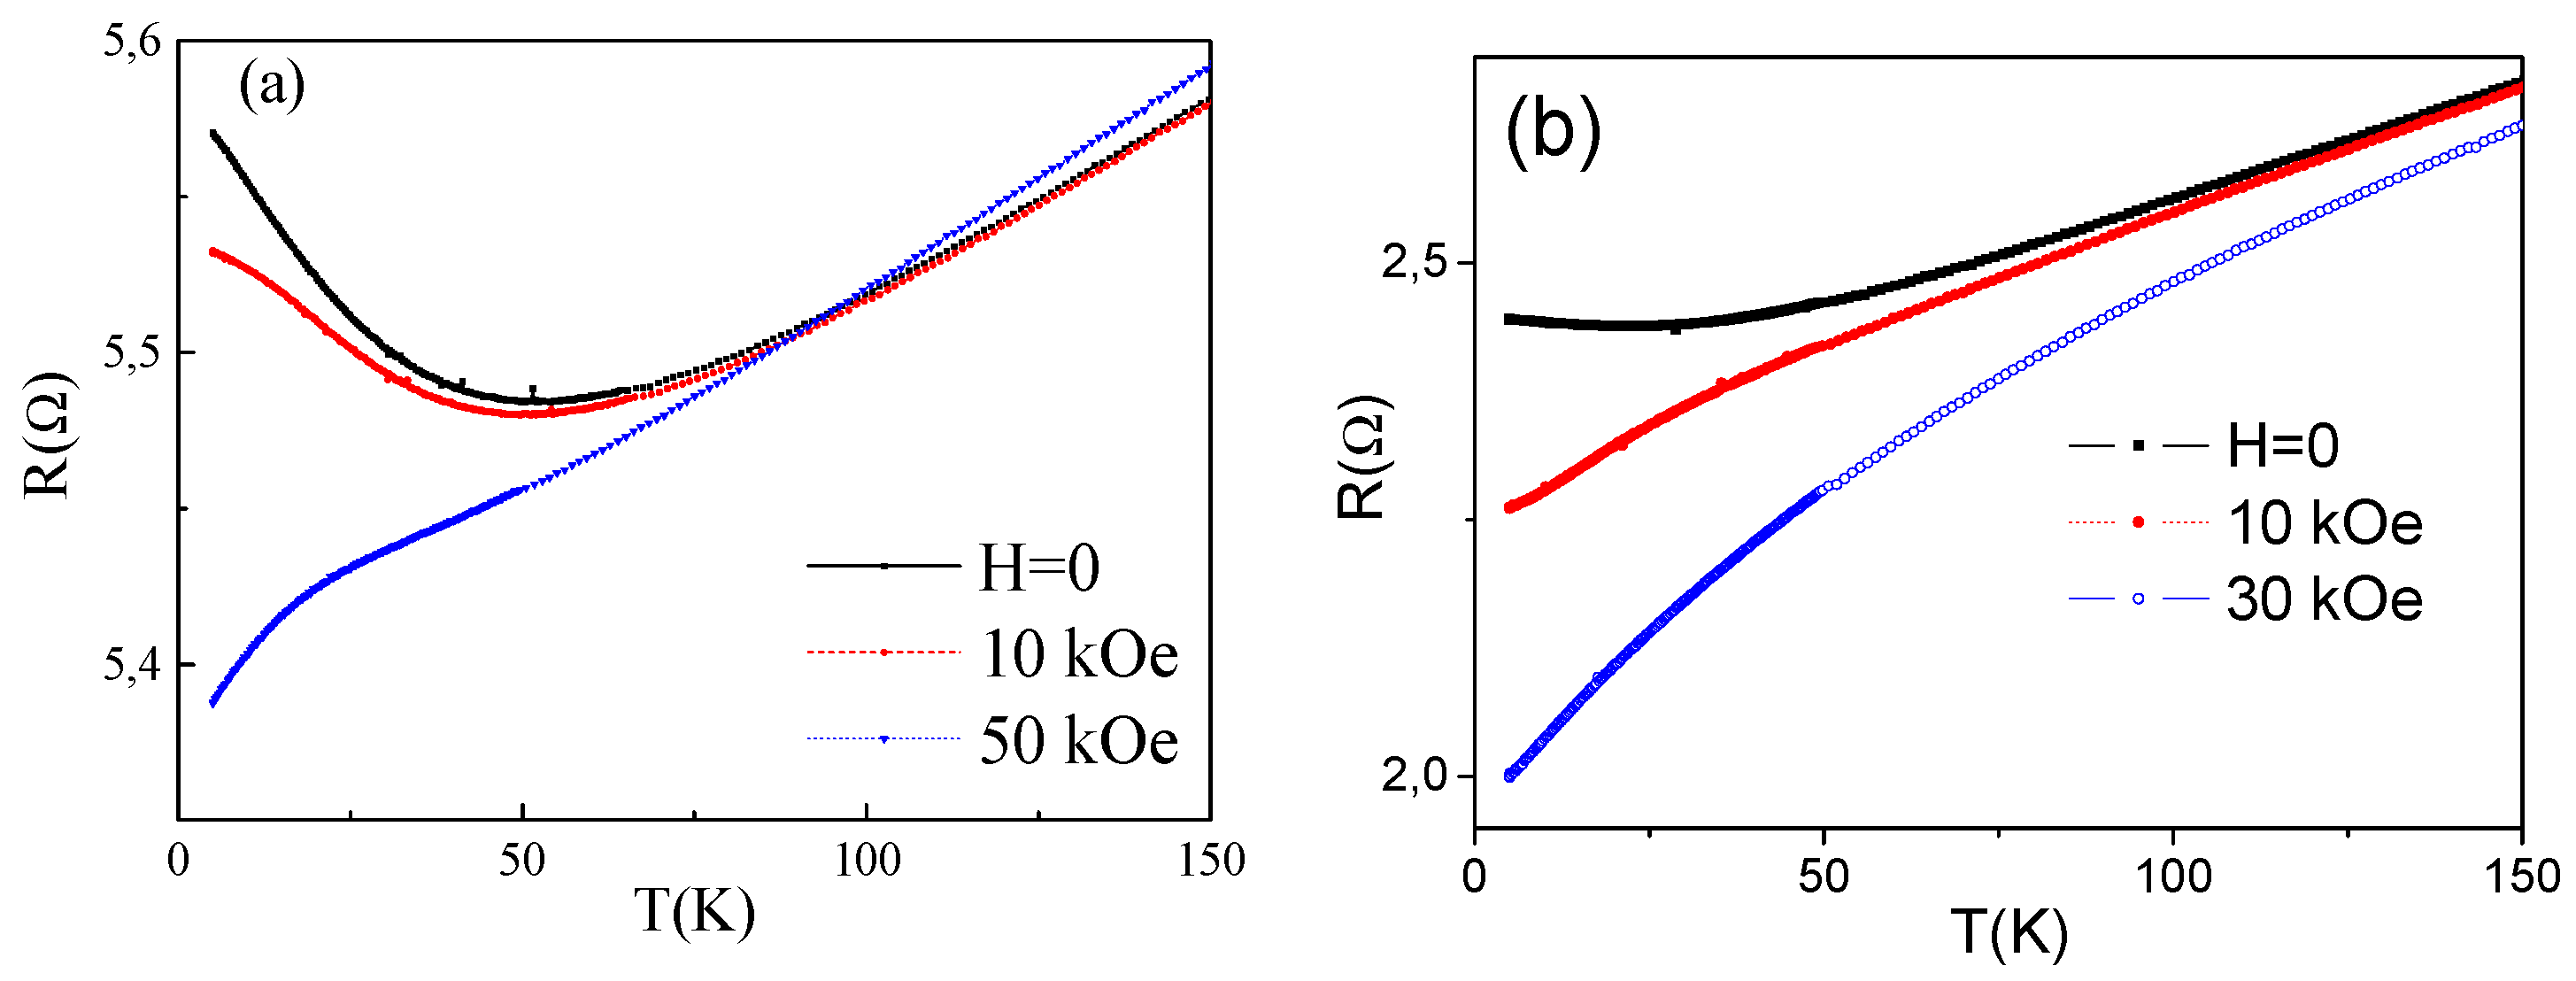
The other peculiarity of studied as-prepared Cu
95Co
5 and Cu
90Co
10 samples is that surprisingly they present well-defined resistivity minimum at rather high temperature (about 50 K for Cu
90Co
10, see
Figure 24). This minimum is affected by applied magnetic field, but in as-prepared sample can be totally suppressed by rather strong magnetic field (about 70 kOe). After annealing the resistivity minimum on
R(T
) dependence still persists, but this minimum can be suppressed by much lower magnetic field, i.e., by
H = 10 kOe (
Figure 24b).
Usually, the resistivity minimum is attributed to the Kondo effect related to the magnetic impurities in metals. But, classical Kondo-effect is usually observed in alloys with quite low content of magnetic impurities (0.002%–0.02%) and the scattering processes on these magnetic impurities could give rise to a resistivity minimum on
R(T
) dependence [
87]. Typically, in the case of classical Kondo effect, the magnetic field suppresses the resistivity minimum.
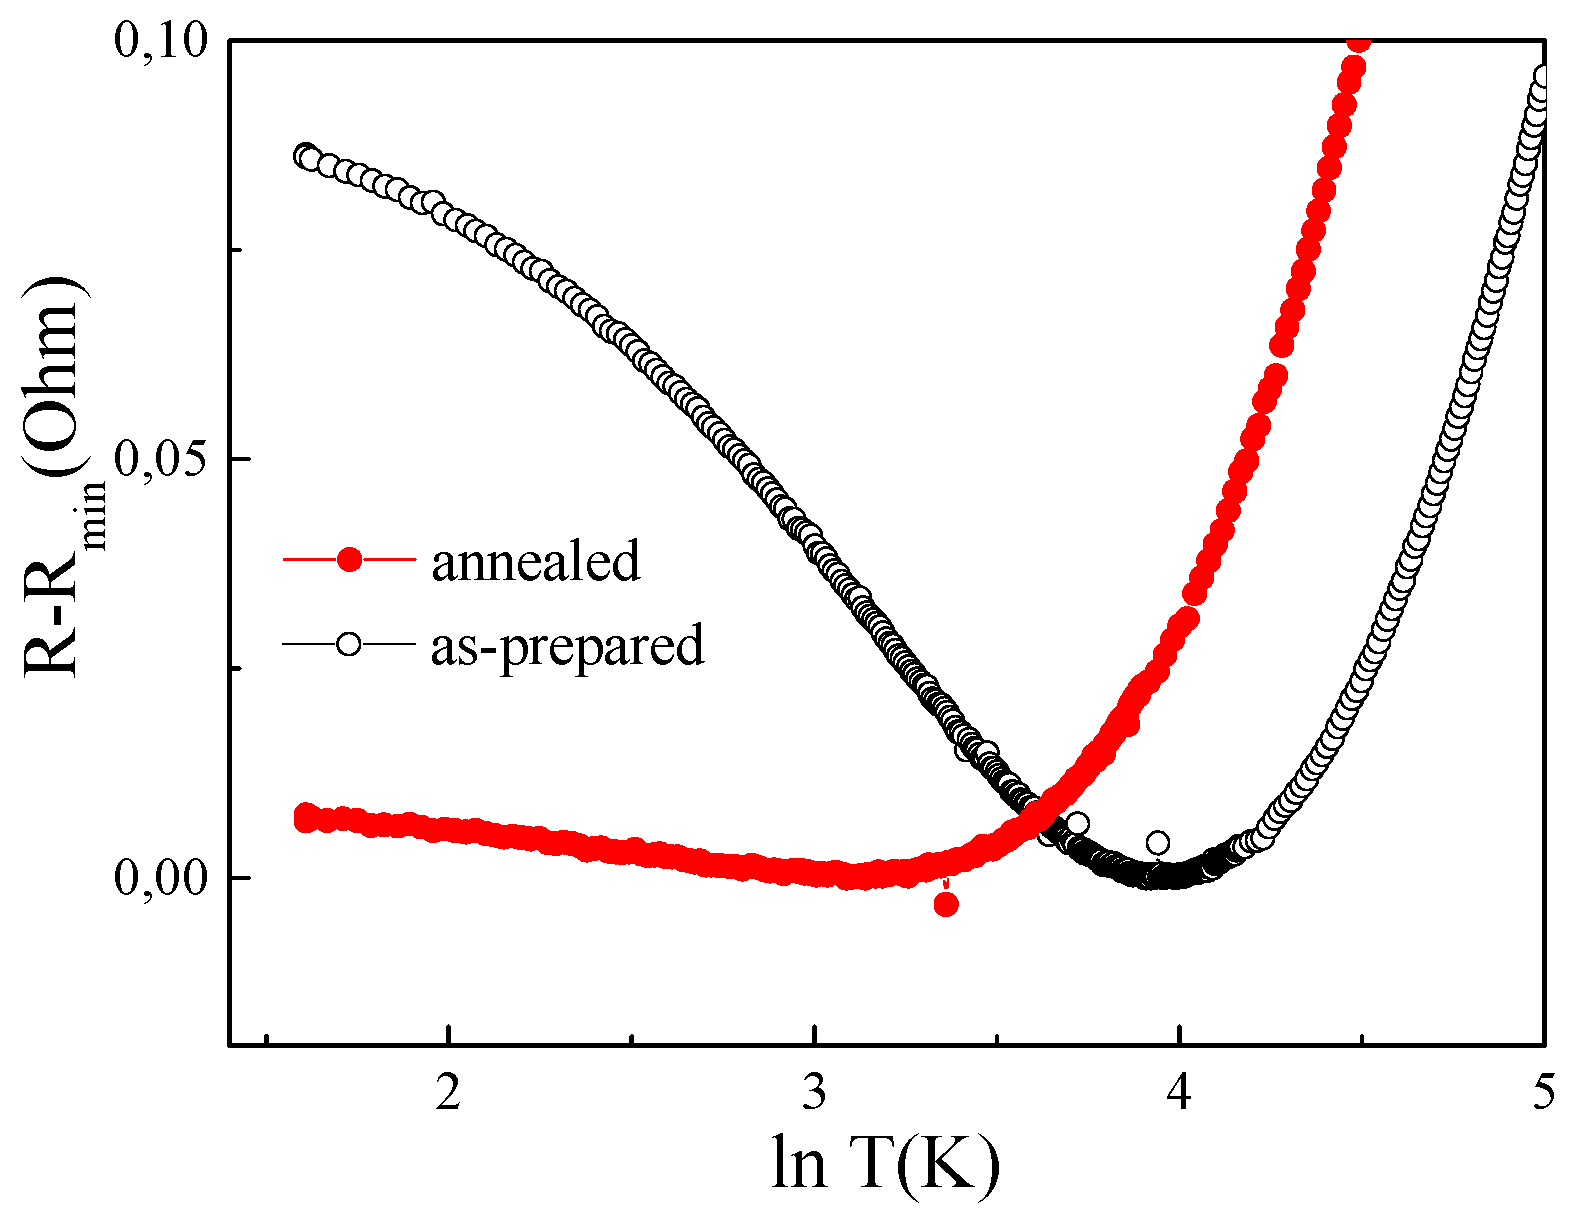
The other feature of the classical Kondo effect is a resistivity contribution behaving as ln(T). In order to prove it we re-plotted
R(T
) dependences in a semi-logarithmic scale (see
Figure 25). As can be observed, the
R-Rmin(ln T
) dependence is not perfectly linear, although for annealed Cu
90Co
10 sample linear dependence fits better.
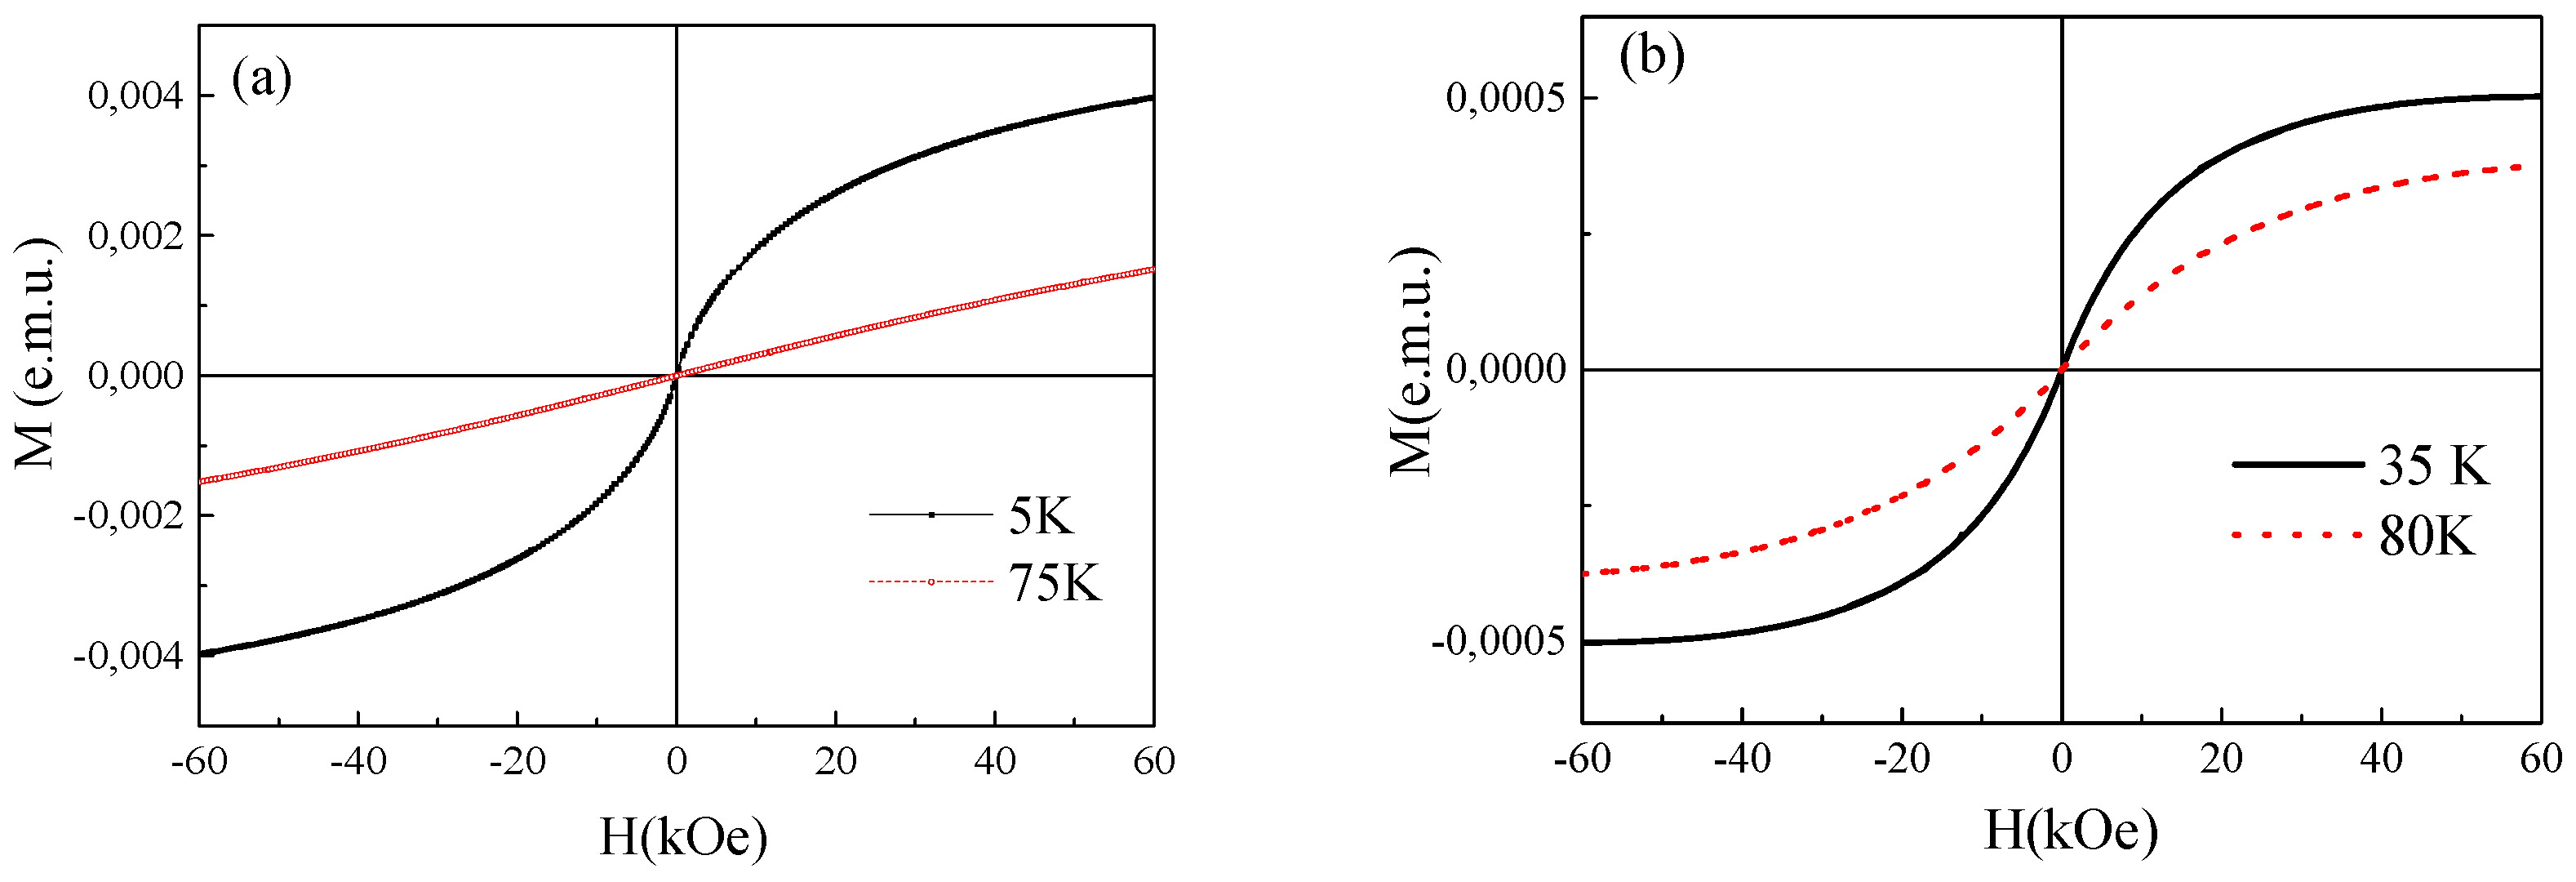
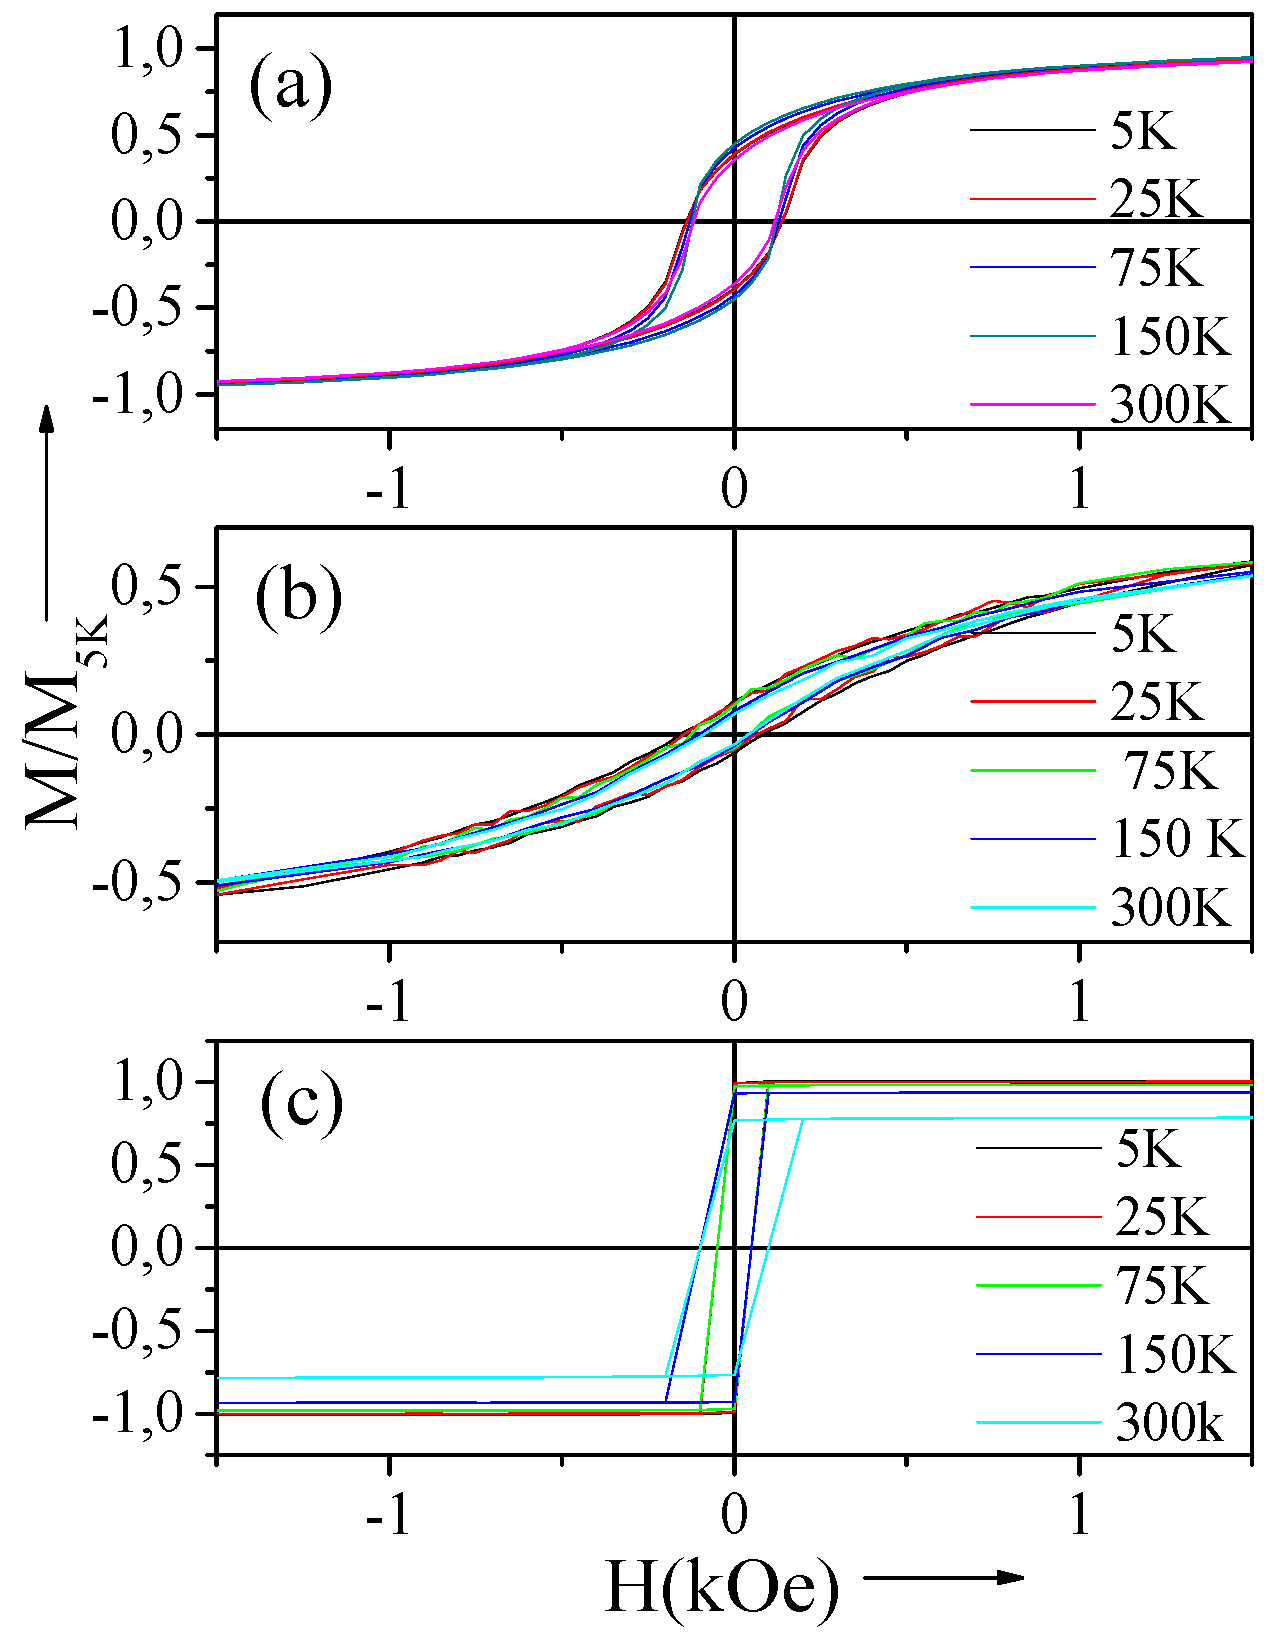
The magnetization curves,
M(H
), of studied CuCo microwires are also affected by the annealing. Thus
M(H
) of as-prepared of Cu
90Co
10 sample measured at 5 K exhibits saturation (see
Figure 26). For higher temperature (above 75 K)
M(H
) dependences are almost linear. After annealing the saturation has been observed at least up to 80 K in the same sample (
Figure 26b).
Thus after annealing magnetic and transport properties are rather different from as-prepared Cu90Co10 microwires.
Consequently, we can assume that, after annealing the precipitation of fine Co grains from the metastable structure of Co10Cu90 microwire takes place.
It is worth mentioning that the other possible reason of the observed changes can be related to appearance of the nanostructures typical for the spinodal decomposition [
86,
88].
On the other hand, it is known that amorphous and disordered materials can exhibit a minimum on temperature dependence of resistivity or decreasing of the resistivity with temperature increasing [
89,
90]. Studied Cu-Co microwires present essentially crystalline structure. But high degree of disorder related to the preparation method involving rapid quenching from the melt can be the origin of the unusual temperature dependence of resistivity.
Consequently, observed features of the resistivity minimum can be described considering Kondo effect mechanism involving magnetic impurities in metals. But, besides the classical Kondo effect, we must consider also the other mechanisms responsible for the R(T) minimum, like weak localization, enhanced electron-electron interaction, scattering of conduction electrons by structural two-level systems (TLS), scattering of strongly spin-polarized charge carriers on diluted magnetic moments and disordered structure.
The fact that R(T) minimum is affected by the magnetic field supports the classical Kondo effect contribution. On the other hand non-homogeneous and broad Co ions distribution and atomic disorder mentioned above can give rise to the other mechanisms.
It is worth mentioning that for similar Co content in Co-Ag system the nonmonotonic resistivity temperature dependence was explained using the two-current model without involving a Kondo mechanism [
91].
The fact that the minimum on R(T) dependence of annealed sample is suppressed by much lower magnetic field must be attributed to the redistribution of Co in the studied sample after annealing and formation of either Co grains or lamellar nanostructures.
4.2. Granular Fe-Cu Microwires
Similarly to Co-Cu microwires, Fe-Cu microwires can present a GMR effect.
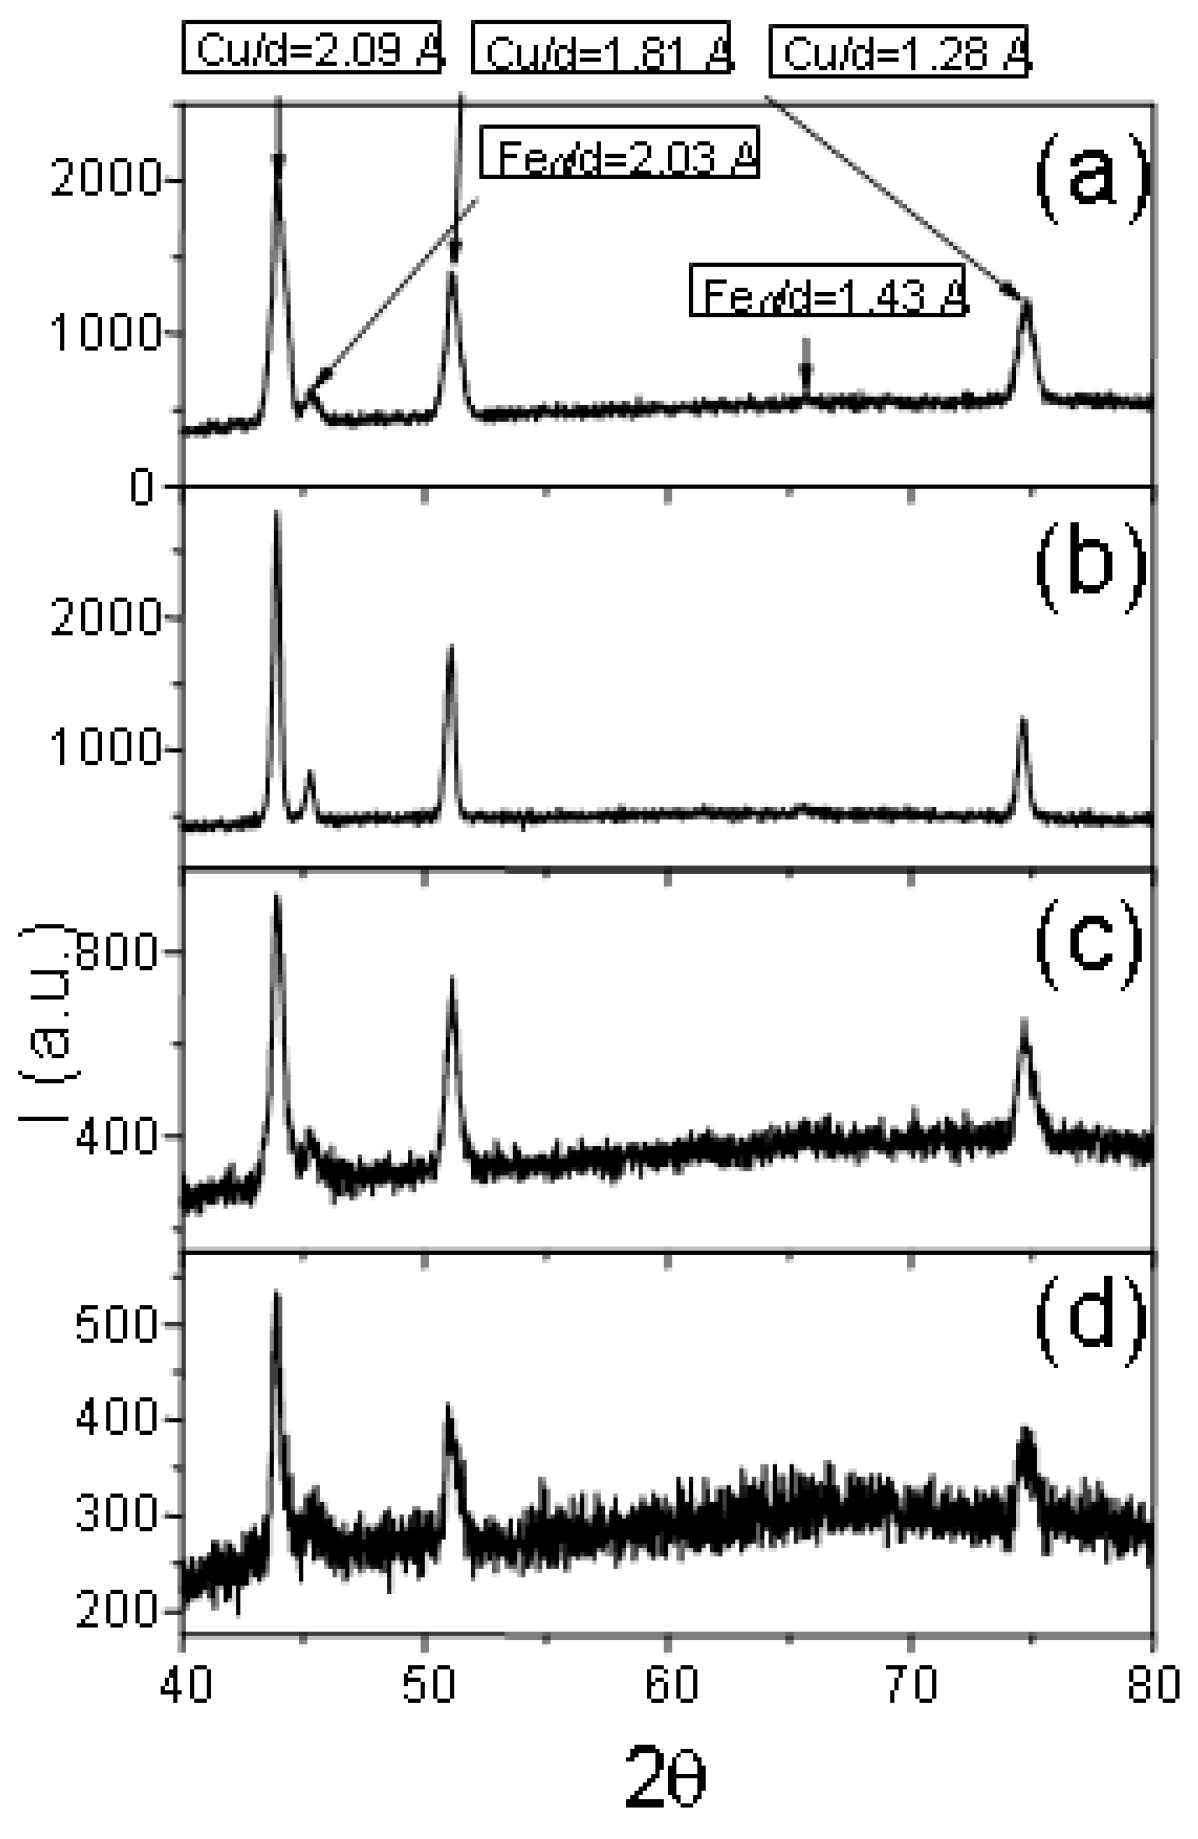
By XRD (see
Figure 27) we identified that Cu
63Fe
37 microwires structure consists of Cu phase (face centered cubic
fcc, lattice parameter: 3.61 Ǻ with atomic spacings of 2.09, 1.81 and 1.28 Ǻ) and α-Fe phase (body centered cubic bcc, lattice parameter: 2.87 Ǻ corresponding to atomic spacings of 2.03 and 1.43 Ǻ) [
92]. Cu nano-grains with the average grain size of 40 nm were roughly independent of the sample geometry (represented by the ratio
ρ) [
18], while the average size of Fe nanocrystals depends on
ρ-ratio varying between 6 and 45 nm [
92].
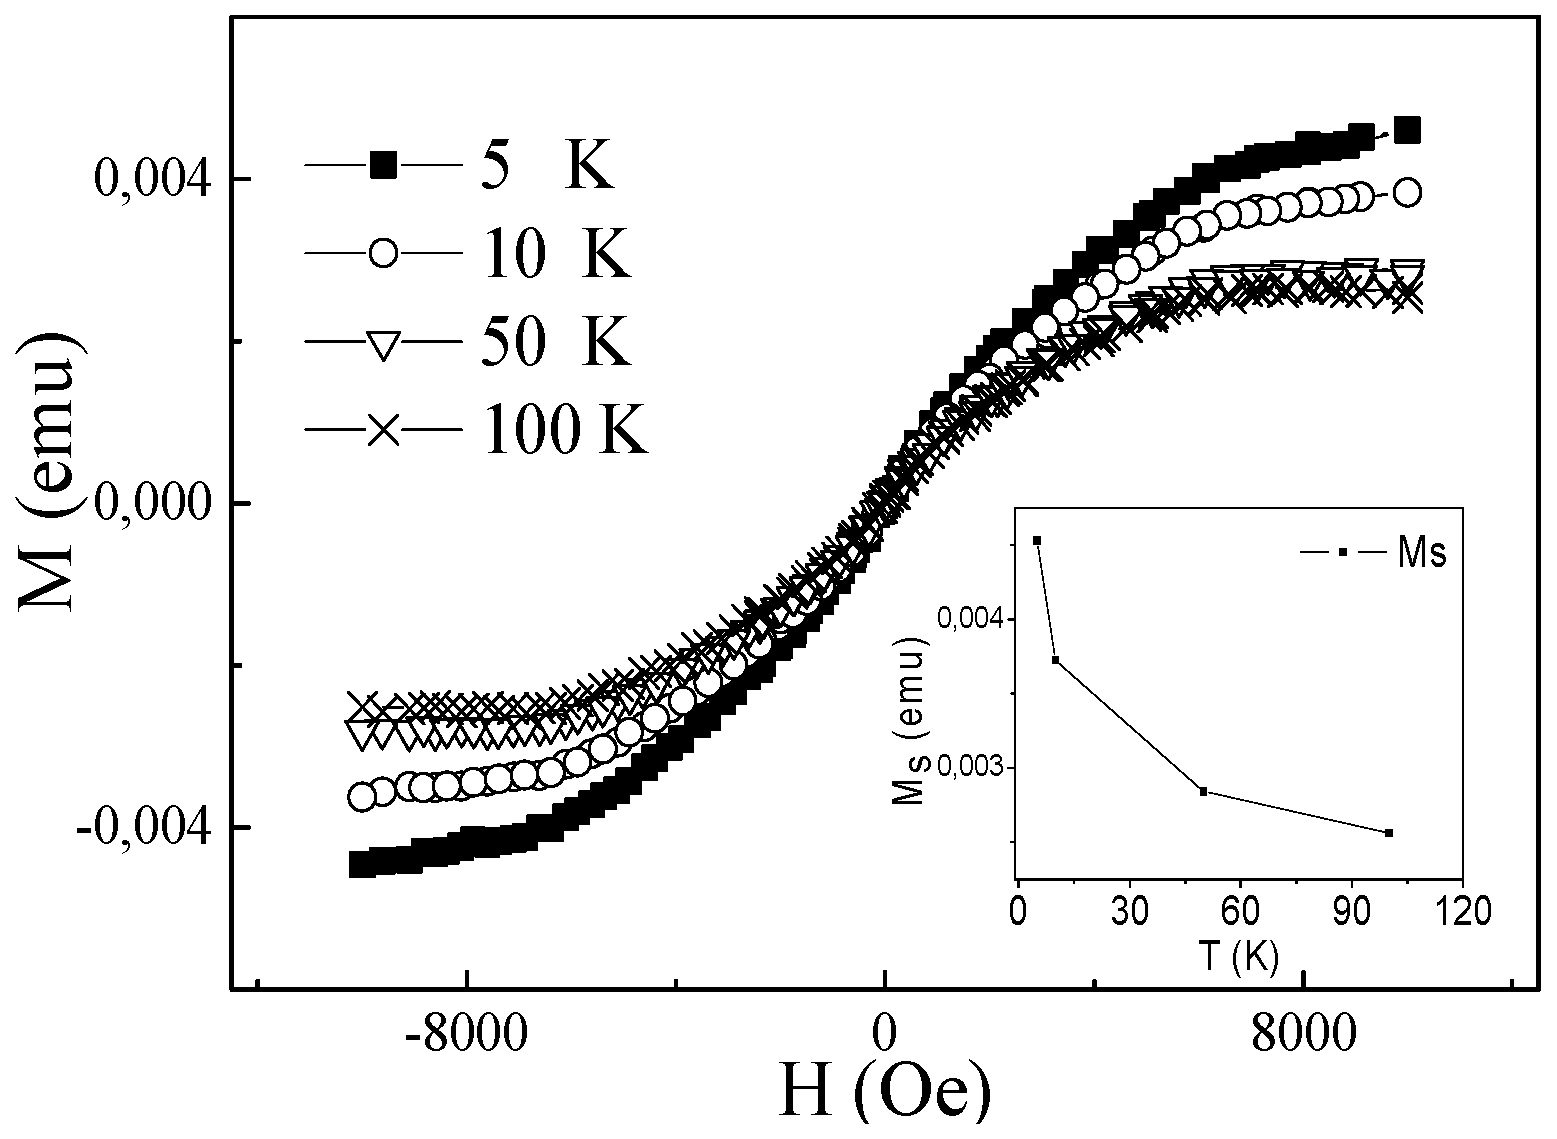
All magnetization curves display both superparamagnetic and ferromagnetic features. A small hysteresis area of the measured loops and the absence of saturation and fast magnetization maximum decrease at low temperatures indicate the presence of a superparamagnetic phase (see
Figure 28). The ferromagnetic behavior is evidenced by low values of remanence and coercivity. Such behavior can be attributed to the co-existence of the ferromagnetic and superparamagnetic particles.
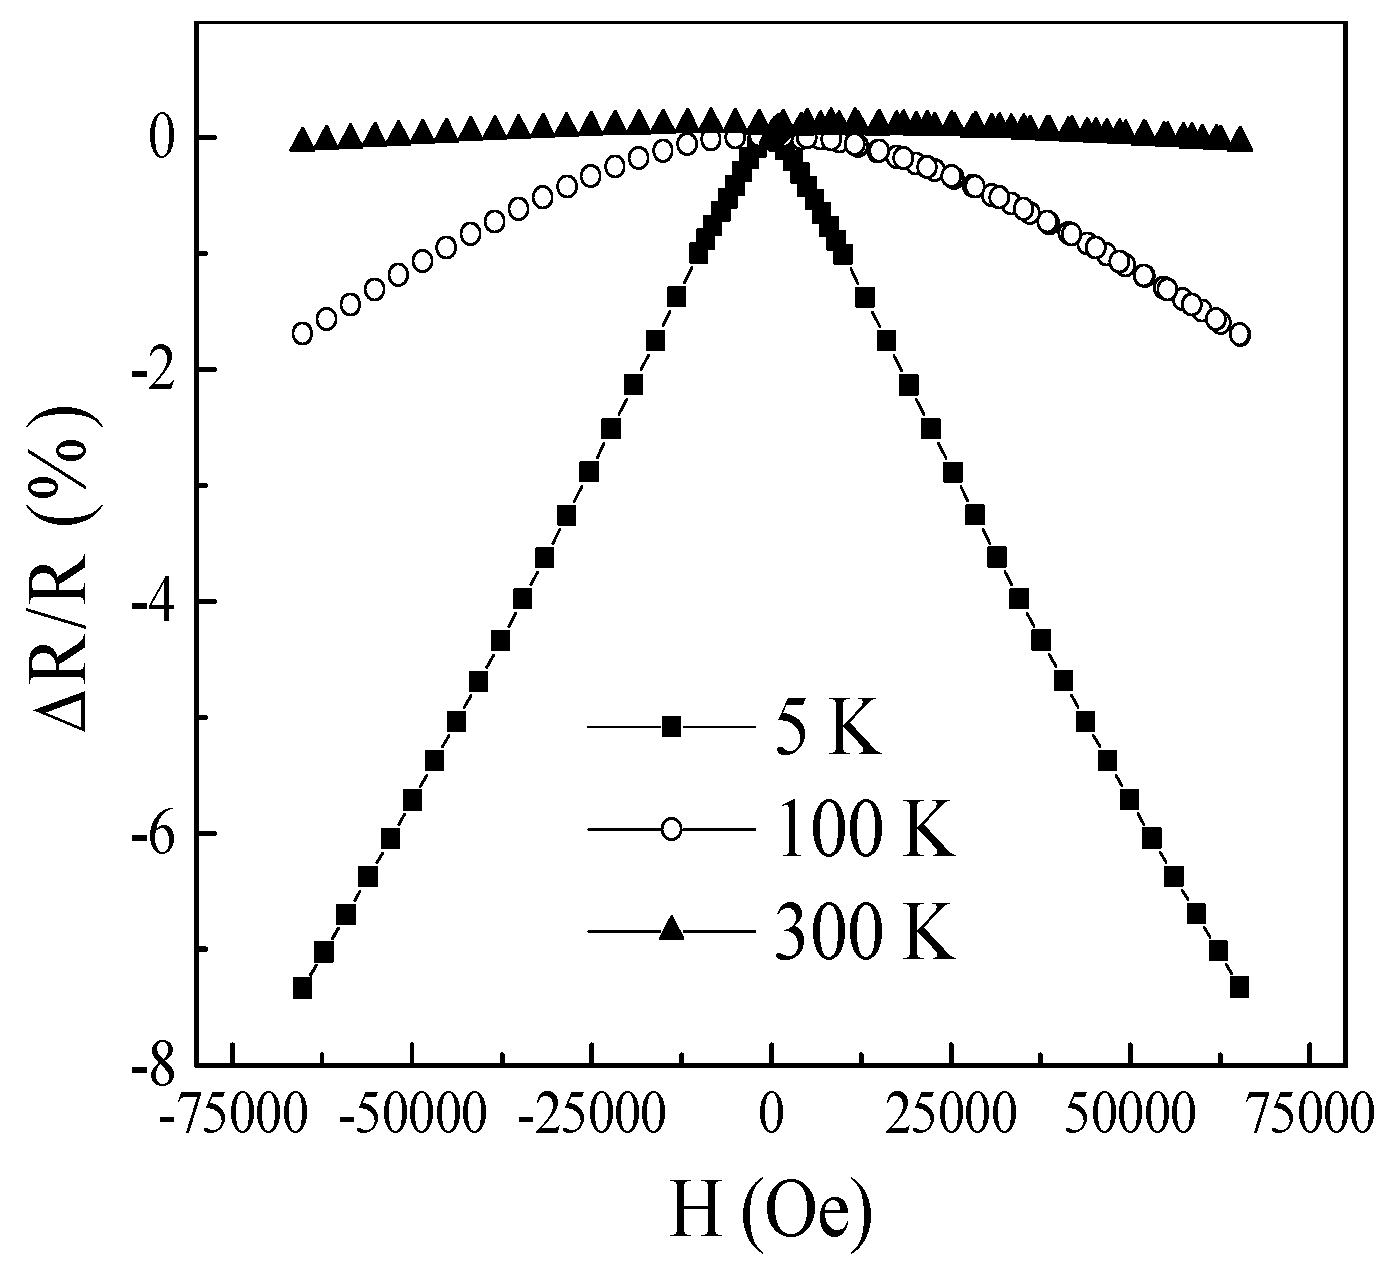
Like in the case of Co-Cu microwires, the MR effect in the range of 7% has been observed for
ρ = 0.46 Cu
73Fe
37 glass coated microwires (
Figure 29). The magnetic field dependence of ΔR/R is typical for the GMR effect, when resistance decay upon the increasing of magnetic field. Decreasing the temperature MR increases (from 1% till 7.5% for the sample with
ρ = 0.31).
Consequently, Co-Cu and Fe-Cu glass-coated microwires prepared using Tailor–Ulitovsky method can present GMR effect. A remarkable GMR effect has been observed in Co-Cu microwires after appropriate annealing. The largest GMR effect (∆R/R ≈ 32%) has been observed in Cu90Co10. Similarly, for Cu90Co10 and Cu95Co5 microwires we observed an increase of ∆R/R from 5.5 to 28% and from 3% to 17%, respectively. This GMR increase is not related to the stress relaxation and can be attributed to the short range ordering processes that cannot be distinguished by the XRD method.
Obtained ∆
R/R-values are quite similar or even slightly higher than the ∆
R/R-values reported in other granular materials obtained by rapid quenching and in multilayered Co-Cu materials [
21,
22,
77,
78].
5. Semi-Hard Magnetic Microwires
Magnetically hard and semi-hard wires are quite useful for various applications. In particular hard magnetic wires are proposed for applications in Electronic Article Surveillance (EAS), for creation of the deactivatable markers, motors, compass needles and tachometers and for magnetic tips for magnetic force microscopy [
93,
94].
On the other hand, rapid quenching from the melt and subsequent processing is a well-established route to the formation of hard magnetic materials [
95].
Consequently, we performed few attempts to prepare magnetic microwires with enhanced coercivity values [
43,
96,
97]. Amorphous materials generally present quite soft magnetic properties with low coercivity [
73]. Eventually magnetic microwires with hard magnetic properties must present crystalline structure, since preparation of magnetic materials with amorphous structure is the common way to suppress the magnetocrystalline anisotropy and to obtain soft magnetic materials.
But the principal limitation for the preparation of magnetically hard glass-coated microwires containing rare-earth metals using the Taylor-Ulitovsky technique is related to the chemical interaction of rare-earth elements with the glass during the rapid solidification from the melt.
Consequently, we used different families of microwires without rare-earth elements (shown in
Table 4).
Semi-hard magnetic microwires have been obtained by devitrifying the amorphous matrix in Finemet-like (Fe
73.5B
11Si
11.5Nb
3Cu
1) magnetic microwires: an increase of the coercivity,
Hc, (from around 1 Oe in the amorphous state) up to values of the order of 60 Oe is observed after the second crystallization process [
43].
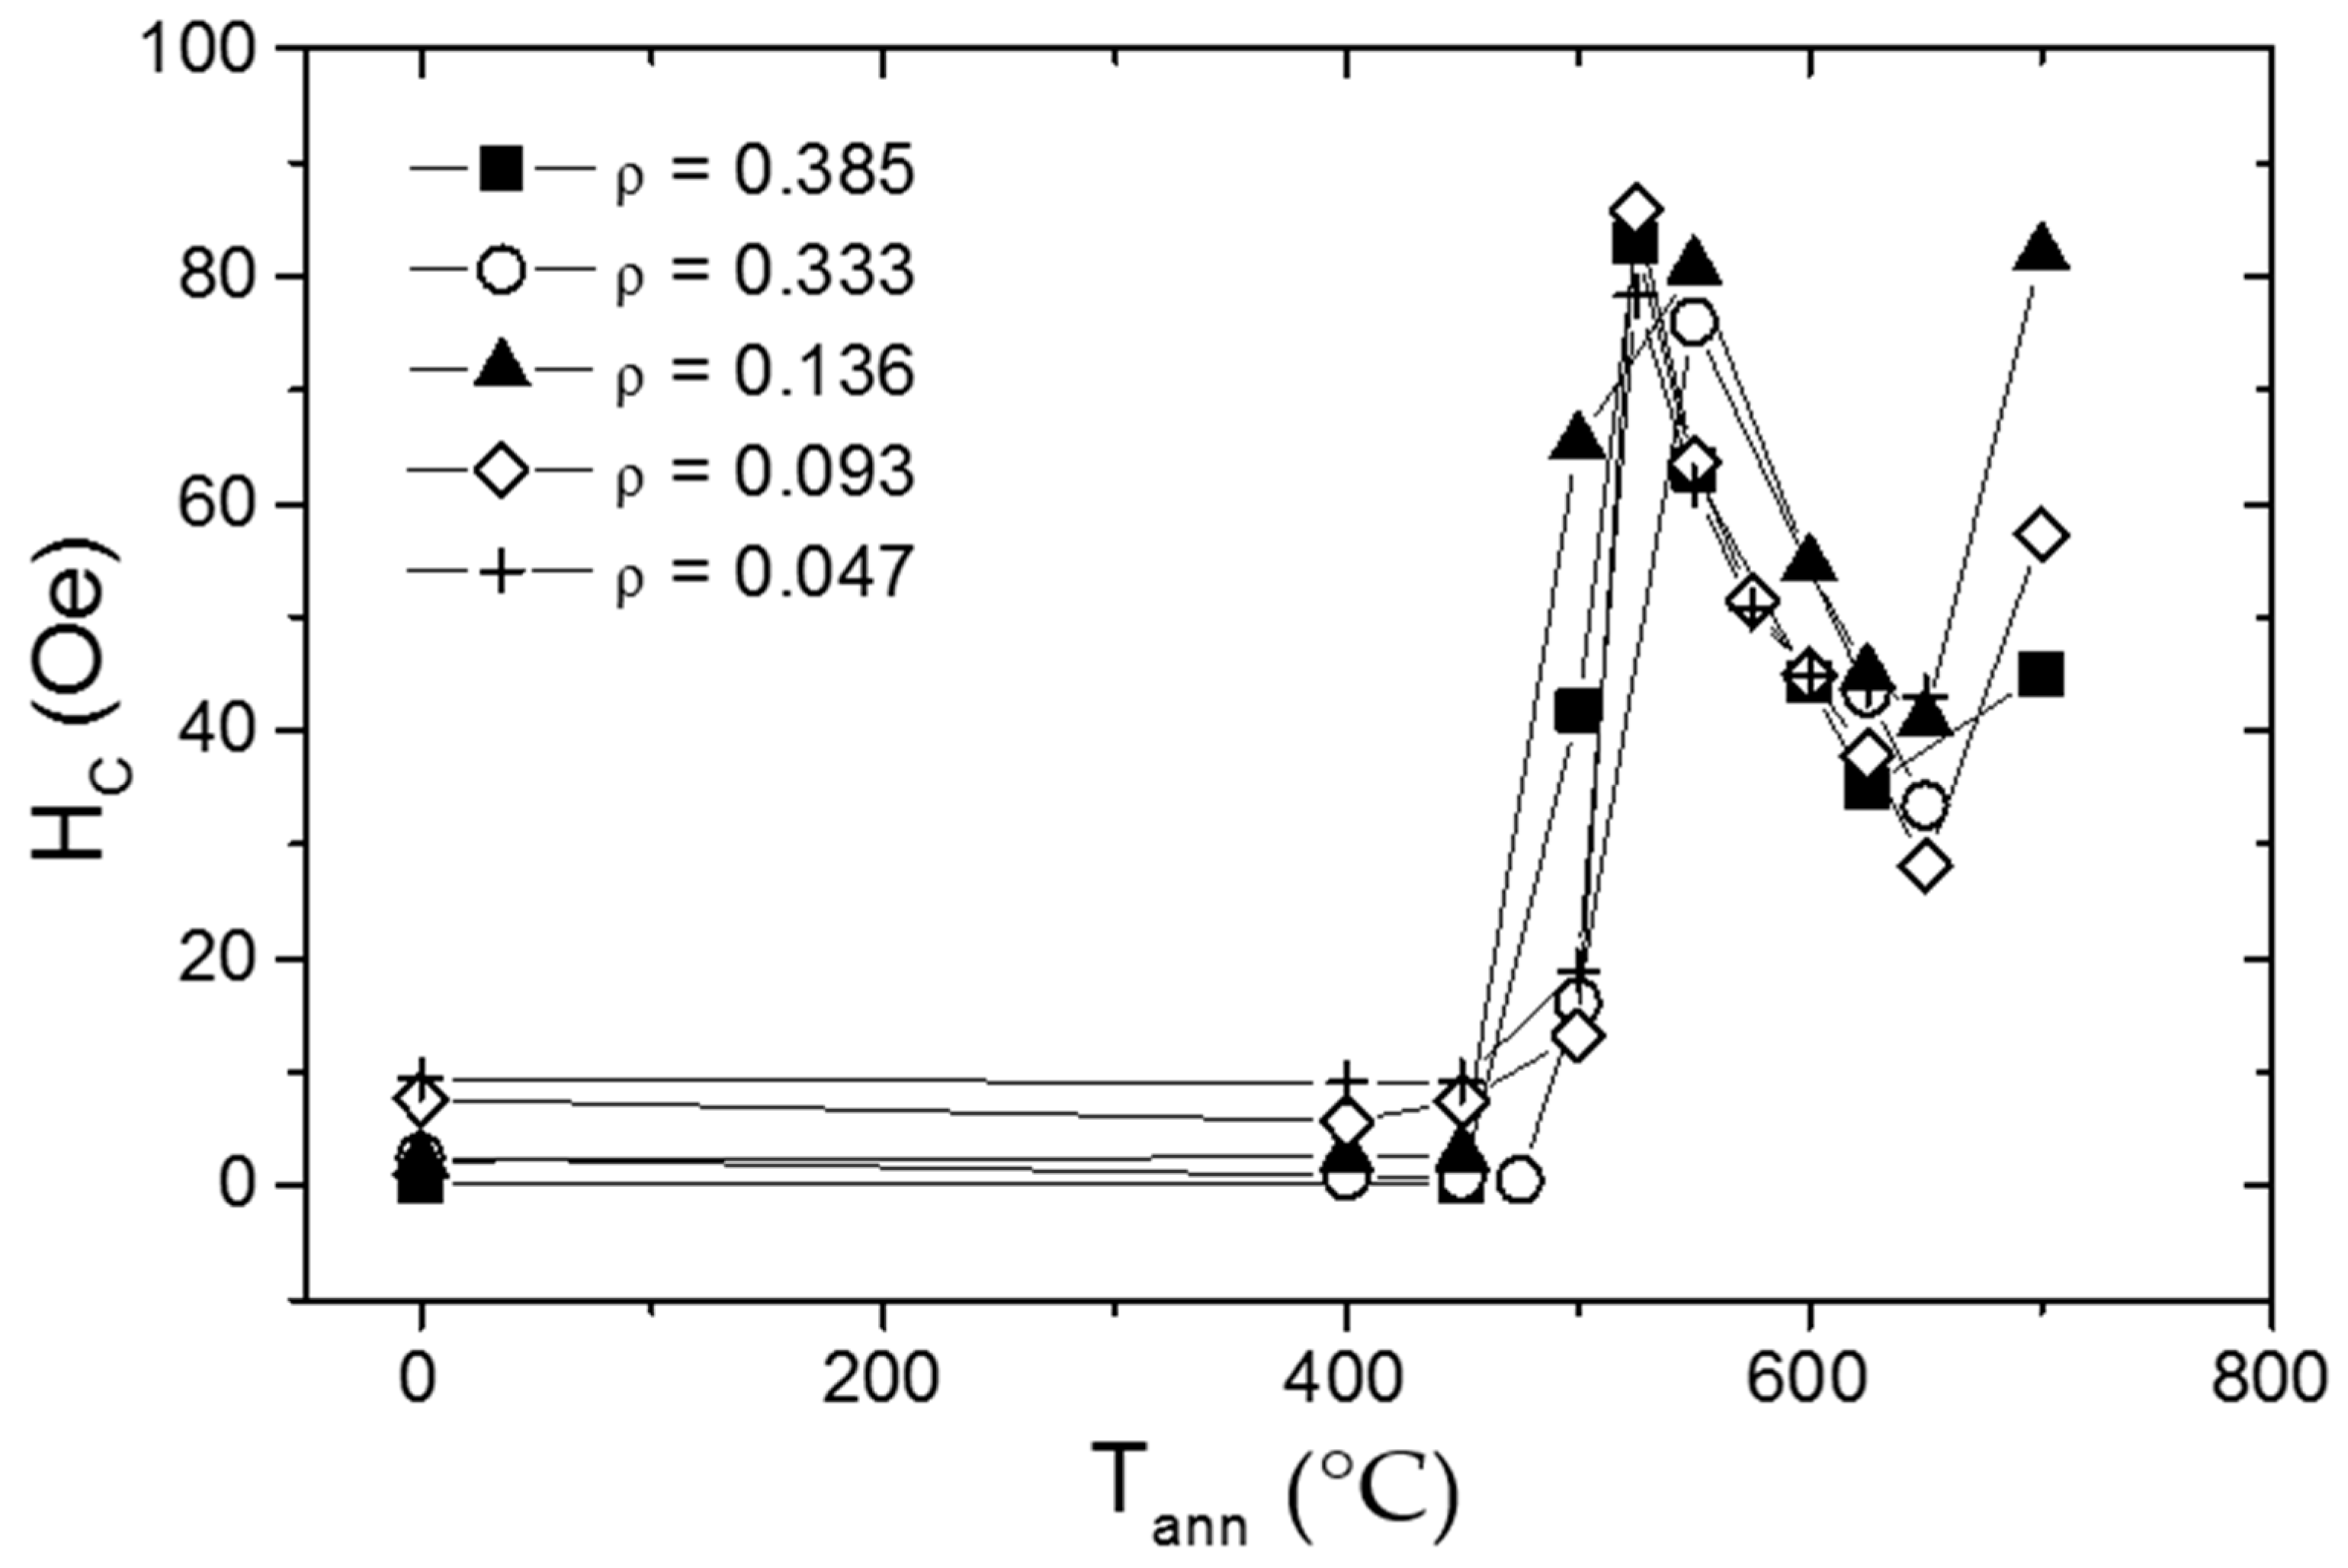
Later in slightly different composition (Fe
72.3Cu
1Nb
3.1Si
14.5B
9.1) we were able to increase the coercivity up to almost 100 Oe (see
Figure 30) after appropriate annealing.
Remarkable magnetic hardening (coercivity growth) can be observed after annealing at T
ann ≈ 500–550 °C. It should be indicated that such maximum of H
c takes place at the same range of annealing temperature as first small increase of coercivity in Fe
73.4Cu
1Nb
3.1Si
xB
22.5-x (x = 11.5 and 13.5) related with the first re-crystallization process [
43].
This unusual magnetic hardening has been related to different structure of precipitating phases: small amount of fine grains of α-Fe, γ-Fe and α-Fe(Si) in the Fe
72.3Cu
1Nb
3.1Si
14.5B
9.1 sample has been observed by TEM after the crystallization of the sample annealed at 550 °C [
96].
Rather different first crystallization process (precipitation of γ-Fe) has been explained considering effect of strong internal stresses due to glass coating on structure of the precipitates. Indeed, it is well-known that the internal strains of different nature can induce a martensite-type transformation in Fe-alloys. Probably, the strong internal stresses induce a precipitation of the γ-Fe fine grains during the first stage of the crystallization process in studied Fe72.3Cu1Nb3.1Si14.5B9.1 microwire. Consequently, a presence of γ-Fe precipitations could be a reason for observed magnetic hardening.
Enhanced coercivity (H
c ≈ 580 Oe) has been observed in Fe
20Ni
20Cu
60 microwires annealed at 700 °C [
97]. The problem of this microwire is that the present relatively low magnetization being weakly magnetic.
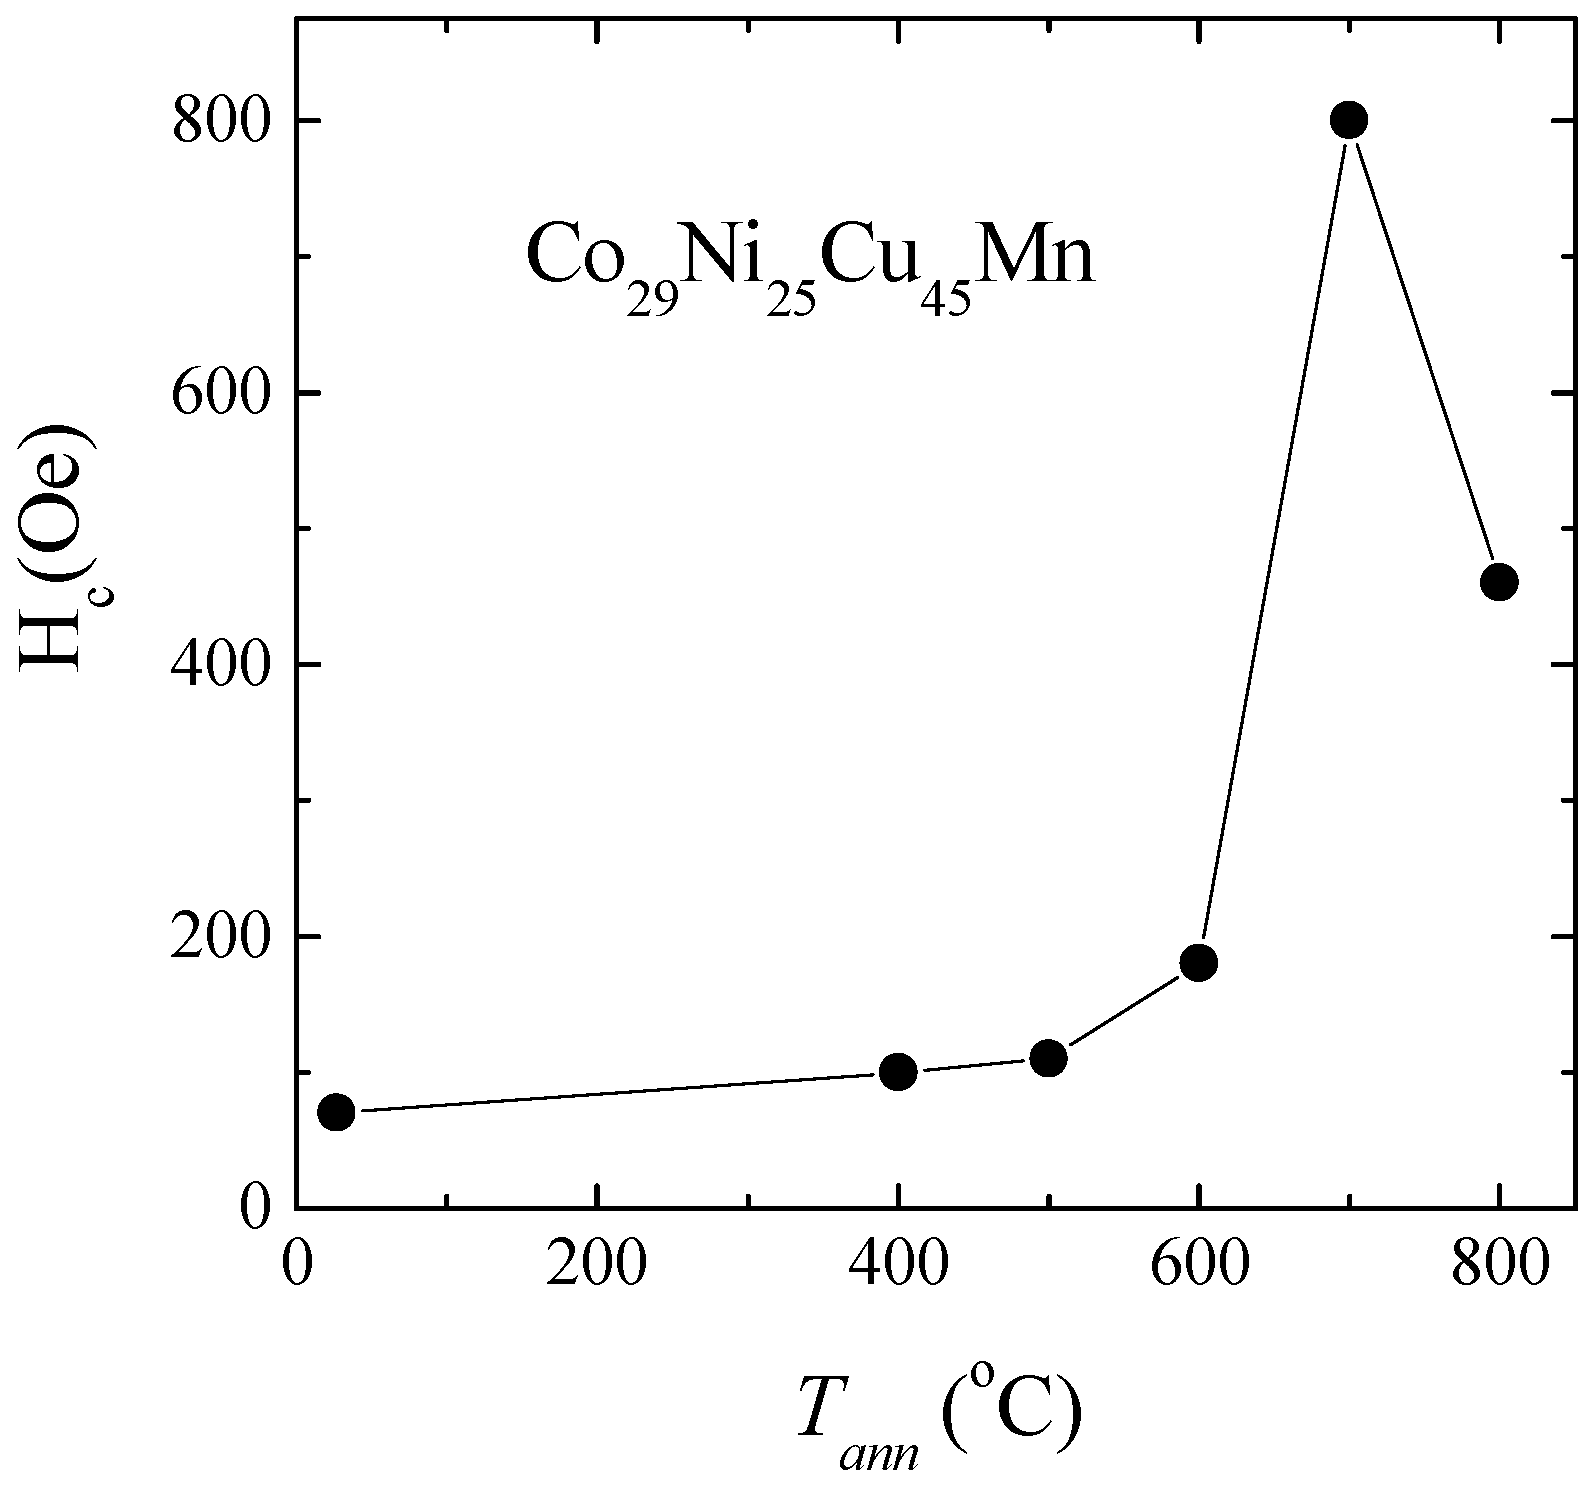
Even higher coercivity (up to 800 Oe) has been obtained after annealing of Co
29Ni
25Cu
45Mn microwire with a metastable single phase structure in the as-prepared state [
98].
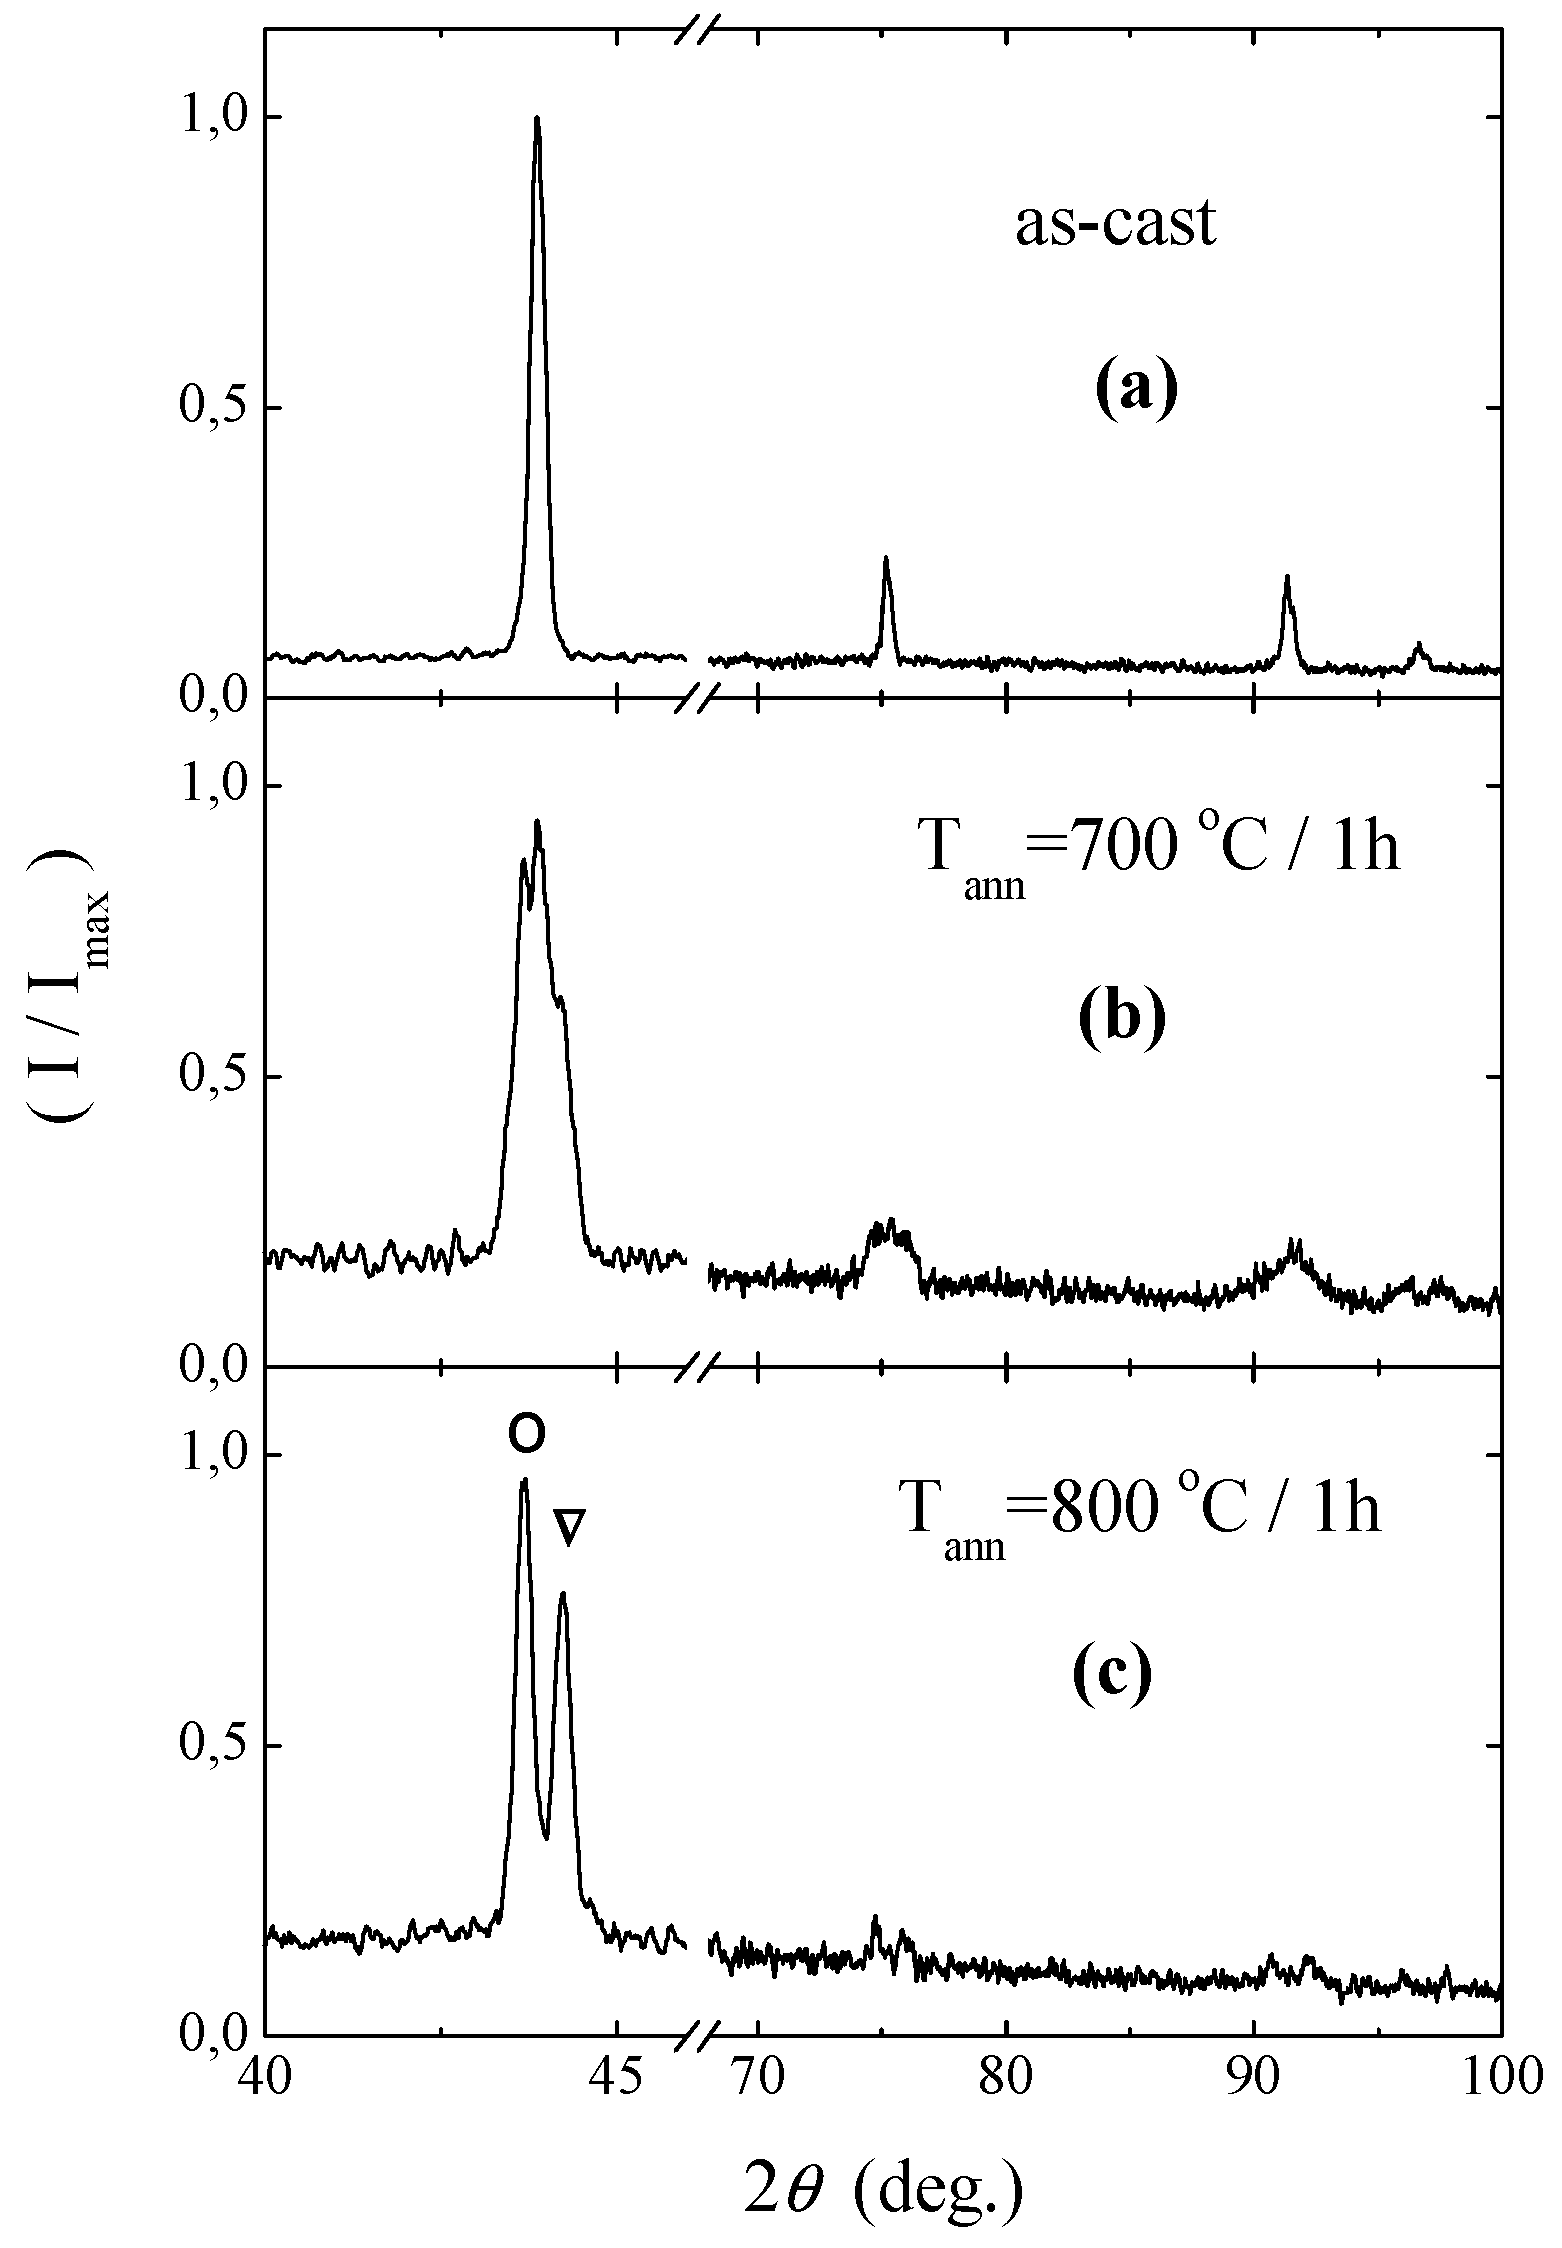
Only a single phase, with a lattice parameter
a = 0.3573 nm has been found in the as-prepared microwire (
Figure 31a). As can be seen (
Figure 31b,c) upon the annealing this metastable phase started to decompose. For the sample annealed at 700 °C the segregation mechanism is not yet complete (see
Figure 31b). After annealing at 800 °C, the sample shows the equilibrium phases, consisting of a Cu matrix (
a = 0.3591 nm) with embedded Co-rich precipitations (
a = 0.3545 nm) (
Figure 31c).
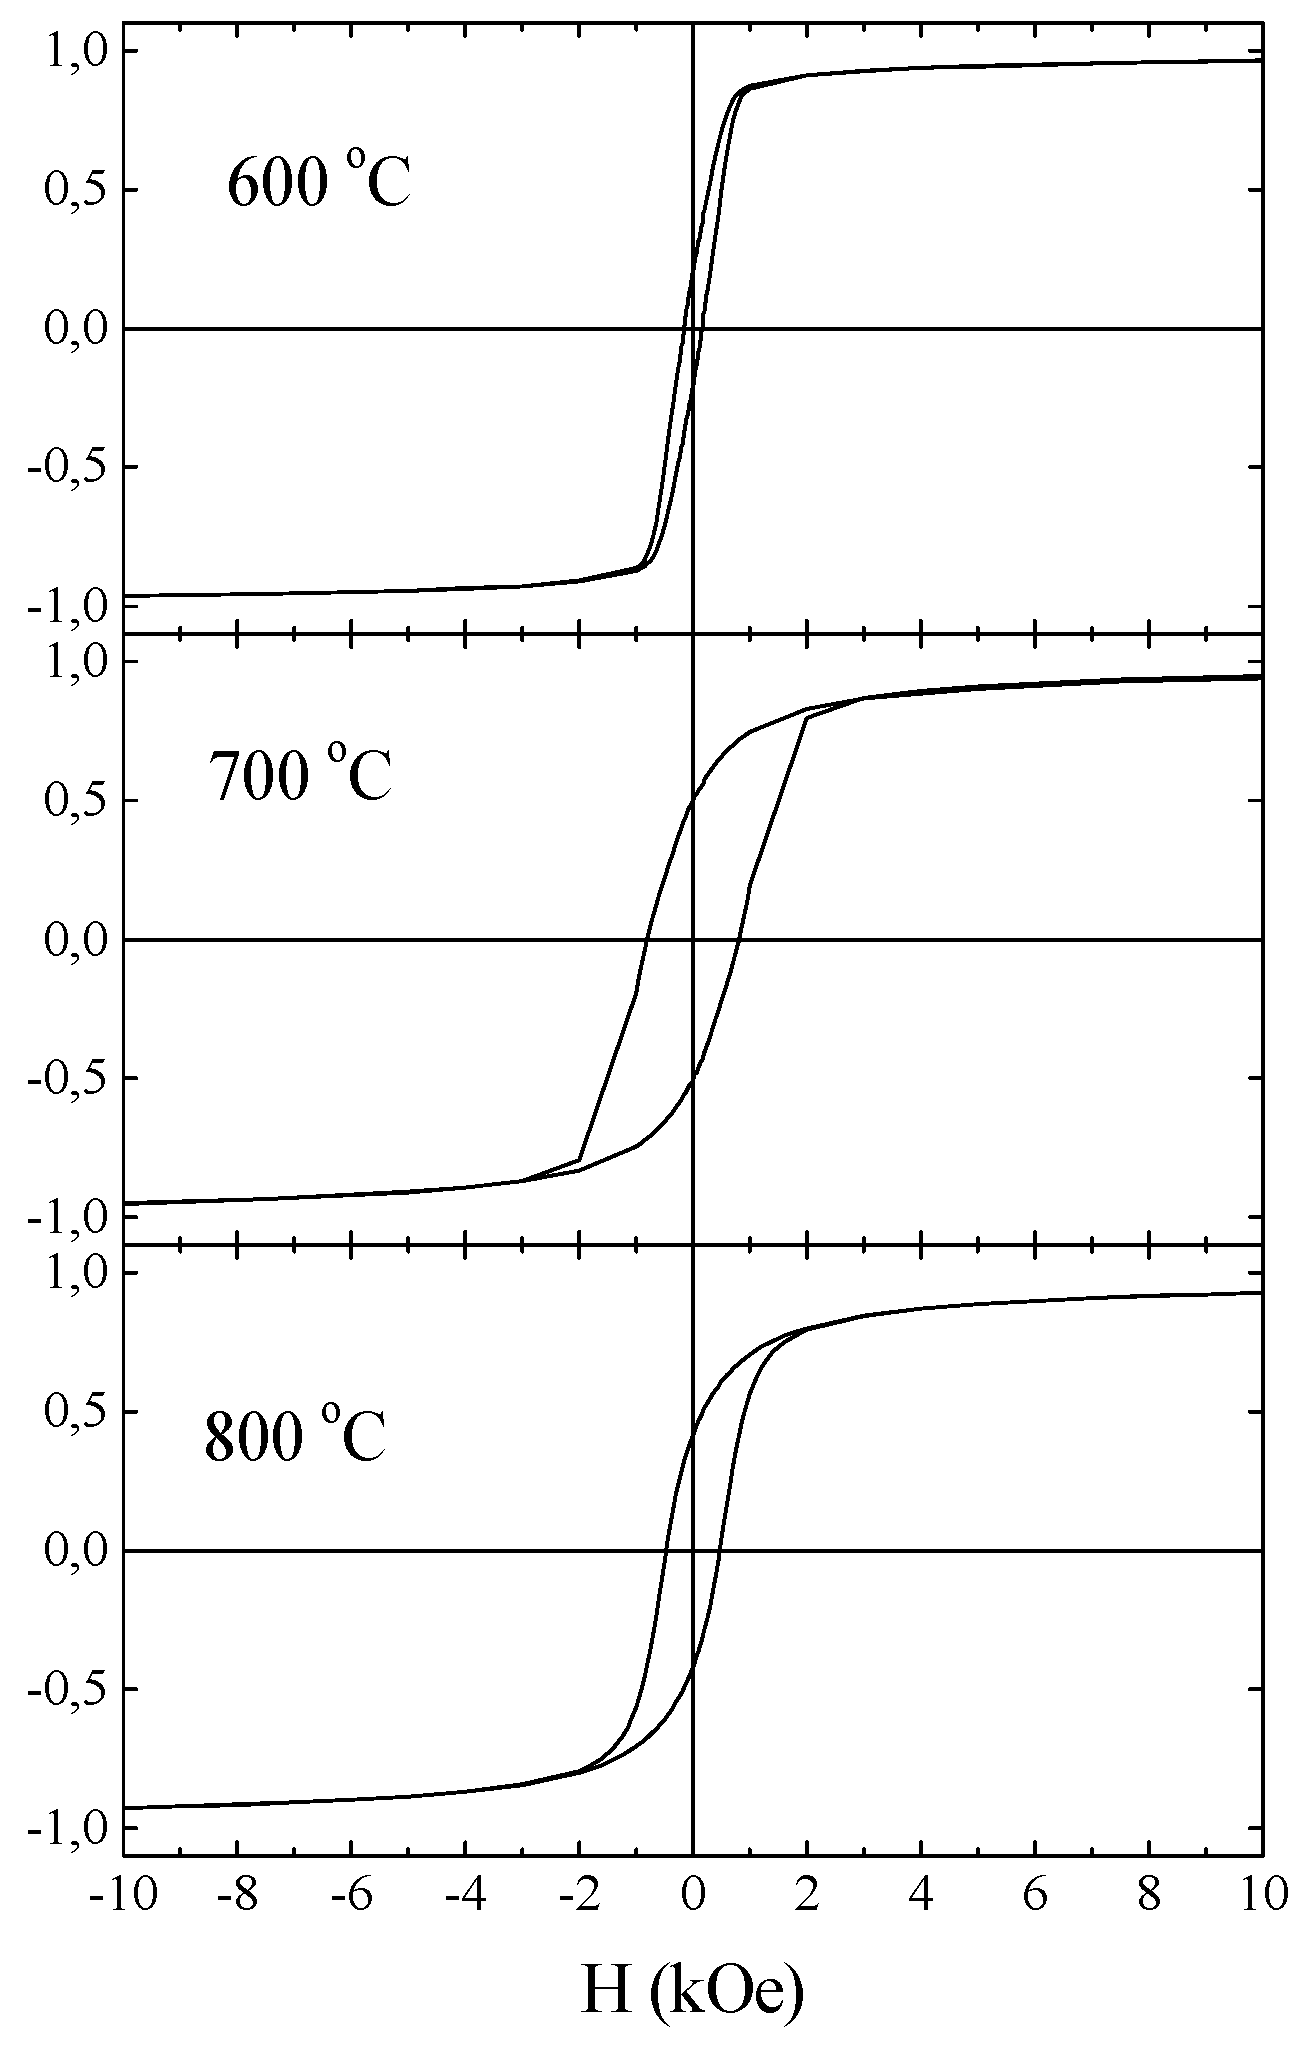
The hysteresis loops of Co
29Ni
25Cu
45Mn microwire annealed at different temperatures are shown in
Figure 32.
The as-prepared sample shows a relatively low coercivity (50–100 Oe). Increasing the annealing temperature a remarkable (almost one order) increase in H
c is observed, reaching the coercivity value of about 800 Oe at
Tann= 700 °C followed by a decrease of the (see
Figure 33). The largest reduced remanence ratio
Mr/Ms = 0.5 is also obtained for
Tann = 700 °C. The estimated saturation magnetization is of about 3.6 KG. The structure of the microwire exhibiting magnetic hardening at
Tann= 700 °C consists of a fine ferromagnetic Co-rich grains embedded in Cu-rich paramagnetic matrix. Further increasing of the annealing temperature results in grain growth and decreasing of the coercivity. Magnetic hardening is reported in bulk Co-Ni-Cu permanent magnet alloys, where the maximum coercivity values were obtained after annealing at 700 °C for 1 h [
99]. Rather different first crystallization process (precipitation of γ-Fe) has been explained considering effect of strong internal stresses due to glass coating on structure of the precipitates. Indeed, it is well-known that the internal strains of different nature can induce a martensite-type transformation in Fe-alloys. Probably, the strong internal stresses induce a precipitation of the γ-Fe fine grains during the first stage of the crystallization process in studied Fe
72.3Cu
1Nb
3.1Si
14.5B
9.1 microwire. Consequently, a presence of γ-Fe precipitations could be a reason for observed magnetic hardening. Enhanced coercivity (H
c ≈ 580 Oe) has been observed in Fe
20Ni
20Cu
60 microwires annealed at 700 °C [
97]. The problem of this microwire is that the present relatively low magnetization being weakly magnetic.
Recently we paid attention on FePt magnetically hard alloys that have attracted considerable attention because of their promising mechanical and magnetic suitable for various [
100]. The origin of high coercivity in Fe-Pt alloys has been attributed to high magnetocrystalline anisotropy of the L10 FePt phase [
100,
101]. We studied Fe
64.7Pt
33.3B
2, Fe
50Pt
40Si
10 and Fe
50Pt
50 glass-coated microwires prepared using the Taylor-Ulitovsky technique described above.
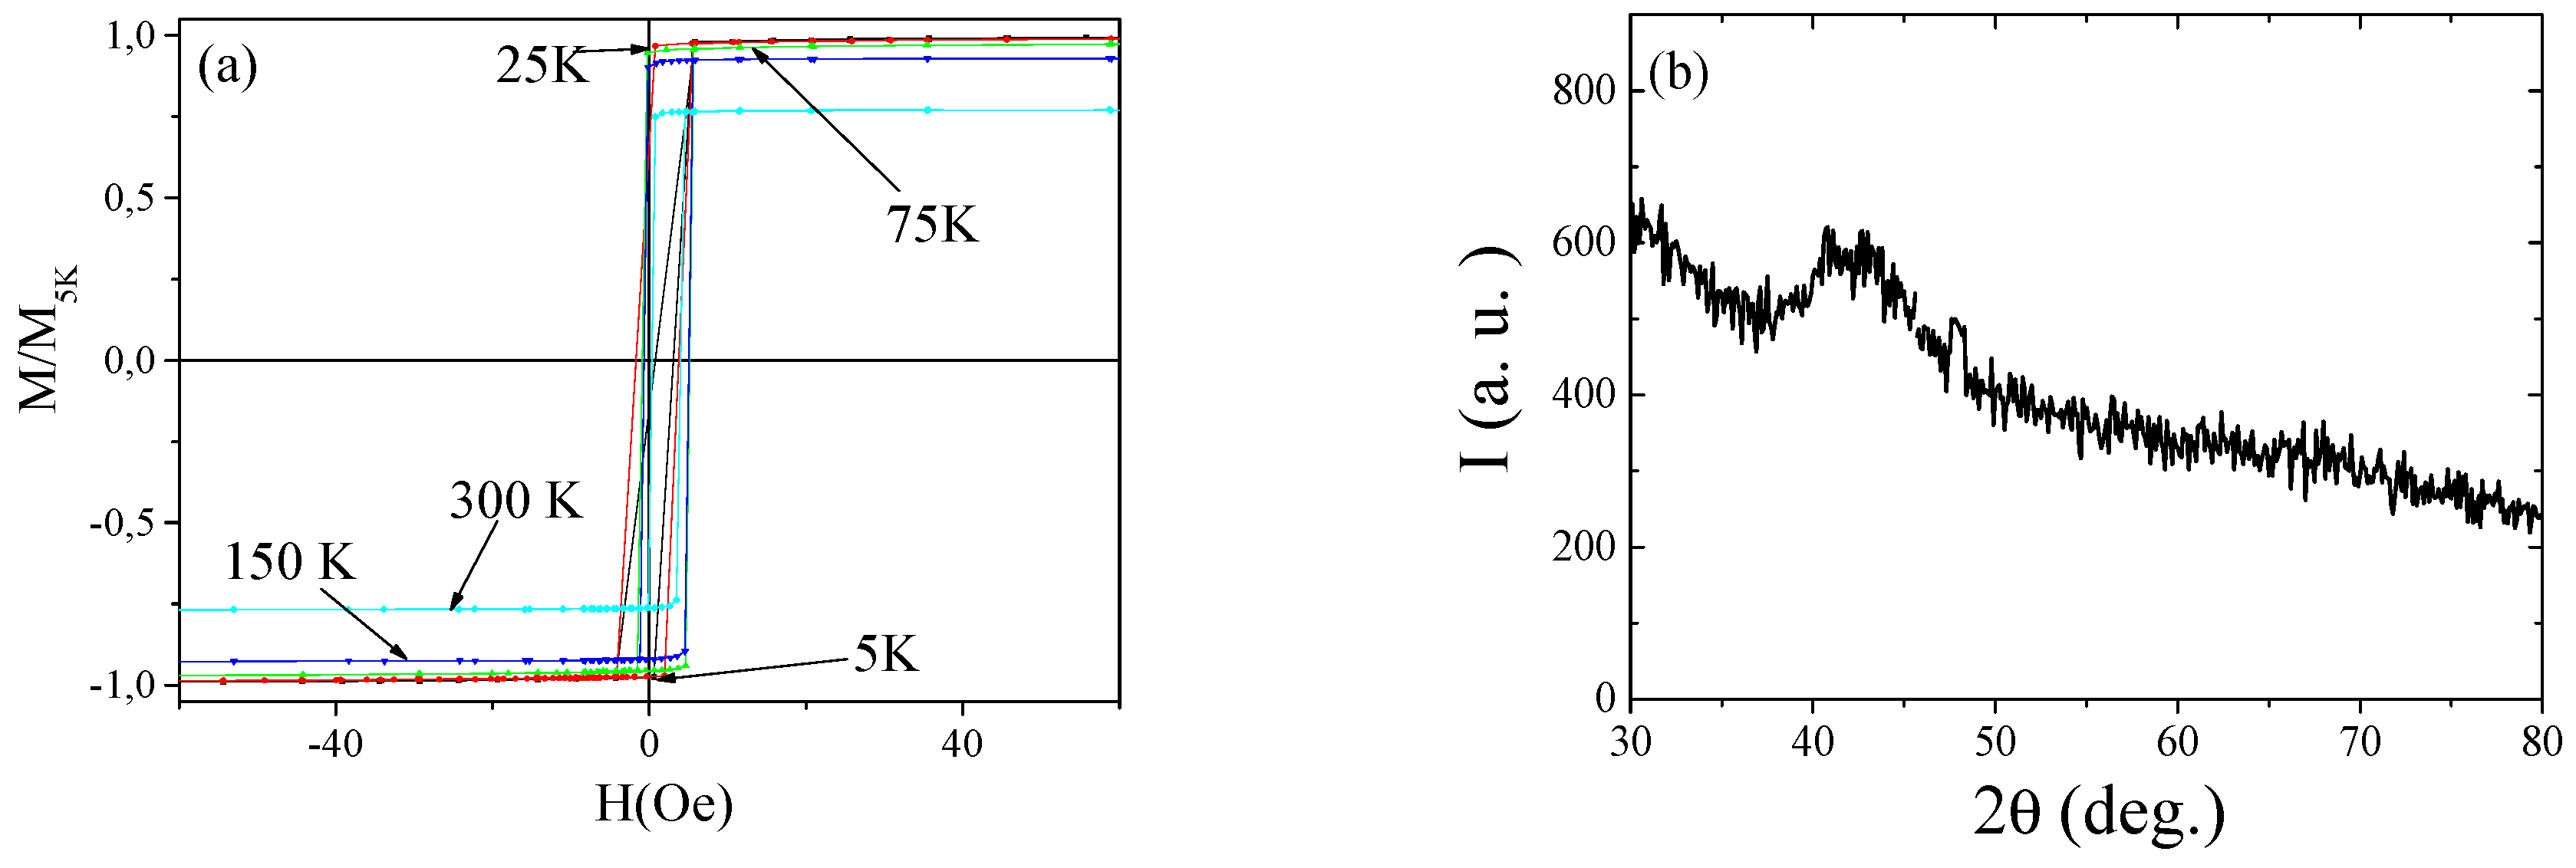
All as-prepared samples present magnetic saturation typical for ferromagnetic alloys (
Figure 34).
Samples Fe
64.7Pt
33.3B
2 and Fe
50Pt
40Si
10 present saturation at magnetic field considerably lower than Fe
50Pt
50 microwire. The highest coercivity,
Hc, (of about 140 Oe) is observed in as-prepared Fe
64.7Pt
33.3B
2 microwires, while as-prepared Fe
50Pt
50 microwires present lower
Hc ≈ 80 Oe. The lowest
Hc-values (
Hc ≈ 5 Oe) and rectangular hysteresis loops at low magnetic field were observed in as-prepared Fe
50Pt
40Si
10 microwires (
Figure 35a). All studied samples present a weak temperature dependence of coercivity. The reason for magnetic softness of as-prepared Fe
50Pt
40Si
10 microwires is in accordance to its amorphous structure as confirmed by XRD pattern (
Figure 35b). As shown, XRD pattern of as-prepared Fe
50Pt
40Si
10 microwires displays a diffuse halo typical for amorphous structure.
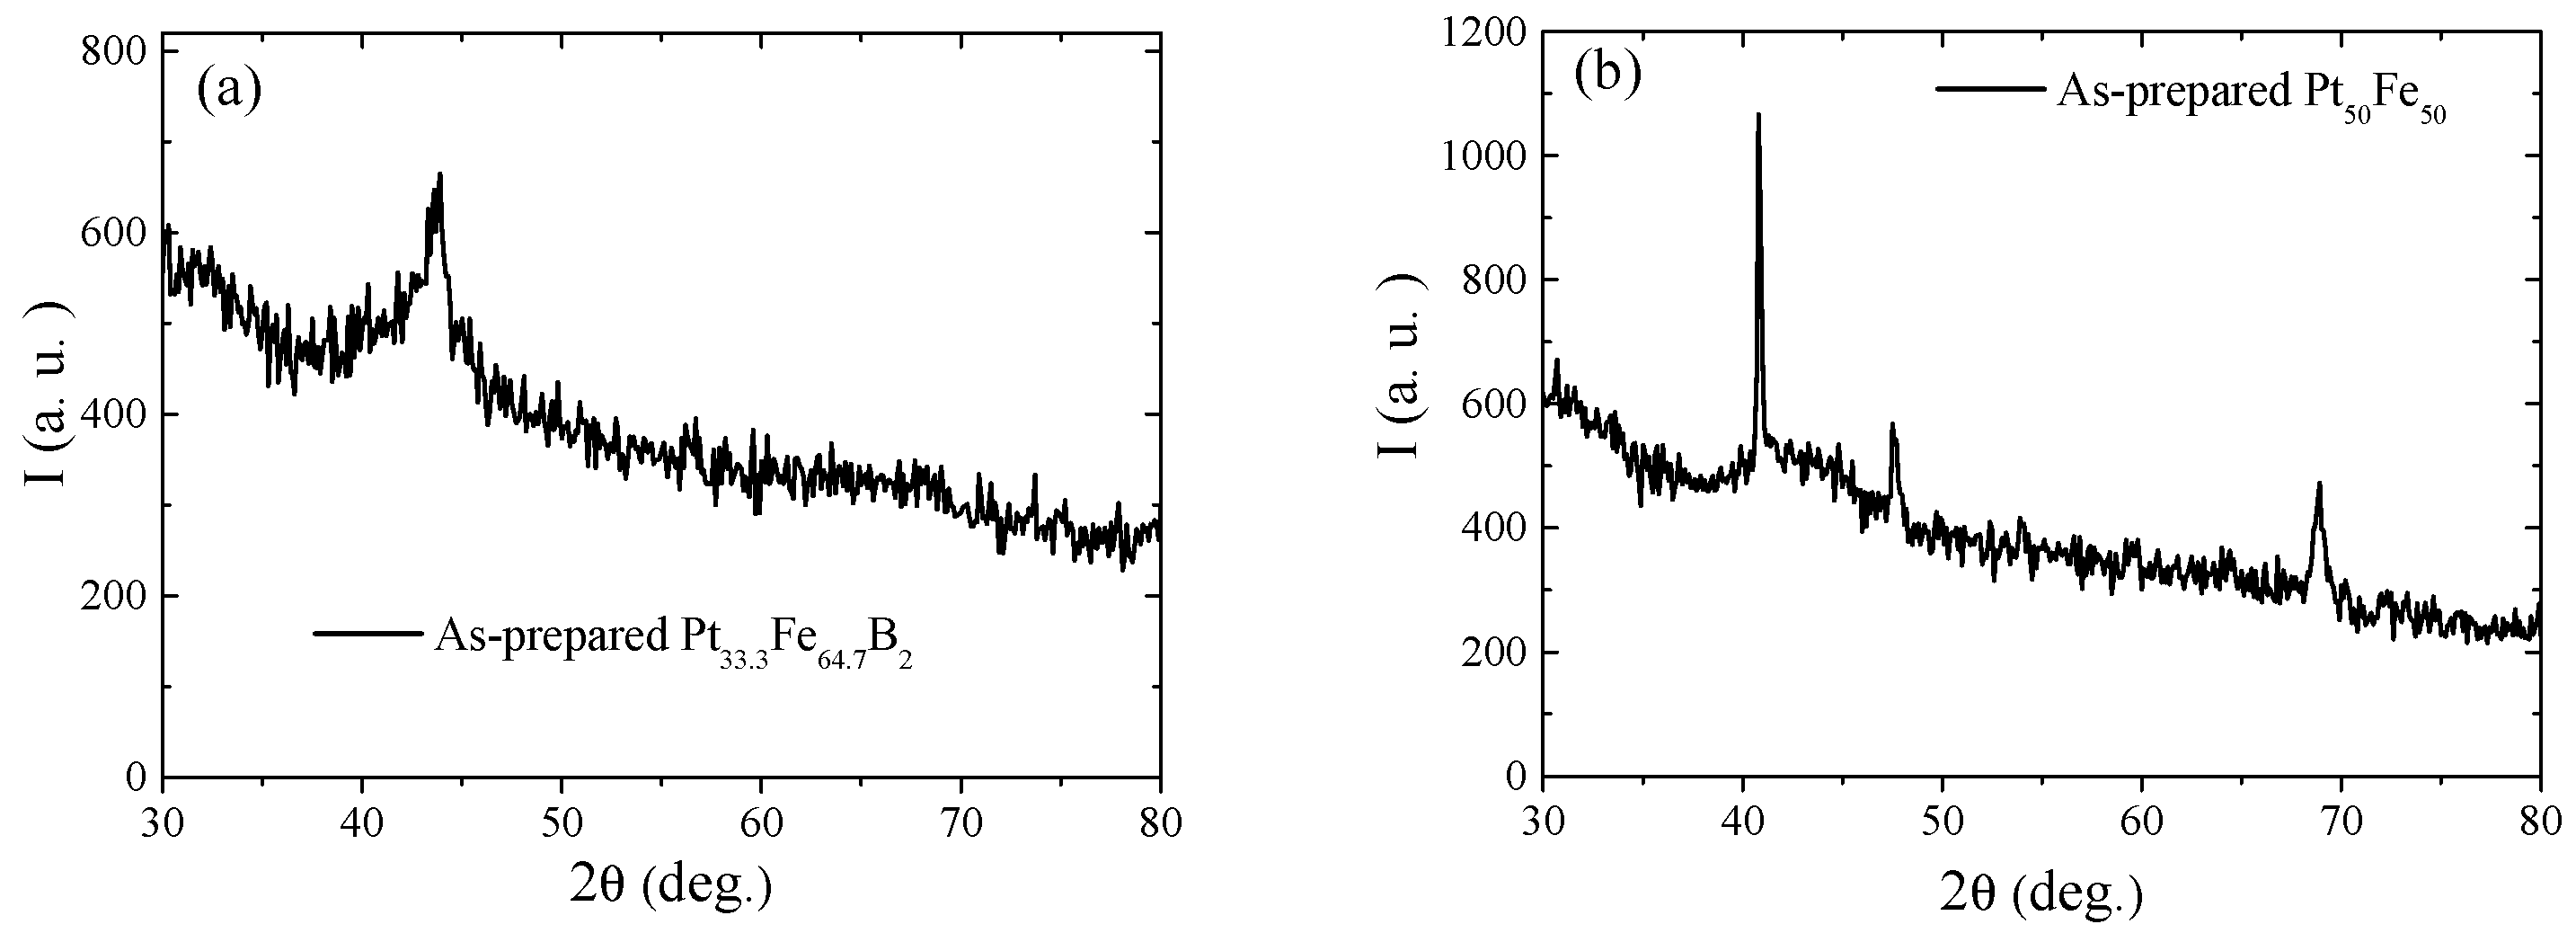
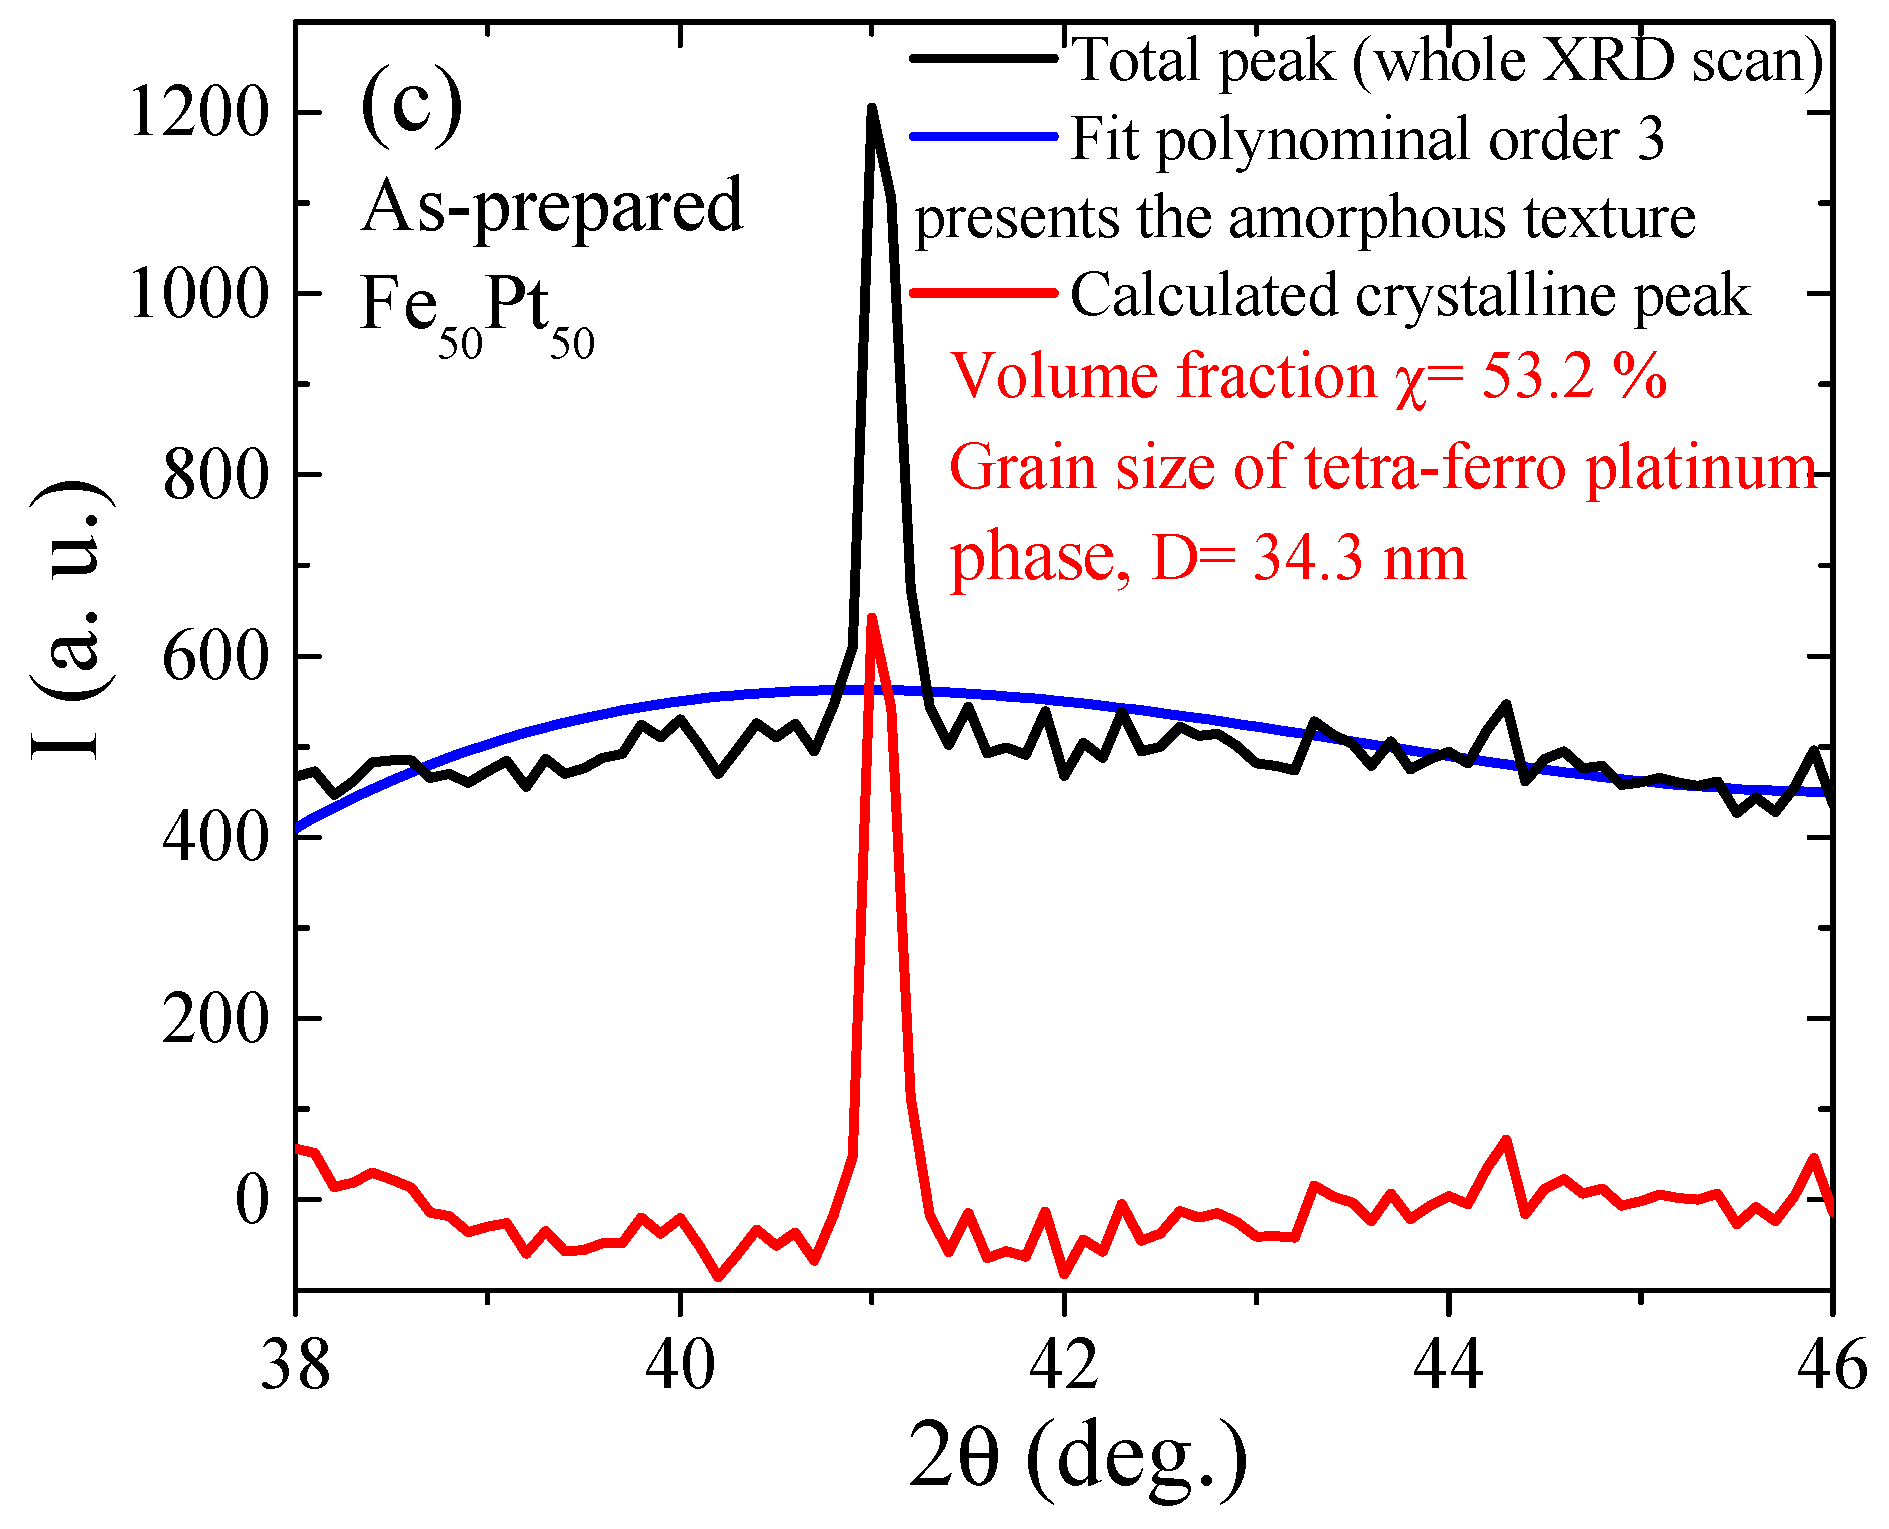
XRD spectra for Fe
64.7Pt
33.3B
2 and Fe
50Pt
50 microwires are presented in
Figure 36a,b.
As can be clearly seen, either both samples (Fe
64.7Pt
33.3B
2 and Fe
50Pt
50) present a mixture structure consisting of fine crystallites embedded in an amorphous matrix. A noticeable XRD peak at 2
θ = 43.8° observed in Fe
64.7Pt
33.3B
2 sample corresponds to bcc α-FePt (Im-3m) disorder structure with a lattice constant a = 2.88 (A°) [
102]. Sharp crystalline peak observed in Fe
50Pt
50 microwires at 2
θ = 41.1º is comparable with
fcc FePt
3 Fm-3m (A1) disorder phase with a lattice constant a = 3.8 (A°) [
103]. Considering the width of the main crystalline peak as well as the crystallization angle, 2
θ, using the Debye-Scherrer equation one can obtain the value of the grain size (
Dg) or the crystalline phase content as shown in
Figure 36c. The same technique we employed for studies of the nanocrystalline FeSiBNbCu microwires [
64]. Using this method, we got for the Fe
50Pt
50 microwire a volume fraction of about 53% and
Dg ≈ 34 nm. In the case of for Fe
33.3Pt
64.7B
2 microwires the volume fraction found to be about 40% with
Dg ≈ 8 nm. It is worth mentioning that similar magnetic properties have been reported for the bulk nanocrystalline (Fe
80Nb
6B
14)
1-xPt
x alloys prepared by vacuum suction casting technique [
104].
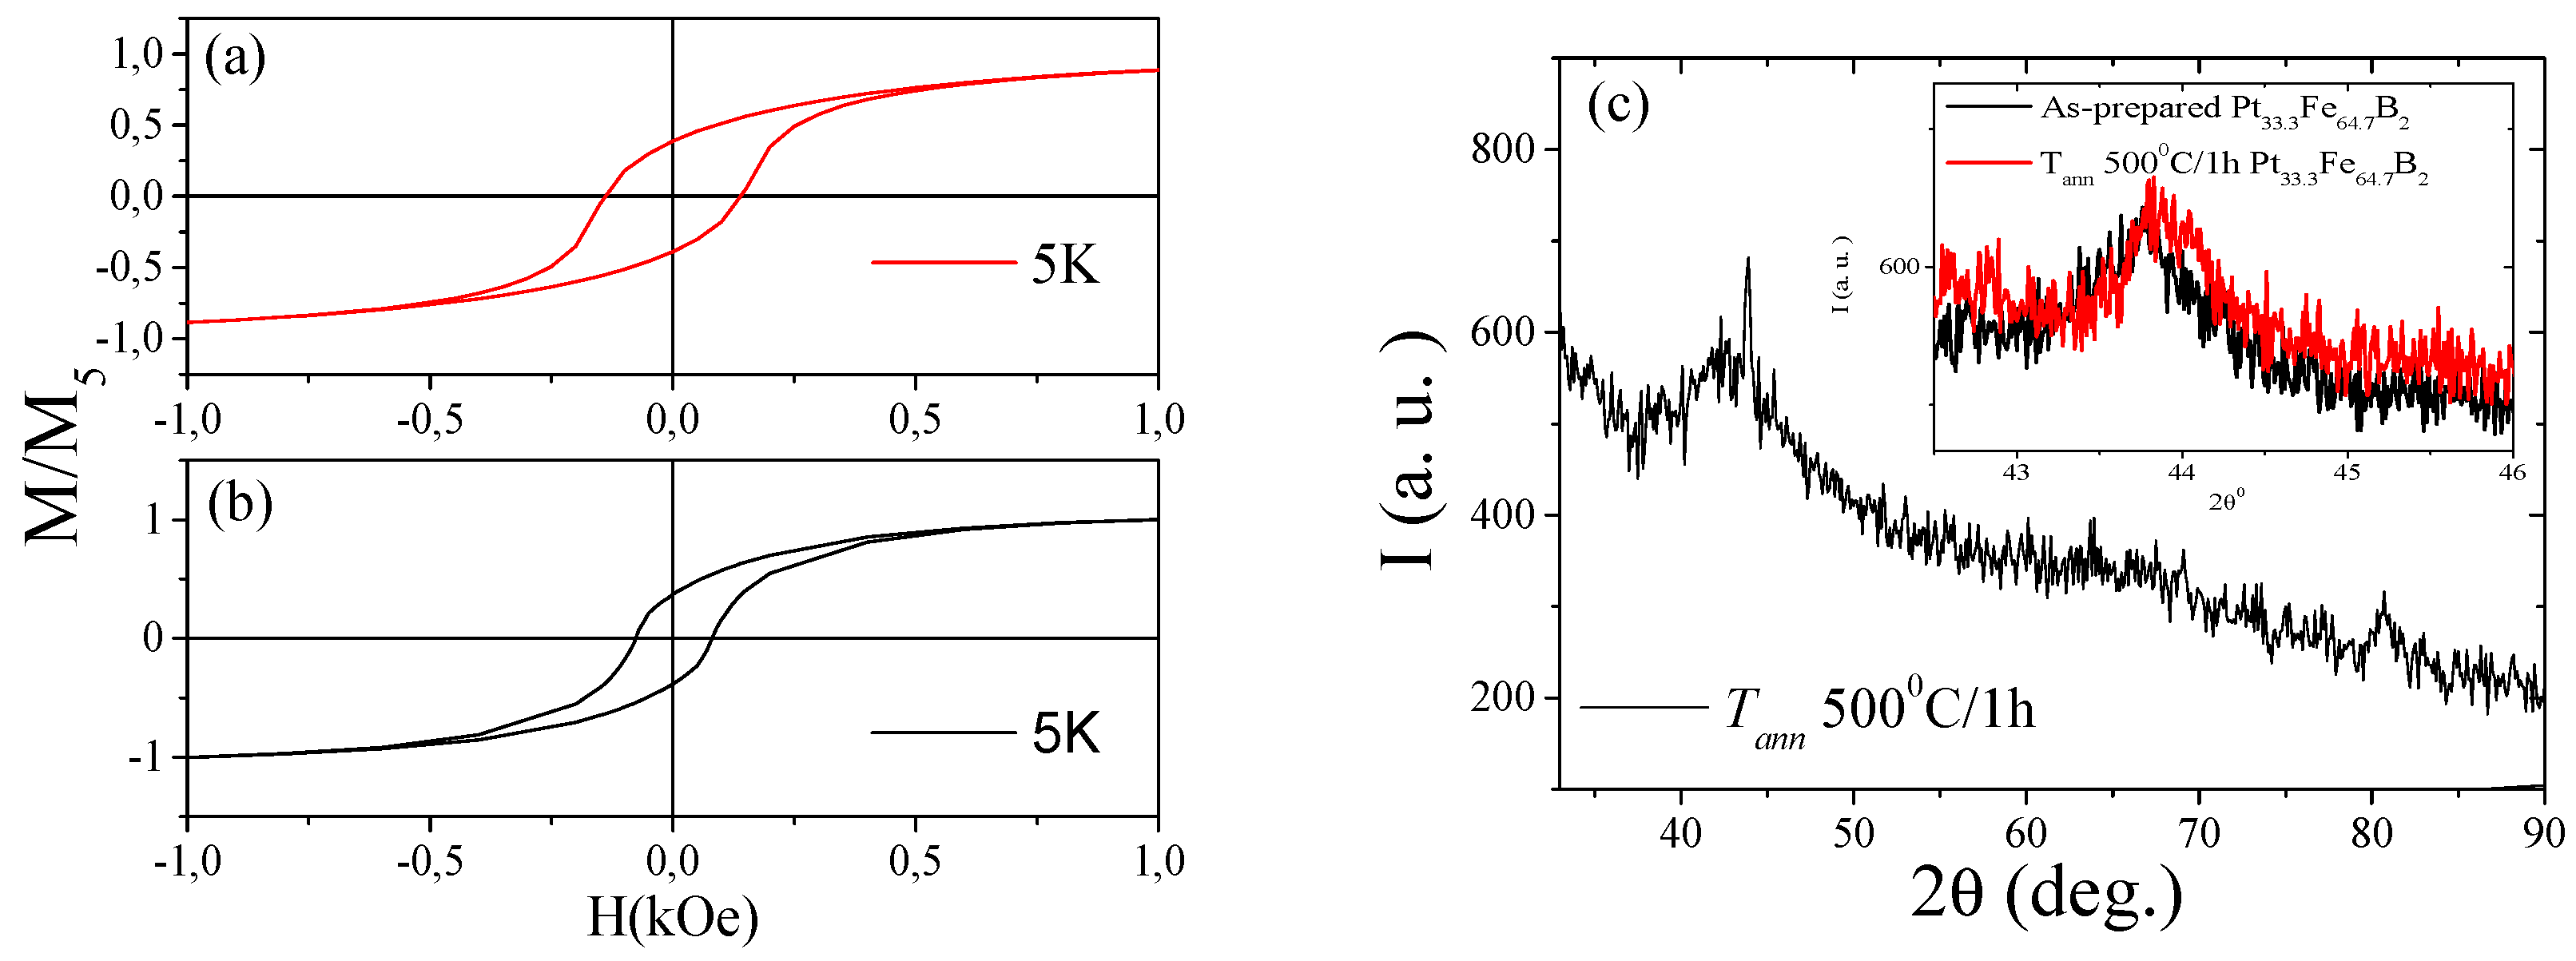
While for the case of Fe
64.7Pt
33.3B
2 no evidences of any considerable structural changes are detected (see inset
Figure 37c). The grain size is even preserved after annealing with no observable change.
Therefore, observed magnetic softening can be attributed to the stress relaxation and a decrease of the magnetoelastic anisotropy as reported for Fe-based microwires [
64]. On the other hand, the coercivity mechanism of Fe-Pt thin films is somewhat different from conventional pinning theory. The coercivity increase with the proportion of the ordered volume fraction until full ordering is reported [
103]. It is believed that magnetic properties of Fe-Pt thin films are affected by the competition between shape and magnetocrystalline anisotropy and by the fabrication method [
105]. Therefore, understanding of the coercivity and magnetization reversal mechanisms in nanocrystalline low dimensional FePt materials is quite relevant since grains are smaller than the critical single domain size and the nanostructure within a grain may differ from that of bulk magnets.
After annealing of Fe
64.7Pt
33.3B
2 microwires at T
ann = 500 °C for 1 h a notable decrease of the coercivity from 140 to 80 Oe is observed (
Figure 37a,b).
Consequently, Taylor-Ulitovsky method can be used for preparation of various magnetically semi-hard thin microwires.
Magnetic properties considerably depend on the metallic alloy composition and on preparation and thermal treatment conditions. We can obtain semi-hard magnetic microwires with coercivity from 5 to 800 Oe. Grain size, shape and magnetocrystalline anisotropy must be considered for preparation of magnetically hard magnetic microwires.
6. Heusler-Type Microwires
Studies of ternary stoichiometric intermetallics with the general formula XYZ (called half-Heusler) or X
2YZ (full Heusler), in which X and Y are typically transition metals (where Z is a group III-V element). Z element selection and atomic percentage have attracted considerable interest owing to a number of interesting features such as large magnetic field-induced strain (MFIS), the ferromagnetic shape-memory (FMSM) effect, magnetic field induced martensitic transition, a substantial magnetocaloric effect and the half-metallic behavior observed in some of these materials [
25,
26,
31,
106,
107,
108,
109].
Nowadays, one of the research fields of interest is the search for affordable magnetic materials which exhibit: (a) a large MCE and (b) working temperature in the 100 up to 300 K range under the application of a magnetic field as lower as possible (Δ
H < 10 kOe). The most extensively studied Heusler alloys that have those properties is Ni-Mn-Ga system. Nevertheless, to address some of the problems related to practical applications (such as the elevated Ga cost and the usually low martensitic transformation temperature), the search for Ga-free alloys has been recently attempted. To reduce such costs and to improve the martensitic transition temperature, the substitution of Ga is proposed by introducing In, Sb or Sn [
110,
111,
112,
113,
114,
115] instead. These ferromagnetic shape memory alloys (FSMA) exhibit both ferromagnetism and shape memory effect simultaneously.
The ferromagnetic shape memory effect can be controlled mainly by applied stress, temperature and/or external magnetic field. Recently, Ni-Mn-In Heusler alloys have drawn much attention due to their potential as ferromagnetic shape memory alloys, which undergo a thermoelastic martensitic transformation (MT) from parent austenitic phase to a martensitic one on cooling [
110,
111,
112,
113,
114,
115]. By lowering the temperature, a cubic high-temperature parent austenite phase transforms into a martensite (tetragonal, orthorhombic or monoclinic). Likewise, orthorhombic and monoclinic martensites can be also structurally twinned or modulated. These alloys exhibit notable sensitivity of MT to the applied magnetic field and they seem to be among the most suitable for the room temperature (RT) applications. For example, the giant magnetocaloric effect favors application in micro and nanomechanics devices and also in alternative energy technologies [
108,
109,
110,
111]. Moreover, some authors have reported that such FSMAs also present giant magnetoresistance due to the first-order phase transition, which can undergo a GMR variation of around 80% [
31]. The transformation temperatures spread in a very wide range and depend on the composition [
108,
109,
110,
111].
The aforementioned properties of Heusler-type alloy are suitable for applications in: (a) magnetic actuators and sensors, (b) energy-harvesting devices, (c) solid-state magnetic refrigeration and (d) other smart devices. The observed properties are related to magnetostructural transitions (MST) [
108,
109,
110,
111]. A MST is a transition that results in a simultaneous change of the structure (austenite-martensite) and magnetic state of the material. Martensitic transition (MT) is well-known in materials science as a first-order phase transition from the high temperature austenitic phase (AP) to the low temperature martensitic phase (MP).
Usually, MST can be induced by an external magnetic field. In spite of the significant progress made in recent years in the analysis of the functional properties of Heusler alloys with MST, the detailed mechanisms responsible for the MST are far from being well understood.
Among the abovementioned features of Heusler-type alloys high MCE is considered as fairly attractive for magnetic refrigeration [
108,
109,
110,
111]. Refrigeration capacity depends on the heat (absorbed or released) per cycle and the frequency (number of cycles per second). The power of the refrigeration device depends on the heat exchange rate between the active material and the heat-transfer medium. Therefore, the use of either thin wires or thin films is beneficial for enhancement of the surface-to-volume ratio and increasing the heat exchange rate [
108,
109,
110,
111,
114,
115,
116]. Consequently, attempts have been recently taken to prepare either Heusler-type thin films or thin wires.
The conventional method for preparation of Heusler alloys is usually by arc-melting method followed by high temperature (up to 1073 K), and sometimes even long time (up to 3 months) annealing [
31].
During recent few years we performed few attempts to prepare Ni-Mn-Ga, Ni-Mn-In and Ni-Mn-In-Co microwires using Taylor-Ulitovsky method [
25,
26,
114,
115].
As described above, sample preparation involved melting of the metallic alloy inside the glass tube with subsequent rapid quenching to form a composite microwire (cylindrical symmetry). Elements, like Mn can evaporate during the microwire casting. Therefore, although the ingot has been carefully prepared we paid attention to the composition of the microwire after casting.
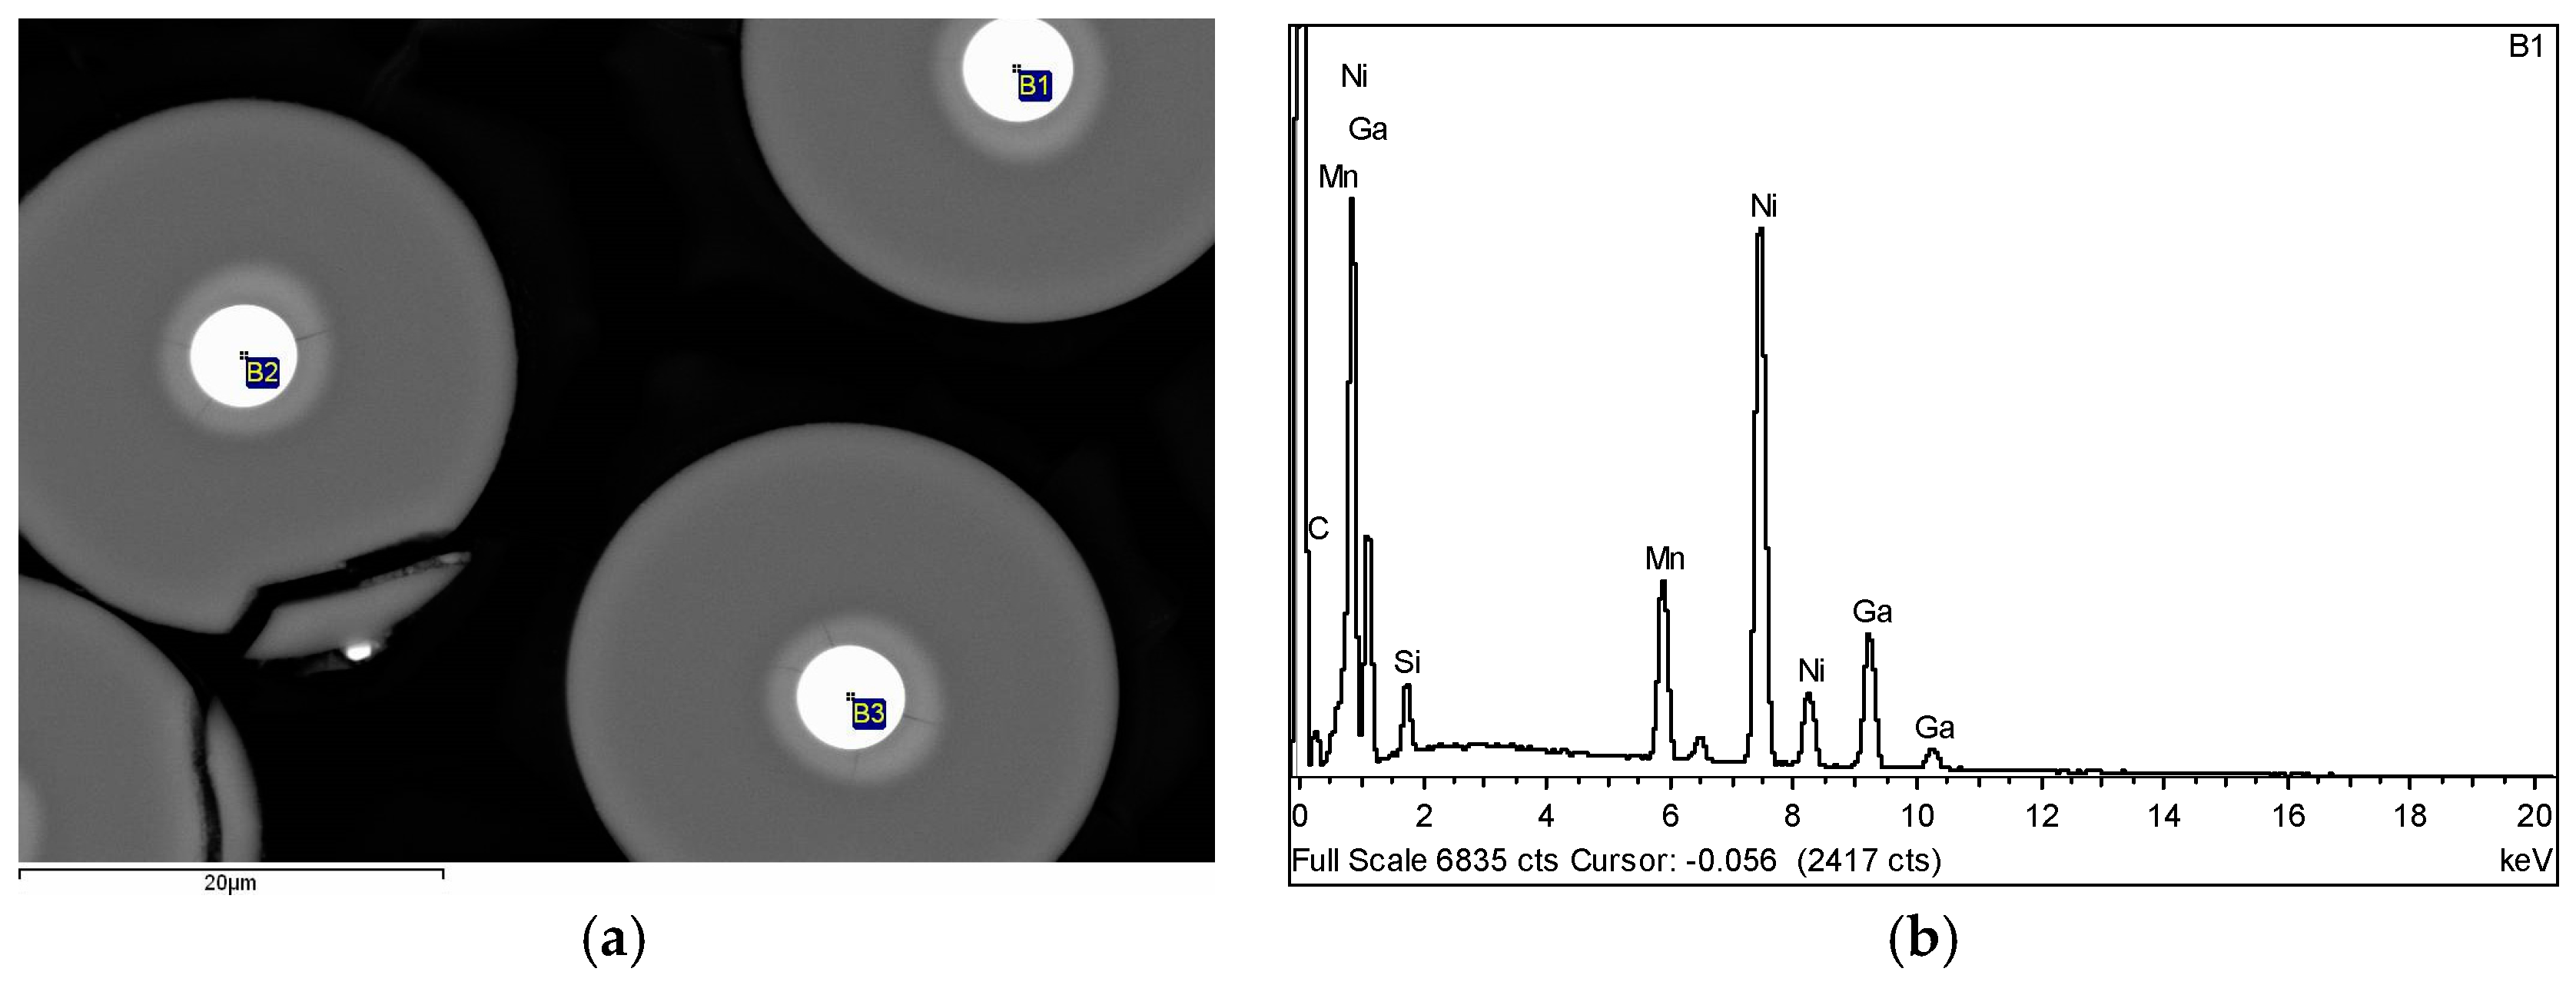
Thus for preparation of Ni
2MnGa microwire we used Ni
49.9Mn
27.8Ga
22.3 (at. %) Heusler alloy [
117]. Chemical composition of metallic nucleus was determined by the EDX analysis in different pieces of the metallic nucleus. As can be appreciated (see
Figure 38) the microwires present perfect cylindrical cross-section with quite homogeneous elements distribution.
From the EDX data obtained from
Figure 38b, it follows that during the preparation, part of Mn was essentially evaporated whereby the chemical composition of the metallic nucleus became Ni
59.2Mn
12.2Ga
28.6 (at. %). Therefore, for preparation of the Ni
2MnGa microwires using the Taylor-Ulitovky technique the ingot with higher Mn content must be used.
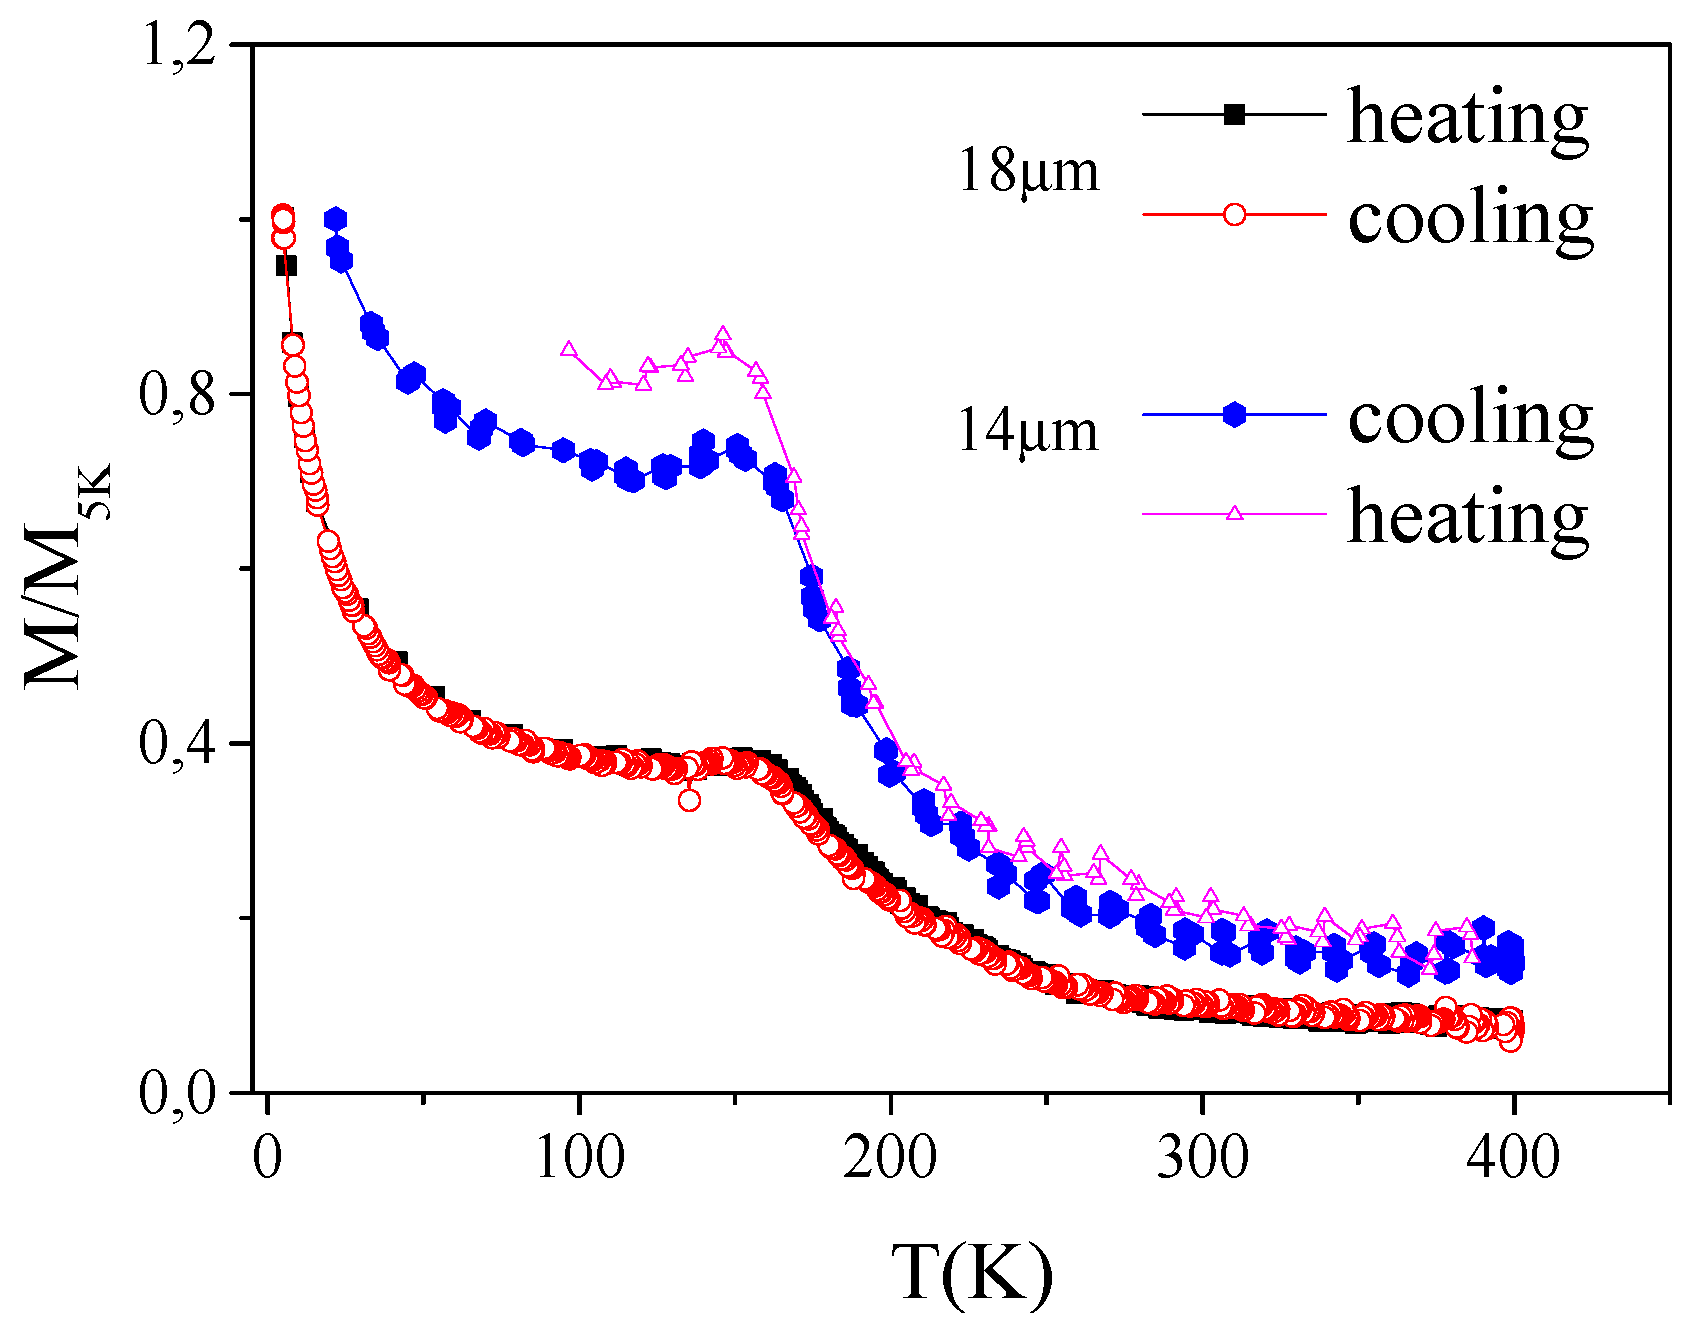
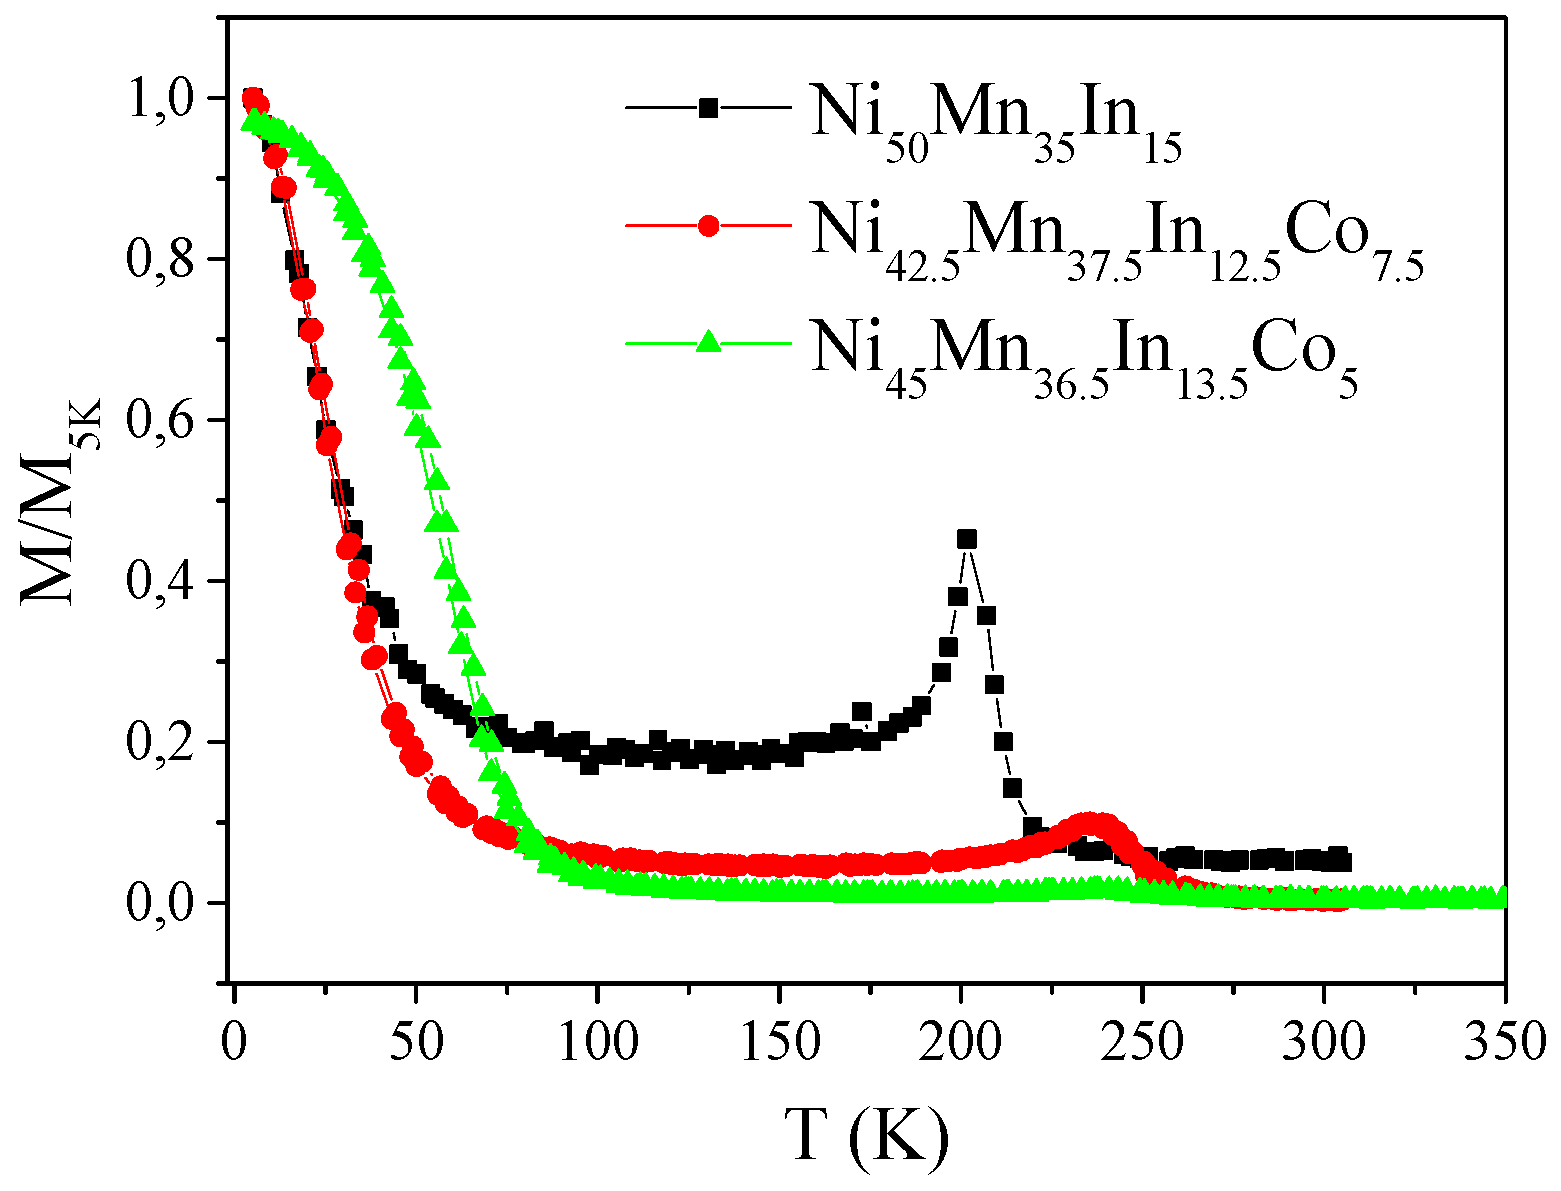
As-prepared Ni-Mn-Ga and Ni-Mn-In(Co) microwires at room temperature exhibit a very weak magnetization (
Figure 39 and
Figure 40). Moreover, the magnetization considerably depends on the magnetic field.
The normalized magnetization,
M/M5K, of Ni-Mn-Ga microwires (d = 14 and d = 18 μm) drastically drops at heating presenting a weak maximum at some temperature,
Tp ≈ 149 and 157 K (
Figure 39).
For Ni50Mn35In15, Ni42.5Mn37.5In12.5Co7.5 and Ni45Mn36.5In13.5Co5 microwires similar M(T) dependence has been observed. But Tp-values are above 200 K.
Observed low magnetization can be attributed to the magnetic and atomic disorder.
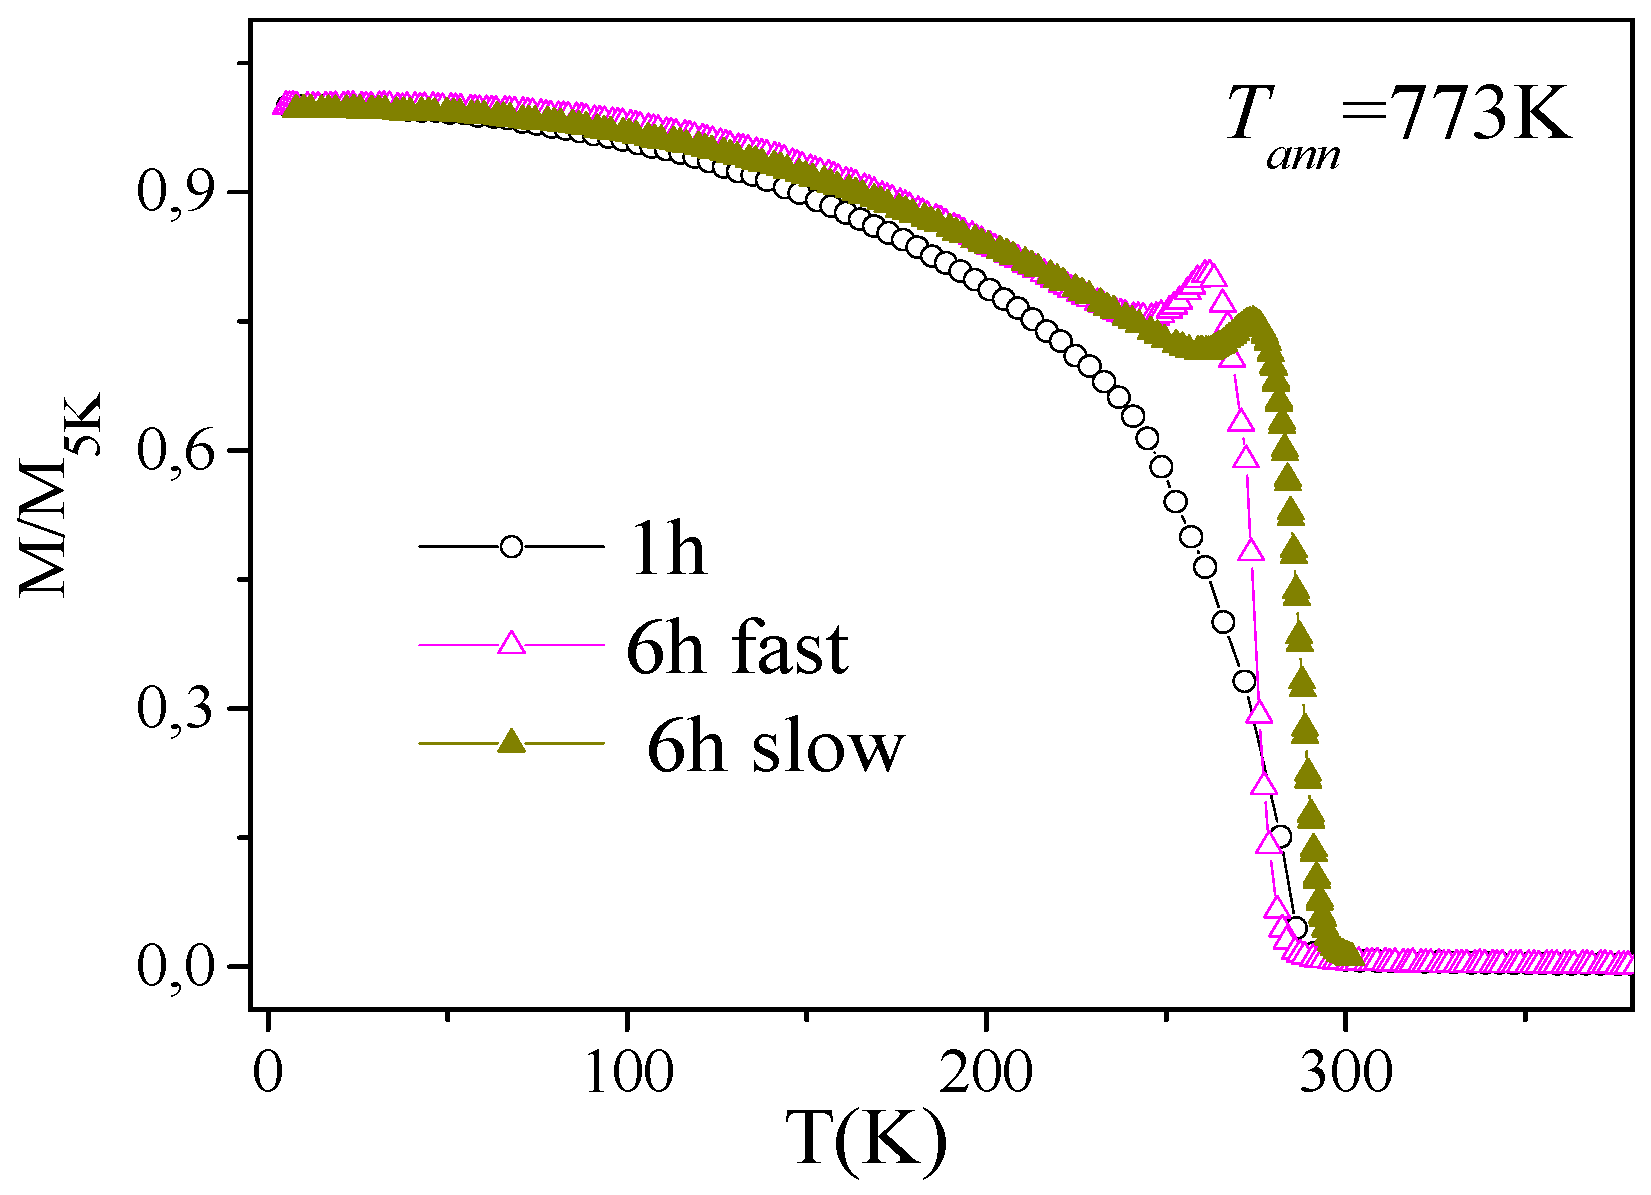
To reduce disorder and the internal stresses, we performed the annealing of the samples at 773 K for 1–6 h with subsequent fast (on air) or slow (with the furnace) cooling.
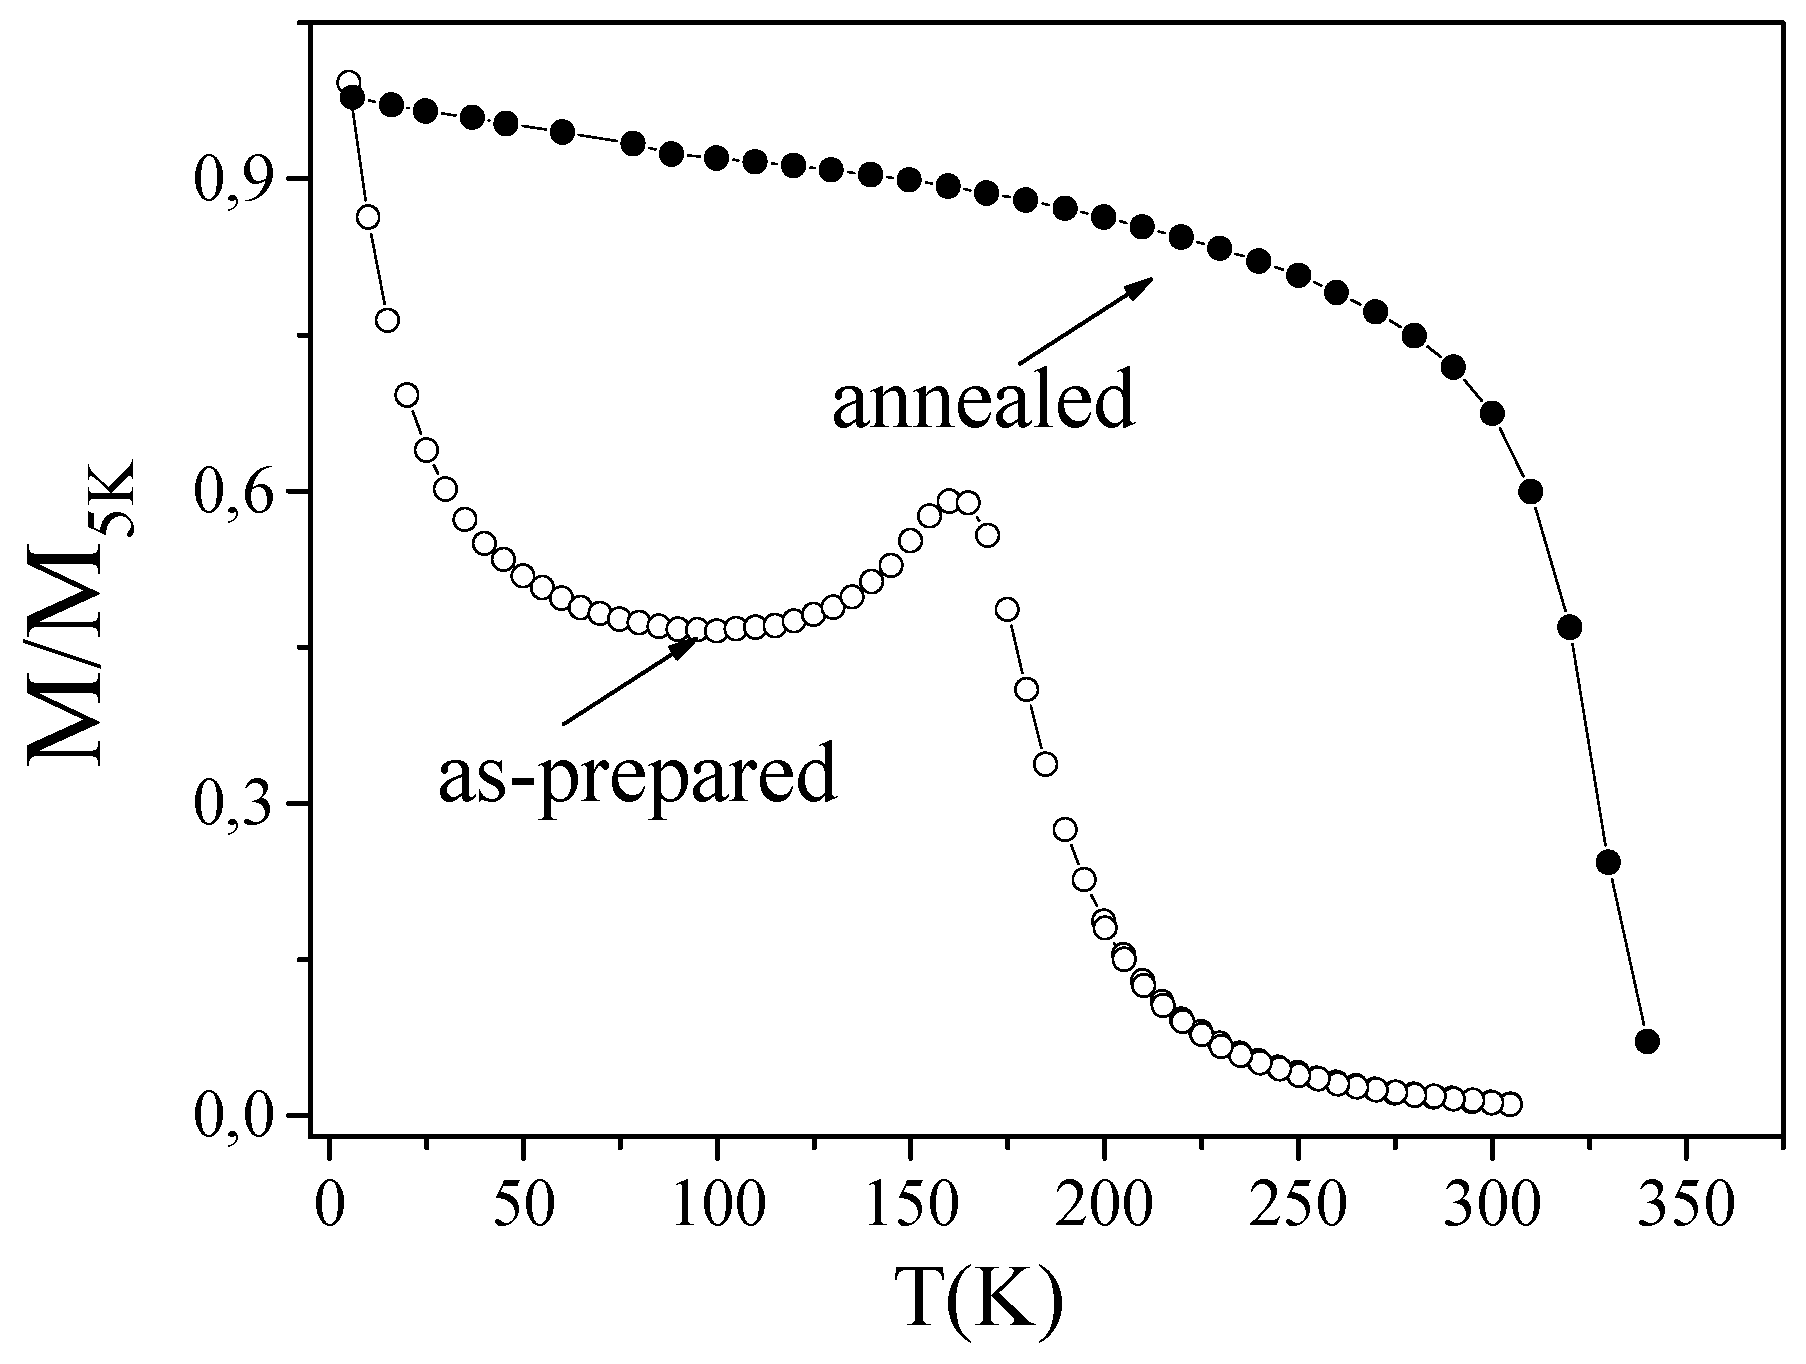
Annealing considerably affects magnetic behavior of all Heusler-type microwires: a ferromagnetic ordering with Curie temperature,
Tc, near room temperature for both annealed samples was observed (see
Figure 41 for the Ni-Mn-Ga sample with d = 14.4 μm).
It is worth mentioning that not only annealing time, but also cooling conditions after annealing affected the
M/M5k (T) dependencies and
Tc-values. As it can be appreciated from
Figure 42,
Tc increases with increasing of the annealing time. The further
Tc increasing is produced by slow cooling (inside furnace).
Similarly to the as-prepared microwires, the annealed samples (6 h annealing time) present a maximum on
M/M5k (T) dependences at a temperature,
Tp, just below the Curie temperature. This peak may be attributed to the Hopkinson effect. The temperature of this peak depends on the cooling conditions. On the other hand, this maximum was not observed in the samples annealed for 1 h (see
Figure 42).
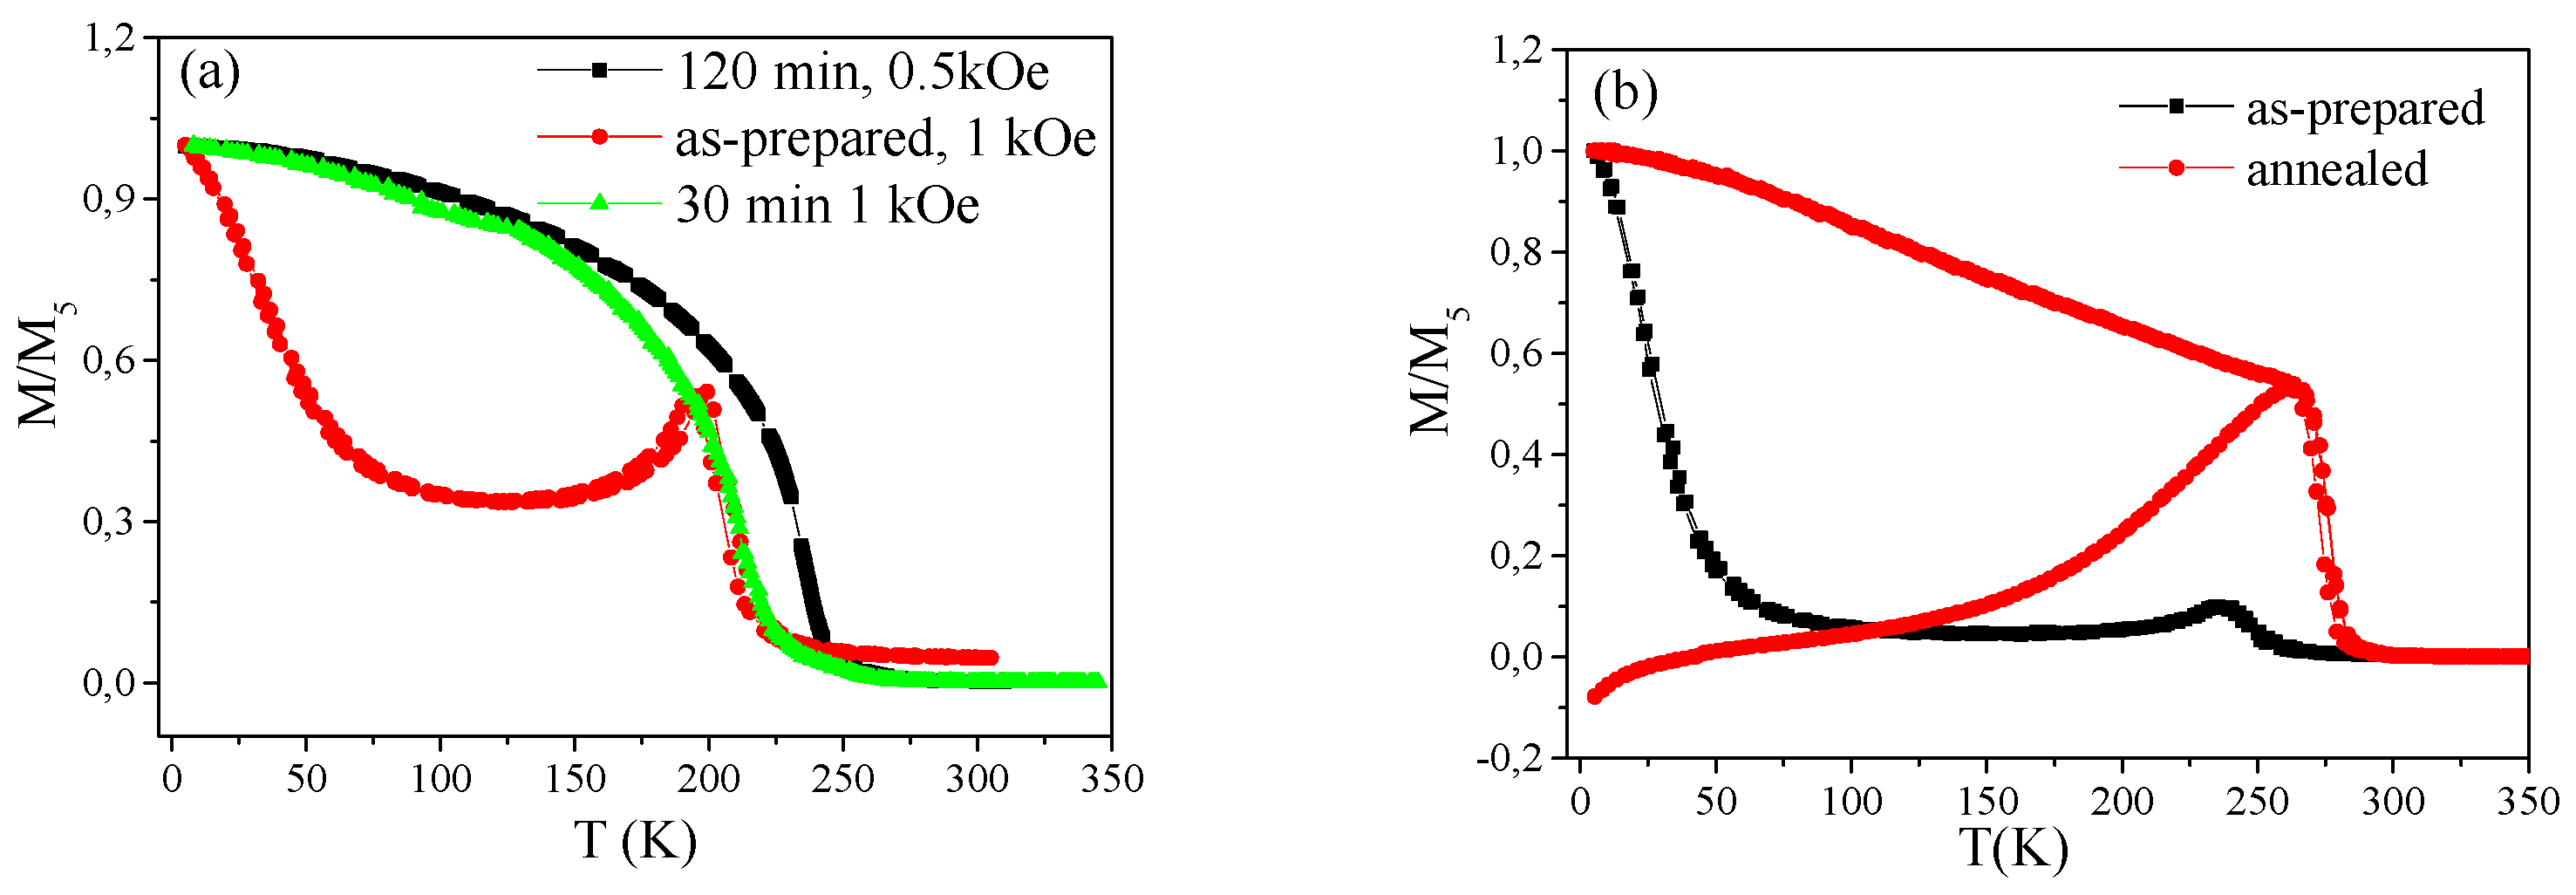
Similar tendency (appreciable increasing of
Tc) has been observed for Ni
50Mn
35In
15 and Ni
42.5Mn
37.5In
12.5Co
7.5 samples (
Figure 43).
Qualitatively, the observed
M/M5K(T) dependences are similar to those observed in the bulk Heusler-type alloys. Generally, the anomalies in the temperature dependences of the magnetization for the bulk Ni-Mn-Ga alloys have been explained considering three phase transition temperatures:
TCM—Curie temperature of martensitic phase, T
M—temperature of martensitic transition, and
TC—Curie temperature of the austenitic (high temperature) cubic phase [
118,
119,
120]. The sequence of these transitions depends primarily on the chemical composition of the alloys which is very convenient to express via the valence electron concentration per atom,
e/
a [
121]. Thus, for bulk Ni
59.2Mn
12.2Ga
28.6 alloy we can predict that
Tc >
TM [
122]. In addition, like in other Hume-Rothery alloys, the structural instability of cubic phase depends on the specific volume [
121]. The atomic order, defect structure and internal stresses may also affect the relative stability of phases and magnetic exchange interactions [
123].
Described above behavior of as-prepared Ni-Mn-Ga microwires is quite similar to Ni-Mn-Ga thin films deposited on the cold substrate. The latter ones were quasi-amorphous and exhibited the paramagnetic behavior in a wide temperature range [
124]. The annealing induces a recrystallization process accompanied by atomic order and internal stresses relaxation whereby restoring a ferromagnetic state of sample. The observed
Tc -values are affected by annealing conditions and much lower than those anticipated from the phase diagram reported in Ref. [
121], taking into account
e/
a = 7.63 calculated for the wire (i.e., for the sample annealed at 773 K for 6 h
Tc≈ 270 K as can be estimated from
Figure 42). This behavior can be related to: (a) chemical composition of wires, which is strongly depleted by Mn atoms that are main carriers of the magnetic moment and (b) strong constraint conditions typical for glass-coated microwires. Although the structural state of the wires is matter of further studies, the following considerations could provide some insight. First, observed one-step sharp magnetization change favors an assumption that the metallic nucleus does not exhibit precipitation. Second, an absence of the hysteresis-like anomaly on
M/M5k(T) curves typical for martensitic transformation means that the Curie temperature belongs either to the martensite,
TCM, (in this case
TM > Tc) or to the austenite (in this case, the ferromagnetic austenite is stable down to 5 K). Similar effect has been reported for Ni
50Mn
25Ga
25 ESRF diffraction experiments at room temperature and 175 K.
The second scenario is most probable due to the strong deviation from stoichiometry, low
Tc-values and a strong constraint conditions. Indeed, the main peculiarity of the glass-coated microwires is related to strong internal stresses arising during the rapid and simultaneous solidification of metallic nucleus surrounded by glass coating. Estimated value of internal stresses in glass-coated microwires is between 100 and 1000 MPa [
50,
73,
125]. These stresses are distributed in complex way within the microwires. Moreover, the internal stresses distribution along the microwire’s radius is not homogeneous: near the microwire axis the tensile stresses are the strongest one. But closer to the interface between the metallic nucleus and glass coating, the compressive stresses are dominant [
50,
125]. The reported values of stresses induced by the magnetic field in bulk Ni-Mn-Ga alloys are between 1 and 7 MPa [
125] being much lower than aforementioned internal stress. Consequently, the internal stresses arising during the preparation of glass-coated microwires can impede the phase transition.
One of the advantages of prepared glass-coated Heusler-type microwires is related to their improved mechanical properties. Brittle Ni-Mn-Ga metallic nucleus is surrounded by flexible glass coating. Indeed, the glass coating is quite flexible for the glass-coating thicknesses of a few μm [
33,
34,
35,
36,
37,
38,
39,
40]. Therefore, for the case of fragile crystalline metallic nucleus (like the case of Heusler-type or Finemet-type nanocrystalline microwires), the glass coating can reinforce the mechanical properties. But for “thick” glass-coated microwires, the glass coating cracks upon strong bending and can be removed from the metallic nucleus [
126].
On the other hand, internal stresses induced by the glass coating can considerably affect magnetic properties and even crystallization process of glass-coated microwires. Thus, drastic change of the hysteresis loops upon glass coating removal performed using chemical etching in HF of amorphous Co-rich microwires is observed: initially linear hysteresis loop acquires rectangular shape [
127]. It is obvious that there is a difference between the thermal expansion coefficients of metallic nucleus and glass coating. Thus, the glass coating introduces additional preferentially axial internal stresses. Consequently, glass-coating removal releases these stresses and therefore affects the magnetoelastic anisotropy of amorphous microwires. Recently we reported that the phase composition of the annealed in the presence of glass coating and without glass coating Ni-Mn-Ga microwires was different [
128].
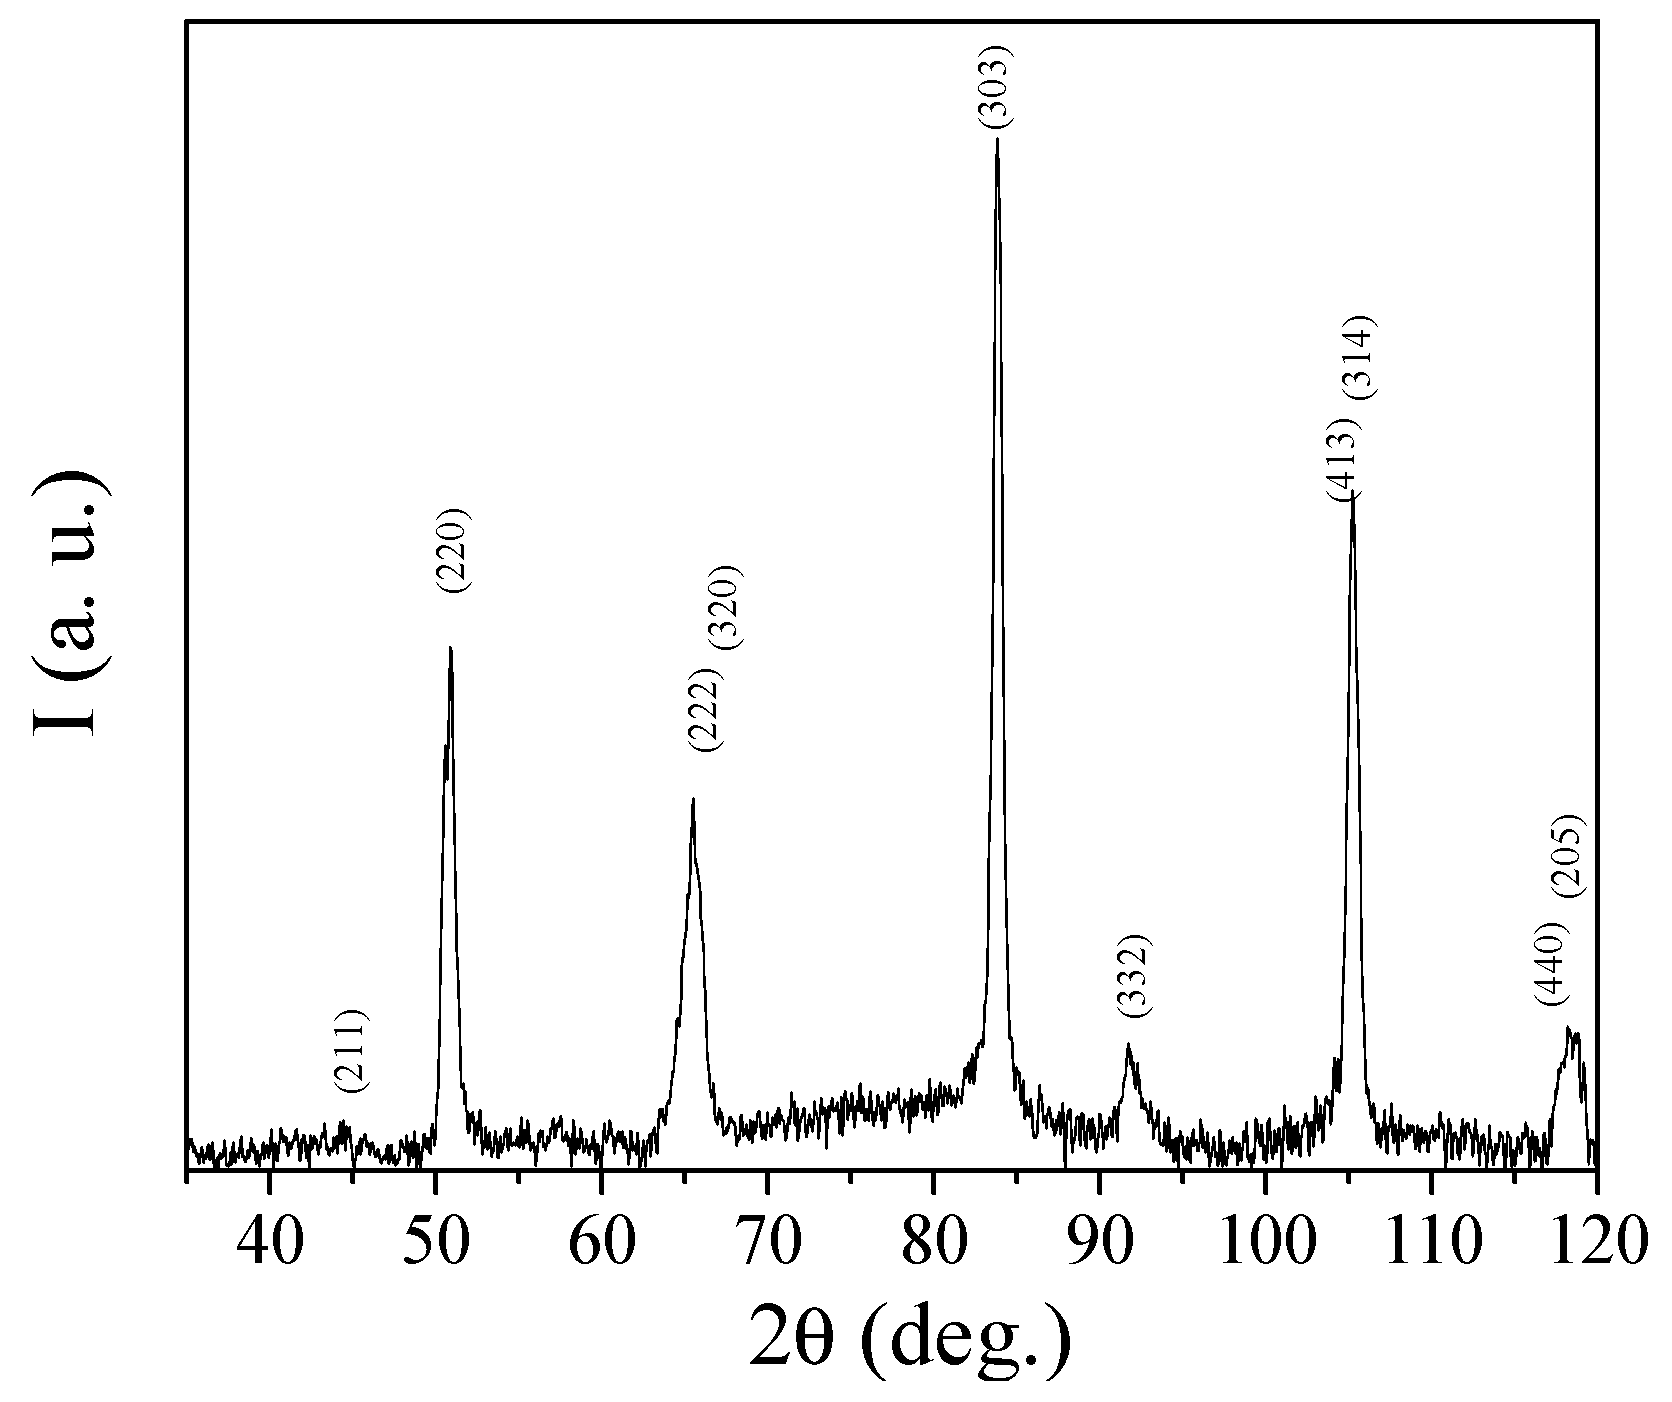
Indeed, Ni
63.8Mn
11.1Ga
25.1 microwire presents single-phase crystalline structure that can be described by a tetragonal lattice of spatial group I4/mmm with lattice parameters
а = 5.92 Å,
с = 5.666 Å, known as a martensitic tetragonal phase (see
Figure 44) [
128,
129]. The broadened XRD reflections have been explained considering the stresses arising during the microwire preparation. We observed that immediately after preparation the alloy contains a martensitic phase at room temperature.
The observed tetragonal martensitic phase is expected to exist at temperatures of ~200 K. We attributed the existence of martensitic phase at room temperature to the non-stoichiometry of the alloy and the stress influence.
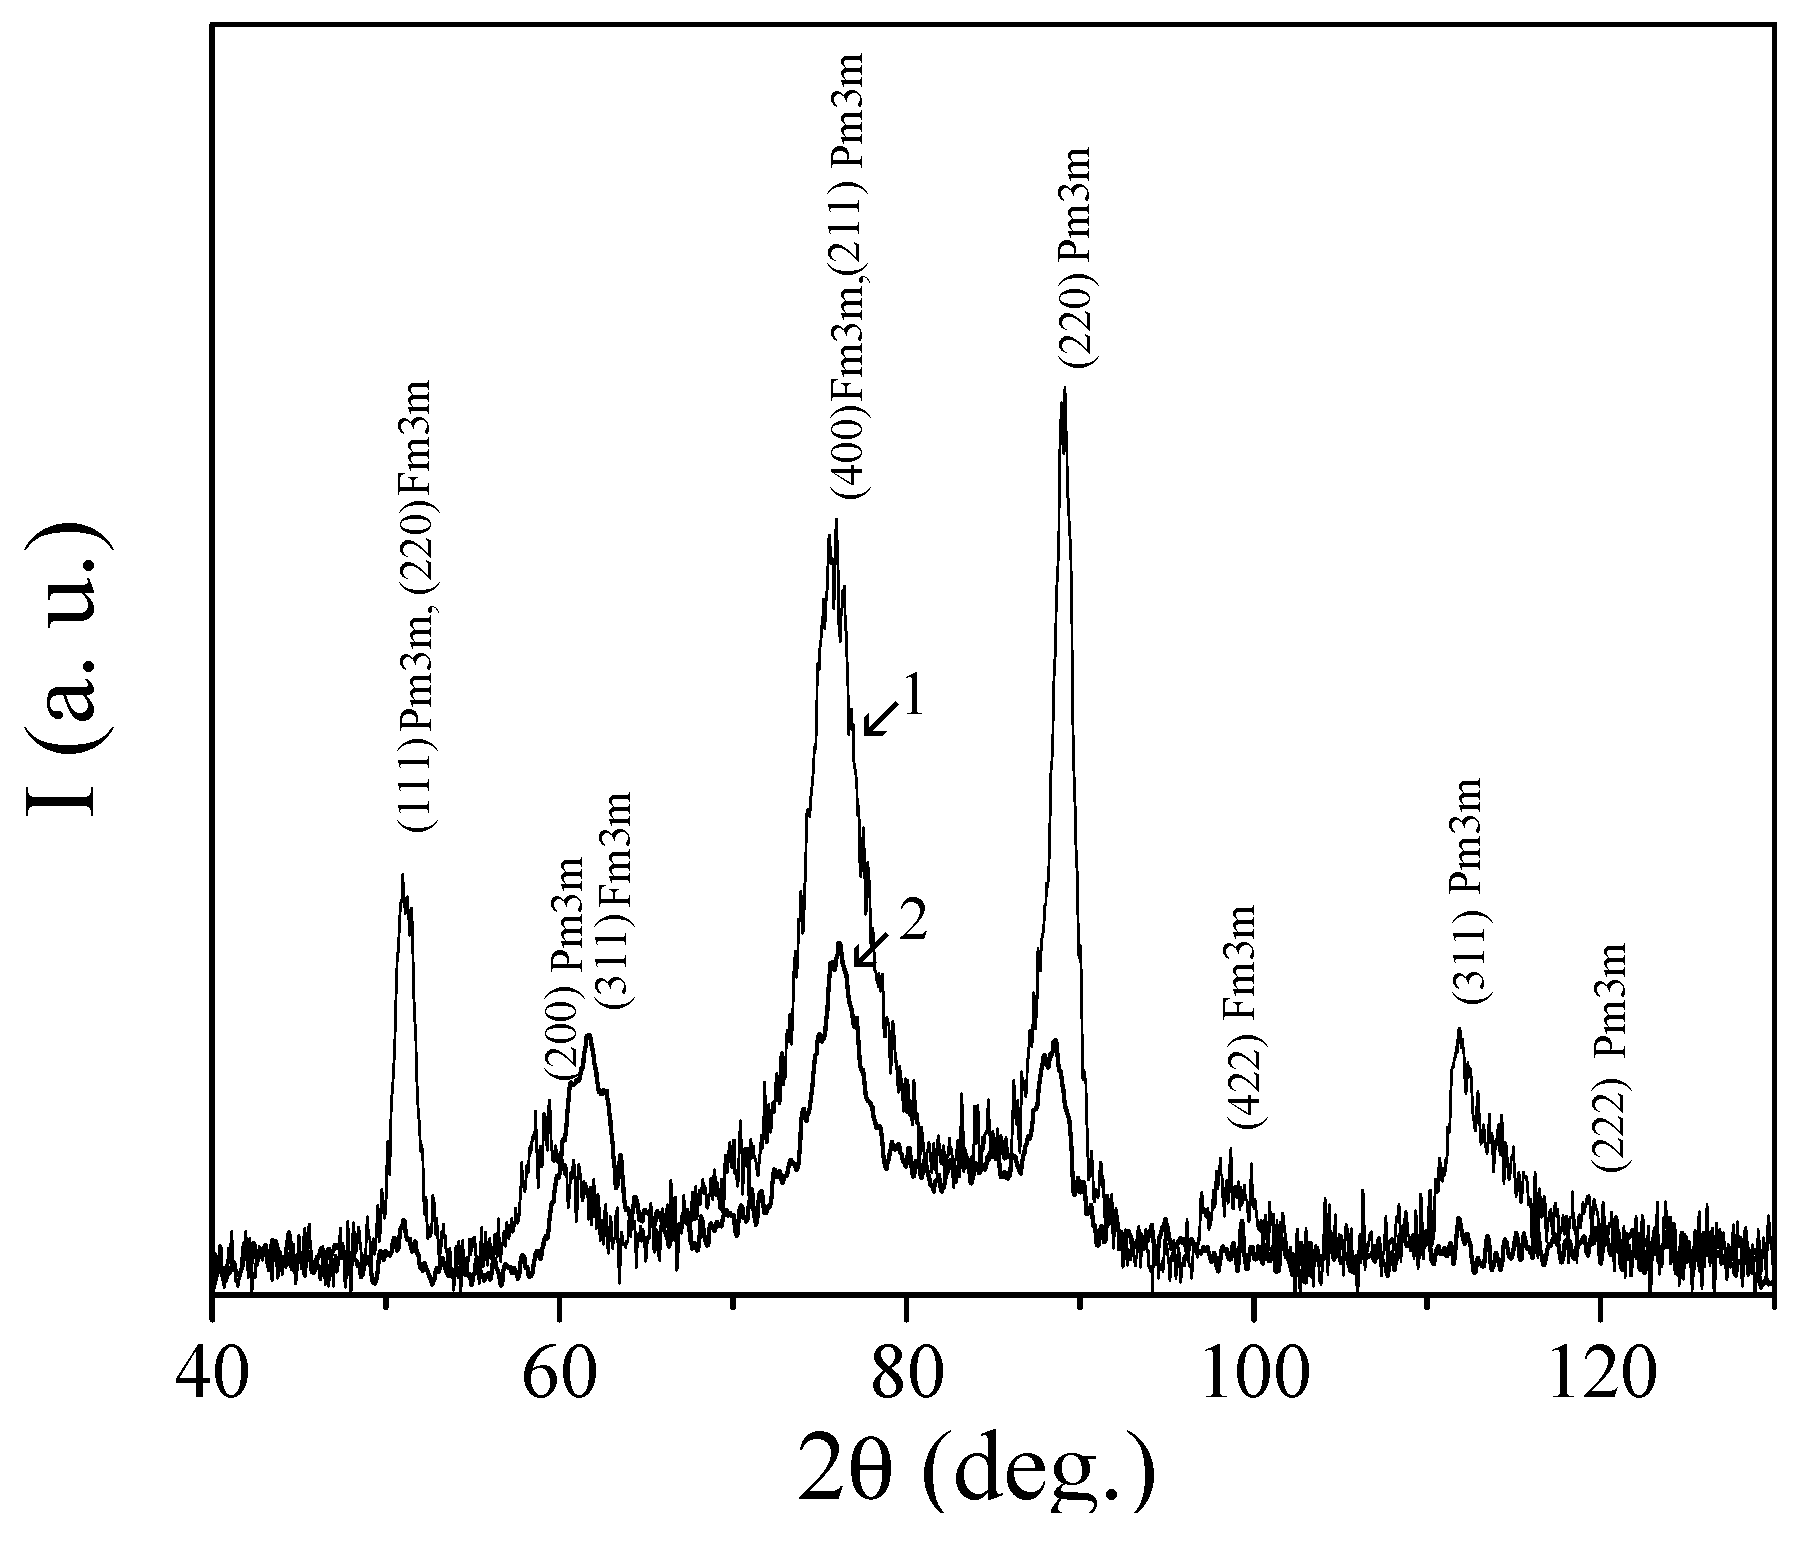
As shown above, annealing considerably affects magnetic properties. Moreover glass coating has been identified as one of the factors introducing stress and disorder. Consequently, we studied the annealing influence (500 °C for 30 min) on structure of glass-coated and uncoated (with glass coated previously removed) Ni
63.8Mn
11.1Ga
25.1 samples (see
Figure 45). As mentioned above broadened XRD lines can be related to a small grain size as well as the presence of stresses (see
Figure 45). Analysis of the X-ray diffraction pattern revealed that the microwires annealed with coating contained two cubic phases (
Figure 45, curves 1 and 2). The first phase presents a
fcc structure with cell parameter
а = 5.825 Å, spatial group Fm3m, and has been previously observed in Ref. [
129]. The second phase can be described by the primitive cubic cell with spatial group Pm3m with a lattice period of 3.60 Å.
The structure of the annealed samples after glass-coating removal (curve 2 in
Figure 45) is essentially different and can be described by an
fcc lattice with cell parameter
а = 5.78 Å.
As mentioned above internal stresses are originated by three factors: (i) quenching stresses associated to the rapid solidification of the metallic droplet; (ii) complex tensor stresses related to the difference in the thermal expansion coefficients of metallic alloy and glass and iii) axial stresses related to drawing of wire. The calculated stresses distribution within the metallic nucleus indicate that radial stresses σ
rr retain their sign and are positive (tensile). On the contrary, axial, σ
zz, and σ
θθ, stresses are positive (tensile) in the inner part of metallic nucleus, becoming negative (compressive) at
r ~ 0.85
R, where
R is the metallic nucleus radius [
9,
40,
50,
125]. Thus, the stress distribution along the glass-coated microwire’s radius is not homogeneous: near the axis of the metallic nucleus the tensile stresses are the strongest one. Closer to the interface with the glass coating the compressive internal stresses are dominating.
Consequently, we assumed that the double phase structure with such a pronounced difference in volume per atom (49.41 Å3 and 46.66 Å3) might be related to the presence of tensile and compressive internal stresses. These phases can be allocated in the microwire sections with opposite signs of internal stresses i.e., near the wire axis and closer the interfacial layer between the metallic nucleus and the glass coating.
The uncoated samples present a single phase structure. The observed phase with an fcc structure has a lattice parameter а = 5.78 Å with the unit cell volume (193.1 Å3) and the specific volume per atom in such structure (48.28 Å3/atom). Consequently, the structure forming at annealing of uncoated sample has an intermediate value of specific volume as compared to the crystalline phases forming during the annealing of glass coated microwire. It is worth noting that in all the phases resulting from annealing the specific volume per atom is smaller than in the original tetragonal phase. This effect can be attributed to removal (or decrease) of tensile stresses during annealing.
Thus, the samples annealed with and without coating exhibit different structures.
The crystalline structure of annealed Ni-Mn-Ga glass-coated samples was composed of two cubic crystalline phases of different density. The samples annealed without coating presented the single-phase state. The two-phase structure is assumed to be caused by the internal stresses with opposite sign in different microwire sections.
As mentioned above annealed Ni-Mn-Ga samples present Curie temperature (estimated from the approximation of
M(T) dependences to zero
M-values) of about 330 K (
Figure 41).
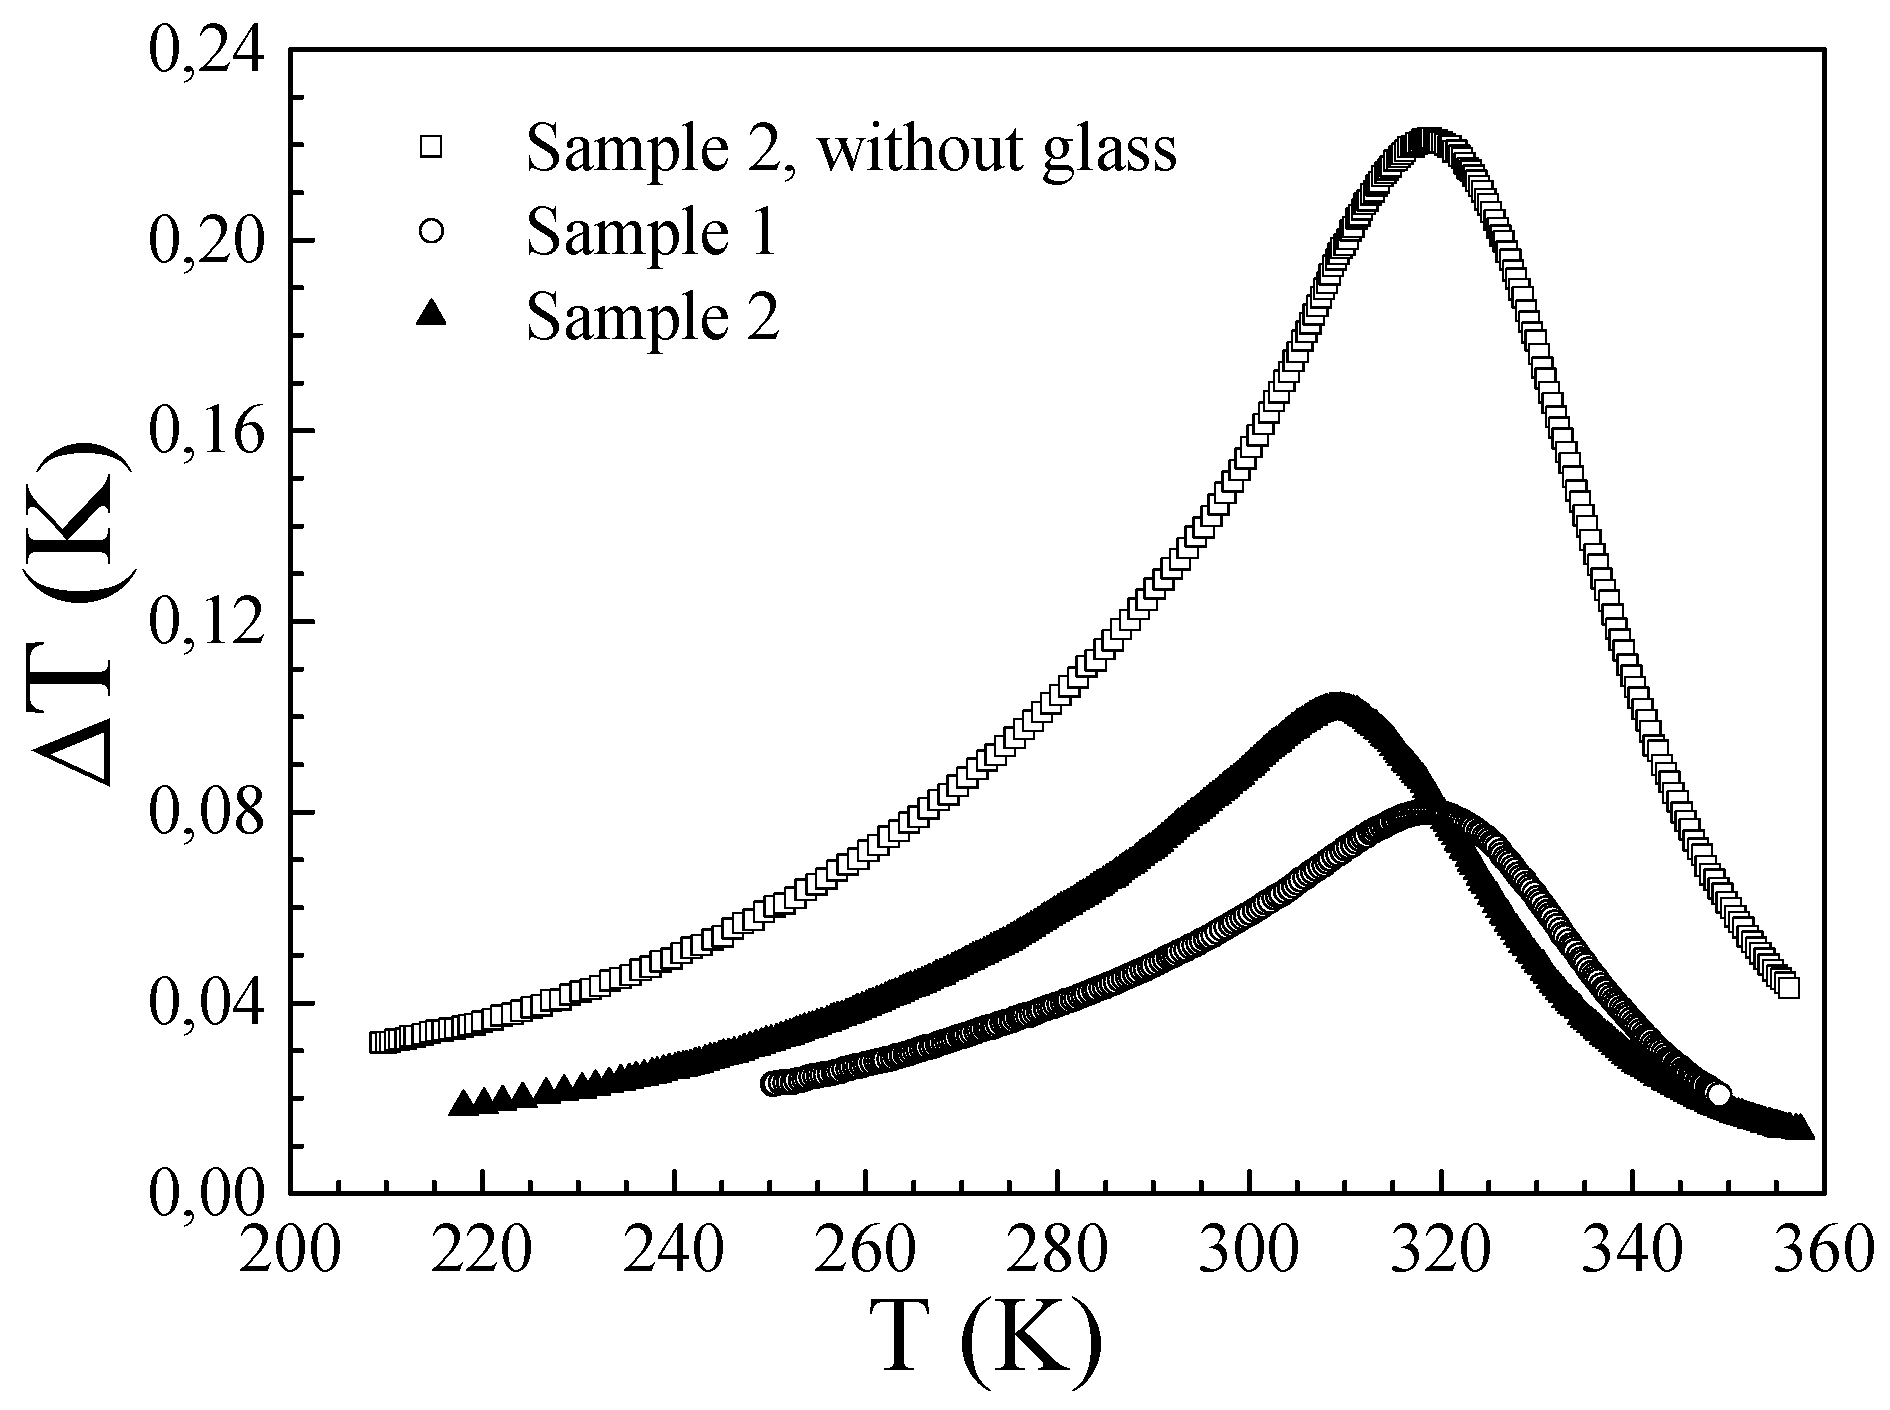
The rather sharp magnetization drop with increasing the temperature, especially in low magnetic field, is expected to yield a measurable magnetocaloric effect, MCE. We measured directly the MCE, Δ
T, in Ni-Mn-Ga samples with nucleus d ≈ 6,5 (sample 1) and d ≈ 31 (sample 2) μm after annealing at 823 K for 10 min. Before glass removal, we observed ΔT is 0.06 K for the sample 1 and 0.08 K for the sample 2 for a magnetic field change of ΔH = 18 kOe. After glass removal from sample 2, ΔT increased to 0.22 K (
Figure 46).
Observed MCE might be associated with magnetic (paramagnetic-ferromagnetic) and probably structural (austenite-martensite) transitions. Temperatures of the peak values of the MCE were found to be ~318 K and ~309 K, respectively.
Thus, a sharp magnetization change in vicinity of both structural and magnetic transformation can be the reason for the observed MCE.
Consequently, the presence of glass-coating considerably affects magnetic, mechanical and even structural properties of Ni-Mn-Ga microwires in comparison with other Ni-Mn-Ga alloys samples [
130,
131,
132]. But from point of view of future technological applications it is worth mentioning, that existence of the glass-coating allows improvement of mechanical properties allowing fabrication of Ni
2MnGa microwires.


 ,
, 


