Article

Kinetics and Morphology of Flow Induced Polymer Crystallization in 3D Shear Flow Investigated by Monte Carlo Simulation

School of Mathematics and Statistics, Henan University of Science and Technology, Luoyang 471023, China
Crystals 2017, 7(2), 51; https://doi.org/10.3390/cryst7020051
Submission received: 2 January 2017 / Revised: 8 February 2017 / Accepted: 8 February 2017 / Published: 11 February 2017
(This article belongs to the Special Issue Advances in Computer Simulation Studies on Crystal Growth)

Abstract

:
To explore the kinetics and morphology of flow induced crystallization of polymers, a nucleation-growth evolution model for spherulites and shish-kebabs is built based on Schneider rate model and Eder model. The model considers that the spherulites are thermally induced, growing like spheres, while the shish-kebabs are flow induced, growing like cylinders, with the first normal stress difference of crystallizing system being the driving force for the nucleation of shish-kebabs. A two-phase suspension model is introduced to describe the crystallizing system, which Finitely Extensible Non-linear Elastic-Peterlin (FENE-P) model and rigid dumbbell model are used to describe amorphous phase and semi-crystalline phase, respectively. Morphological Monte Carlo method is presented to simulate the polymer crystallization in 3D simple shear flow. Roles of shear rate, shear time and shear strain on the crystallization kinetics, morphology, and rheology are analyzed. Numerical results show that crystallization kinetics, morphology and rheology in shear flow are qualitatively in agreement with the theoretical, experimental and other numerical works which verifies the validity and effectiveness of our model and algorithm. To our knowledge, this is the first time that a model and an algorithm revealing the details of crystal morphology have been applied to the flow induced crystallization of polymers.

1. Introduction

Polymer crystallization is an important factor affecting the microstructure and determining the mechanical properties of the products [1,2]. Usually, polymers are processed with techniques such as extrusion and injection molding. During the manufacturing processing, polymers experience complex flow and thermal condition with the internal chains changing and folding to form different types of crystalline structures. Hence, studies related to the crystalline structures forming and the kinetics of crystallization under different flow and thermal condition are important.
Polymer crystallization in the flow field is also called flow induced crystallization (FIC) [2]. The experimental studies of FIC show that crystallization occuring in the flow field not only accelerates the crystallization rate, but also leads to different types of crystalline structures when compared with the quiescent crystallization [2], namely, both spherulite and shish-kebab structures, a typical oriented crystalline structure under strain, where the extended molecular chains form the shish and remaining molecular chains fold to form the lamellar structure which looks like kebabs, are found in FIC while only spherulite structure is found in quiescent crystallization. Based on the experimental results, many researchers proposed different analytical models for FIC which are mostly based on the Nakamura equation and the Avrami–Kolmogorov equation [3]. For example, Doufas et al. [4], Tanner [5], and Ziabicki [6] applied a multiplying factor function of stress, shear rate, and orientation, respectively, to modify the crystallization kinetic constant in the original Nakamura model to take into account the effect of flow on crystallization. Eder [1], Kosher and Fulchiron [7], and Zheng and Kennedy [8] molded the effect of flow on crystallization by considering nucleation and modified the original Avrami–Kolmogorov model. The modified Nakamura model does predict well in FIC, however, it has the disadvantage that it cannot reveal the details of crystal morphology. The Avrami–Kolmogorov model, which is based on the morphology evolution, has the disadvantage of lower accuracy at the later stage of polymer crystallization. Eder [1] proposed a mathematical model based upon the crystal morphology to consider the effect of flow on crystallization. Through considering spherulites as the growing spheres and shish-kebabs as the growing cylinders, they obtained a series of differential equations using the Schneider rate equations [9]. Zuidema et al. [10] modified the shear rate in the Eder model by recoverable strain as the driving force for flow induced nucleation. Their work has taken a huge step in revealing the microstructures of the polymer products. However, they did not give the method to capture the details of the nucleation-growth-impingement of crystals. Therefore, their work requires using the crystallization kinetics equation. Boutaous et al. [11] used the Schneider rate equation to describe the growth of thermally and flow induced nuclei and explored the contribution of thermal and flow effects on the global crystallization kinetics under different shear flow. They applied Avrami model to describe the kinetics and took the crystal structure induced by flow as spherulite.
In order to avoid using crystallization kinetics model, morphological simulation is needed. In the morphological simulation, relative crystallinity is transferred to the volume fraction of crystals [12]. Thus far, there have been many studies on the morphological simulation of polymer crystallization. Examples include: Raabe [12,13,14], Lin et al. [15], and Spina et al. [16,17] presented a cellular automaton method to simulate the kinetics and topology of spherulite growth for polymer crystallization; Liu et al. [18,19] used a level set method to capture the growth and impingement of spherulites during the polymer cooling stage; Micheletti and Burge [20] and Ruan et al. [21,22] applied a pixel coloring method to model and simulate the crystallization of polymer and short fiber reinforced polymer; and Ketdee and Anantawaraskul [23] and Ruan et al. [24] presented the Monte Carlo simulation in study of crystallization kinetics and morphology development in polymer crystallization. However, we shall mention that these works were mainly concentrated on spherulite structure. Our work [24] was an exception. In our previous work [24], we applied a Monte Carlo method to capture the evolution of both spherulites and shish-kebabs and calculate the crystallization kinetics in polymer crystallization. The work was carried out with parametric study where the effects of nucleation density and growth rate of spherulites, nucleation density and length growth rate of shish-kebabs on the crystallization were examined. The work was in an ideal case, parameters of both spherulites and shish-kebabs were keeping constant to allow the simulation. This was not the case in the real manufacturing process.
In this paper, we focus our attention on the more realistic shear flow which exists universally in the manufacturing process and experiments. Based on the Schneider rate model and Eder model, the morphology evolution model of both spherulites and shish-kebabs is deduced. By using this model and the Monte Carlo method, polymer crystallization in 3D simple shear flow is simulated. Effects of shear rate, shear time and shear strain on the crystallization kinetics, crystal morphology, and rheology of the system are discussed.

2. Mathematical Model and Numerical Method

2.1. Morphology Evolution Model for Spherulites and Shish-Kebabs

In the flow field, polymers experience the complex thermal and flow condition, and different crystalline structures like spherulites and shish-kebabs are presented. Both types of crystals contribute to the crystallization kinetics. Like many other work, here we assume the spherulites are thermally induced and the shish-kebabs are flow induced.
For the spherulite structure, Schneider et al. [9] considered the spherulites as the growing spheres and deduced a series of differential equations. These equations, also known as the Schneider rate equations, are listed as follows [9]:
φ ˙ 3 = 8 π a       ( φ 3 = 8 π N s ) φ ˙ 2 = G s φ 3       ( φ 2 = 4 π R t o t ) φ ˙ 1 = G s φ 2       ( φ 1 = S t o t ) φ ˙ 0 = G s φ 1       ( φ 0 = V t o t )
where N s , R t o t , S t o t , V t o t are the total number, total radius, total surface area and the total volume of spherulites, respectively; a is the nucleation rate; and G s is the growth rate of spherulites.
For the shish-kebab structure, Eder [1] considered the shish-kebabs as the growing cylinders and obtained a series of differential equations. These equations, known as Eder model, can be described as follows [1]
ψ ˙ 3 + ψ 3 τ n = 8 π R 1       ( ψ 3 = 8 π N s k ) ψ ˙ 2 + ψ 2 τ l = ψ 3 R 2       ( ψ 2 = 4 π L t o t ) ψ ˙ 1 = G s k , r ψ 2        ( ψ 1 = S ˜ t o t ) ψ ˙ 0 = G s k , r ψ 1        ( ψ 0 = V ˜ t o t )
where N s k , L t o t , S ˜ t o t , V ˜ t o t are the total number, total length, total surface area and the total volume of shish-kebabs, respectively; τ n is the temperature dependent relaxation time for the nuclei formation; R 1 = γ ˙ 2 g n / γ ˙ n 2 is a driving force for nucleation of shish-kebabs, with γ ˙ the shear rate and g n / γ ˙ n 2 the fitted parameters; τ l is the temperature and shish-length-dependent relaxation time for the shish during axial growth; R 2 = γ ˙ 2 g l / γ ˙ l 2 is a driving force of length growth of shish-kebabs, with g l / γ ˙ l 2 the fitted parameters; and G s k , r is the radius growth rate of shish-kebabs.
The equivalent differential equations of spherulites can be deduced from Equation (1):
N s = N s R ˙ t o t = 2 N s G s S ˙ t o t = 4 π G s R t o t V ˙ t o t = G s S t o t
From Equation (3), we know that two parameters can define the crystallization of spherulites, namely, the nucleation density of spherulites N s and the growth rate of spherulites G s . Different kinds of nucleation models for spherulites were proposed by researchers, which are mostly based on data fitting.
Here, we adopt the model proposed by Koscher and Fulchiron [7] and use the following equation to describe the nucleation density of spherulites
N s ( T ) = exp ( a ˜ Δ T + b ˜ )
In Equation (4), nucleation density is a function of supercooling temperature Δ T which is defined as Δ T = T m 0 T with T m 0 the equilibrium melting temperature, and a ˜ and b ˜ are the empirical parameters. Equation (4) clearly shows that the nucleation of spherulites is induced by thermal condition.
As reported by researchers [3,25], growth rate of spherulites does not seem to be strongly influenced by flow. Here, Hoffman–Lauriten expression [26] is used to describe it, namely,
G s ( T ) = G 0 exp [ U * R g ( T T ) ] exp ( K g T Δ T )
where G 0 and K g are constants, U * is the energy parameter similar to an apparent activation energy of motion, R g is the gas constant and T = T g 30 ° C is considered as the temperature at which no further molecular displacement is possible.
The equivalent differential equations of shish-kebabs can be deduced from Equation (2):
N ˙ s k + N s k τ n = R 1 L ˙ t o t + L t o t τ l = 2 N s k R 2 S ˜ ˙ s k t o t = 4 π G s k , r L t o t V ˜ ˙ t o t = G s k , r S ˜ t o t
Under the assumption that τ l = [10], we obtain the following expressions
N s k = N s k L ˙ t o t = 2 N s k R 2 = 2 N s k G s k , l S ˜ ˙ s k t o t = 4 π G s k , r L t o t V ˜ ˙ t o t = G s k , r S ˜ t o t
From Equation (7), we know that three parameters can define the crystallization of shish-kebabs, namely, the nucleation density of shish-kebabs N s k , the length growth rate of shish-kebabs G s k , l and the radius growth rate of shish-kebabs G s k , r . According to Eder [1], length growth rate of shish-kebabs G s k , l can be written as
G s k , l = R 2 = γ ˙ 2 g l / γ ˙ l 2
The radius growth rate of shish-kebabs G s k , r is often assumed to be equal to the growth rate of spherulites G s [10], namely
G s k , r = G s
Due to the fact that the driving force for the nucleation density of shish-kebabs N s k is not well understood, several approaches are found in literatures. We have explained these in the Introduction Section. Here, we adopt the model proposed by Koscher and Fulchiron [7], which is
N ˙ s k = C N 1
where C is a constant, N 1 is the first normal stress difference of the system. Equation (10) shows that the nucleation of shish-kebabs is induced by flow condition.

2.2. Amorphous Phase and Semi-Crystalline Phase Model

The first normal stress difference appears in Equation (10); hence, it is necessary to give the mathematical model of the crystallizing system. Here, we adopt the idea of Zheng and Kennedy [8] and use a two-phase suspension model to deal with the crystallizing system. According to Zheng and Kennedy [8], the crystallizing system can be treated as a suspension of semi-crystalline phase growing and spreading in a matrix of amorphous material. The amorphous phase can be described as the FENE-P dumbbell model and the semi-crystalline phase can be described as the rigid dumbbell model.
In the amorphous phase, the matrix can be treated as the elastic dumbbell model, which is two beads connected by a spring. This dumbbell model obeys the well-known Fokker–Planck equation. There are three kinds of numerical methods to solve the Fokker–Planck equation: deterministic method, stochastic method and macroscopic method [27]. In the macroscopic method, through the moment operation in Fokker–Planck equation, the relating constitutive equation is obtained. However, this constitutive equation never closed and needs the closure approximation. The familiar closure approximations are Finitely Extensible Non-linear Elastic-Peterlin (FENE-P), Finitely Extensible Non-linear Elastic-Chilcott-Rallison (FENE-CR), Finitely Extensible Non-linear Elastic-Lielens (FENE-L), Finitely Extensible Non-linear Elastic-Lielens-Simplified (FENE-LS), etc. [27]. Here, the FENE-P model is used, which is given by [8,27]
λ a ( T ) C + [ 1 1 t r C / b C I ] = 0
where C is the conformation tensor, λ a ( T ) is the relaxation time of the fluid, I is the unit tensor, t r ( ) is the trace of the tensor, and C = D C / D t ( u ) T C C ( u ) is the upper-convected derivative of C . The relaxation time of the fluid λ a ( T ) is a function of temperature and can be calculated by the shift factor a T ( T ) as follows [8]
λ a ( T ) = a T ( T ) λ a , 0 = exp [ E a R g ( 1 T 1 T 0 ) ] λ a , 0
where λ a , 0 is the relaxation time at the reference temperature T 0 . E a / R g is the constant and can be determined by experiment. The stress contributed by amorphous phase can be written as [8,23]
τ a = n k T [ 1 1 t r C / b C I ]
with τ a the stress caused by amorphous phase, n the number of dumbbells, and k the Boltzmann constant.
The molecular chains in semi-crystalline phase can be treated as the rigid dumbbell model, i.e., two beads connected by a rigid rod. This rigid dumbbell cannot be stretched but can be oriented. Through the force analysis, the orientation equation of rigid dumbbell can be obtained. Substitution of orientation equation into continuity equation of configurational distribution function leads to the well-known Fokker–Planck equation [8,27]. Here, we also use macroscopic method to solve it. By moment operation of Fokker–Planck equation, evolution equation of orientation tensor is obtained [8]:
< R R > = 1 λ s c ( α , T ) ( < R R > I 3 ) γ ˙ : < R R R R >
where < R R > is the second-order orientation tensor, λ s c ( α , T ) is the time constant of the rigid dumbbell, and γ ˙ is the shear rate tensor. Time constant of the rigid dumbbell λ s c ( α , T ) is related with the relaxation time of fluid λ a ( T ) by the following empirical form [4,8]
λ s c ( α , T ) λ a ( T ) = ( α / A ) β 1 ( 1 α / A ) β      α < A
where A , β , β 1 are the empirical parameters. Note that the fourth-order orientation tensor appears in Equation (14). In order to find the solution of second-order orientation < R R > , the closure approximation is needed. Different closure approximations are reported, including Linear, Quadratic, Hybrid, Invariant Based Orthotropic Fitted closure (IBOF), Eigenvalue Based Orthotropic Fitted closure (EBOF), etc. [28]. Here, we adopt the Quadratic closure approximation which is given by
< R R R R > i j k l = < R R > i j < R R > k l
Stress caused by semi-crystalline phase τ s c is written as follows [8]
τ s c = η s c ( α , T ) λ s c ( α , T ) ( < R R > + λ s c ( α , T ) γ ˙ : < R R R R > )
where η s c ( α , T ) is the viscosity of semi-crystalline phase which has the following relation with the viscosity of amorphous phase η a ( T ) [4,8]
η s c ( α , T ) η a ( T ) = ( α / A ) β 1 ( 1 α / A ) β      α < A
Hence, the total stress of the crystallizing system is
τ = τ a + τ s c
which contains the contribution of both amorphous phase and semi-crystalline phase. The first normal stress difference in Equation (10) which is considered as the driving force for nucleation of shish-kebabs, as calculated by Equation (19).

2.3. Numerical Method

Monte Carlo method and finite difference method are used to capture the evolution of crystal morphology and to compute the evolution equation of amorphous phase and semi-crystalline phase, respectively.

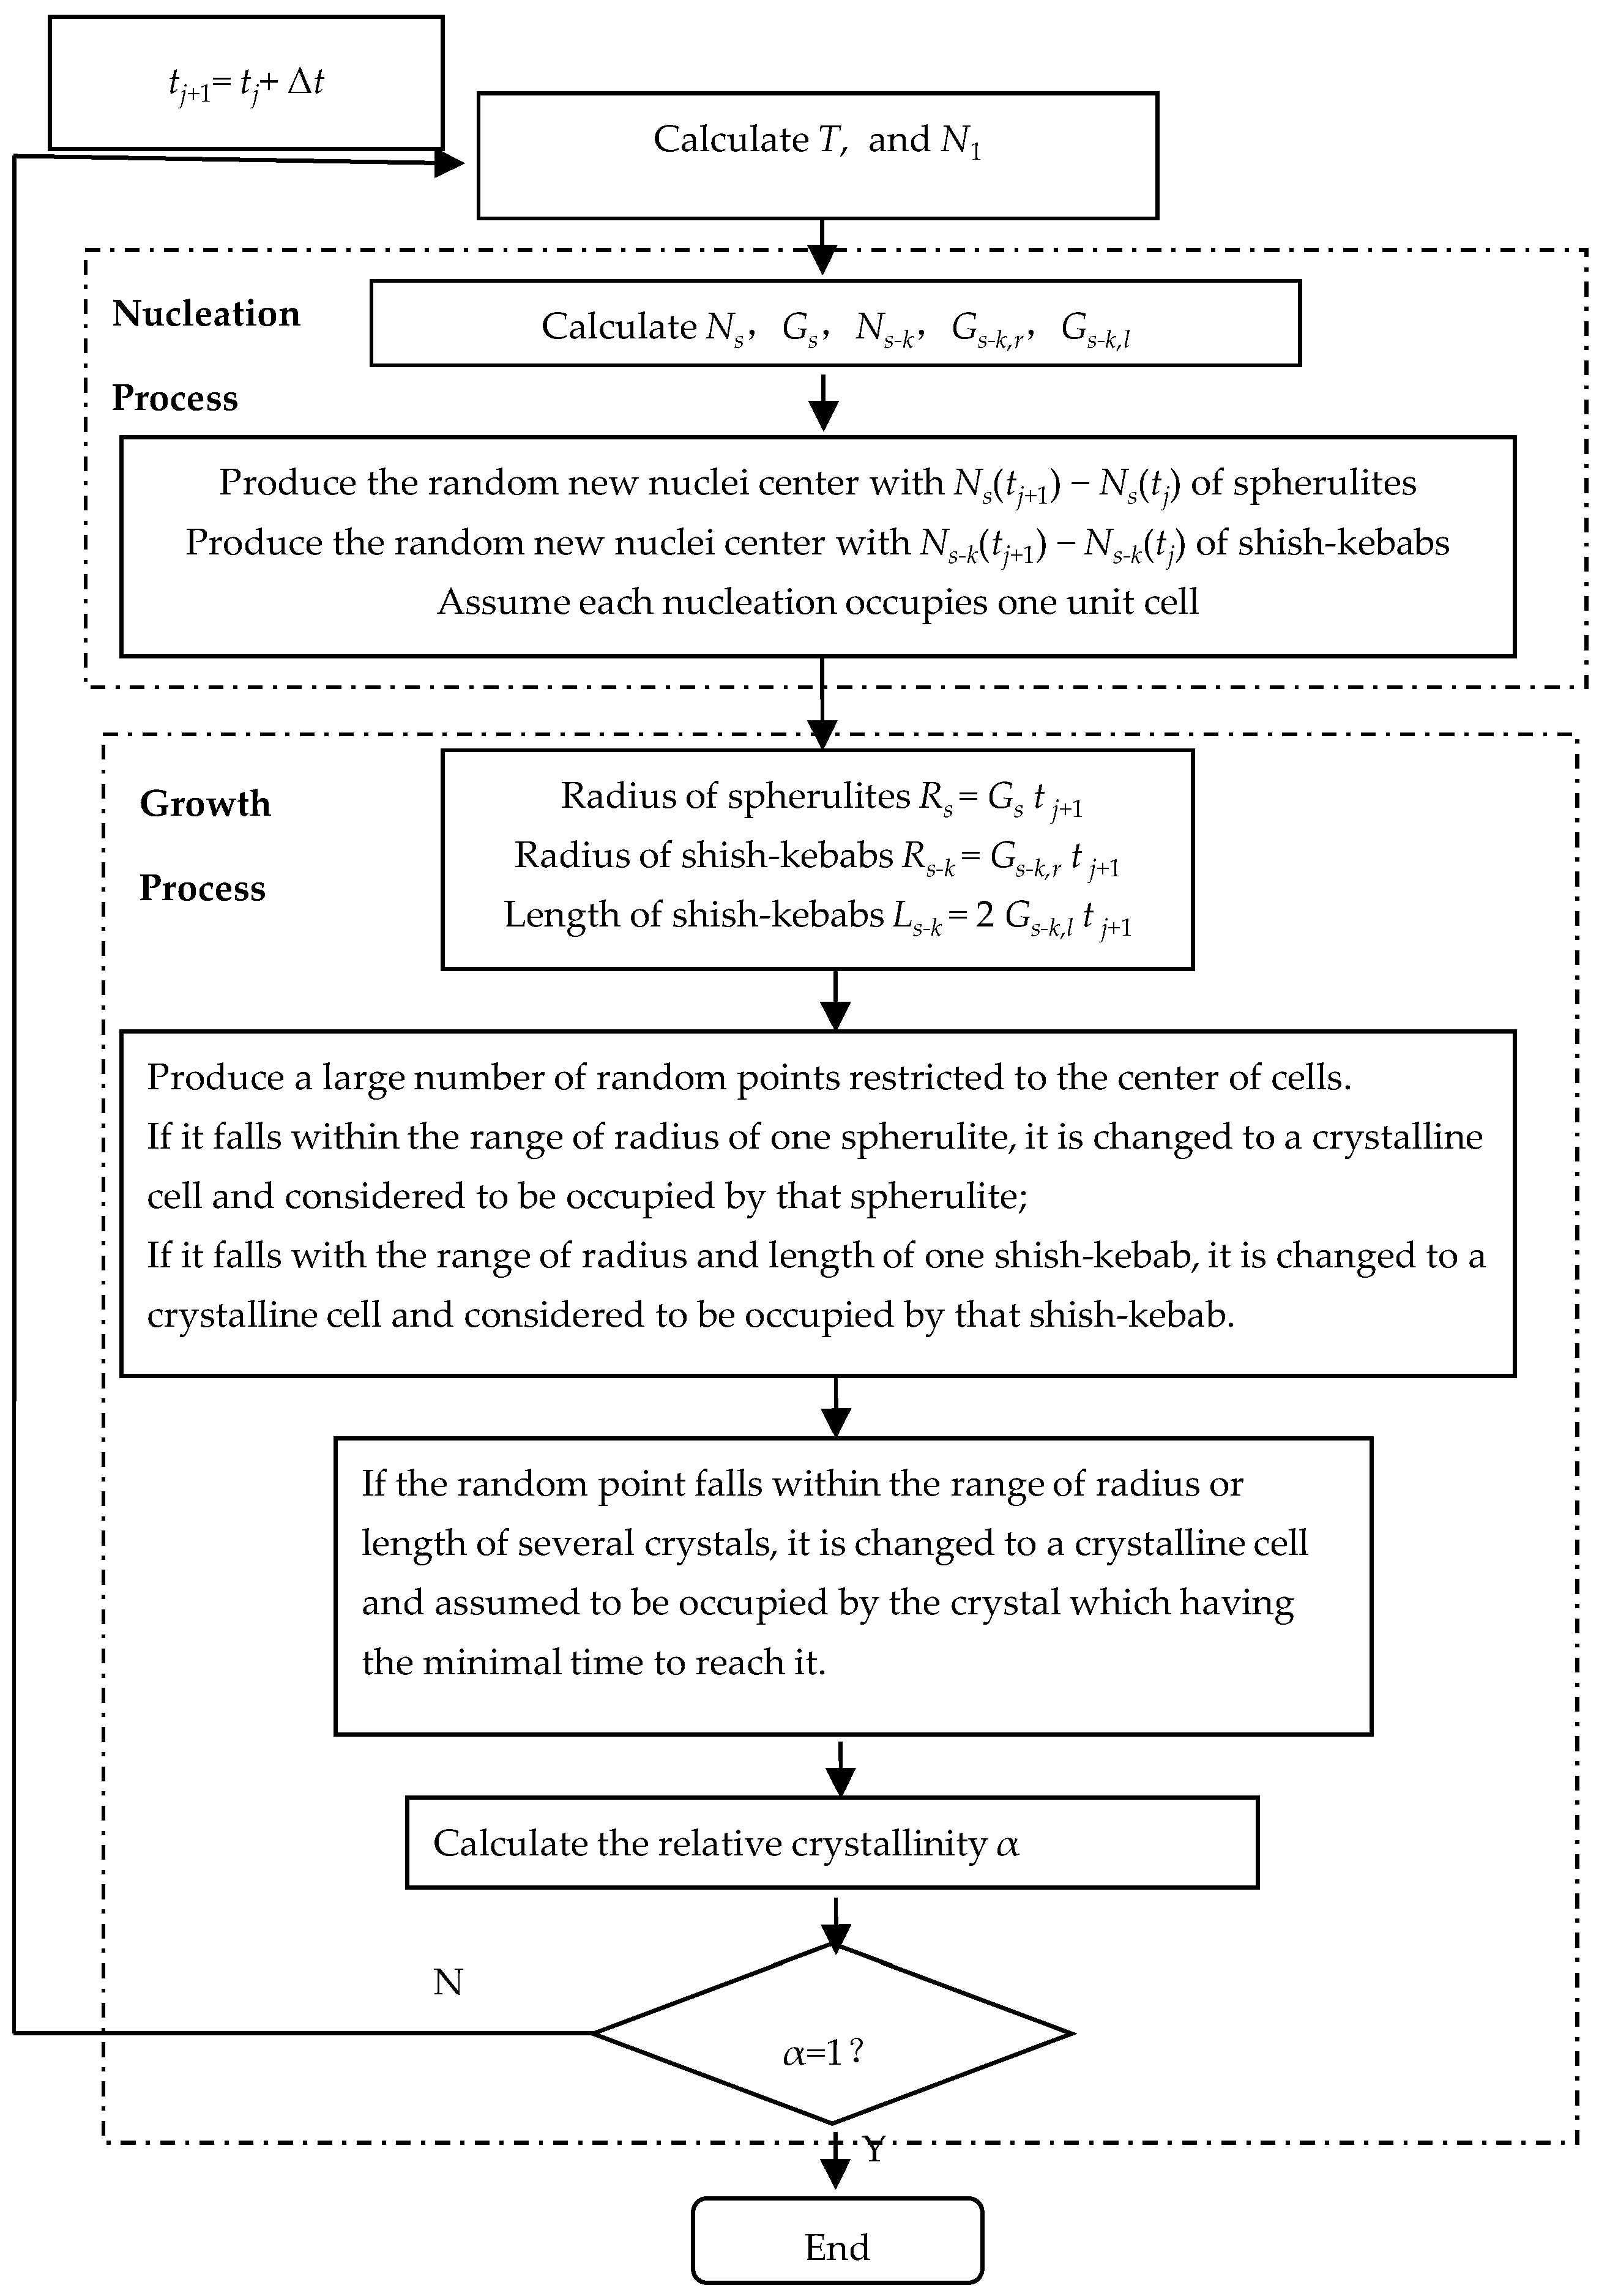
2.3.1. Monte Carlo Method

Monte Carlo method is introduced here to capture the nucleation-growth-impingement of spherulites and shish-kebabs. We consider the polymer in a small spatial region, [ 0 , 1 ] m m × [ 0 , 1 ] m m × [ 0 , 1 ] m m . The investigation is carried out under a certain temperature, shear rate and shear time. The nucleation density Ns and growth rate of spherulites Gs are given in Equations (4) and (5), respectively. The nucleation density of shish-kebabs Ns-k is listed in Equation (10). Length growth rate Gs-k,l and radius growth rate of shish-kebabs Gs-k,r are presented in Equations (8) and (9), respectively.
Figure 1 shows the Monte Carlo method we used in the simulation. To better implement this method, we refer to our work [24] for more details. Here, we briefly present the important techniques and parameters. Firstly, spatial region is divided into a large array of equally sized cubic cells and in our simulation this number is set as 107. Secondly, different crystals are distinguished by different colors. Different colors are assigned to the different nuclei and the spatial cells covered by growth are assigned to the same color with the corresponding crystal. Thirdly, relative crystallinity α is transferred to the volume fraction of crystals, which is calculated by the cells that have been transformed to the crystals with the total spatial number.
The main advantages of Monte Carlo method are that it can avoid the use of crystallization kinetics model and it can also capture the detailed morphology evolution.

2.3.2. Finite Difference Method

Finite difference method is introduced to compute the equations in amorphous phase and semi-crystalline phase. Evolution of conformation tensor Equation (11) and orientation tensor Equation (14) are discretized by the first-order forward in time:
C n + 1 C n Δ t = 1 λ a ( T ) [ 1 1 t r C n / b C n I ] + ( u ) T C n + C n ( u )
< R R > n + 1 < R R > n Δ t = 1 λ s c ( α , T ) ( < R R > n I 3 ) γ ˙ : < R R R R > + ( u ) T < R R > n + < R R > n ( u )
with the initial condition C 0 = I 3 , < R R > 0 = I 3 .

3. Results and Discussion

3.1. Parameters

The polymer we used here is the polyethylene. Material data and the parameters are listed in Table 1. Parameters for crystal morphology can be found in [7,10], and the parameters in amorphous phase and the semi-crystalline phase can be found in [8,29].

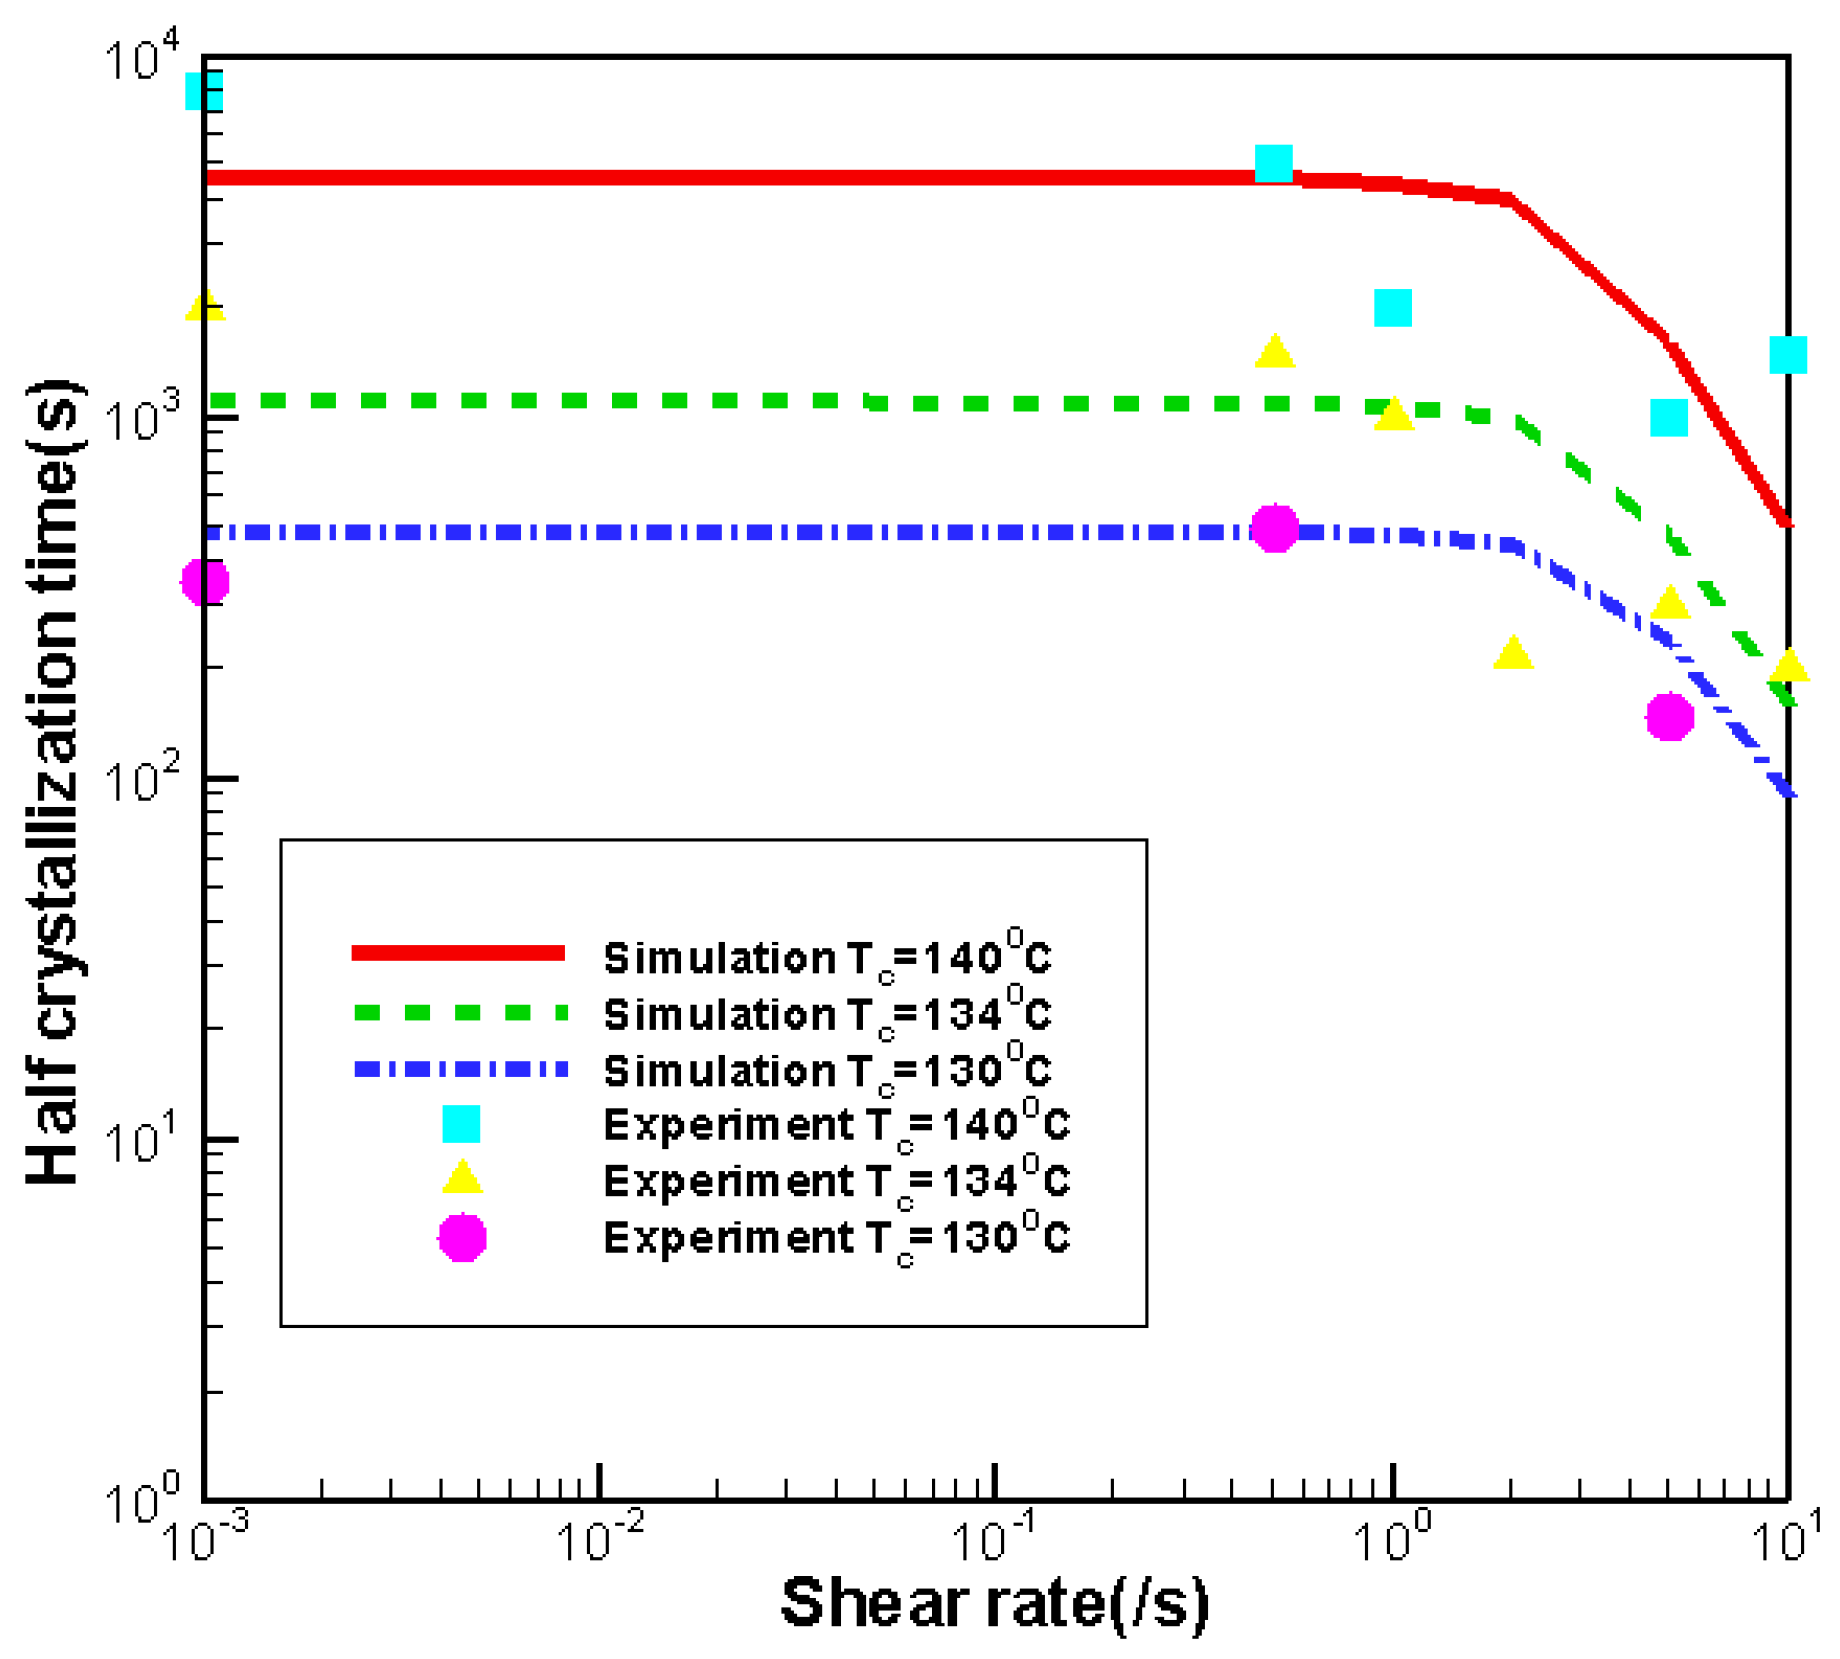
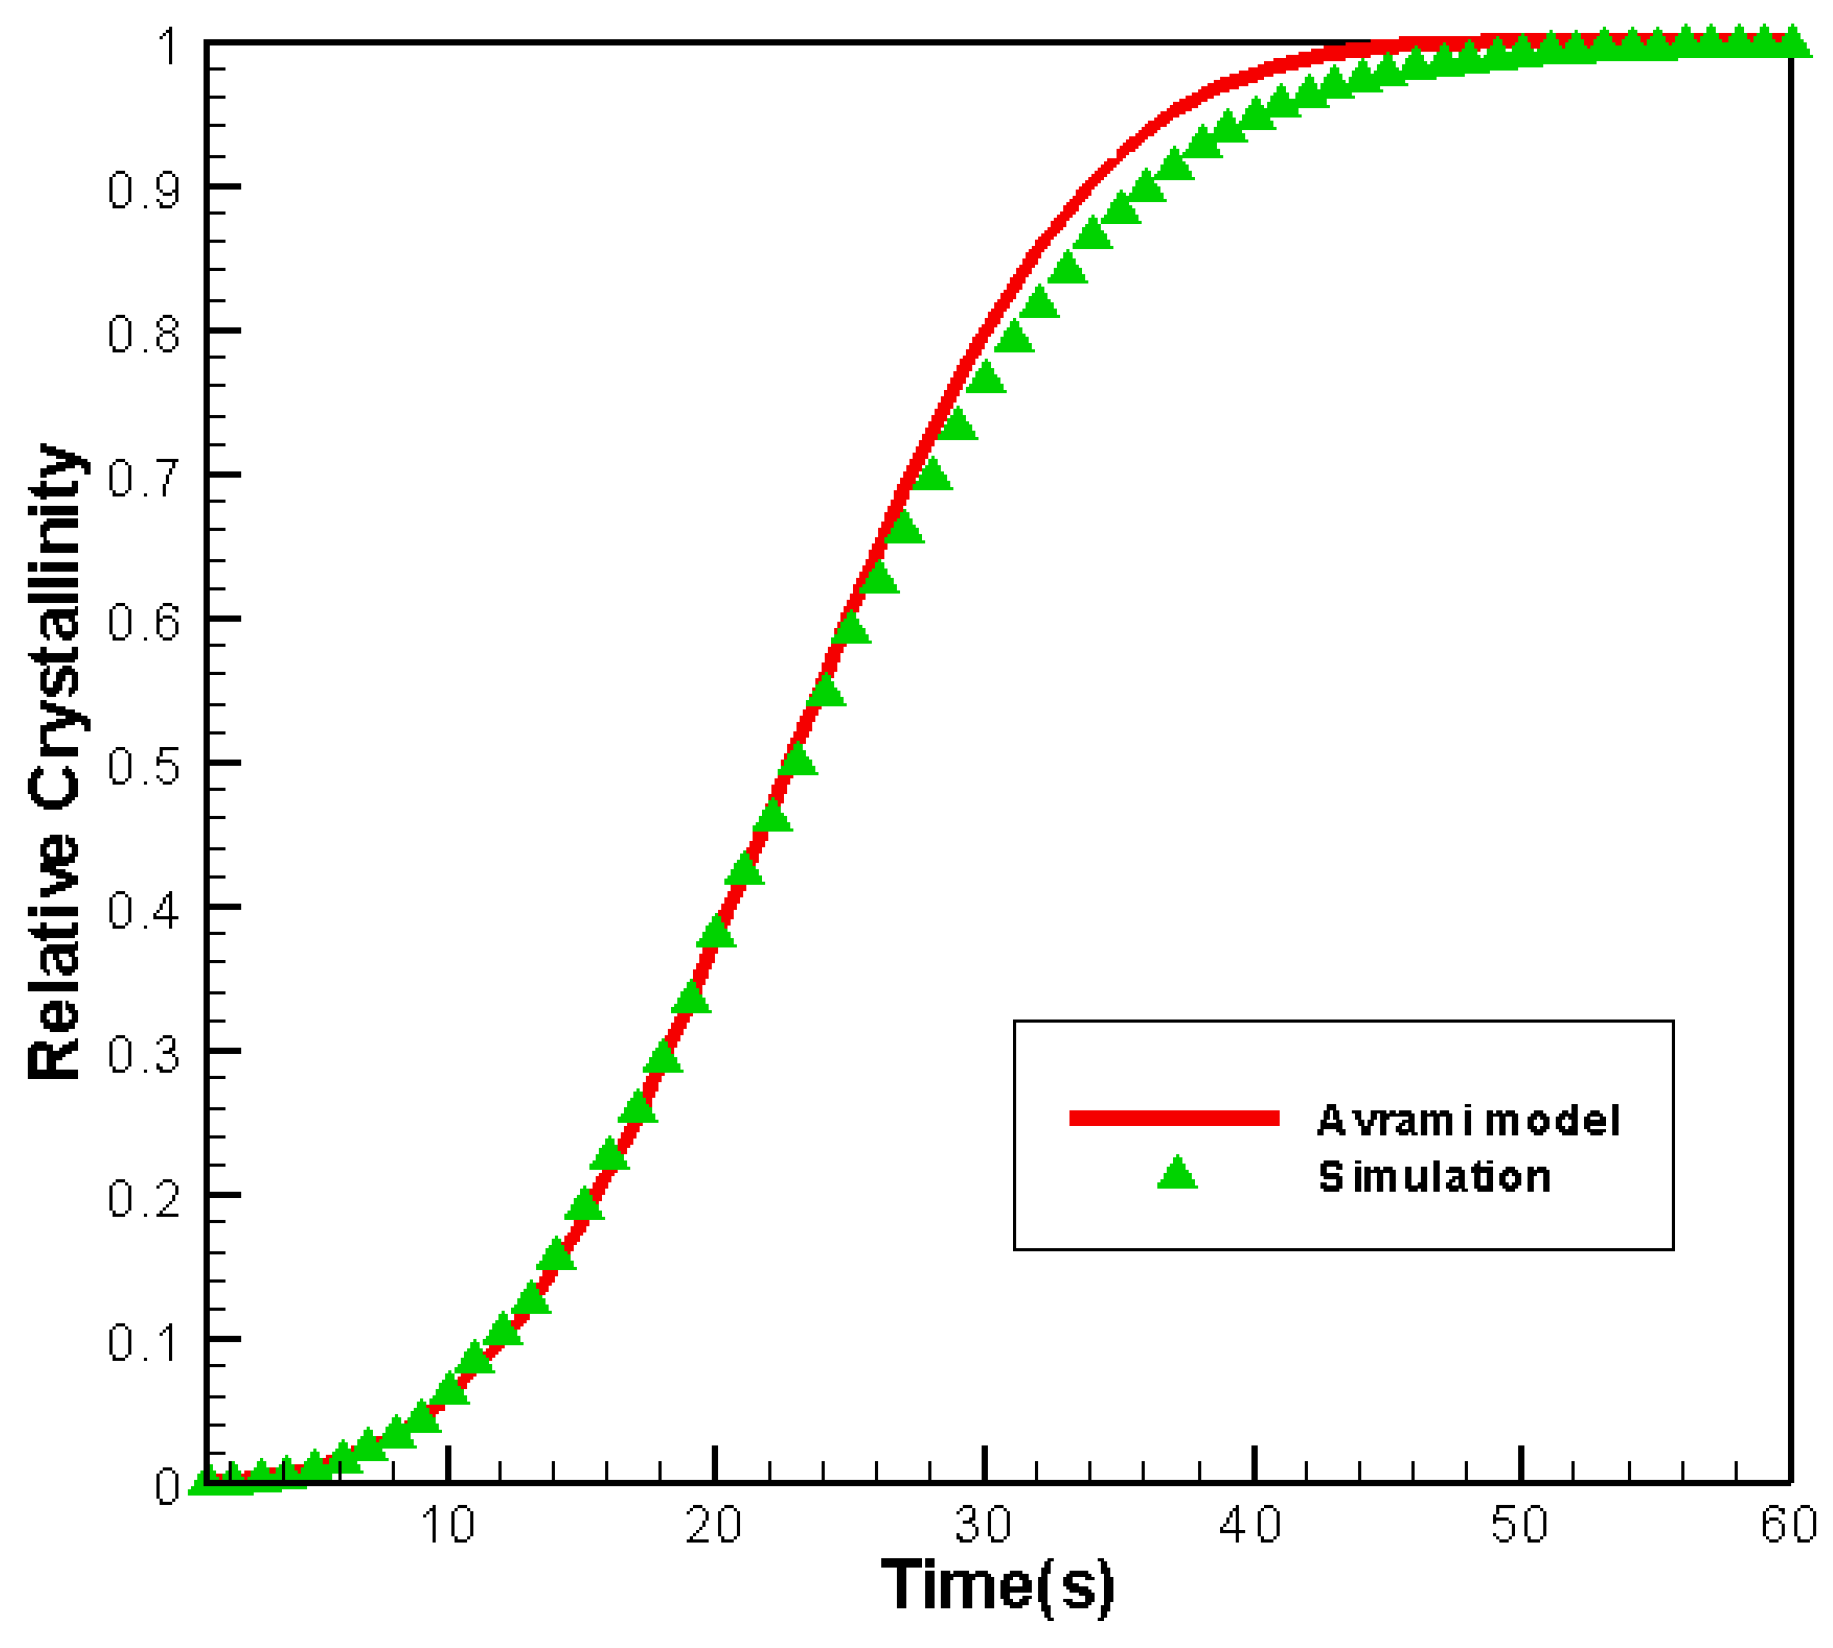
3.2. Validity of the Simulation

To show the validity of our algorithm, results of relative crystallinity simulated by Monte Carlo method are compared with the data predicted by the Avrami model which are descripted in Figure 2. Here, we assume the nucleation of spherulites and shish-kebabs occur instantaneously with the density N s = 10 12 / m 3 and N s k = 10 12 / m 3 , respectively, spherulites growing with the rate G s = 10 6 m / s and shish-kebabs growing with the length rate G s k , l = 10 5 m / s and radius rate G s k , r = 10 6 m / s , respectively. As can be seen in Figure 2, the simulation data show agreement with the Avrami model. Hence, the Monte Carlo method used is efficient and reliable.
We now show the reliability of our model. Simulations are carried out in 3D simple shear flow. Figure 3 displays the shear rate with the half crystallization time when the polymer suffers a constant shear time of 10 s. Results are compared with the experimental data obtained by Koscher and Fulchiron [7]. Our model predictions are in qualitative agreement with the experimental results. Therefore, the model we built is valid.

3.3. Effects of Shear Rate

In this section, we show the effects of shear rate on the crystallization and rheology. Here, we set the shear time as t s = 10 s and the temperature as Tc = 140 °C.

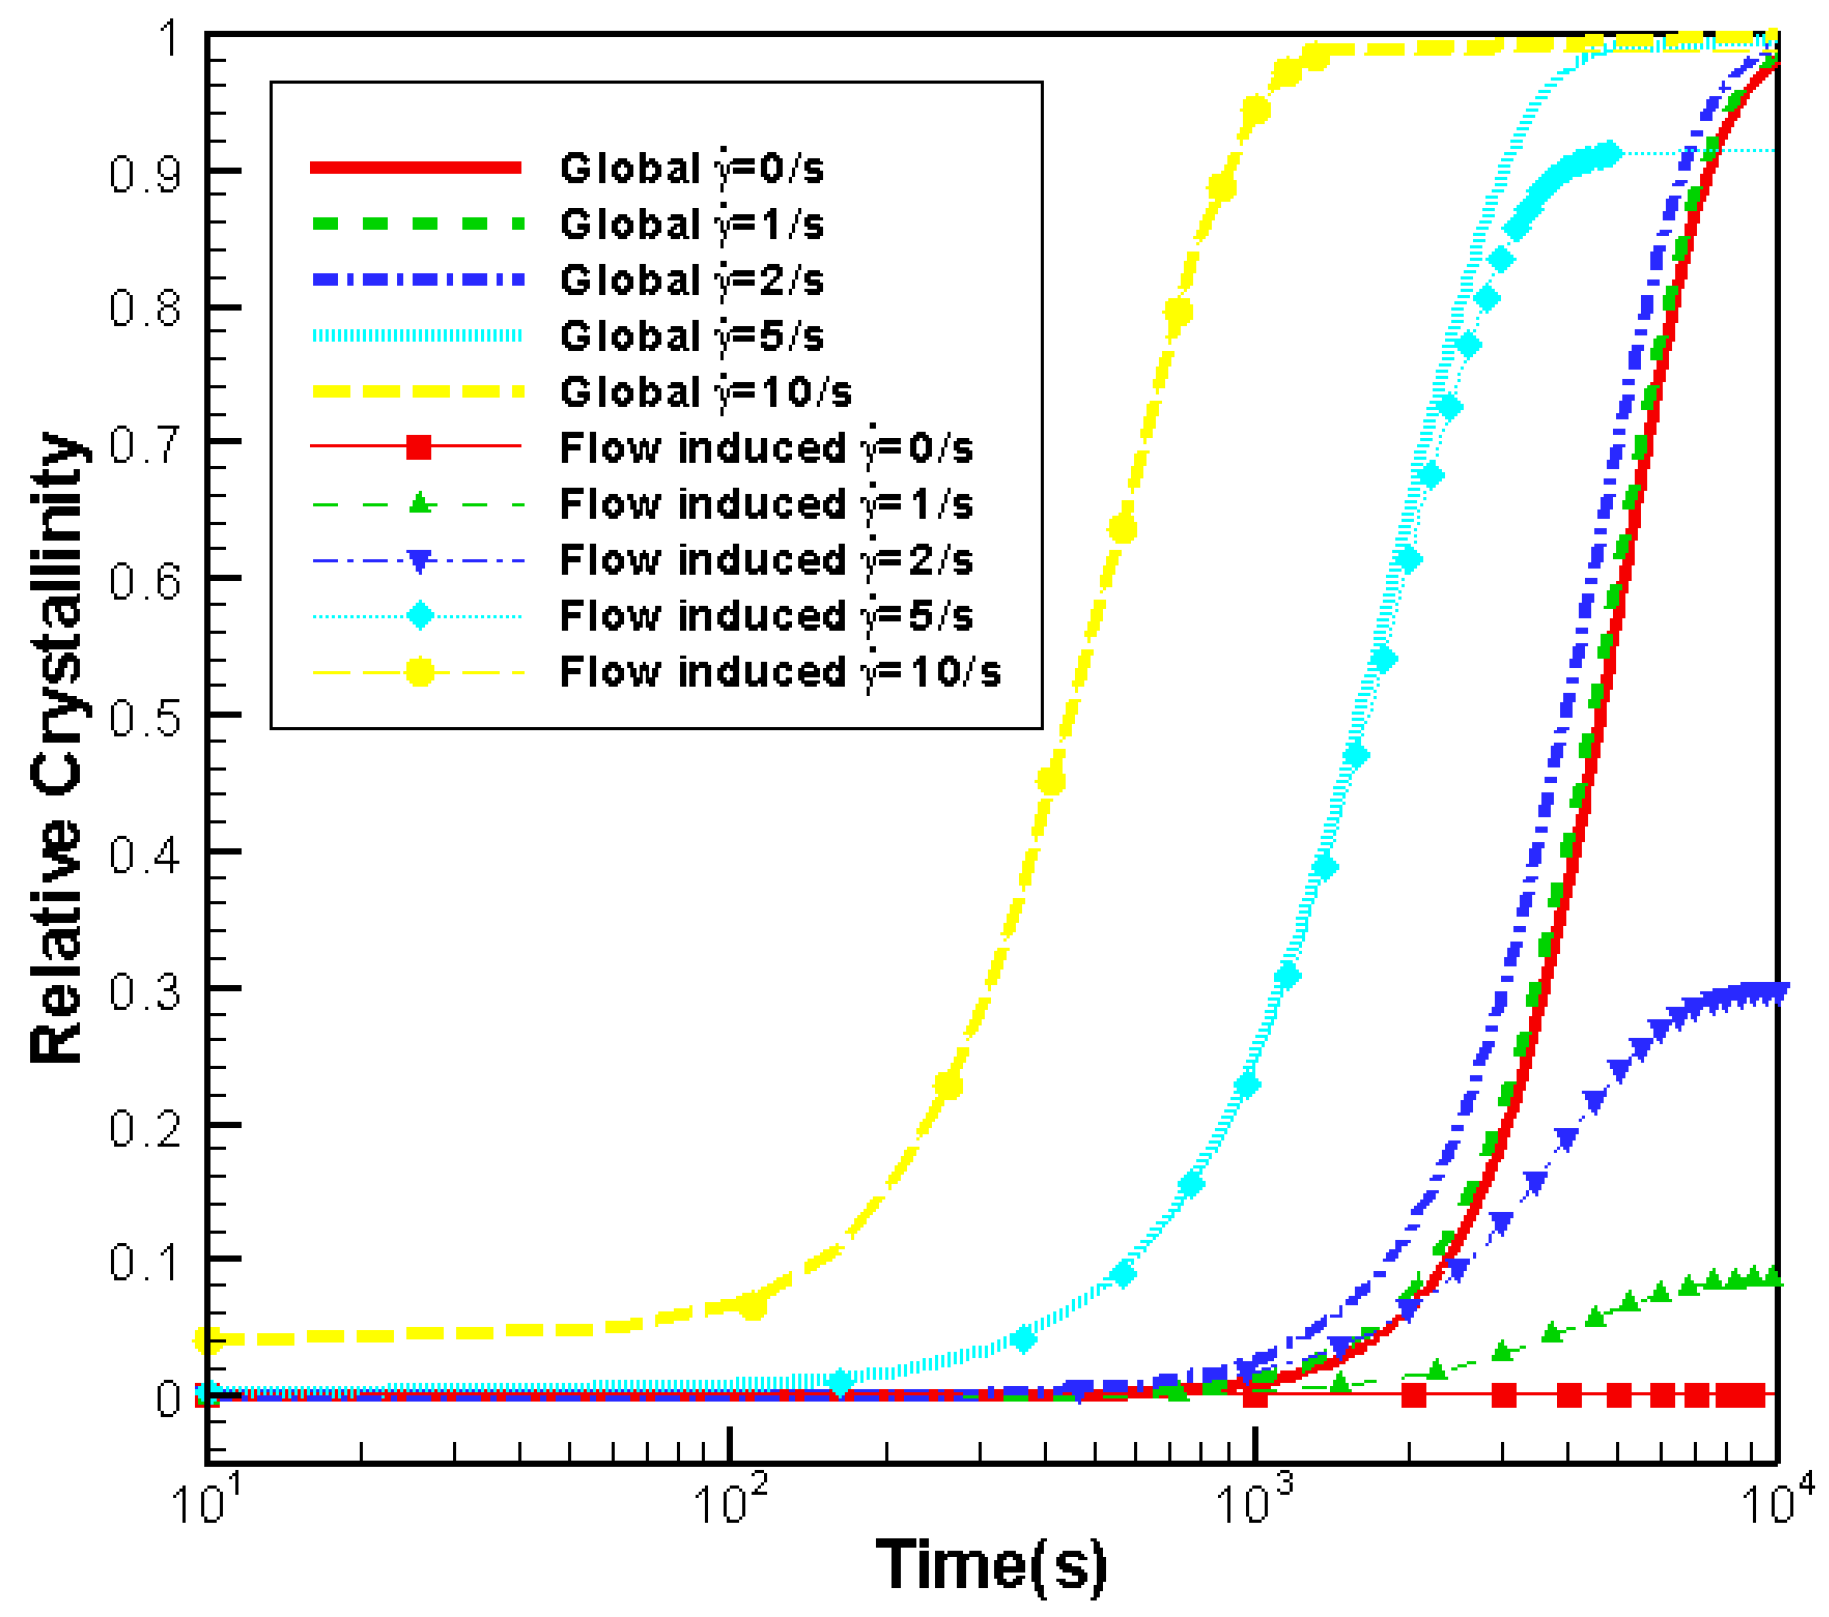
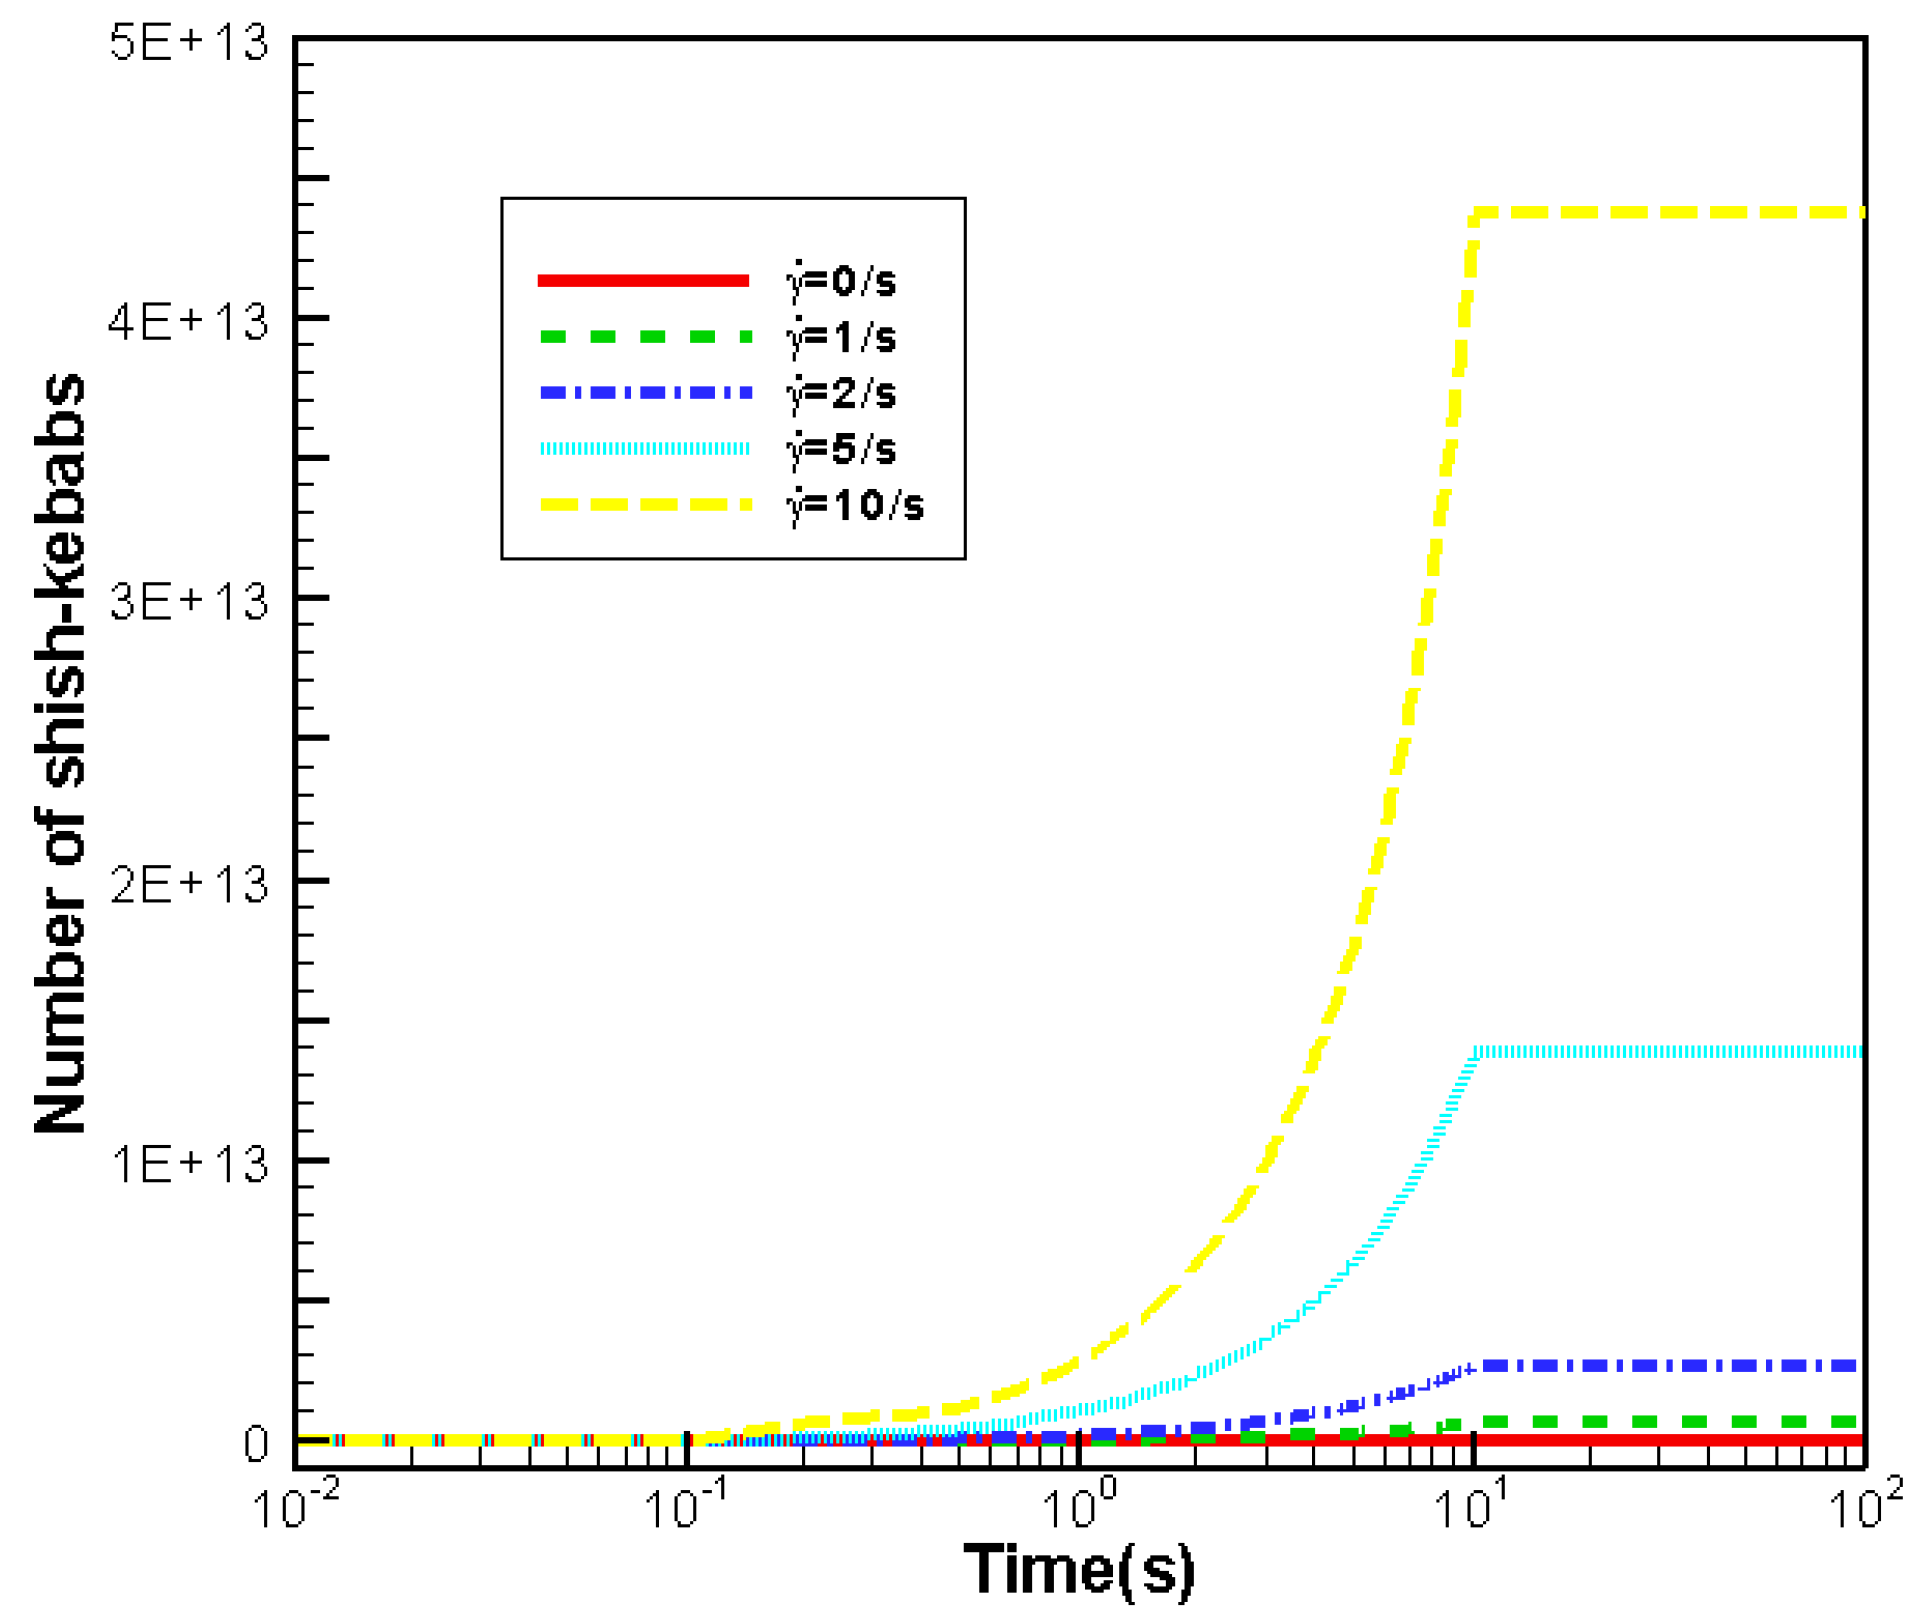
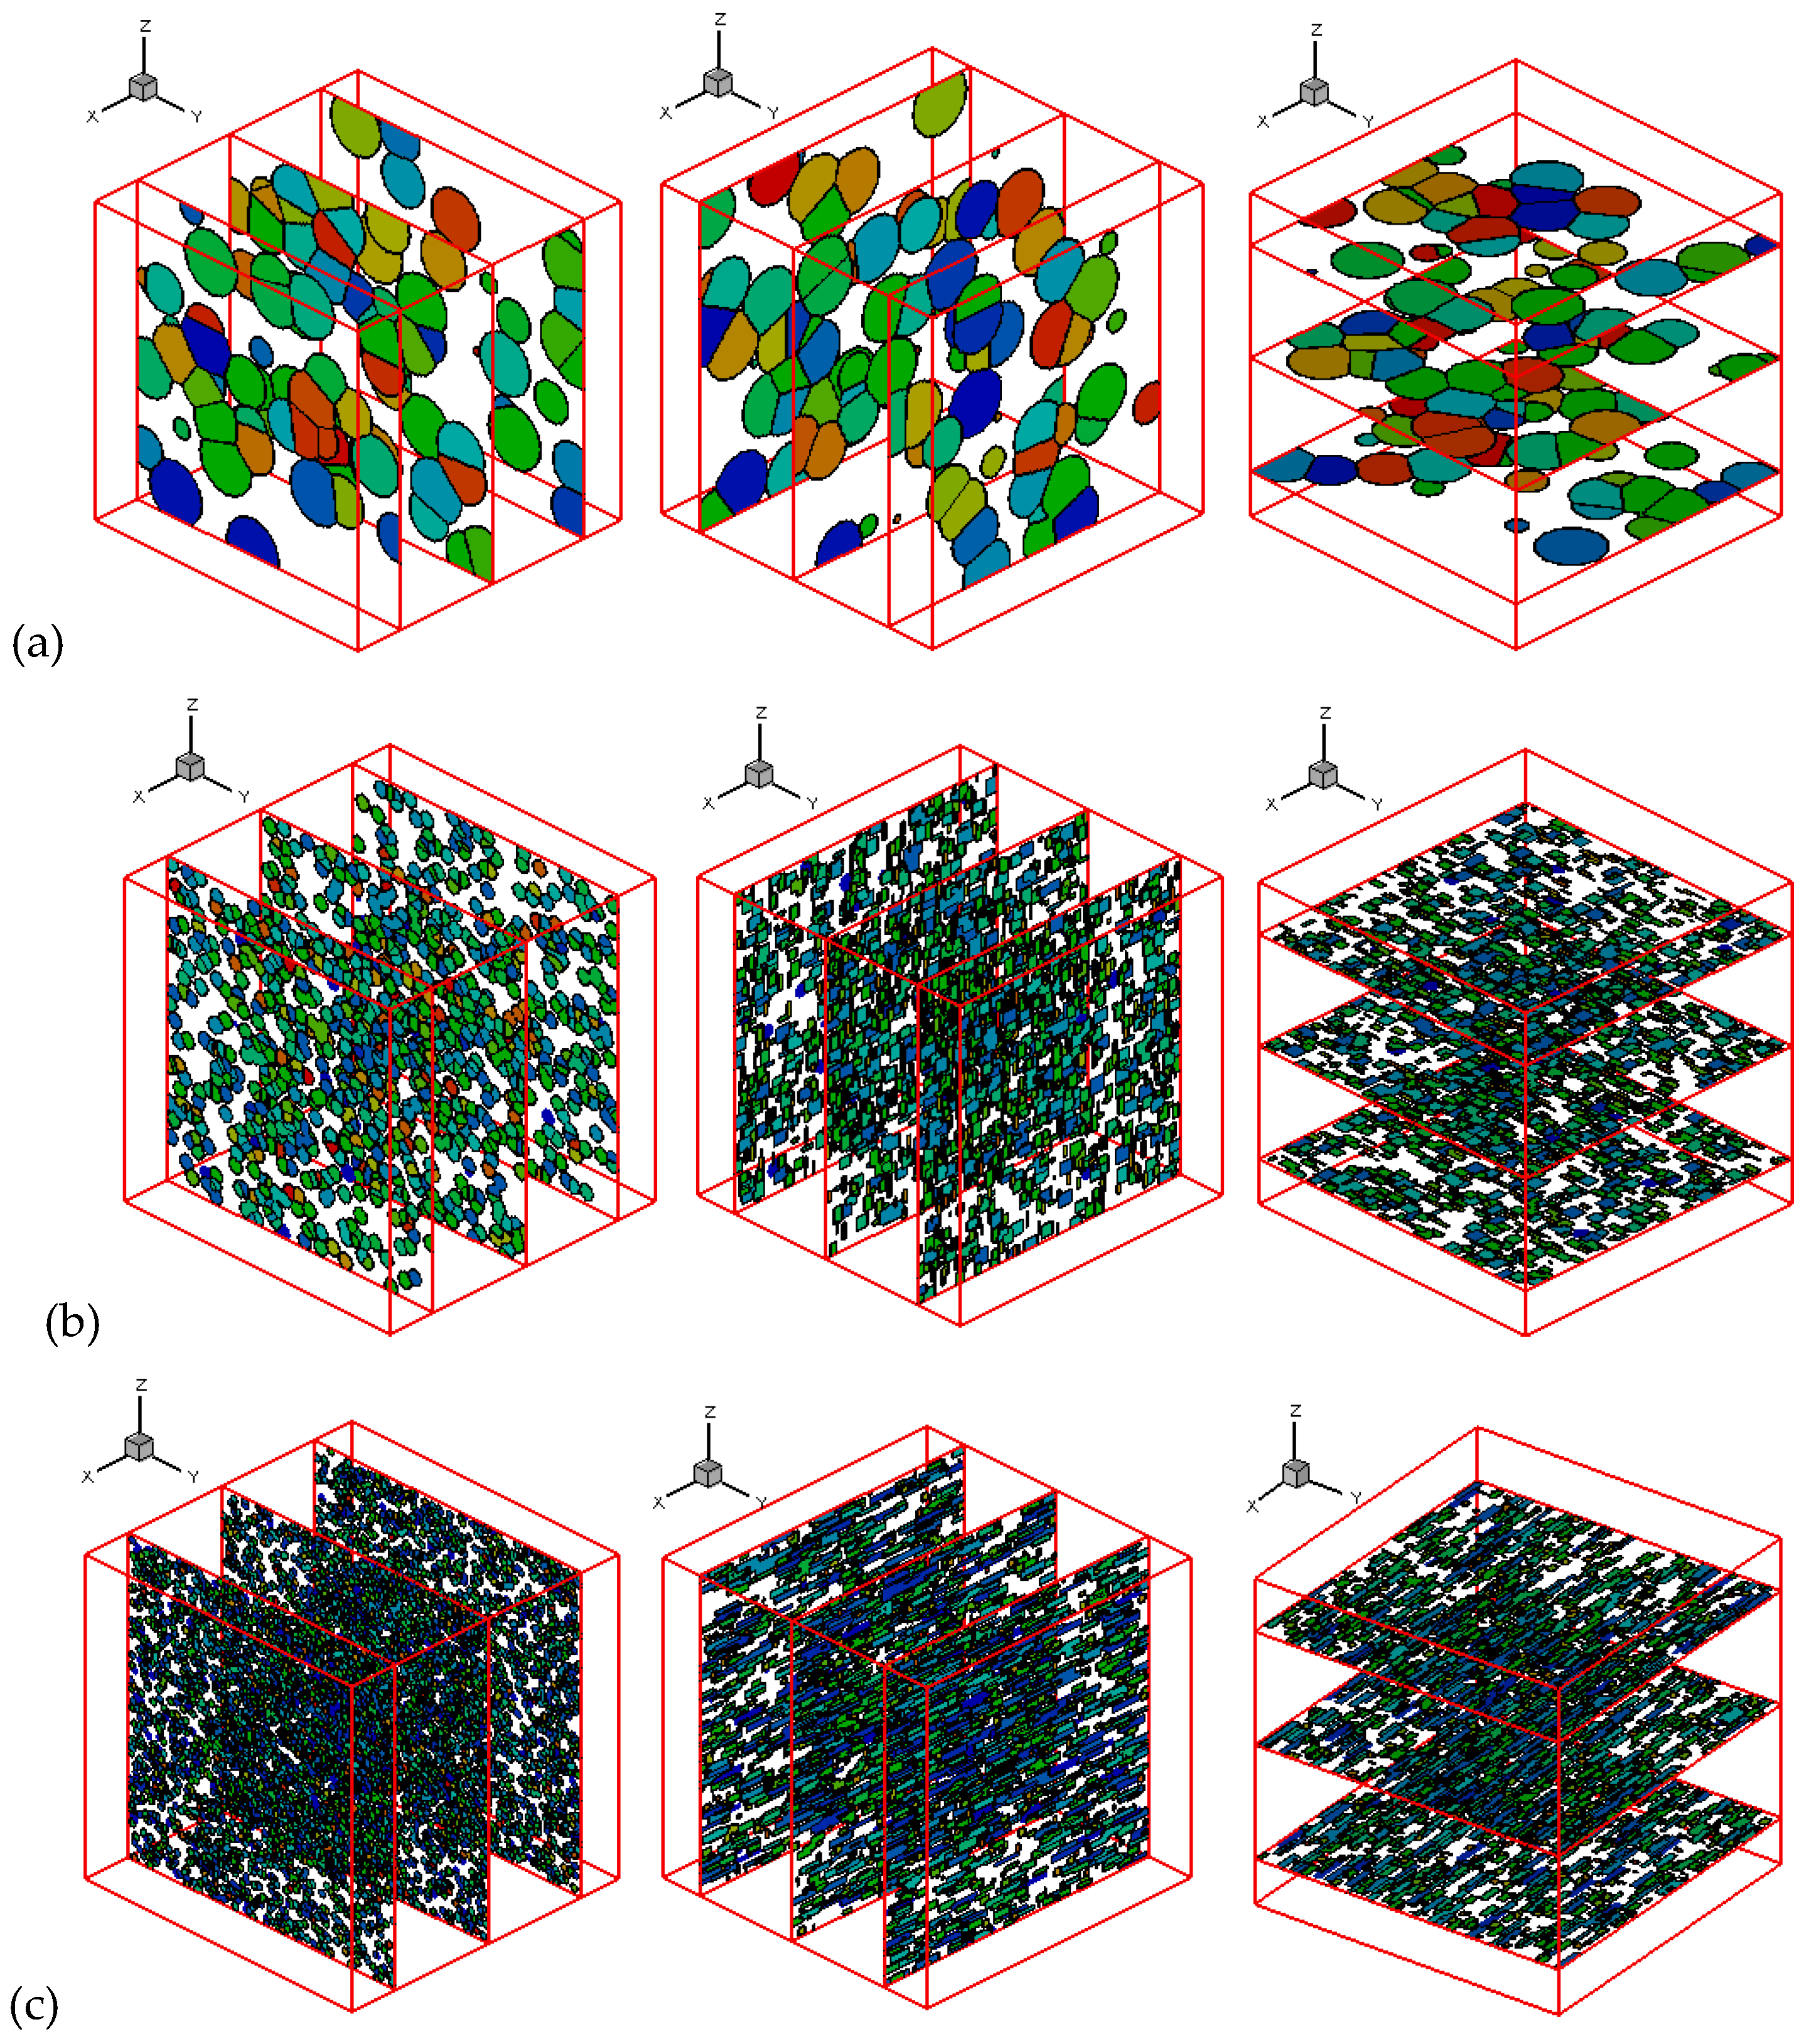
3.3.1. Effects of Shear Rate on Crystallization

Figure 4 gives the number of shish-kebabs with the shear rate γ ˙ = 0 / s , 1 / s , 2 / s , 5 / s , 10 / s . The case γ ˙ = 0 / s represents the quiescent case. It is clear that the number of shish-kebabs increases rapidly with the increase of shear rate. After the cessation of shear, the number of shish-kebabs keeps constant.
Figure 5 shows the relative crystallinity with the different shear rates. It is evident that crystallization rate is quicker in the case of considering the shearing effect. This accelerating effect is mainly contributed by the shear induced shish-kebabs. Due to the shear effect in the flow field, the nucleation and the length growth rate of shish-kebabs are provided. These promise the growth of shish-kebabs and contribute to the acceleration of crystallization process. As can be seen in Figure 5, increase of shear rate significantly increases the crystallization rate. This trend is consistent with the simulation results of Zheng et al. [8], Boutaous et al. [11] and Rong et al. [30].
Figure 6 plots the predicted crystal morphology with the shear rate γ ˙ = 0 / s , 5 / s , 10 / s when α 0.5 . In the quiescent case ( γ ˙ = 0 / s ), the crystal structure is spherulite, while in the shearing case ( γ ˙ = 5 / s , 10 / s ), the crystal structures are spherulite and shish-kebab. As we can see, with the increase of shear rate, the global number of crystals increases obviously. In the γ ˙ = 5 / s case, the shish-kebab structure is not notable. However, in the γ ˙ = 10 / s case, shish-kebab structure is apparent. Thus, we can conclude that the increase of shear rate will lead to a higher anisotropy of the shish-kebab structure and also more impact of shish-kebab on the global crystal morphology.

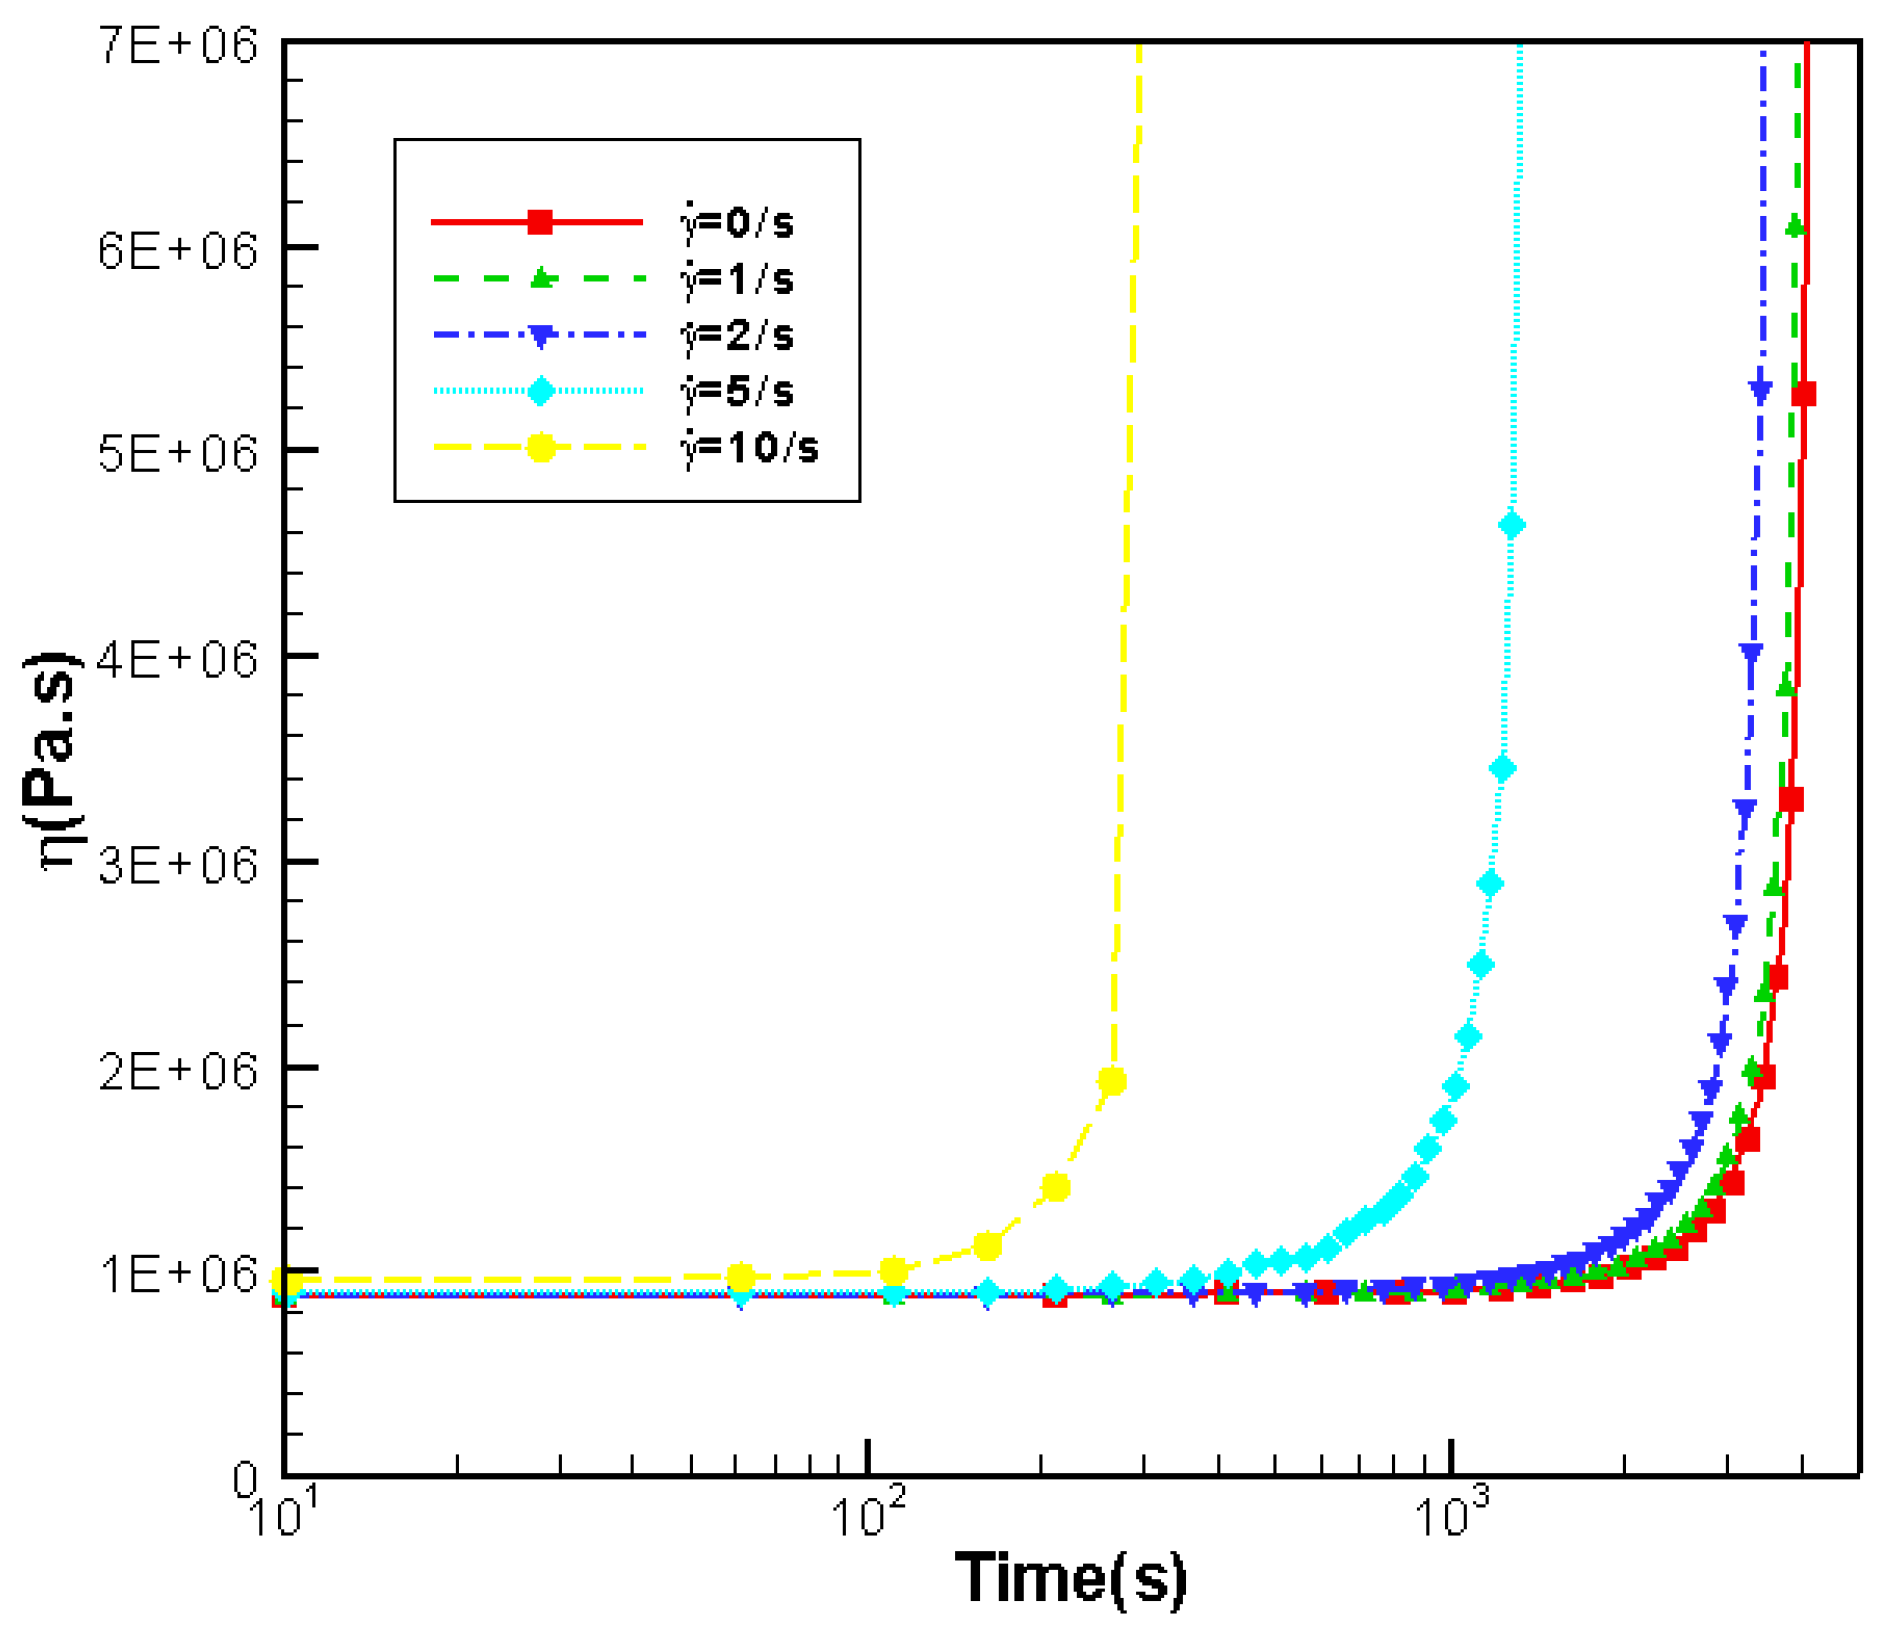
3.3.2. Effects of Shear Rate on Rheology

Figure 7 shows the evolution of viscosity in the system with different shear rates. It is obvious that the viscosity increases slowly with time before it reaches the critical value; however, when it reaches the critical value, the viscosity increases dramatically. This is caused by the crystallization. As is shown in Equation (18), the viscosity of semi-crystalline phase is calculated as η s c ( α , T ) = ( α / A ) β 1 η a ( T ) / ( 1 α / A ) β ; As α A , η s c . Thus, the viscosity of system changes dramatically as α A . Besides, the higher shear rate leads to an earlier sudden increase in viscosity. This is also in agreement with the work by Zheng et al. [8].

3.4. Effects of Shear Time

In this section, we discuss the effects of shear time on the crystallization and rheology. The shear rate is set as γ ˙ = 10 / s and the temperature is set as Tc = 140 °C.

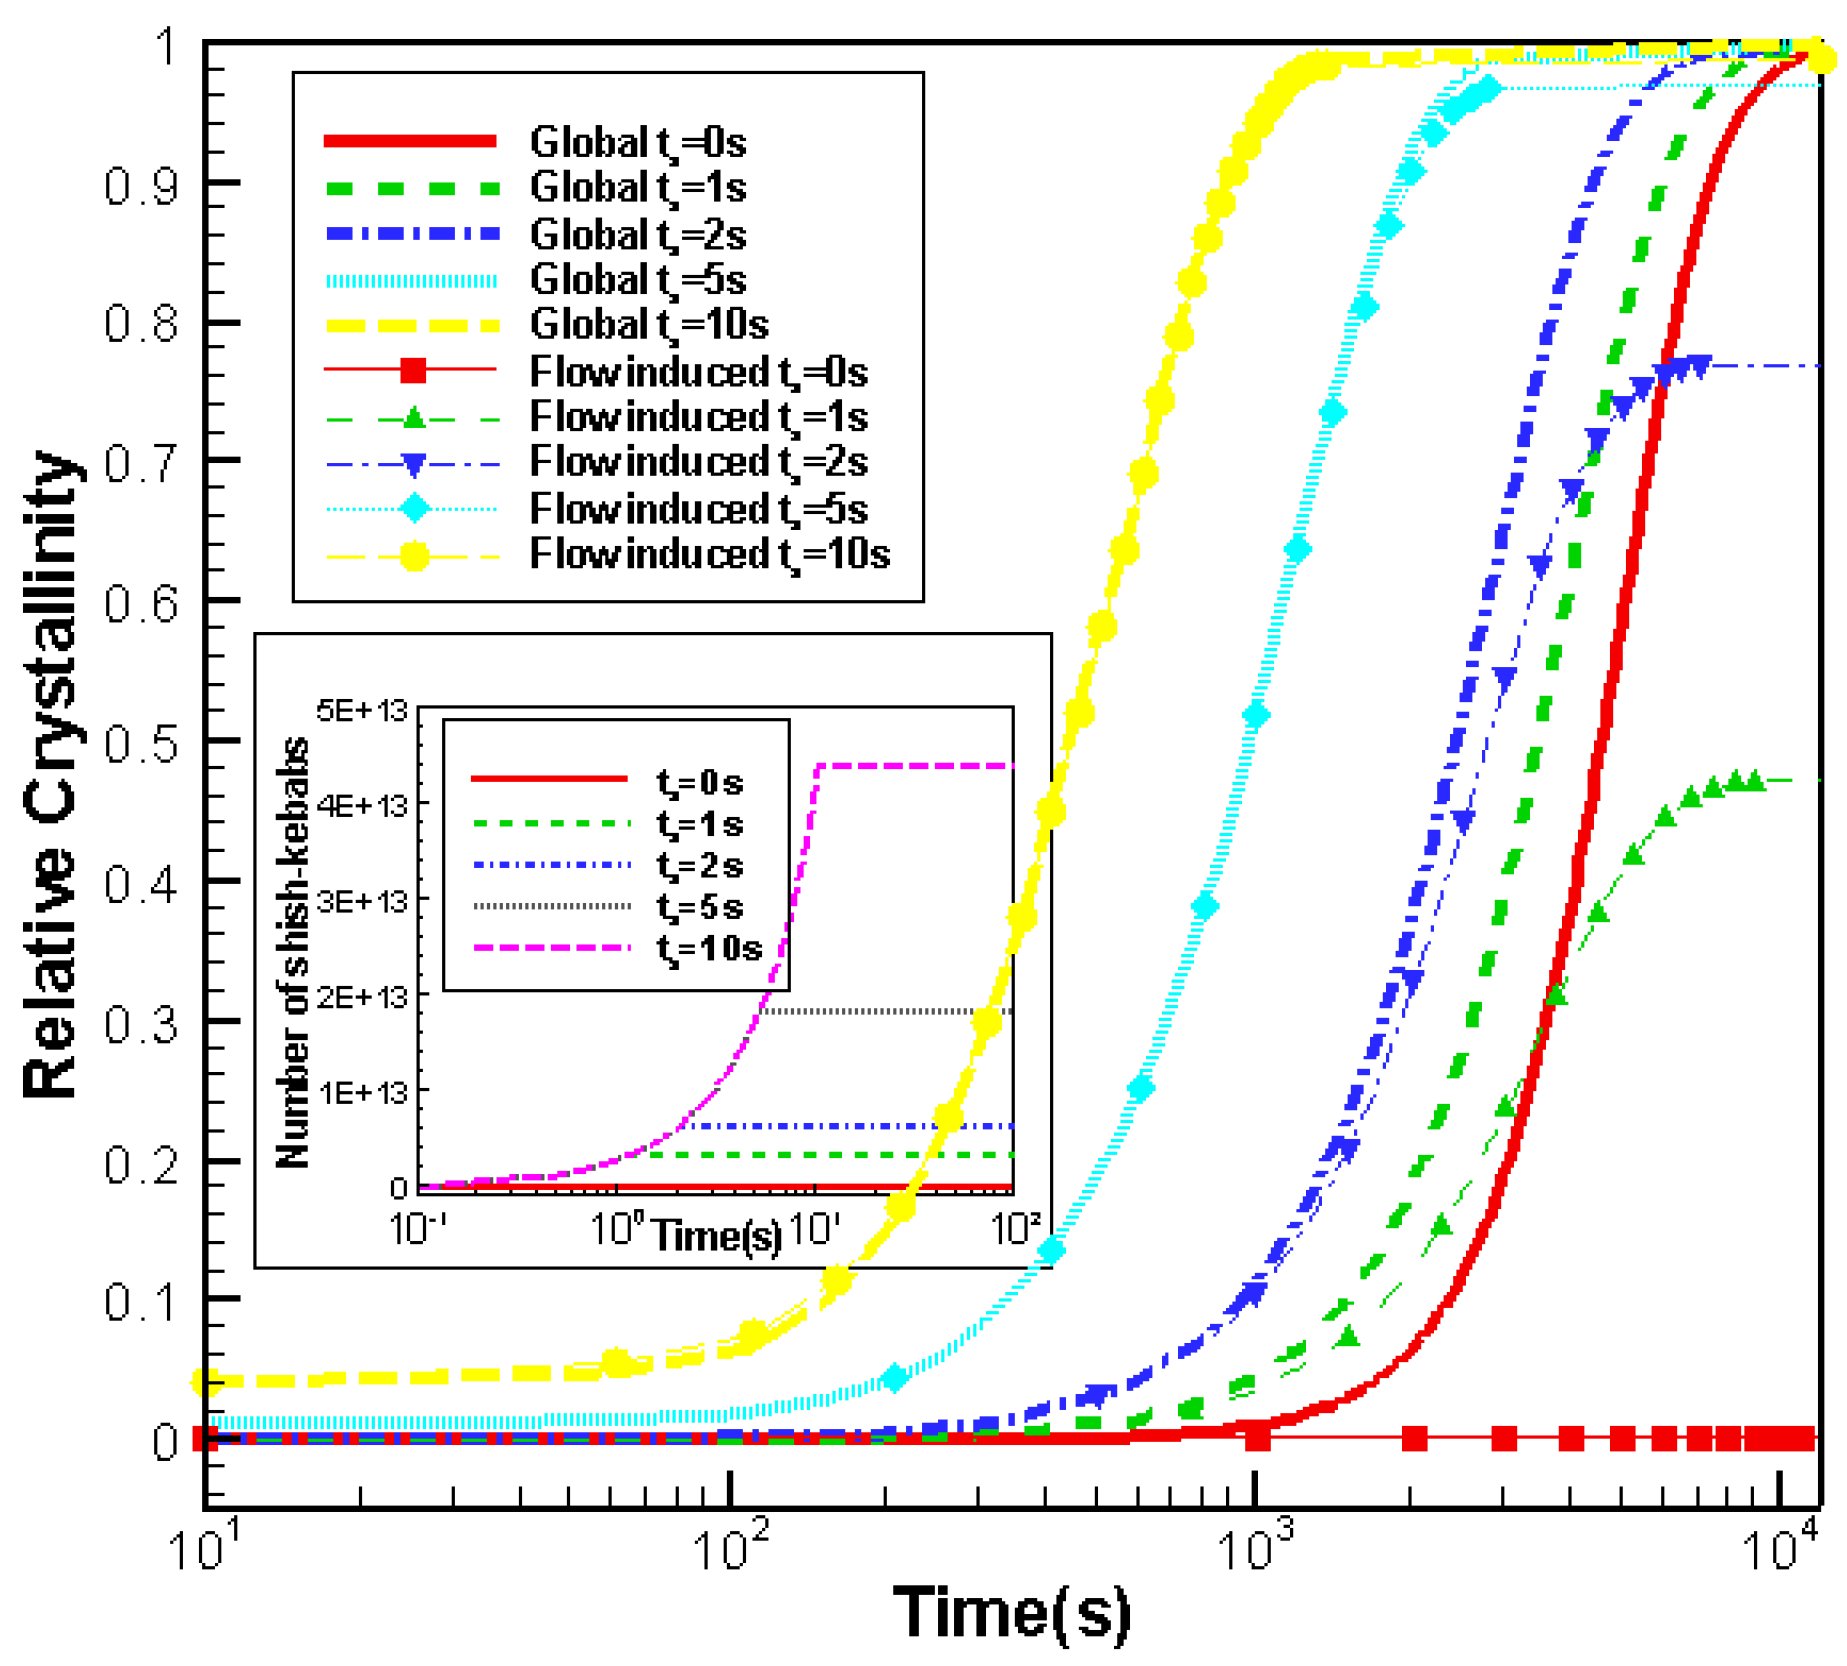
3.4.1. Effects of Shear Time on Crystallization

Relative crystallinity with shear time t s = 0 s , 1 s , 2 s , 5 s , 10 s is shown in Figure 8. Crystallization rate in the shear flow increases more noticeably than in the quiescent condition (shear time t s = 0 s ). Additionally, crystallization rate increases rapidly with the increase of shear time. This acceleration effect is also caused by the flow induced shish-kebabs. As can be seen in Figure 8, the contribution of relative crystallinity induced by flow increases as the shear time increases. Results here are also in consist with the work by Zheng et al. [8], Boutaous et al. [11] and Rong et al. [30].
Crystal morphology when α 0.5 with the shear time t s = 5 s , 10 s , 15 s is plotted in Figure 9. As expected, shish-kebab structure is more apparent in the case with longer shear time. The morphology obtained here is similar to the experimental results by Koscher and Fulchiron [7].

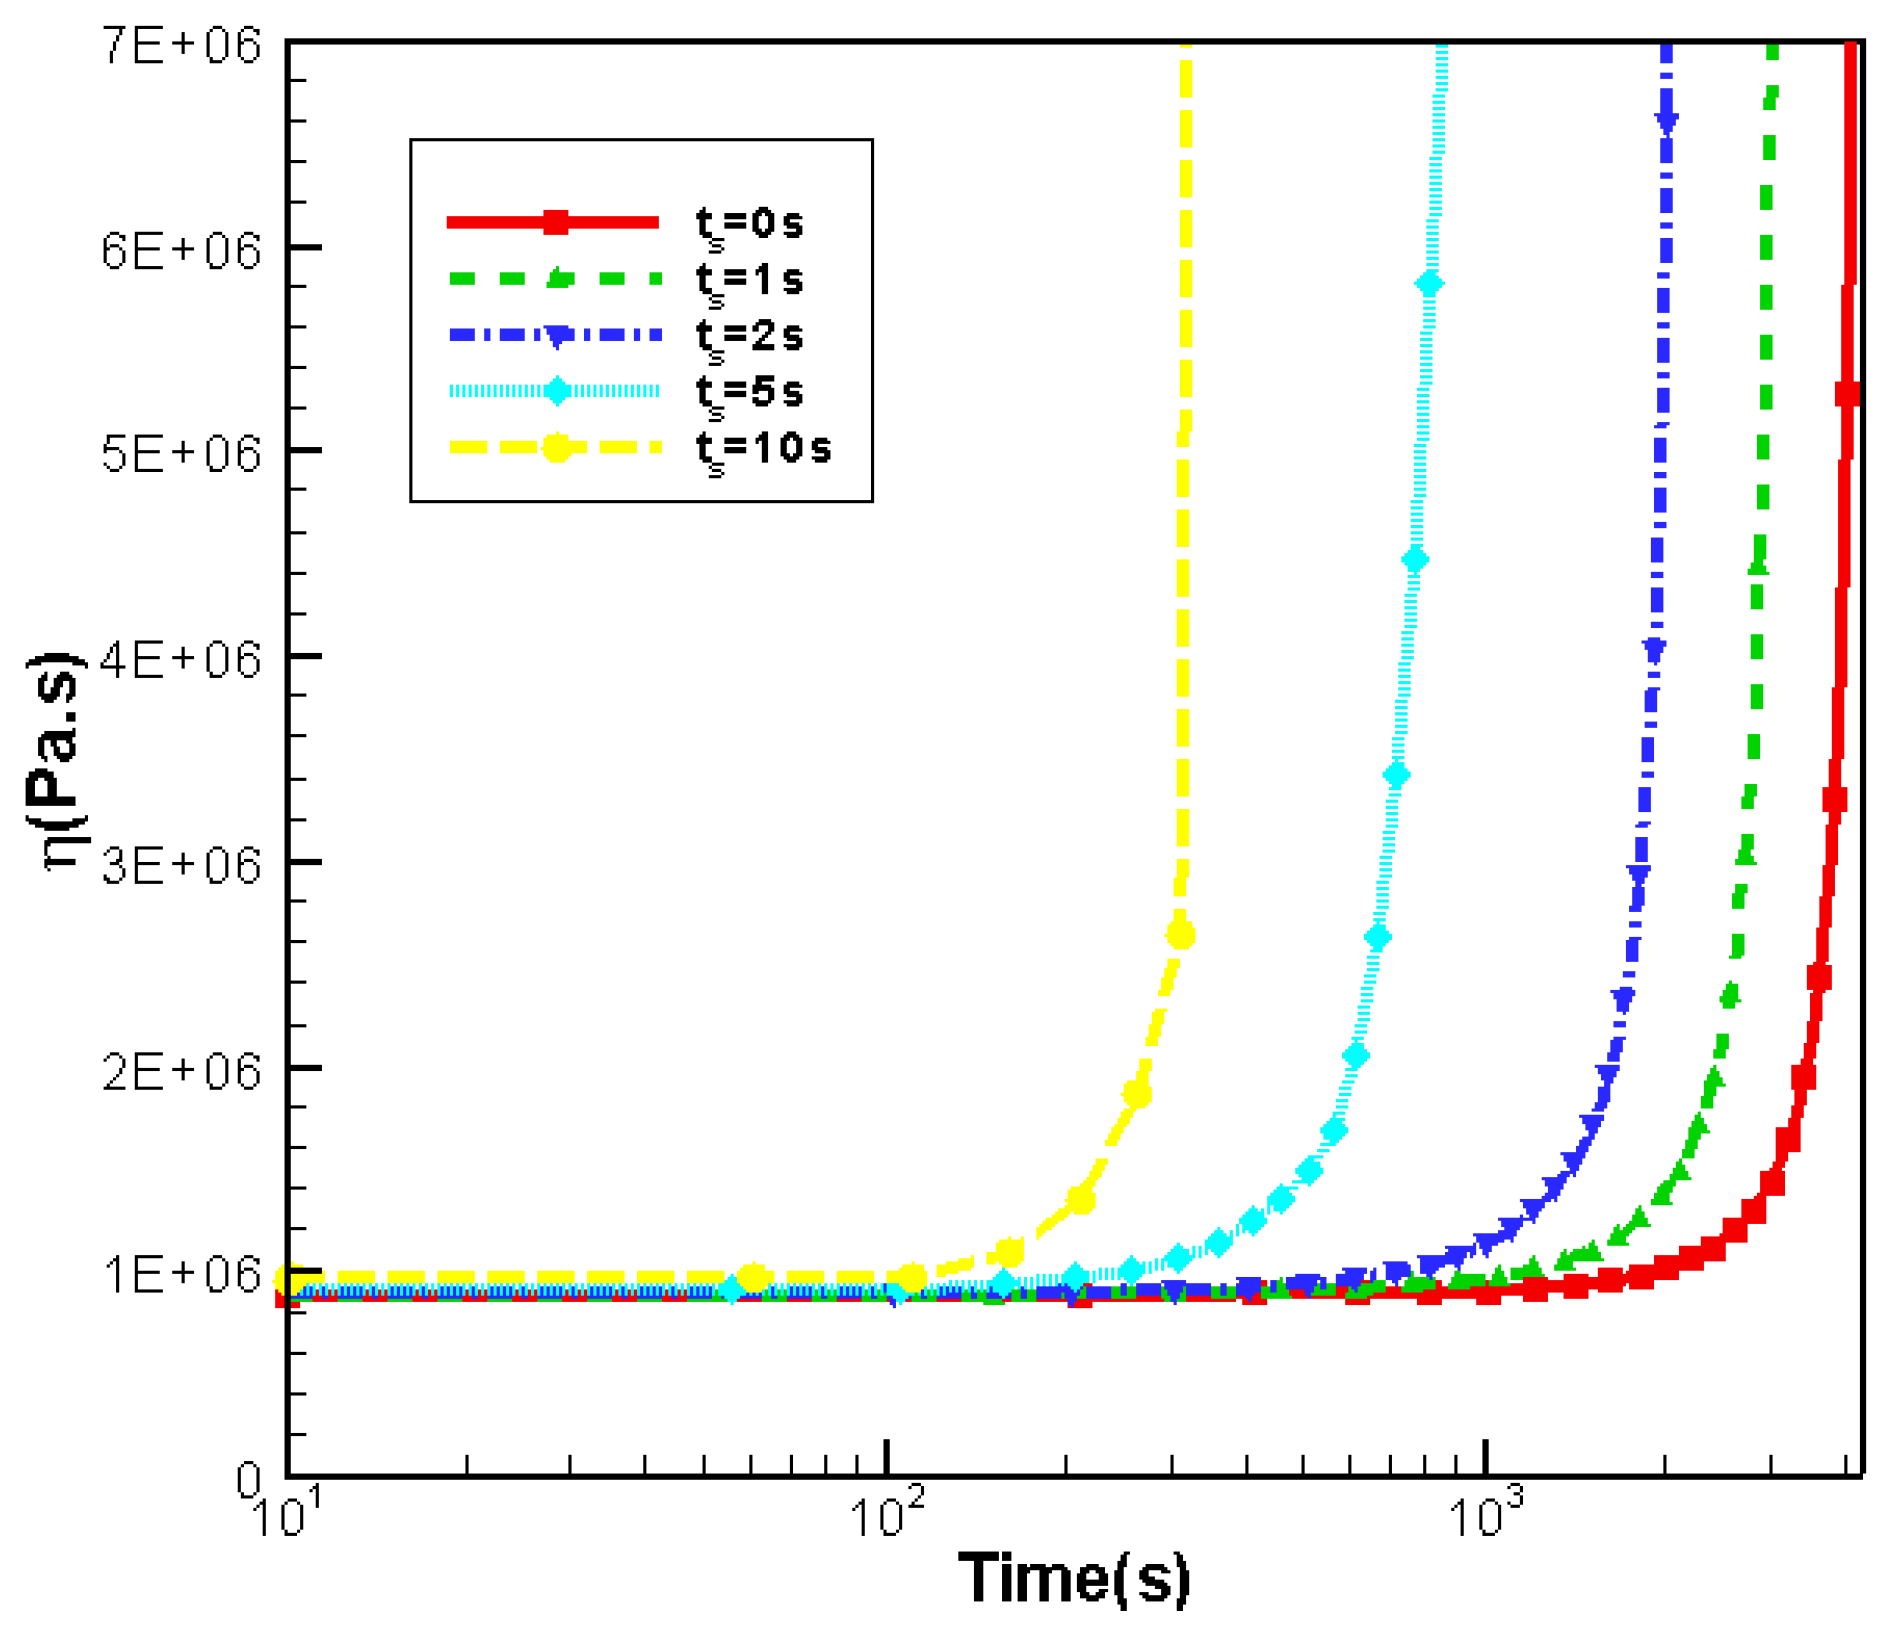
3.4.2. Effects of Shear Time on Rheology

In Figure 10, the evolution of viscosity with different shear time is given. The viscosity of the system changes slowly at first, but becomes suddenly very large when time reaches a certain critical value. Besides, the longer the shear time, the earlier occurring of the sudden increase in viscosity. This is also caused by the crystallization process, which we explained in Section 3.3.2.

3.5. Effects of Shear Strain

In this section, we discuss the effects of shear strain. We set the temperature as Tc = 140 °C.

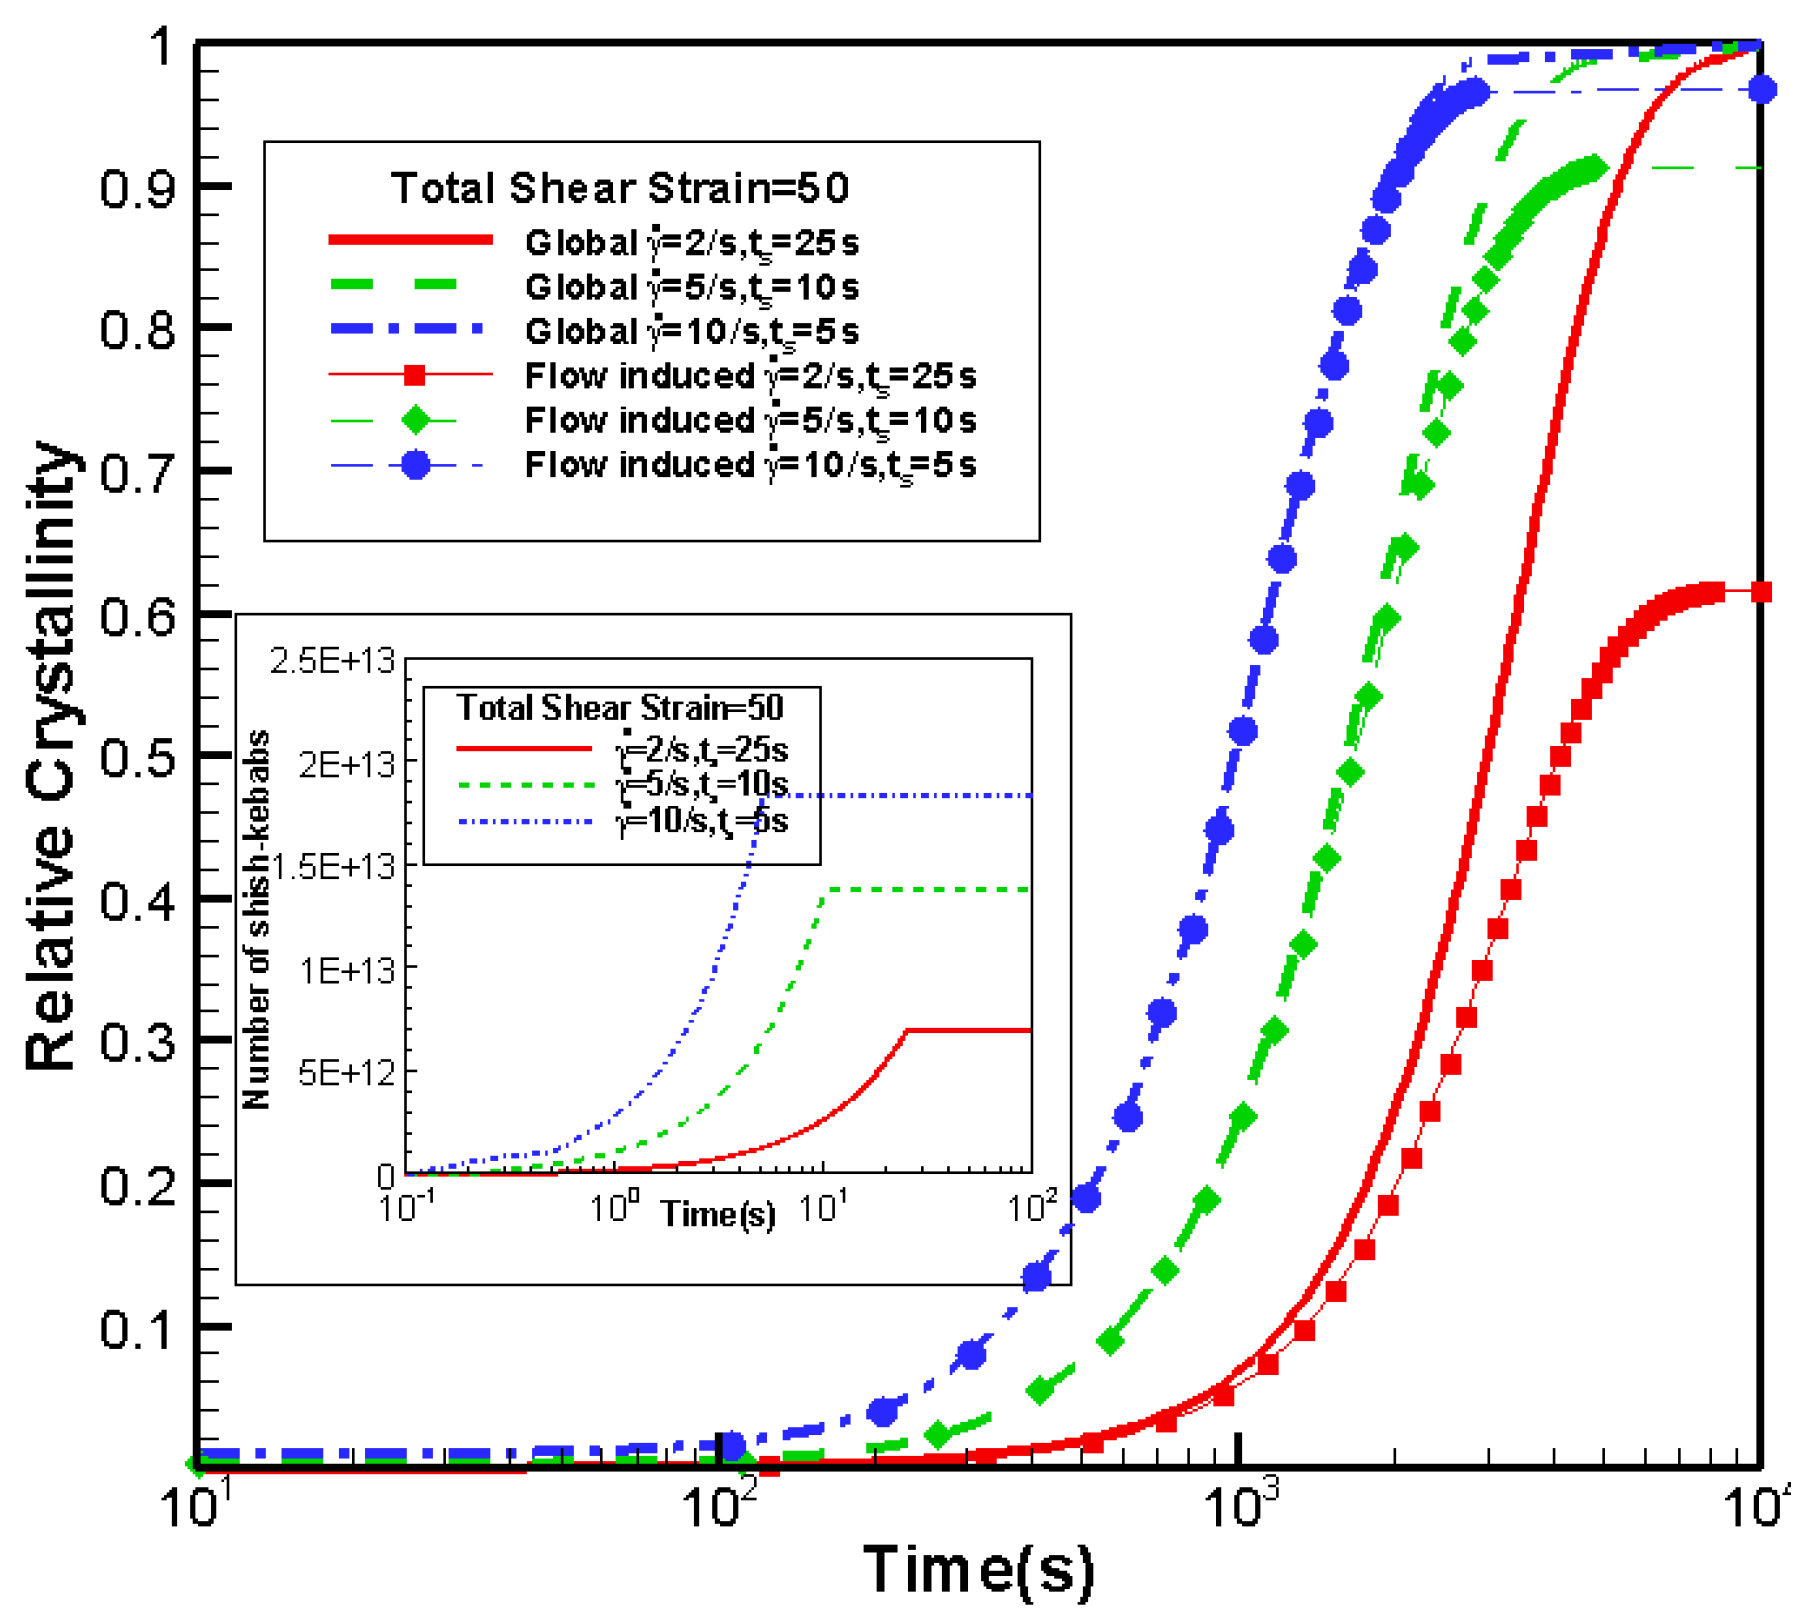
3.5.1. Effects of Shear Strain on Crystallization

Figure 11 plots the evolution of relative crystallinity with time at the total shear strain equal to 50 in three cases: shear rate γ ˙ = 2 s 1 and shear time t s = 25 s , shear rate γ ˙ = 5 s 1 and shear time t s = 10 s , and shear rate γ ˙ = 10 s - 1 and shear time t s = 5 s . As shown in Figure 11, the case with higher shear rate and shorter shear time ( γ ˙ = 10 s 1 , t s = 5 s ) obtains the quickest crystallization rate. This is mainly due to the following two reasons: (1) as seen in Figure 11, the number of shish-kebabs in this case is the largest; and (2) the length of shish-kebabs L s k is the product of the length growth rate G s k , l and the growing time t ˜ (begin with the nucleation of the shish-kebab and end with the shear time), which can be approximated with G s k , l t s . With the help of Equation (8), we know that L s k is a function of γ ˙ 2 t s ; when we keep the shear stain γ = γ ˙ t s as constant, the length of shish-kebabs L s k is larger in the case with higher shear rate γ ˙ . Thus, in the higher shear rate and short shear time case ( γ ˙ = 10 s 1 , t s = 5 s ), the contribution of shish-kebabs is larger. This also agrees with the numerical work by Zheng et al. [8].

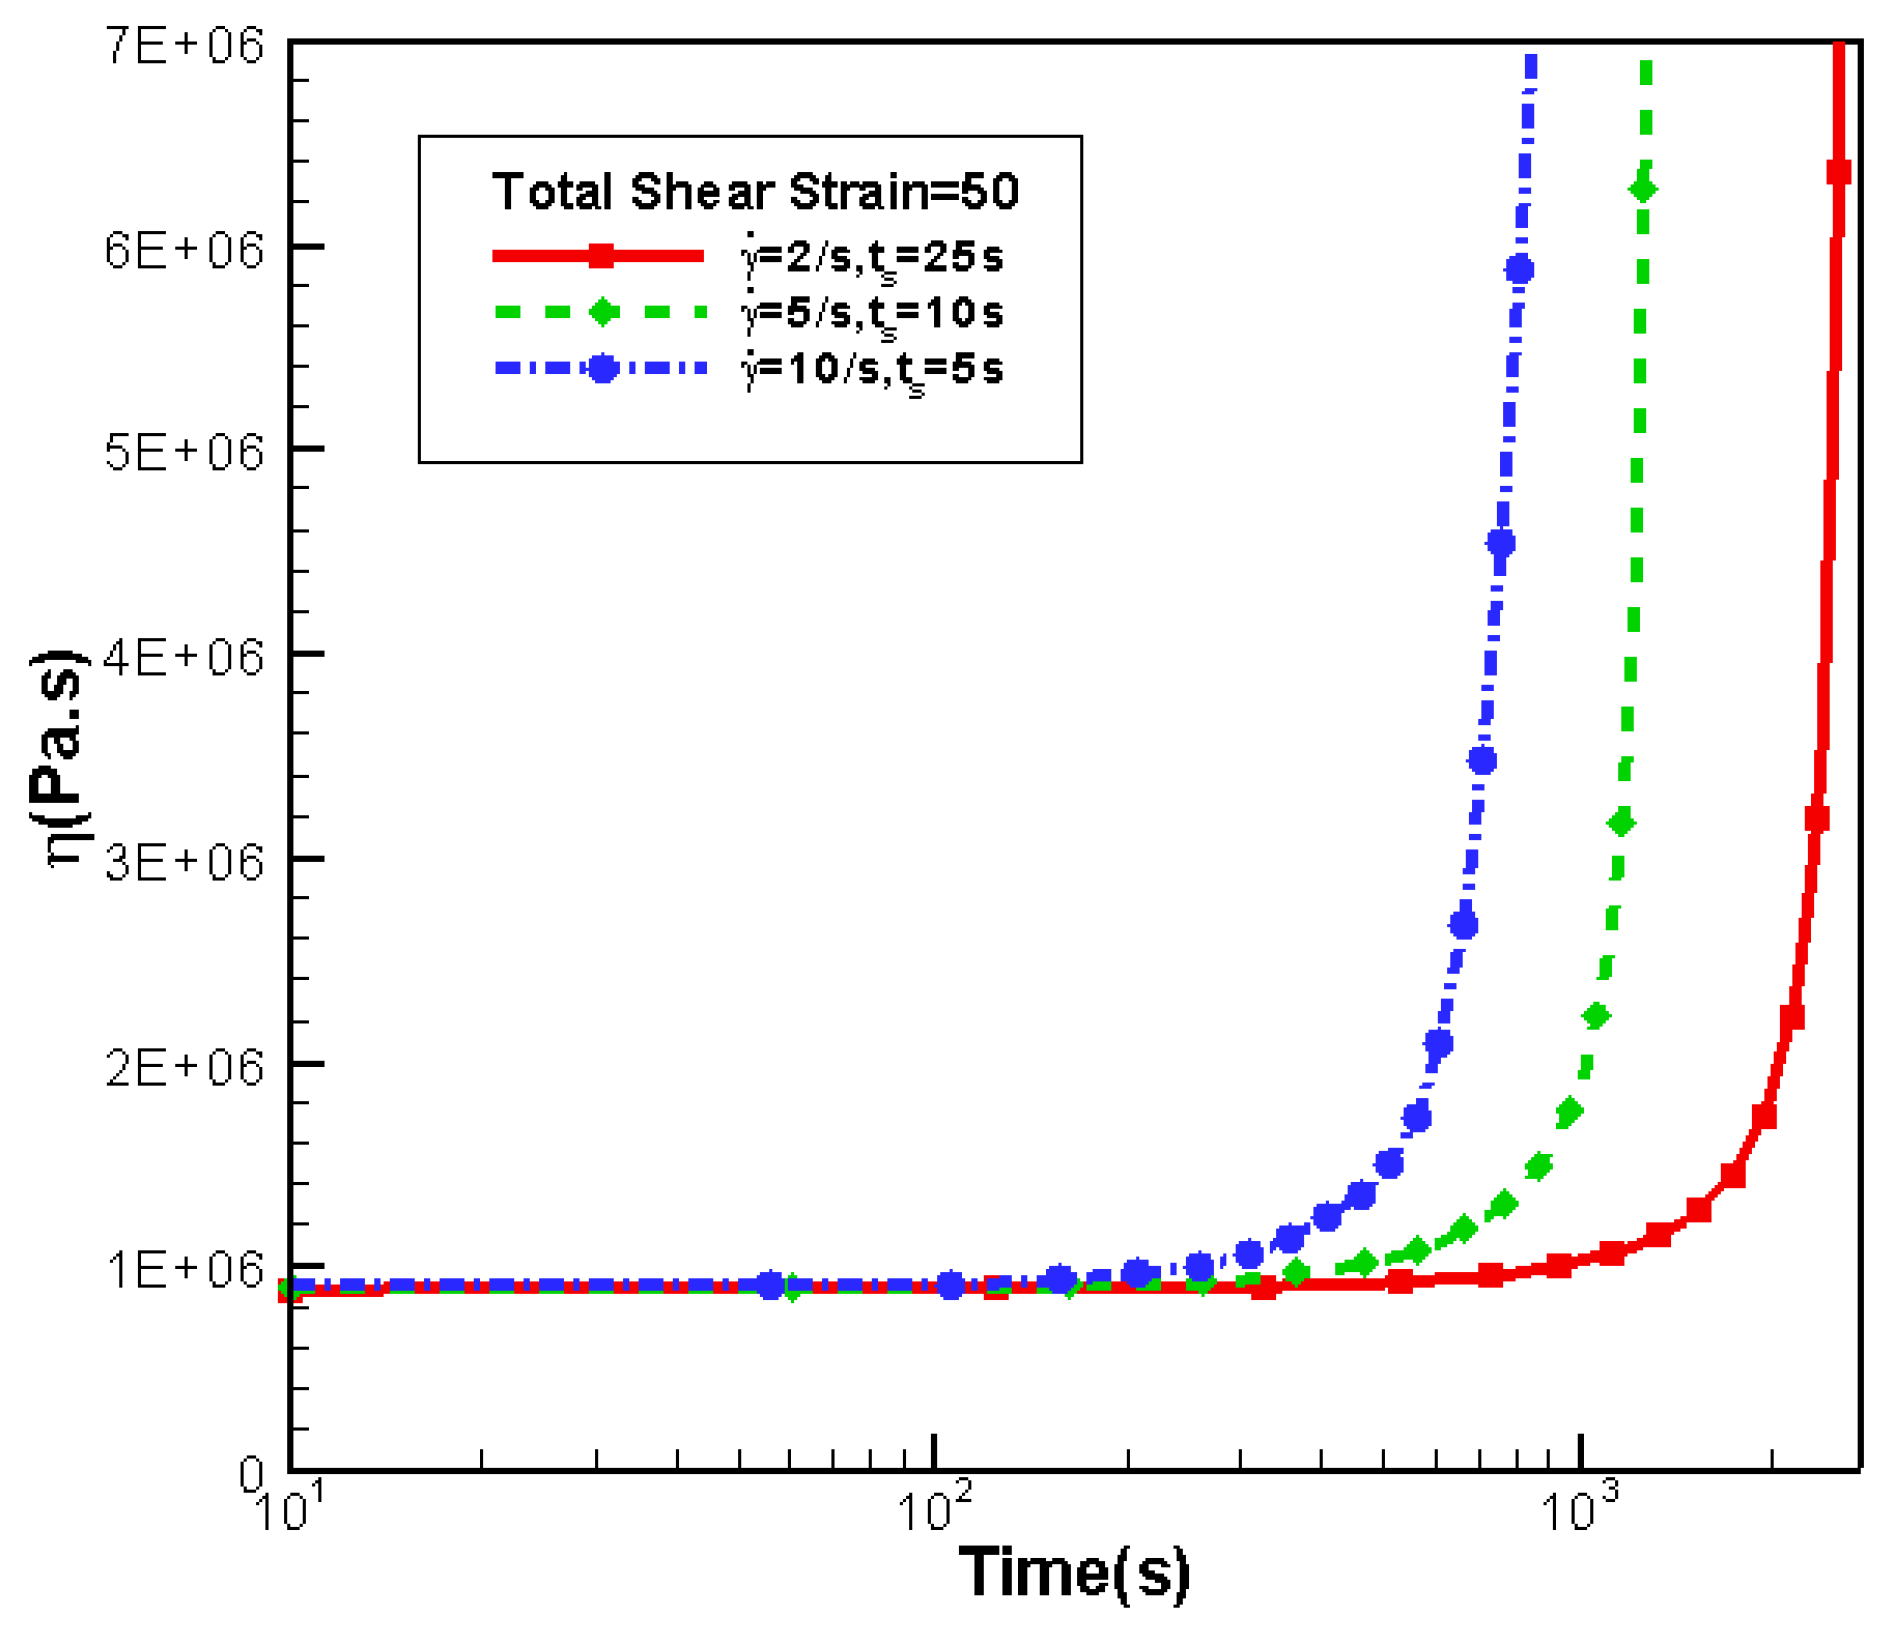
3.5.2. Effects of Shear Strain on Rheology

Figure 12 shows the evolution of viscosity at three different conditions. As expected, the case with higher shear rate and short shear time ( γ ˙ = 10 s 1 , t s = 5 s ) has the earliest occurring sudden increase.

4. Conclusions

A morphological Monte Carlo simulation is carried out to calculate the crystallization kinetics and capture the crystal morphology in 3D simple shear flow. Effects of shear rate, shear time and the shear strain on crystallization kinetics, crystal morphology and rheology of the system are discussed. The conclusions are drawn as follows.
(1)
The evolution model and Monte Carlo method established are effective and reliable. With the evolution model and Monte Carlo algorithm, we obtain reliable crystallization kinetics and detailed crystal morphology.
(2)
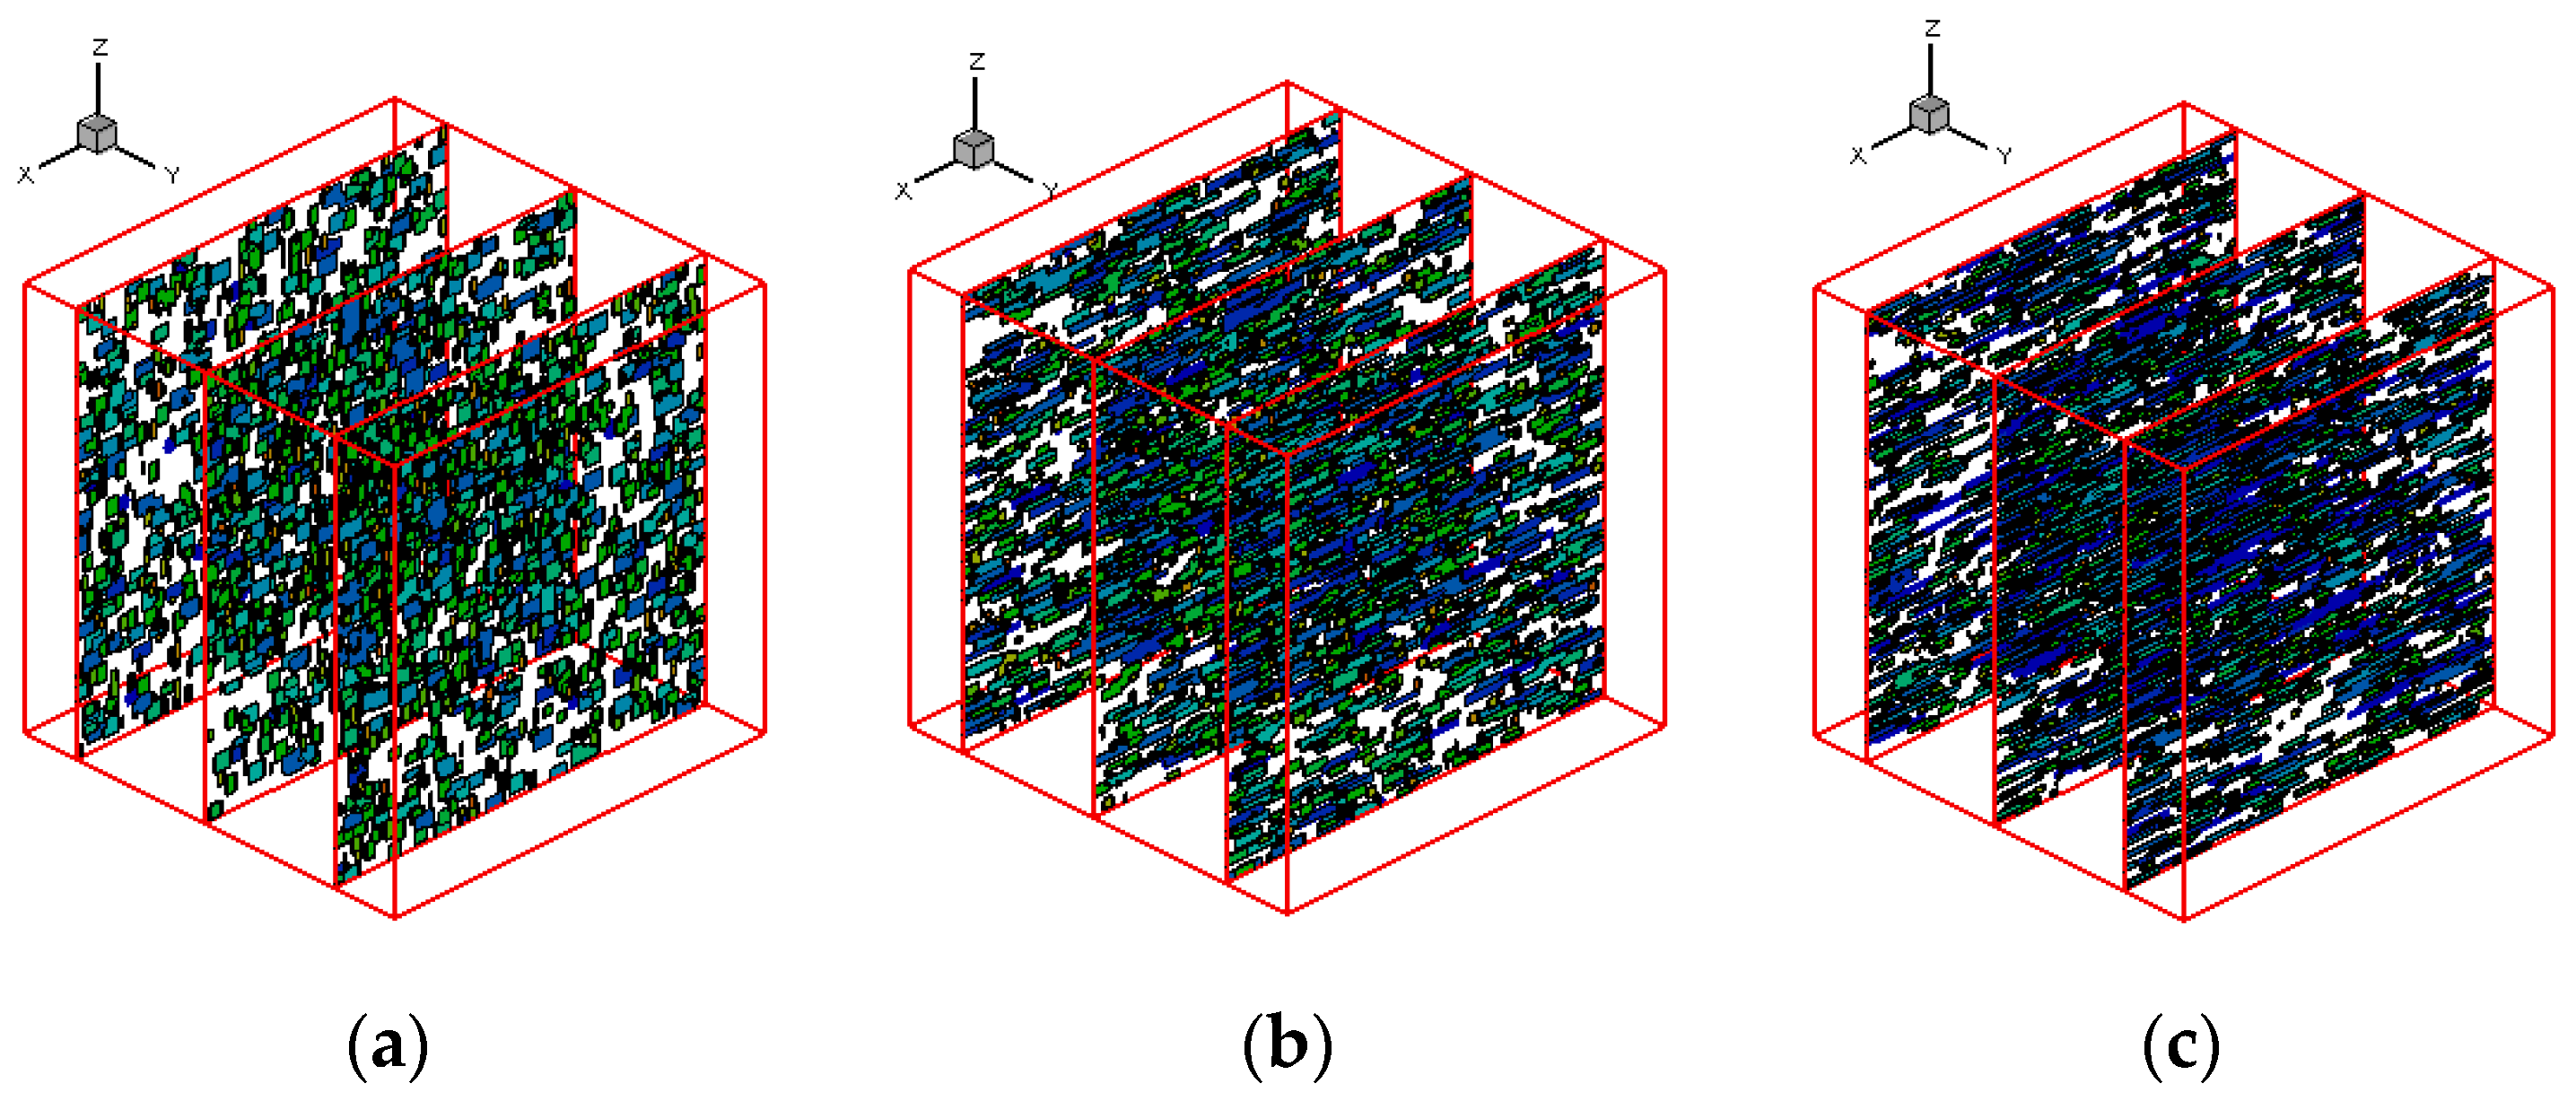
Effects of shear rate, shear time and shear strain on crystallization and rheology obtained here is in agreement with other numerical work and experimental results. We show the great influence of shear rate and shear time on the crystallization kinetics, crystal morphology and rheology of the system. In a higher shear rate or longer shear time case, the contribution of shish-kebabs to both crystallization kinetics and morphology becomes more significant and the sudden increase of viscosity occurs earlier. Under the same shear strain, the case with higher shear rate and shorter shear time can lead to a quicker crystallization rate and an earlier occurrence of sudden increase of viscosity.

Acknowledgments

The financial supports provided by the Natural Sciences Foundation of China (Nos. 11402078, 51375148, and U1304521) and the Scientific and Technological Research Project of Henan Province (Nos. 122102210198 and 14B110020) were fully acknowledged.

Conflicts of Interest

The authors declare no conflict of interest.

References

  1. Eder, G.; Janeschitz-Kriegl, H. Materials Science and Technology; Wiley: New York, NY, USA, 1997. [Google Scholar]
  2. Zheng, R.; Tanner, R.I.; Fan, X.J. Injection Molding: Integration of Theory and Modeling Methods; Springer: Berlin, Germany, 2011. [Google Scholar]
  3. Pantanin, R.; Coccorullo, I.; Speranza, V.; Titomanlio, G. Modeling of morphology evolution in the injection molding process of thermoplastic polymers. Prog. Polym. Sci. 2005, 30, 1185–1222. [Google Scholar] [CrossRef]
  4. Doufas, A.K.; Mchugh, A.J.; Miller, C. Simulation of melt spinning including flow-induced crystallization. Part 1. Model development and predictions. J. Non-Newtonian Fluid Mech. 2000, 92, 27–66. [Google Scholar] [CrossRef]
  5. Tanner, R.I. A suspension model for low shear rate polymer solidification. J. Non-Newtonian Fluid Mech. 2002, 102, 397–408. [Google Scholar] [CrossRef]
  6. Ziabicki, A.; Janecki, L.; Sorrentino, A. The role of flow-induced crystallization in melt spinning. e-Ploymers 2004, 4, 823–836. [Google Scholar]
  7. Koscher, E.; Fulchiron, R. Influence of shear on polypropylene crystallization: Morphology development and kinetics. Polymer 2002, 43, 6931–6942. [Google Scholar] [CrossRef]
  8. Zheng, R.; Kennedy, P.K. A model for post-flow induced crystallization: General equations and predictions. J. Rheol. 2004, 48, 823–842. [Google Scholar] [CrossRef]
  9. Schneider, W.; Koppl, A.; Berger, J. Non-isothermal crystallization of polymers. Int. Polym. Process 1988, 3, 151–154. [Google Scholar]
  10. Zuidema, H.; Peters, G.W.M.; Meijer, H.E.H. Development and validation of a recoverable strain-based model for flow induced crystallization of polymers. Macromol. Theory Simul. 2001, 10, 447–460. [Google Scholar] [CrossRef]
  11. Boutaous, M.; Bourgin, P.; Zinet, M. Thermally and flow induced crystallization of polymers at low shear rate. J. Non-Newtonian Fluid Mech. 2010, 165, 227–237. [Google Scholar] [CrossRef]
  12. Raabe, D. Mesoscale simulation of spherulite growth during polymer crystallization by use of a cellular automaton. Acta Mater. 2004, 52, 2653–2664. [Google Scholar] [CrossRef]
  13. Raabe, D.; Godara, A. Mesoscale simulation of the kinetics and topology of spherulite growth during crystallization of isotactic polypropylene (iPP) by using a cellular automaton. Model. Simul. Mater. Sci. Eng. 2005, 13, 733–751. [Google Scholar] [CrossRef]
  14. Raabe, D. Simulation of spherulite growth during polymer crystallization by use of a cellular automaton. Mater. Sci. Forum 2004, 467, 603–608. [Google Scholar] [CrossRef]
  15. Lin, J.X.; Wang, C.Y.; Zheng, Y.Y. Prediction of isothermal crystallization parameters in monomer cast nylon 6. Comput. Chem. Eng. 2008, 32, 3023–3029. [Google Scholar] [CrossRef]
  16. Spina, R.; Spekowius, M.; Hopmann, C. Multi-scale thermal simulation of polymer crystallization. Int. J. Mater. Form 2015, 8, 497–504. [Google Scholar] [CrossRef]
  17. Spina, R.; Spekowius, M.; Hopmann, C. Multiphysics simulation of thermoplatic polymer crystallization. Mater. Des. 2016, 95, 455–469. [Google Scholar]
  18. Liu, Z.J.; Ouyang, J.; Zhou, W.; Wang, X.D. Simulation of polymer crystallization under isothermal and temperature gradient conditions using praticle level set method. Crystals 2016, 6, 90. [Google Scholar] [CrossRef]
  19. Liu, Z.J.; Ouyang, J.; Ruan, C.; Liu, Q.S. Numerical simulation of the polymer crystallization during cooling stage by using level set method. Comput. Mater. Sci 2015, 97, 245–253. [Google Scholar] [CrossRef]
  20. Micheletti, A.; Burger, M. Stochastic and deterministic simulation of nonisothermal crystallization of polymers. J. Math. Chem. 2001, 30, 169–193. [Google Scholar] [CrossRef]
  21. Ruan, C. Multiscale numerical study of 3D polymer crystallization during cooling stage. Math. Probl. Eng. 2012, 2012, 802420. [Google Scholar] [CrossRef]
  22. Ruan, C.; Ouyang, J.; Liu, S. Computer modeling of isothermal crystallization in short fiber reinforced composites. Comput. Chem. Eng. 2011, 35, 2306–2317. [Google Scholar] [CrossRef]
  23. Ketdee, S.; Anantawaraskul, S. Simulation of crystallization kinetics and morphological development during isothermal crystallization of polymers: Effect of number of nuclei and growth rate. Chem. Eng. Commun. 2008, 195, 1315–1327. [Google Scholar] [CrossRef]
  24. Ruan, C.; Liu, C.; Zheng, G. Monte Carlo simulation for the morphology and kinetics of spherulites and shish-kebabs in isothermal polymer crystallization. Math. Probl. Eng. 2015, 2015, 50624. [Google Scholar] [CrossRef]
  25. Godara, A.; Raabe, D.; Van Puyvelde, P.; Moldenaers, P. Influence of flow on the global crystallization kinetics of iso-tactic polypropylene. Polym. Test. 2006, 25, 460–469. [Google Scholar] [CrossRef]
  26. Hoffman, J.D.; Miller, R.L. Kinetics of crystallization from the melt and chain folding in polyethylene fractions revisited: theory and experiment. Polymer 1997, 38, 3151–3212. [Google Scholar] [CrossRef]
  27. Owens, R.G.; Phillips, T.N. Computational Rheology; Imperial College Press: London, UK, 2002. [Google Scholar]
  28. Chung, D.H.; Kwon, T.H. Invariant-based optimal fitting closure approximation for the numerical prediction of flow-induced fiber orientation. J. Rheol. 2002, 46, 169–194. [Google Scholar] [CrossRef]
  29. Tanner, R.I.; Qi, F. A comparison of some models for describing polymer crystallization at low deformation rates. J. Non-Newtonian Fluid Mech. 2005, 127, 131–141. [Google Scholar] [CrossRef]
  30. Rong, Y.; He, H.P.; Cao, W.; Shen, C.Y.; Chen, J.B. Multi-scale molding and numerical simulation of the flow-induced crystallization. Comput. Mater. Sci 2013, 67, 35–39. [Google Scholar] [CrossRef]
Figure 1. Flow chart for the Monte Carlo method in the simulation.
Crystals 07 00051 g001
Figure 2. Comparison of simulation result with Avrami model.
Crystals 07 00051 g002
Figure 3. Comparison of simulation result with the experimental result [7].
Crystals 07 00051 g003
Figure 4. Number of shish-kebabs with different shear rates.
Crystals 07 00051 g004
Figure 5. Relative crystallinity comparison with different shear rates.
Crystals 07 00051 g005
Figure 6. Morphology comparison with different shear rates ( α 0.5 ). (a) γ ˙ = 0 s 1 ; (b) γ ˙ = 5 s 1 ; and (c) γ ˙ = 10 s 1 .
Crystals 07 00051 g006
Figure 7. Evolution of viscosity with different shear rate.
Crystals 07 00051 g007
Figure 8. Relative crystallinity comparison with different shear time.
Crystals 07 00051 g008
Figure 9. Morphology comparison with different shear time ( α 0.5 ): (a) t s = 5 s ; (b) t s = 10 s ; and (c) t s = 15 s .
Crystals 07 00051 g009
Figure 10. Evolution of viscosity with different shear time.
Crystals 07 00051 g010
Figure 11. Relative crystallinity comparison with same shear strain but different shear rate and shear time.
Crystals 07 00051 g011
Figure 12. Evolution of viscosity with same shear strain but different shear rate and shear time.
Crystals 07 00051 g012
Table 1. Material data and input parameters.
VariablesDefinitionValuesVariablesDefinitionValues
a ˜ Equation (4) 1.56 × 10 1 λ a , 0 Equation (12) 4.00 × 10 2 s
b ˜ Equation (4) 1.51 × 10 1 T 0 Equation (12) 476.15 K
G 0 Equation (5) 2.83 × 10 2 m / s E a / R g Equation (12) 5.602 × 10 3 K
U * / R g Equation (5) 755 K b Equations (11) and (13) 5
K g Equation (5) 5.5 × 10 5 K 2 n Equation (13) 1.26 × 10 26 / m 3
T m 0 Equation (5) 483 K k Equation (13) 1.38 × 10 23
T g Equation (5) 269 K β Equations (15) and (18) 9.2
g l / γ ˙ l 2 Equation (8) 2.69 × 10 8 β 1 Equations (15) and (18) 0.05
C Equation (10) 10 6 Pa 1 s 1 m 1 A Equations (15) and (18) 0.44

