Article

Enhanced Thermoelectric Properties of Graphene/Cu2SnSe3 Composites

School of Materials Science and Engineering, University of Jinan, Jinan 250022, China
*
Author to whom correspondence should be addressed.
Crystals 2017, 7(3), 71; https://doi.org/10.3390/cryst7030071
Submission received: 28 January 2017 / Revised: 26 February 2017 / Accepted: 27 February 2017 / Published: 28 February 2017
(This article belongs to the Special Issue Materials Processing and Crystal Growth for Thermoelectrics)

Abstract

:
Cu2SnSe3 material is regarded as a potential thermoelectric material due to its relatively high carrier mobility and low thermal conductivity. In this study, graphene was introduced into the Cu2SnSe3 powder by ball milling, and the bulk graphene/Cu2SnSe3 thermoelectric composites were prepared by spark plasma sintering. The graphene nanosheets distributed uniformly in the Cu2SnSe3 matrix. Meanwhile, some graphene nanosheets tended to form thick aggregations, and the average length of these aggregations was about 3 μm. With the fraction of graphene increasing, the electrical conductivity of graphene/Cu2SnSe3 samples increased greatly while the Seebeck coefficient was decreased. The introduction of graphene nanosheets can reduce the thermal conductivity effectively resulting from the phonon scattering by the graphene interface. When the content of graphene exceeds a certain value, the thermal conductivity of graphene/Cu2SnSe3 composites starts to increase. The achieved highest figure of merit (ZT) for 0.25 vol % graphene/Cu2SnSe3 composite was 0.44 at 700 K.

1. Introduction

Due to the dilemma between energy crisis and environmental stewardship, developing renewable energy technologies has attracted considerable research interest in the past decade. Thermoelectric materials, which can directly convert heat energy into electrical energy and vice versa, show great promise in the application of solid-state cooling, waste heat recovery, and power generation. The conversion efficiency of thermoelectric material is governed by the dimensionless figure of merit, ZT = σα2T/κ, where σ, α, T, and κ are the electrical conductivity, Seebeck coefficient, absolute temperature and thermal conductivity, respectively. The total thermal conductivity is composed of carrier thermal conductivity (κc) and lattice thermal conductivity (κl). Therefore, thermoelectric materials with good performance should have a large α and σ and low κ. As the fundamental material parameters (α, σ, and κc) are interrelated and conflicting via carrier concentration in bulk thermoelectric materials, it is a longstanding challenge to largely improve the overall ZT [1,2,3,4]. Therefore, concepts or strategies that can decouple these parameters to simultaneously optimize the electron and phonon transport are highly encouraging and imperative for the thermoelectric community. Specifically, band engineering and nanostructuring have been demonstrated as effective extrinsic approaches to separately enhance the power factor (PF = α2σ) and reduce the κl, respectively.
Several classes of thermoelectric materials, such as skutterudite [5,6], tellurides [7,8,9,10], half-Heuslers [11,12], and silicides [13,14], have been modified to reach high ZT value. Recently, ternary diamond-like semiconductor of Cu2SnSe3 has emerged as a new potential thermoelectric material due to its relatively high carrier mobility and quite low thermal conductivity. Since the Cu–Se bond network in the Cu2SnSe3 structure forms an electrically conductive framework and Sn orbitals contribute little to the carrier transport, the electrical conductivity of Cu2SnSe3 is allowed to be tuned to optimize the thermoelectric property by partial substitution of the Sn site. Some valuable work has been done on Cu2SnSe3 compound by doping, substitution, or solid solution [15,16]. The In-doped Cu2InxSn1-xSe3 was studied by Chen et al. and a maximum ZT of around 1.2 was obtained at 850 K for x = 0.1 [17]. Similarly, gallium doping was found to be an effective way to increase the ZT in Ga-doped Cu2SnSe3 compounds by Shi et al., and the maximum ZT increased to 0.43 at 700 K [18]. Moreover, isoelectronic alloying with Ge at the Sn site was confirmed to be effective in enhancing the ZT value by Morelli et al. [19]. Besides substitution, the introduction of a nanostructure phase into the matrix is also an attractive approach to enhance the dimensionless figure of merit of thermoelectric materials. So far, there are few studies about nanostructured Cu2SnSe3 matrix composites due to the unapparent enhancement of ZT resulting from the second nanostructured phase. Although a remarkable decrease in the lattice conductivity can be achieved by phonon scattering at nanophase/matrix interfaces, the electrical properties of thermoelectric composites also decrease, leading to a marginal change of the overall ZT value. Moreover, the selection of nanophase and the control of the microstructure of thermoelectric composites are also important for the enhancement of ZT value [20,21,22].
Graphene has high electrical and thermal properties due to its unique 2D structure. The carrier mobility, electrical conductivity, and thermal conductivity of graphene is 2 × 105 cm2·V−1·s−1, 1 × 10⁶ S/m, and 5 × 10³ Wm−1·K−1 at room temperature, respectively. Meanwhile, the carrier of graphene with zero bandgap can continuously vary from electron to hole, which can benefit the electrical transport in the p–n interfacial region. Wang et al. even confirmed that the introduction of 0.2 vol % graphene enhanced the ZT value of Bi2Te3 material [23]. Kim et al. confirmed that the peak ZT value for the 0.05 wt % graphene/Bi2Te2.7Se0.3 composite increased to 0.8 at 400 K, which is 23% larger than that of the pristine sample [24]. Chen et al. also showed that an improved ZT value of 0.4 in graphene/CuInTe2 composites was obtained due to a lower κl [25]. In this contribution, it is highly possible that incorporating graphene nanosheets into Cu2SnSe3 material will also lead to reduced κl, which perhaps will further improve the thermoelectric properties of graphene/Cu2SnSe3 composites.
In the present work, graphene nanosheets were incorporated into the Cu2SnSe3 matrix by ball-milling method, and the graphene/Cu2SnSe3 thermoelectric composites were fabricated by spark plasma sintering (SPS). The transport properties of graphene/Cu2SnSe3 composites were studied with the aim of enhancing thermoelectric performance of Cu2SnSe3.

2. Experimental Procedures

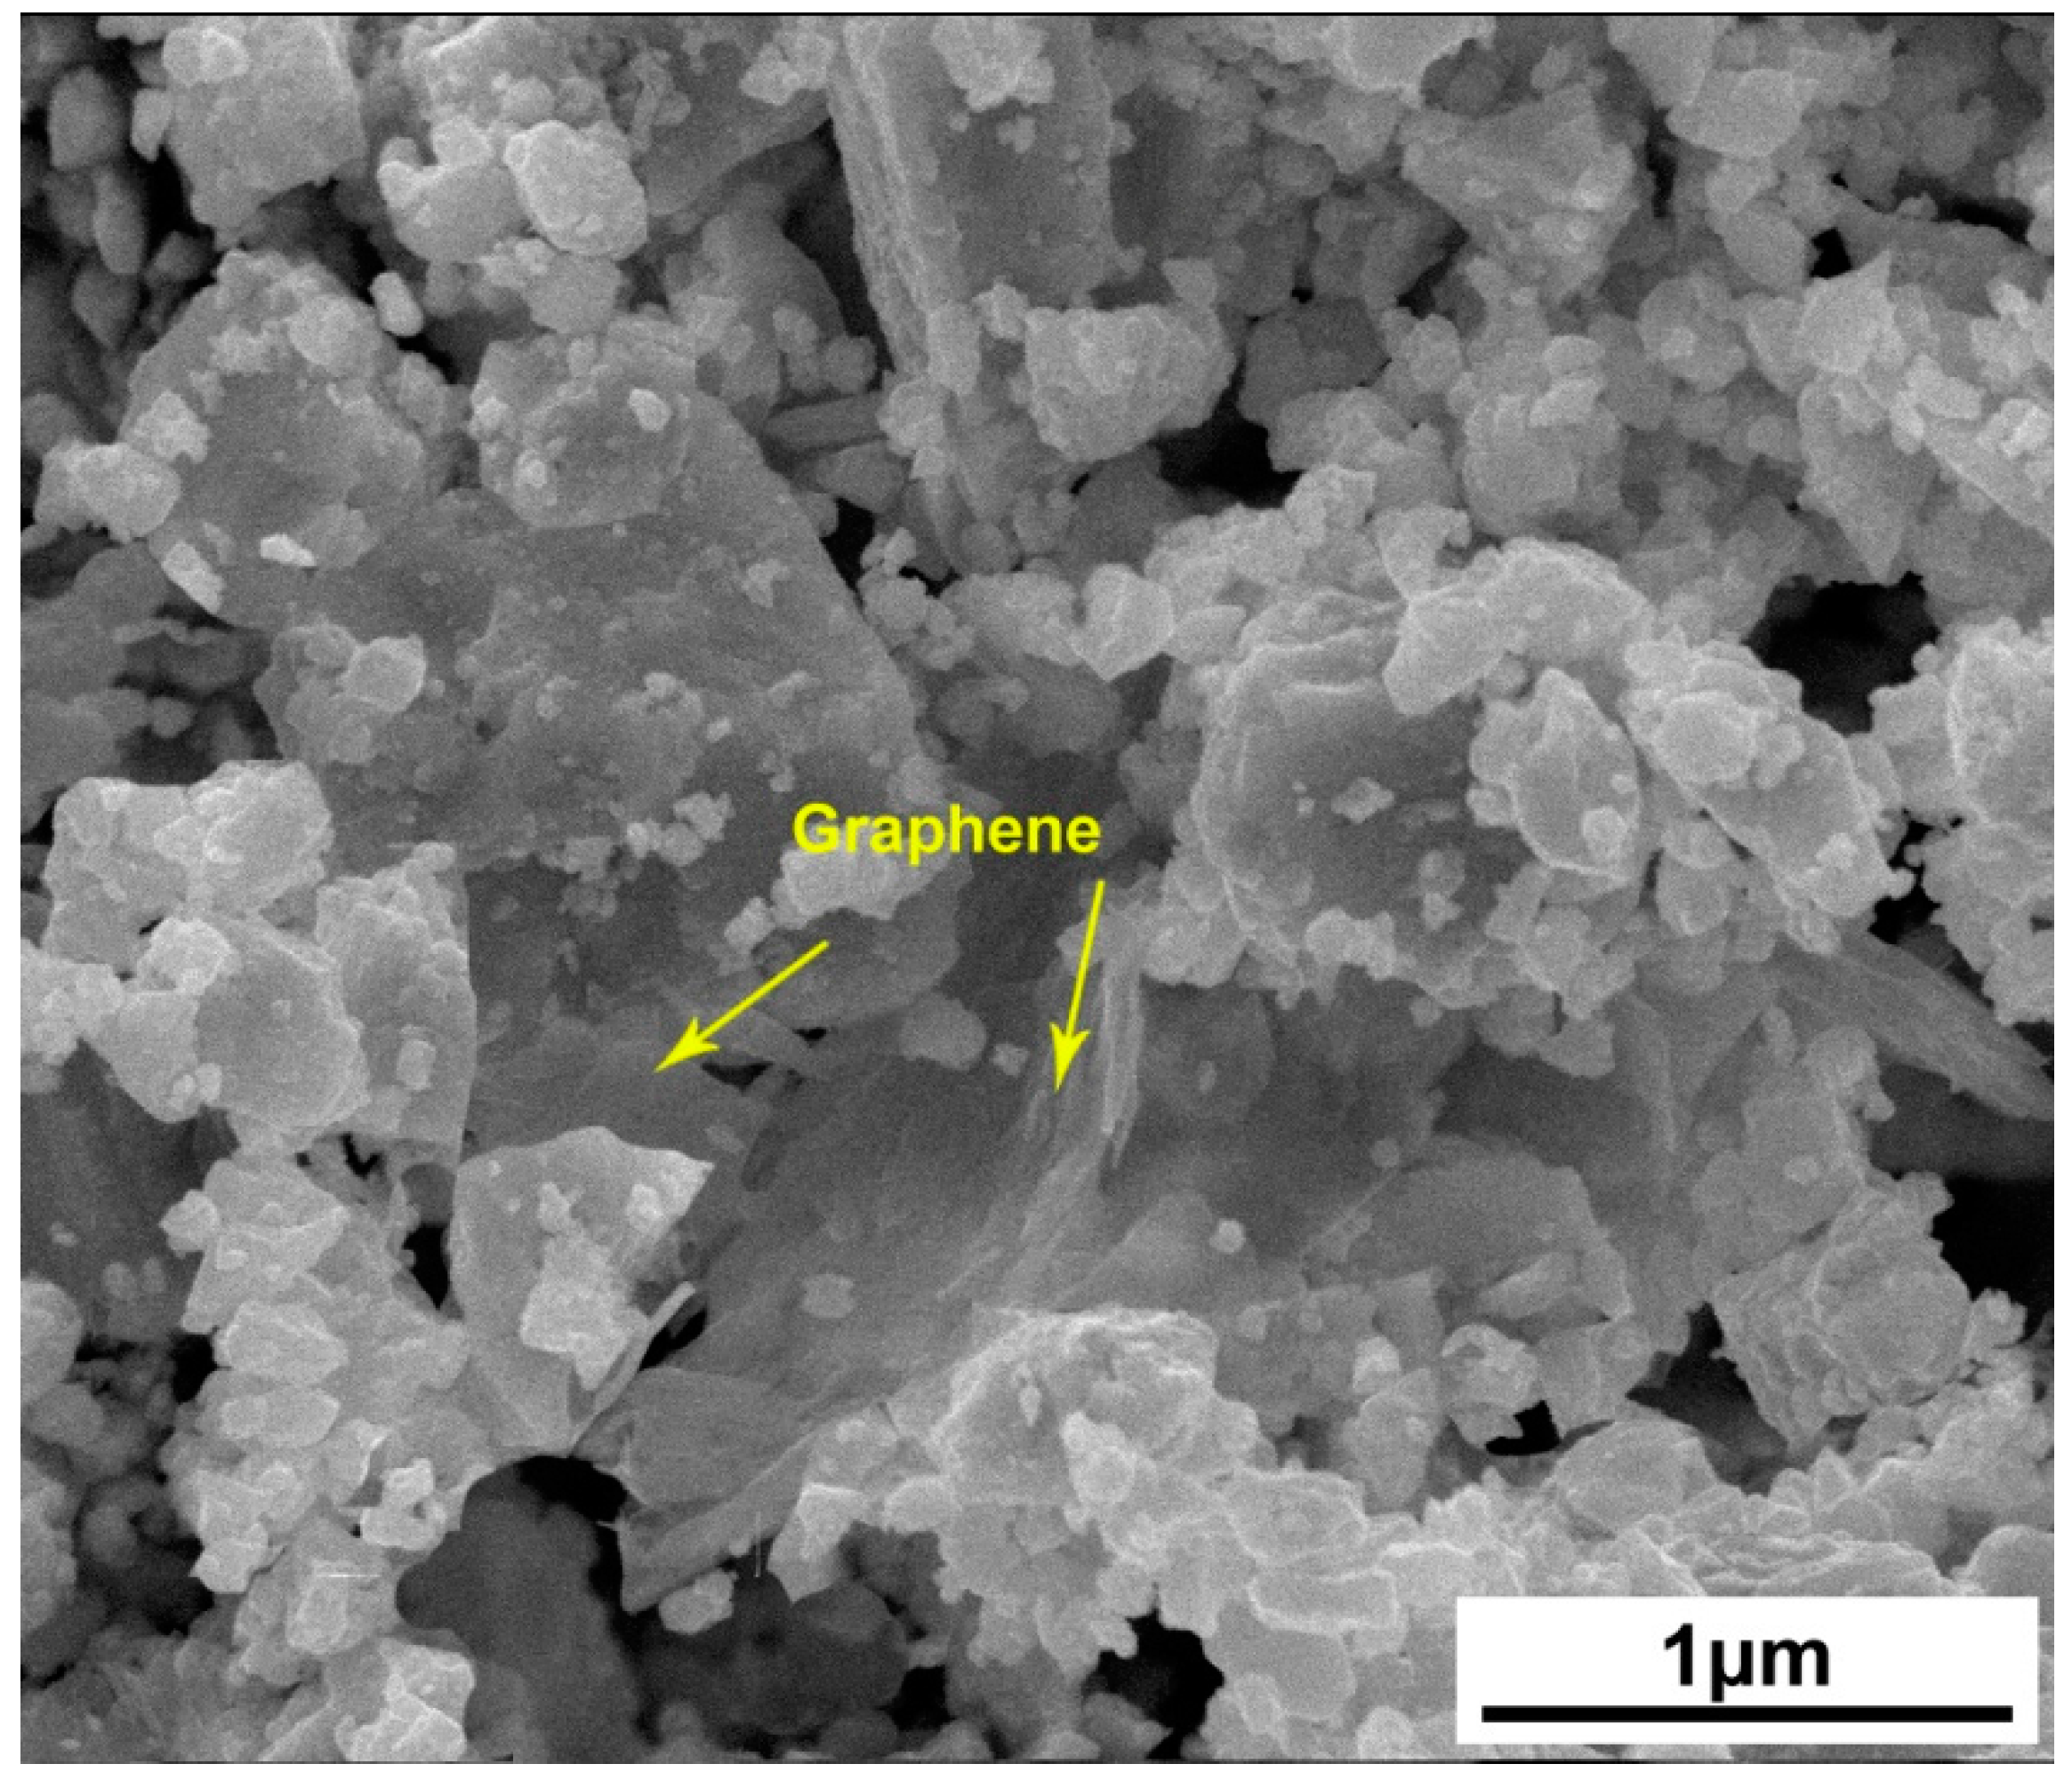
Cu2SnSe3 was synthesized by the reacting stoichiometric copper (powder, 99.96%), tin (powder, 99.999%), and selenium (shot, 99.999%) in evacuated fused-silica ampoules at 1173 K for 12 h, then slowly cooling the melt down to 873 K for 24 h, followed by annealing at this temperature for 2 days. Finally, the obtained ingots were reground into fine powder. Commercially available graphene powder (single layer, average diameter: 2 μm, thickness: 0.8 nm; XFNANO, Nanjing, China) was chosen as the second nanophase, just as shown in Figure 1. The graphene powder was incorporated into the Cu2SnSe3 powder at volume fractions of 0.25, 0.50, 0.75, and 1.0 vol %, respectively. Then, the graphene-added Cu2SnSe3 powders were mechanically milled with a planetary ball-milling machine. The ball-to-powder ratio was 5:1, and the ball-milling process was carried out in Ar atmosphere for 240 min at 150 rpm. The SPS process was used to consolidate the as-milled powders at 860 K for 8 min in a vacuum of 0.1 Pa under a pressure of 50 MPa.
The constituent phases of the samples were characterized by X-ray diffractometry on a Rigaku Rint2000 powder diffractometer equipped with Cu Kα radiation. The microstructure of all graphene/Cu2SnSe3 samples was observed using field-emission scanning electron microscopy (FESEM) and high-resolution transmission electron microscopy (HRTEM, JEM2100F, JEOL, Tokyo, Japan). The thermal diffusivity (λ) of all samples was measured on the disk-shaped specimen by laser flash technique using a Netzsch LFA427 (Netzsch, Berlin, German) setup in a flowing Ar atmosphere with temperature ranging from 300 to 700 K. The thermal conductivity was then calculated as κ = dλCp, where d is the density measured by Archimedes method, and Cp is the Dulong–Petit approximation for the specific heat capacity. A bar-shaped specimen of 2 × 2 × 10 mm3 was cut with a diamond saw from the sample for the measurement of electrical transport properties. Both electrical conductivity and Seebeck coefficient were determined simultaneously using ZEM-3 equipment (ULVAC-RIKO, Tokyo, Japan) with temperature ranging from 300 to 700 K in Ar atmosphere. The Hall coefficients (RH) were measured by van der Pauw’s method in a vacuum of 0.1 Pa under a magnetic field of 2 T. The carrier mobility (μH) and carrier concentration (p) were calculated through the formulae of μH = RHσ and pH = 1/(RHe) based on the assumption of single-band model, where e is the electron charge. The experimental uncertainty on the electrical conductivity, Seebeck coefficient, thermal conductivity, and Hall coefficient are estimated to be 5%, 5%, 8%, and 4%, respectively.

3. Results and Discussion

3.1. Phase Analysis and Microstructure

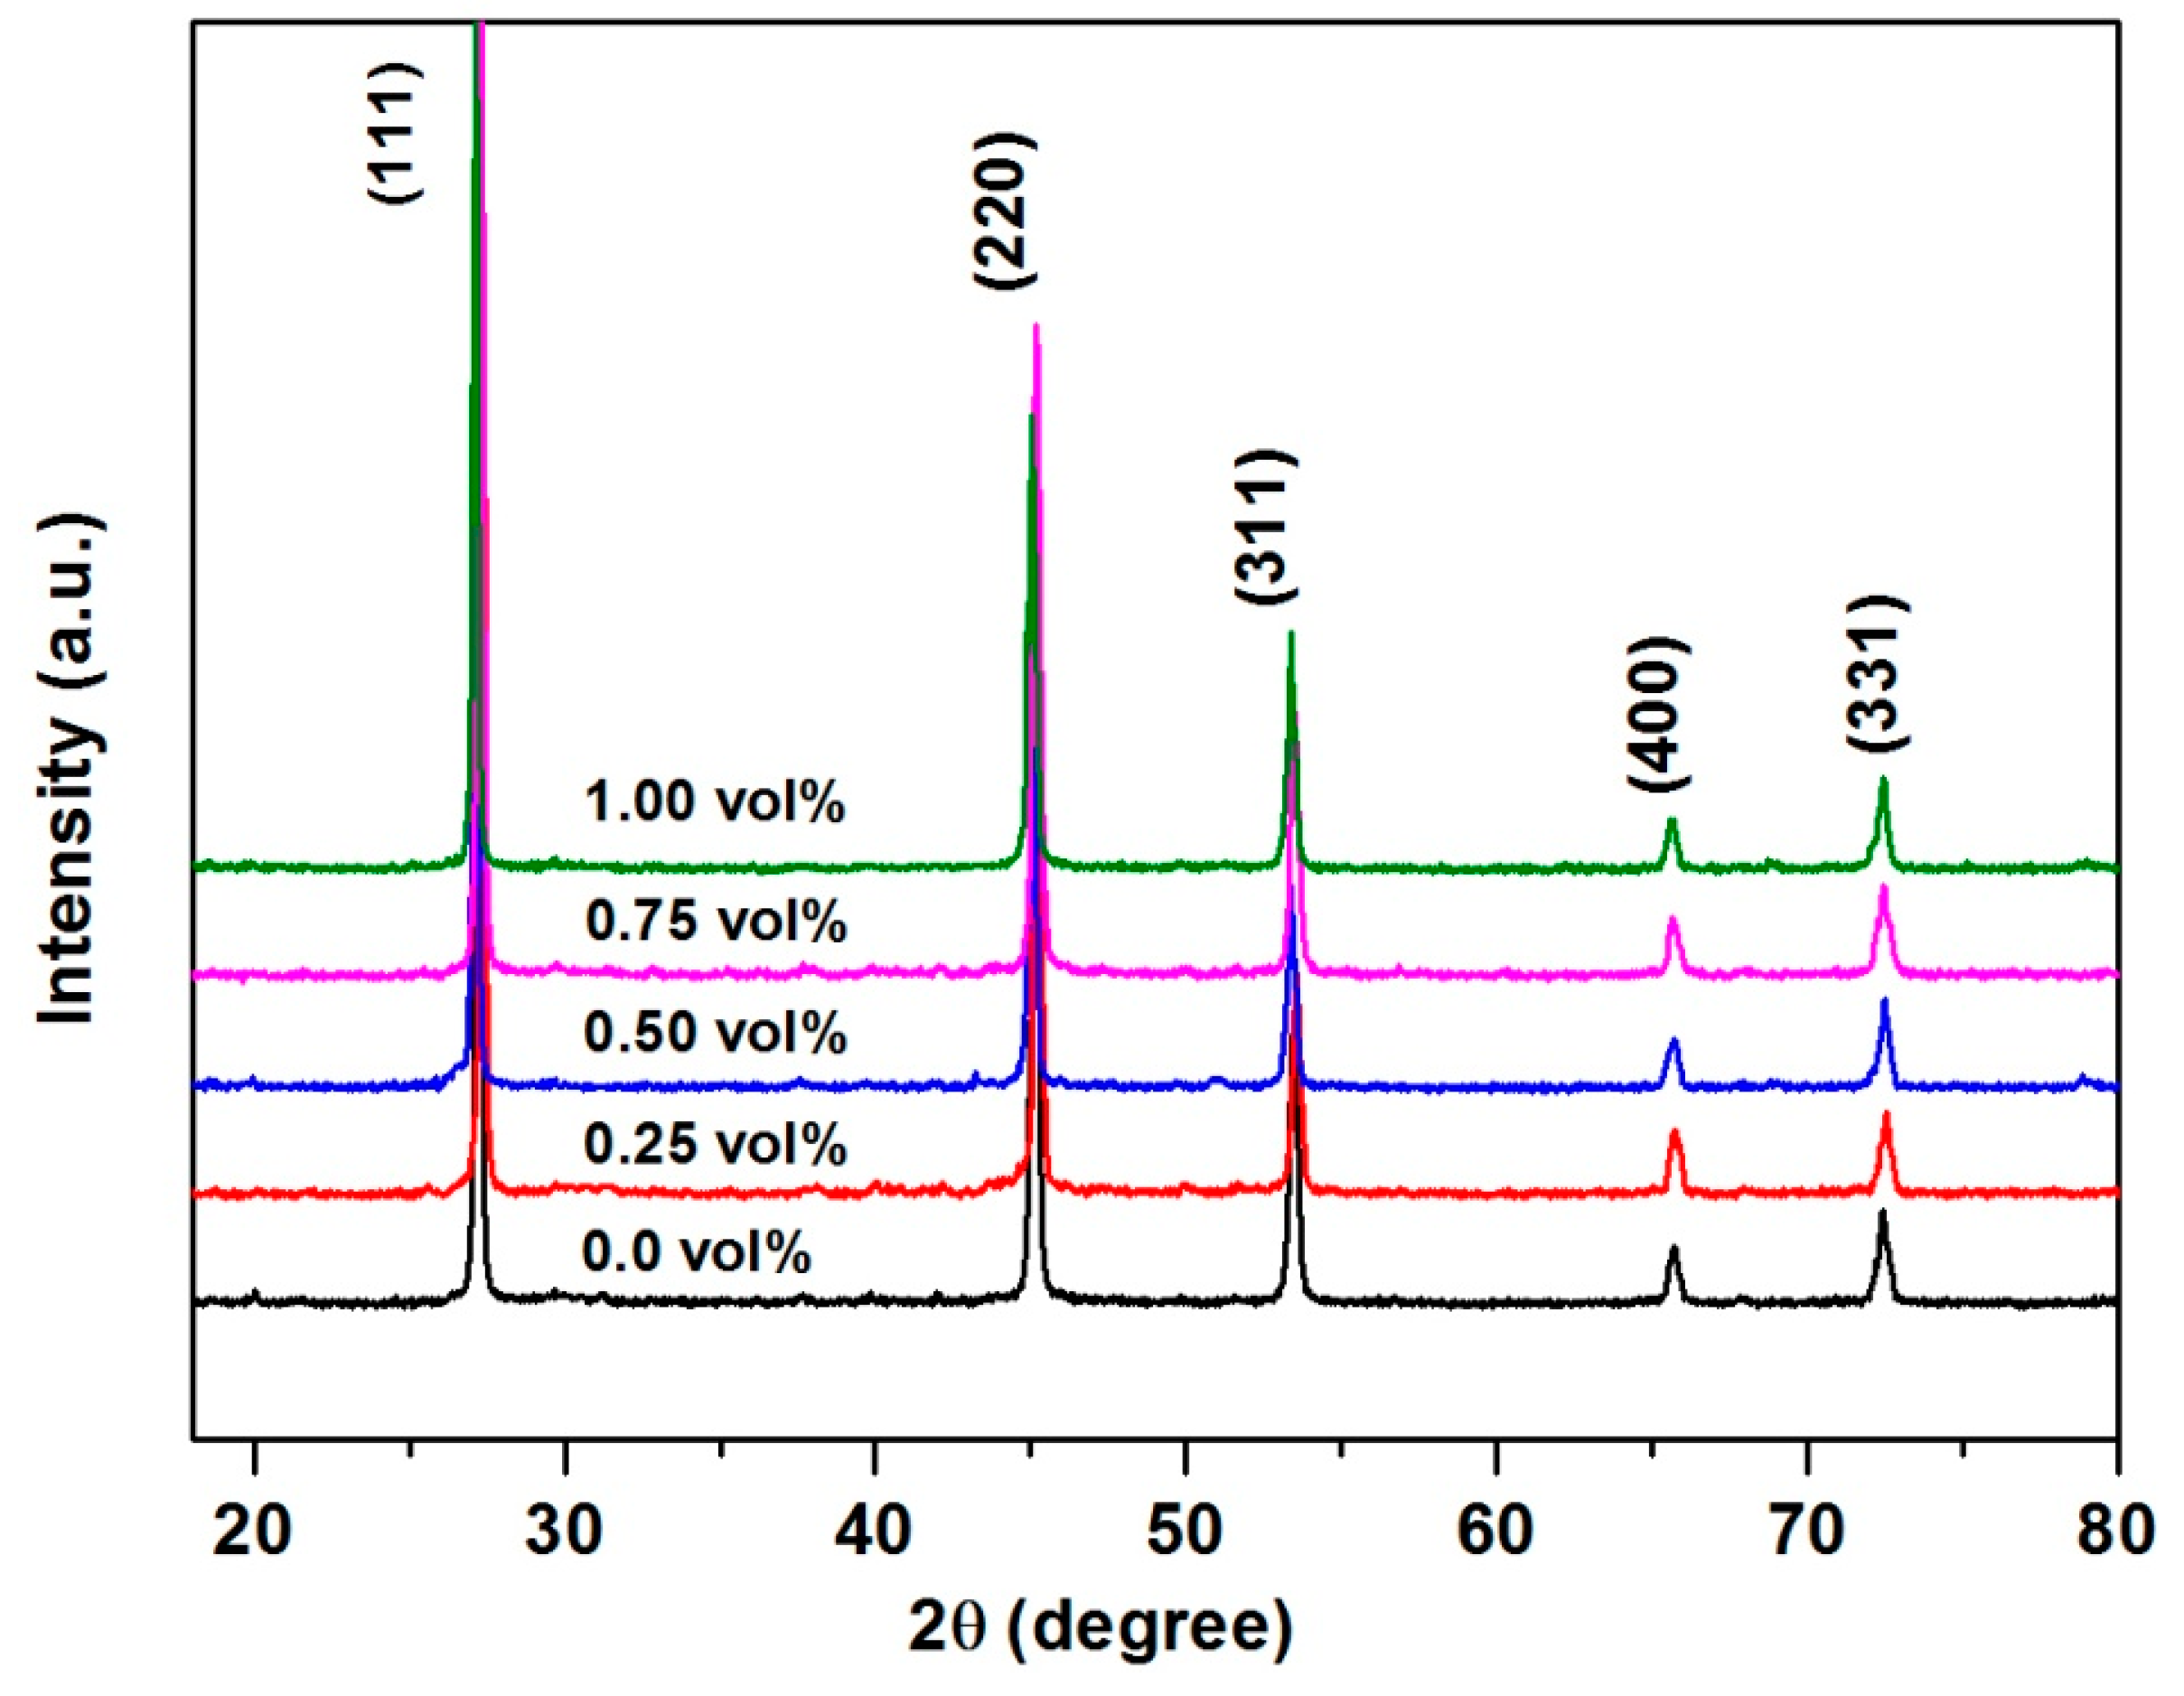
Figure 2 displays the SEM image of the 1.0 vol % graphene-added Cu2SnSe3 powder after ball milling for 240 min at 150 rpm. It can be observed that the average diameter of graphene nanosheets in the mixed Cu2SnSe3 powder was about 1 μm. Figure 3 is the X-ray diffraction patterns of sintered graphene/Cu2SnSe3 composites. The diffraction peaks in Figure 3 are identified as JCPDS card 65-4145 (cubic Cu2SnSe3). No diffraction peak of graphene is found in the XRD results as the fraction of graphene in the composites is very low. All graphene/Cu2SnSe3 composites show the same XRD patterns as the pristine Cu2SnSe3.
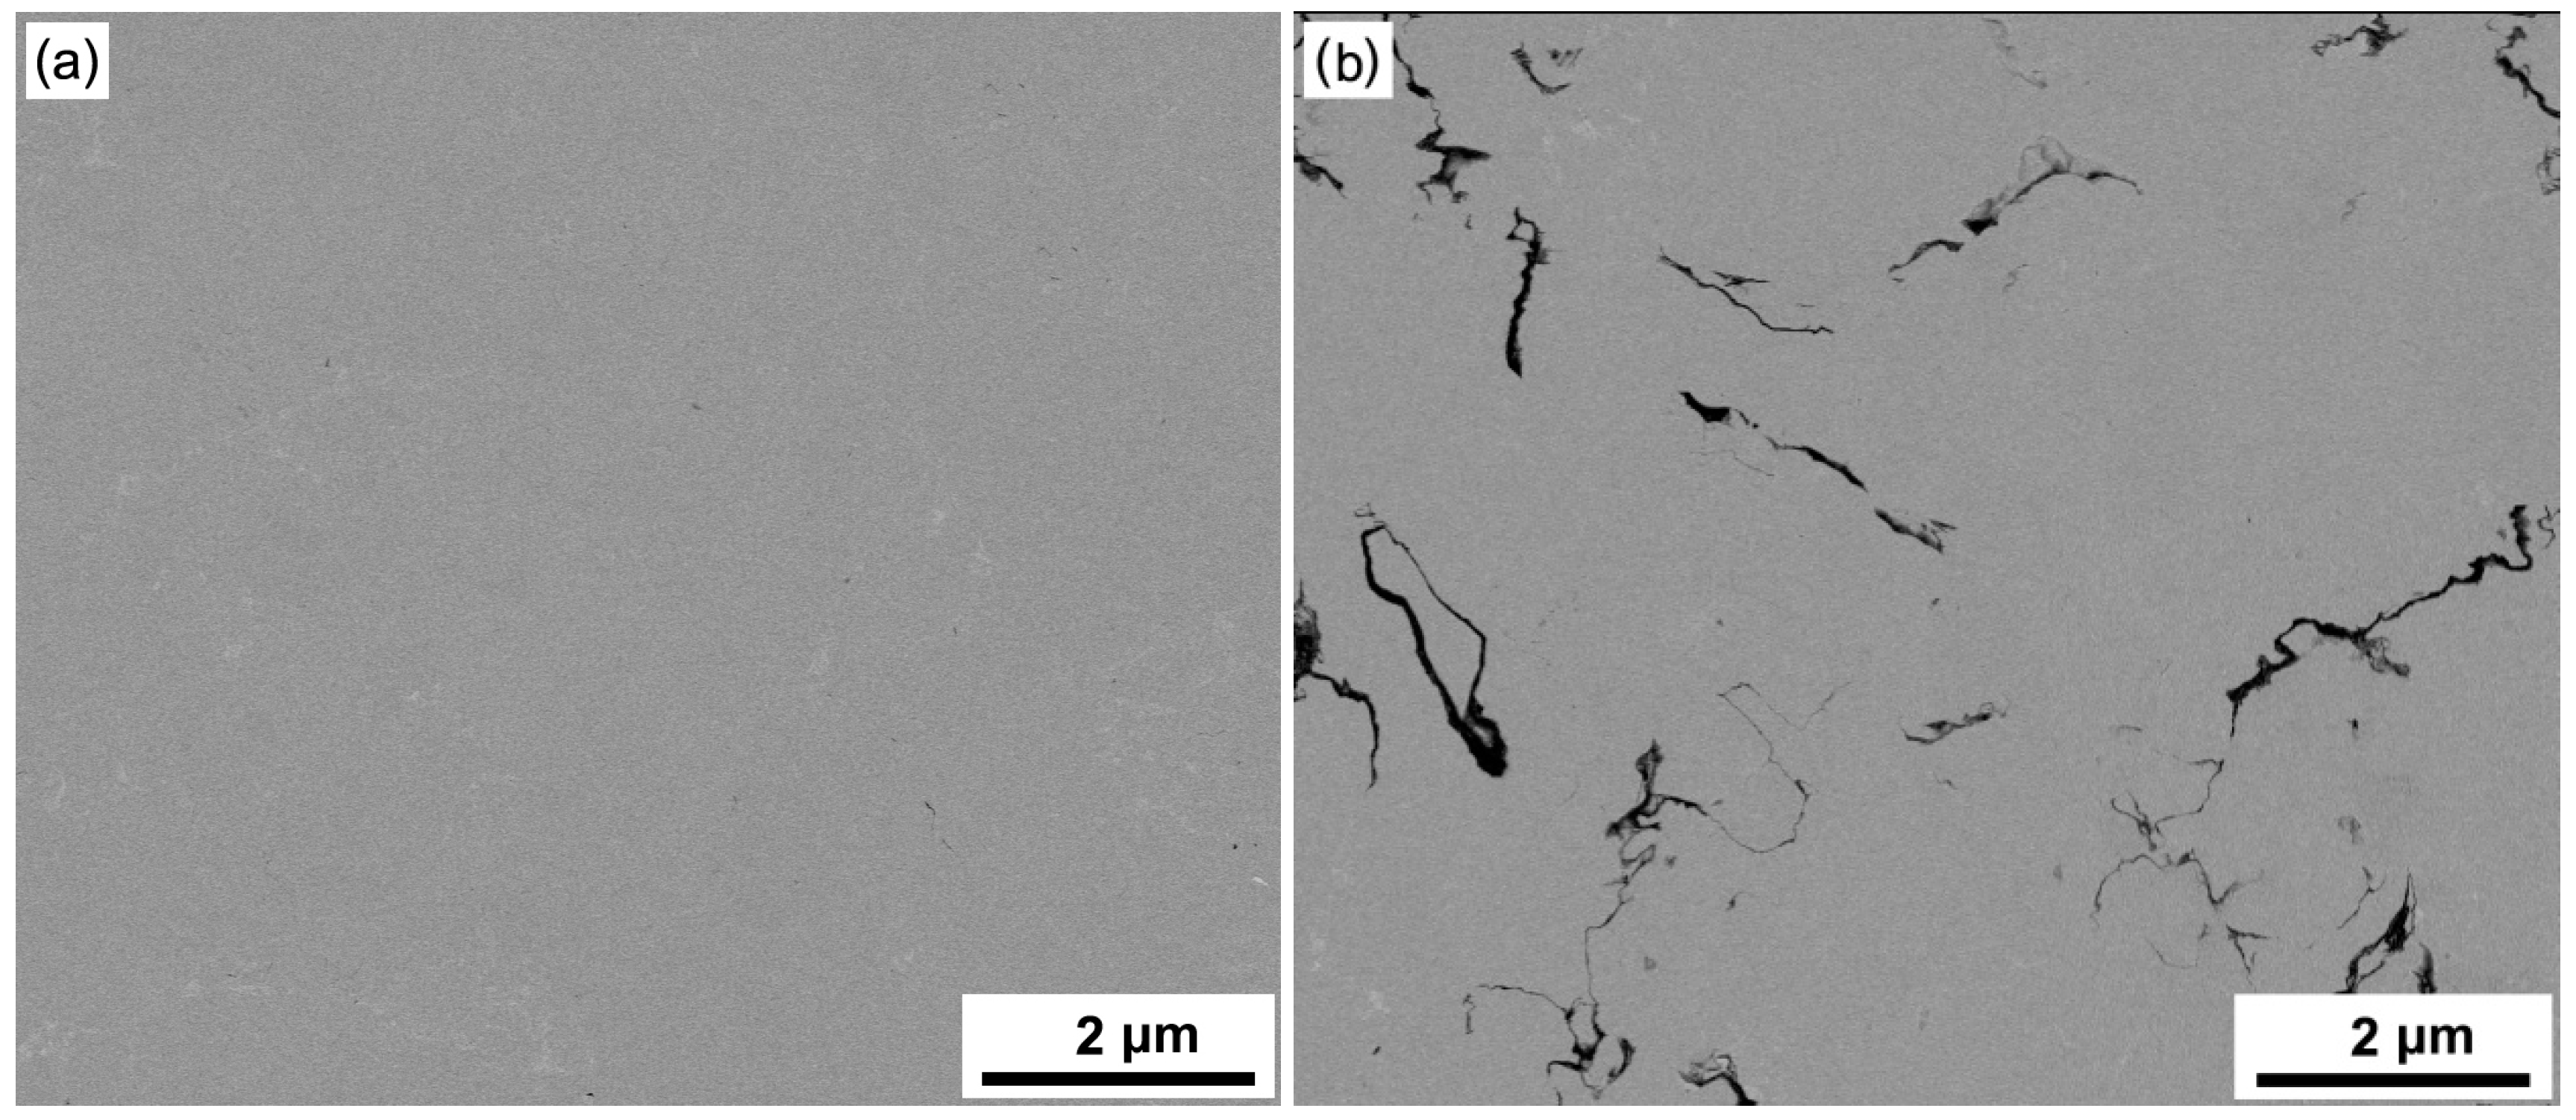
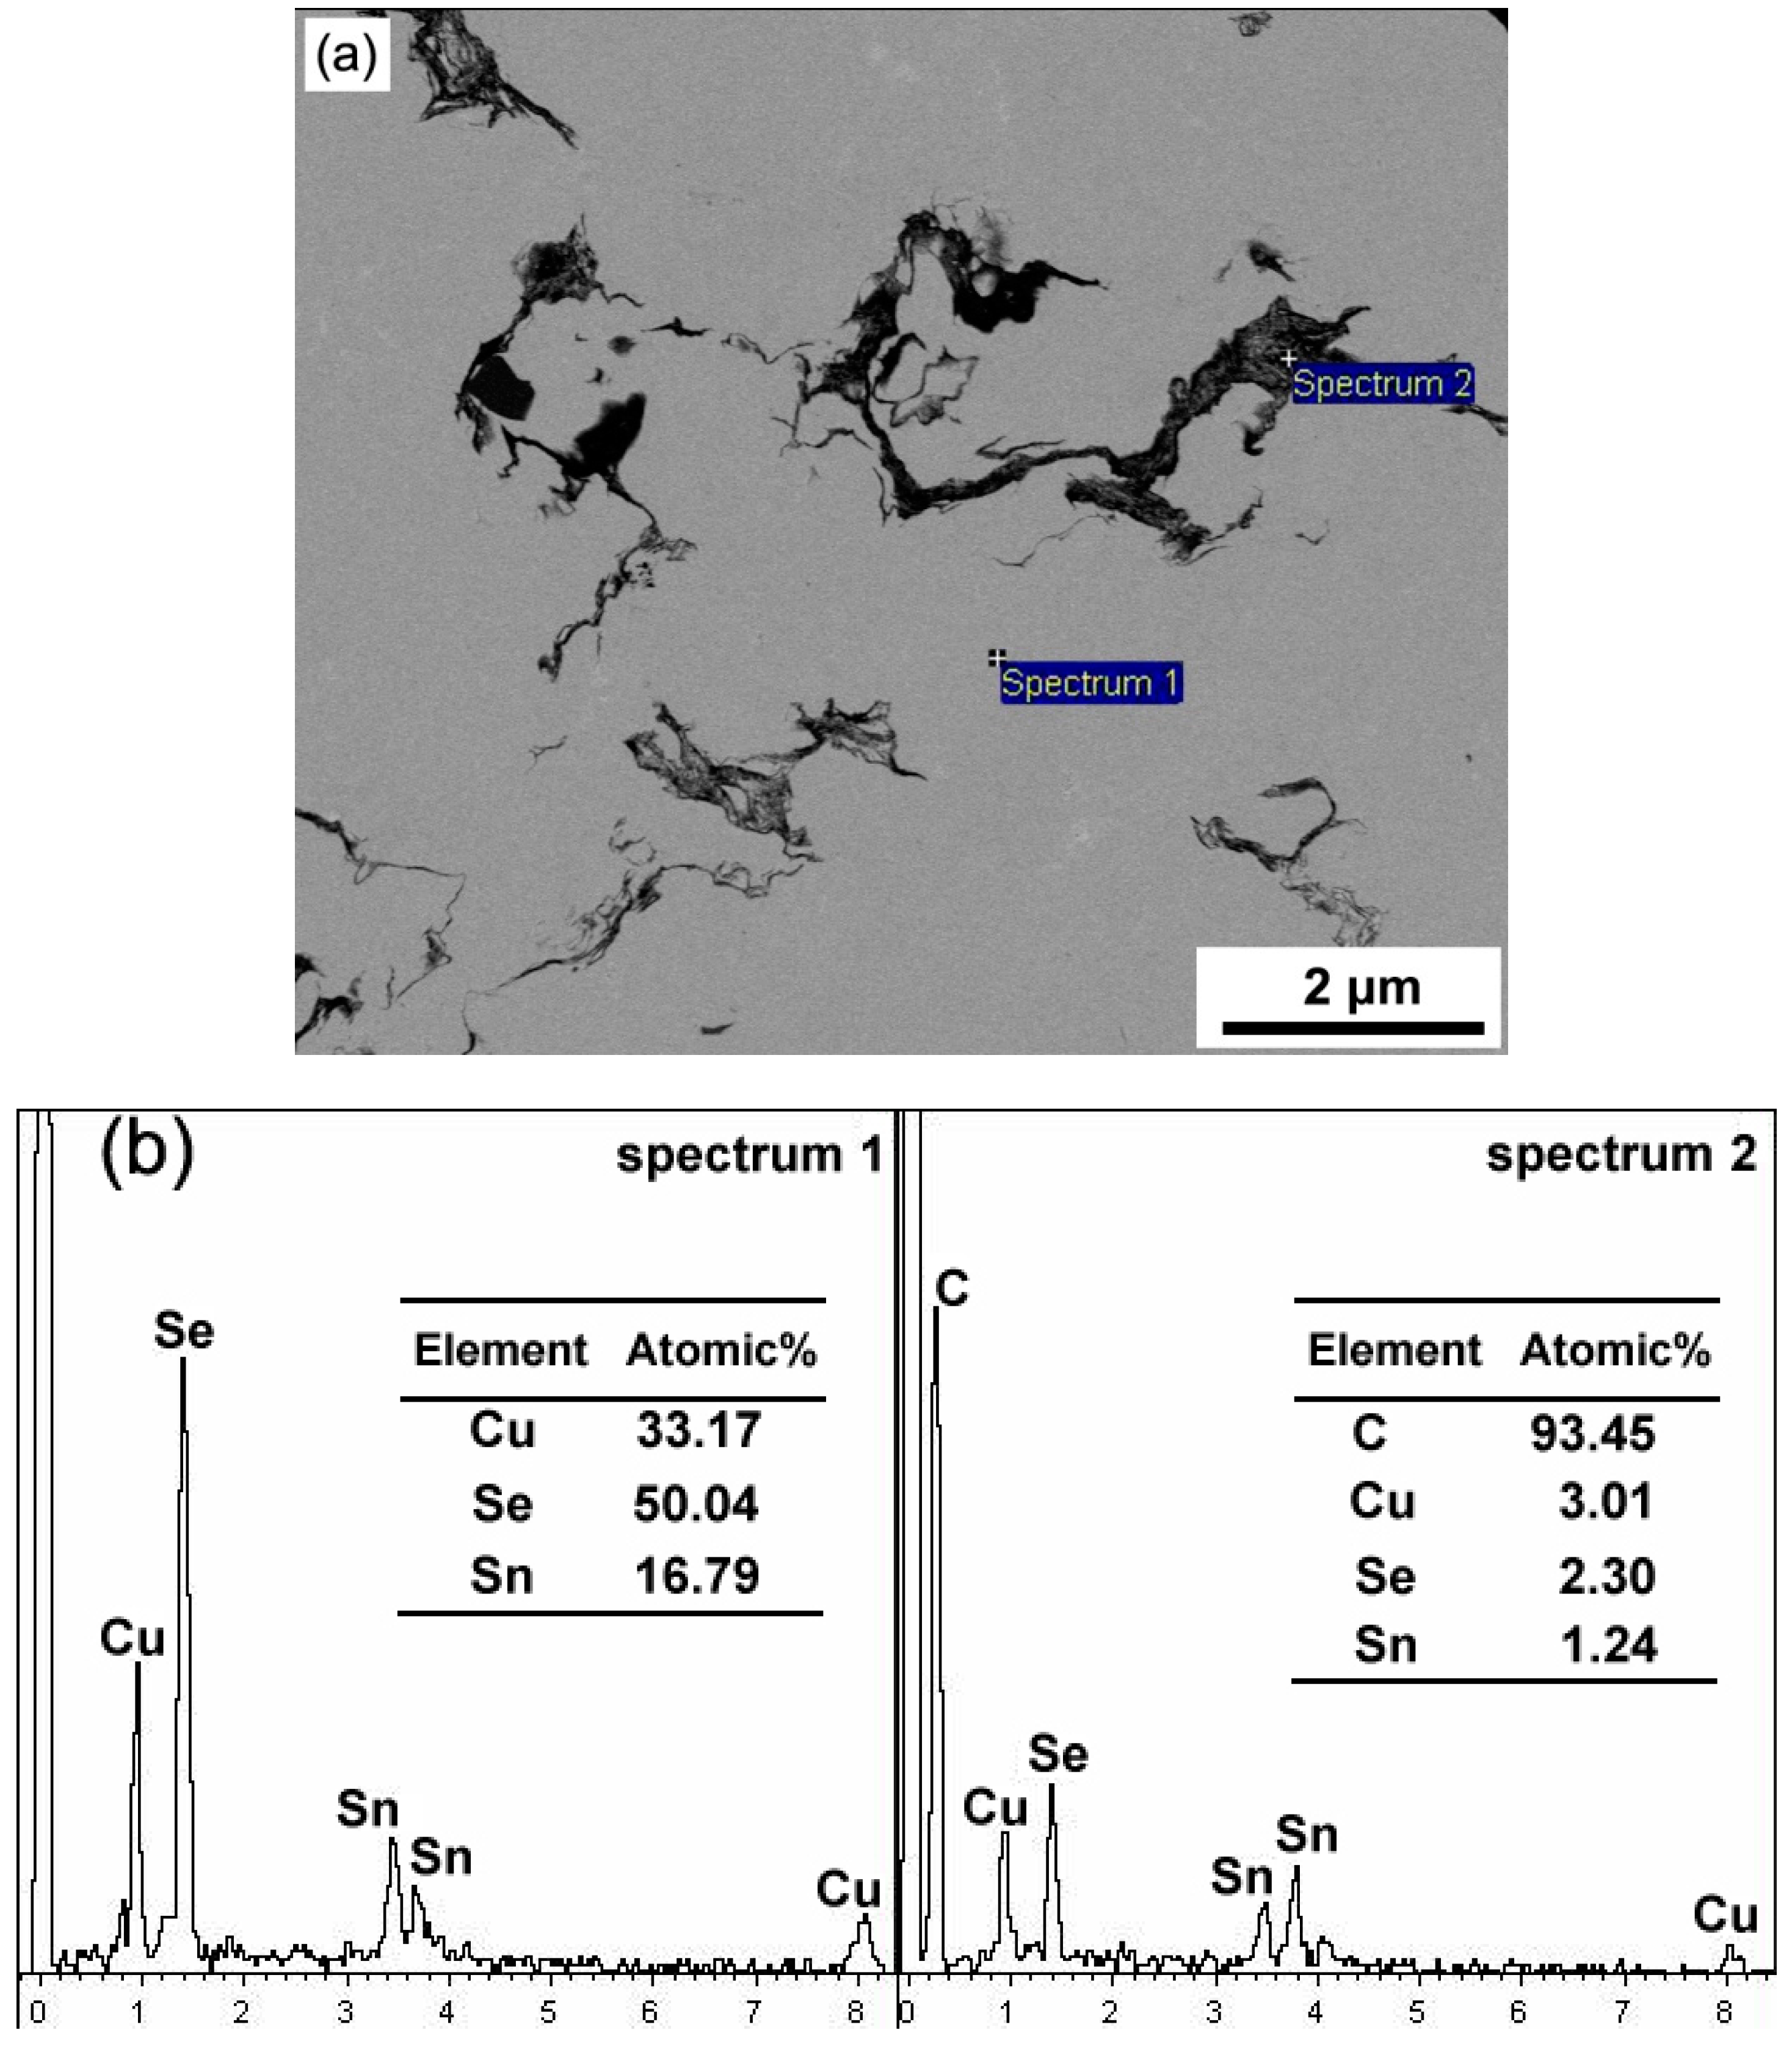
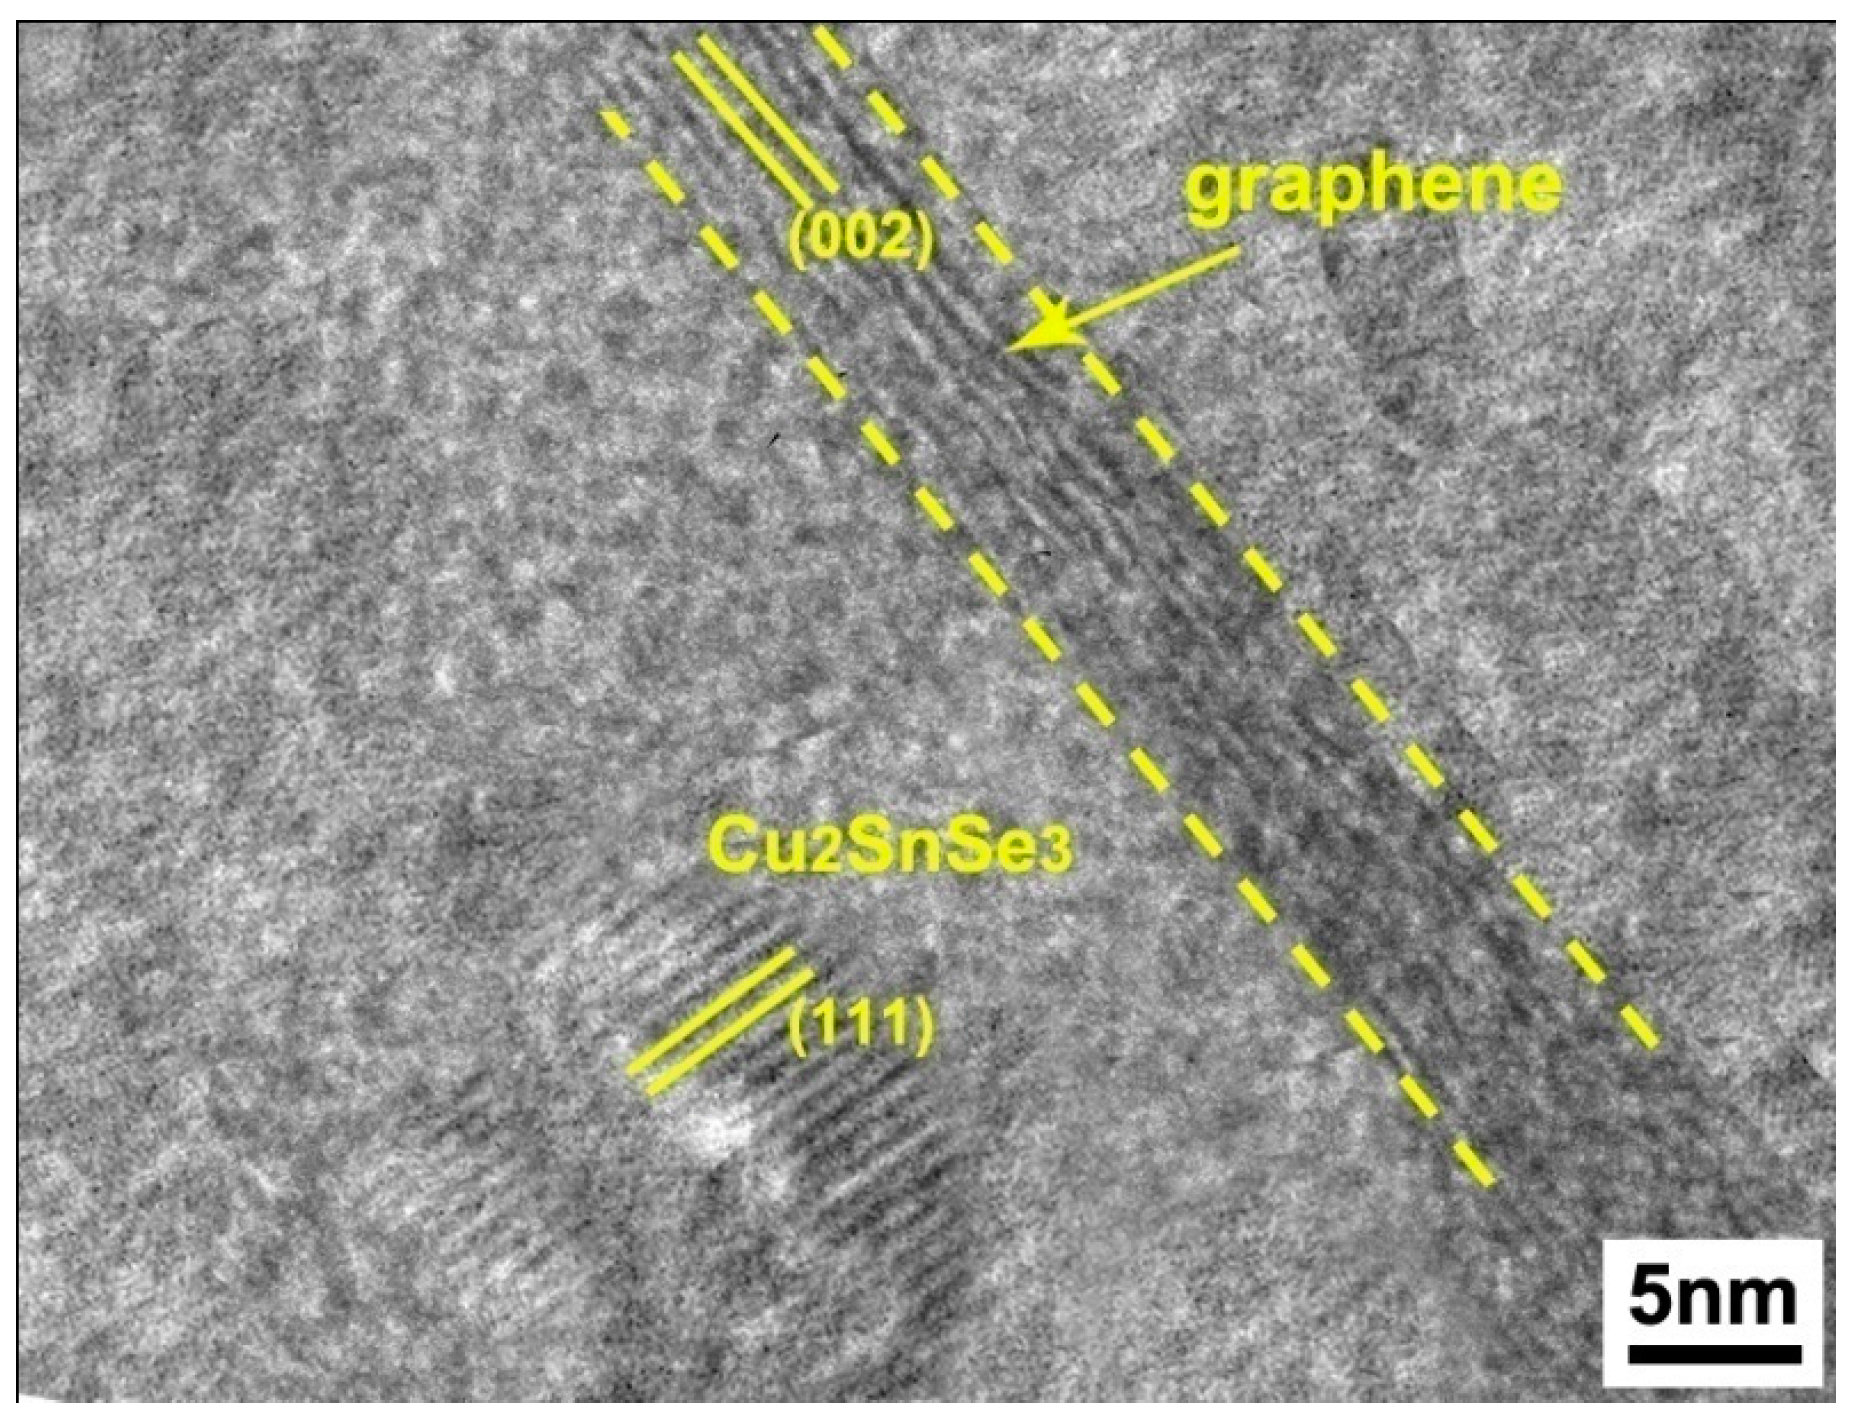
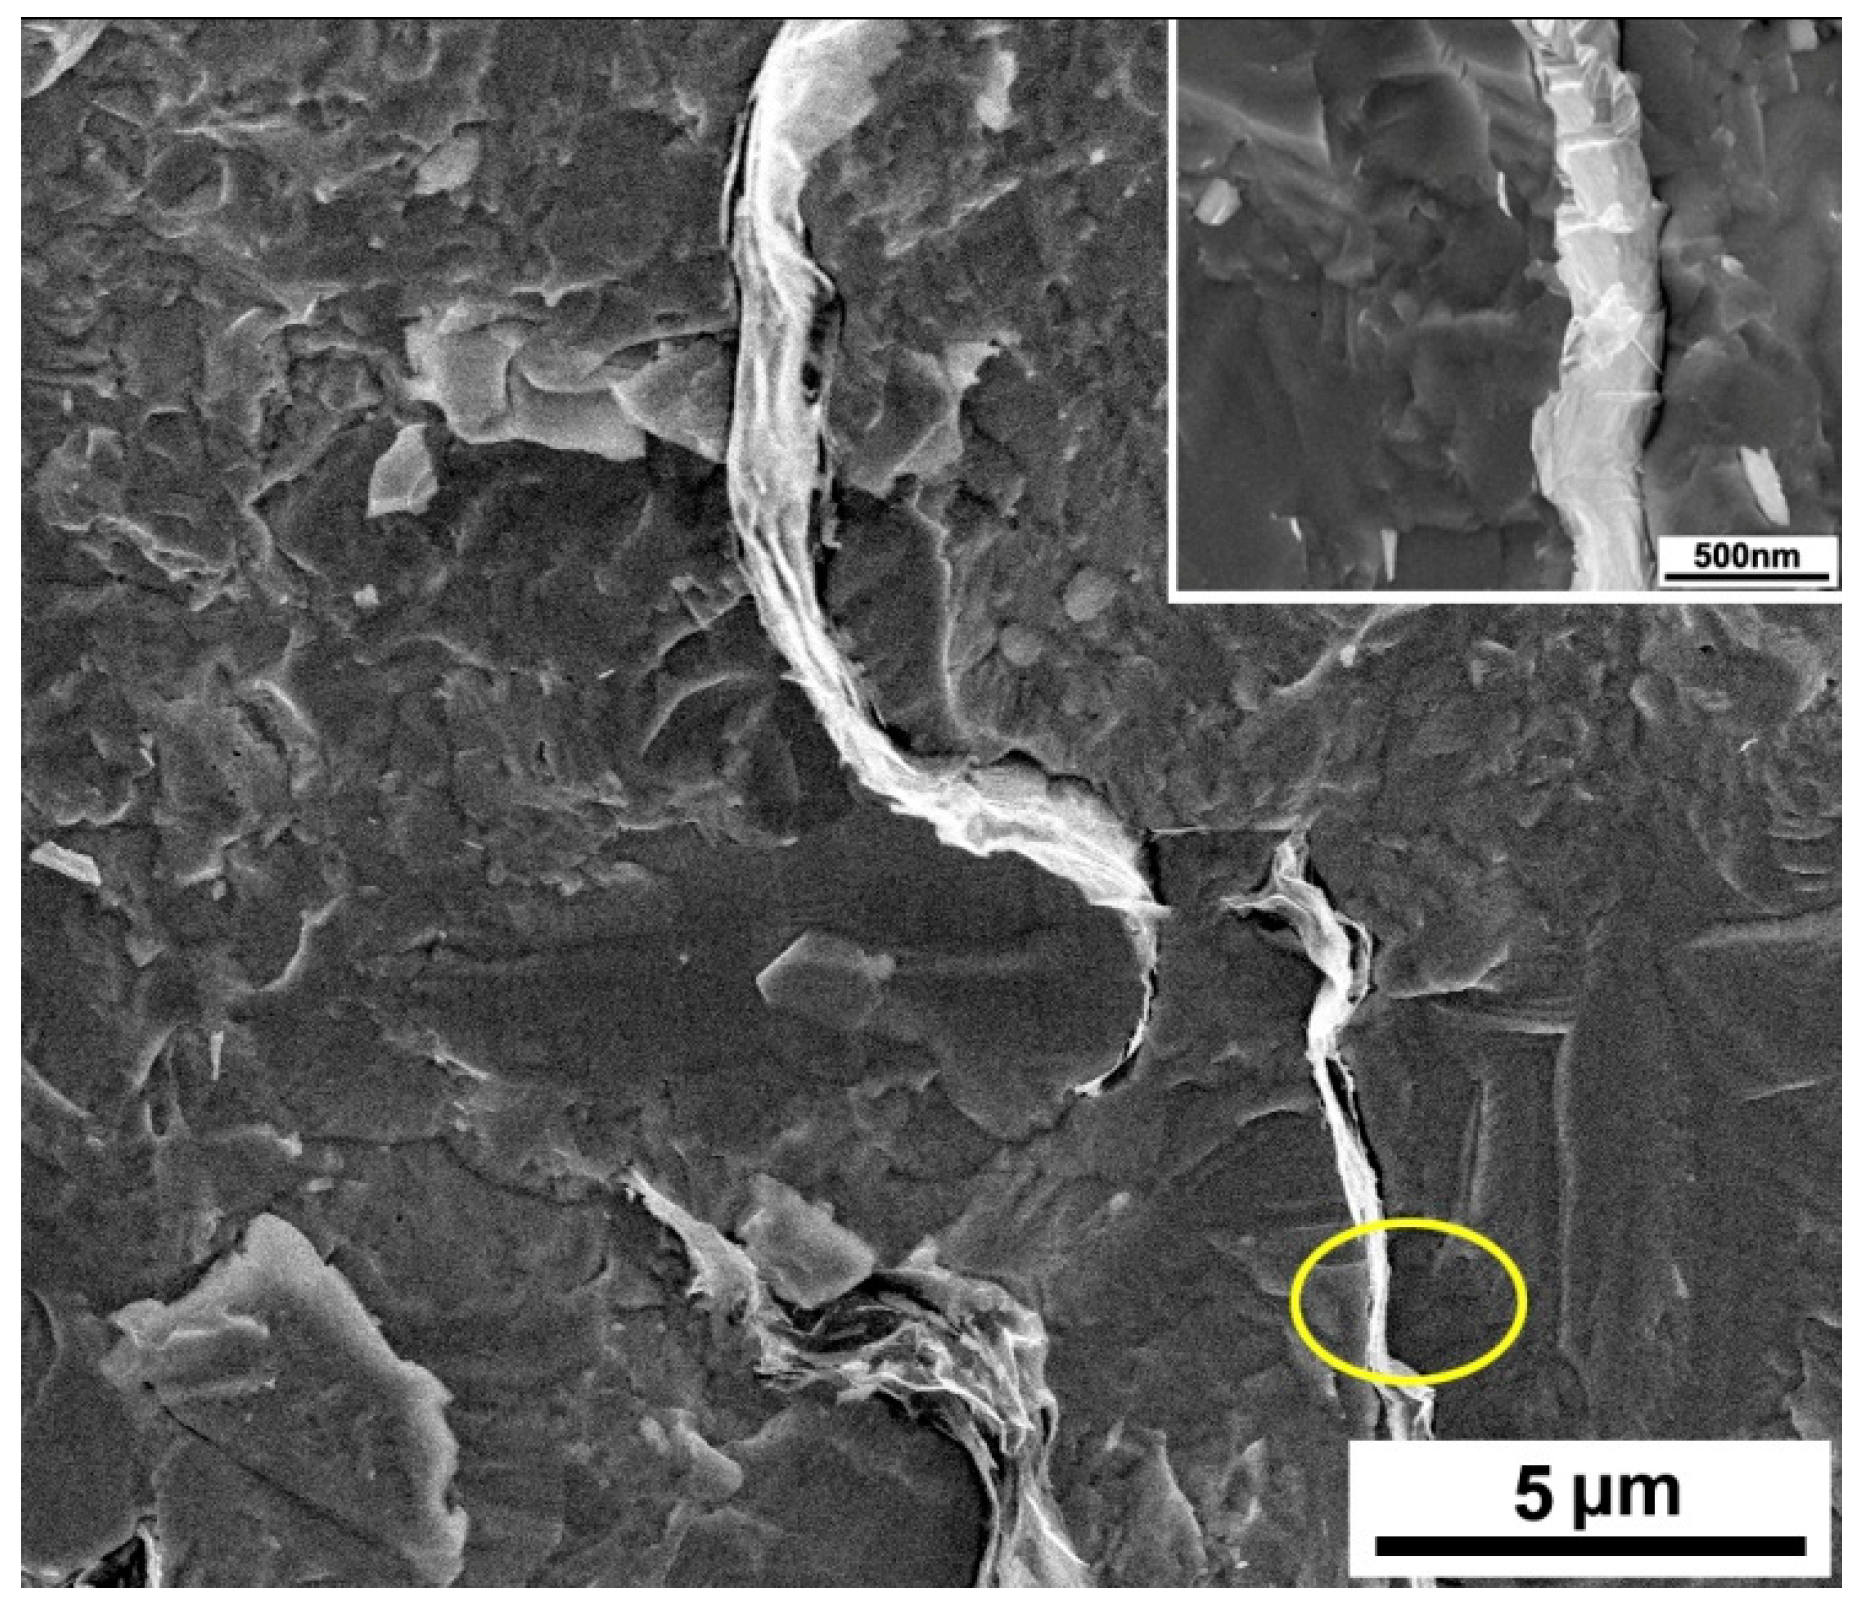
The microstructure of the sintered pristine Cu2SnSe3 and 0.75 vol % graphene/Cu2SnSe3 sample is illustrated in Figure 4a,b, respectively. It is evident that the graphene nanosheets distributed uniformly in the Cu2SnSe3 matrix. Meanwhile, some graphene nanosheets tended to form thick aggregations and the average length of aggregations was about 3 μm. A similar phenomenon was also observed by Zhao et al. in the graphene/CoSb3 nanocomposite [26]. The results of energy dispersive X-ray spectroscopy (EDS) for graphene/Cu2SnSe3 sample identify that the matrix consisted of 33.17 atom % copper, 16.79 atom % tin, and 50.04 atom % selenium, indicating the Cu2SnSe3 phase, just as shown in Figure 5. The black phase in Figure 5a only contains the C element, corresponding to the graphene phase. It can be observed from HRTEM in Figure 6 that most of the graphene nanosheets is of the multilayered form (<10 layers), which is consistent with SEM results. The fringe spacing of 0.81 nm in the lattice image corresponds to the interplanar distance of the (111) plane of Cu2SnSe3. Figure 7 shows the FESEM image of the fractured surface of the sintered graphene/Cu2SnSe3 sample. The graphene nanosheets are homogeneously embedded in the Cu2SnSe3 matrix. According to the classic band theory [27,28], nanostructures distributed in the material can result in strain fields, then lead to a change in the energy-band structure of thermoelectric material. At the same time, nanophases can greatly influence the phonon and electronic transport of thermoelectric materials.

3.2. Electrical Properties

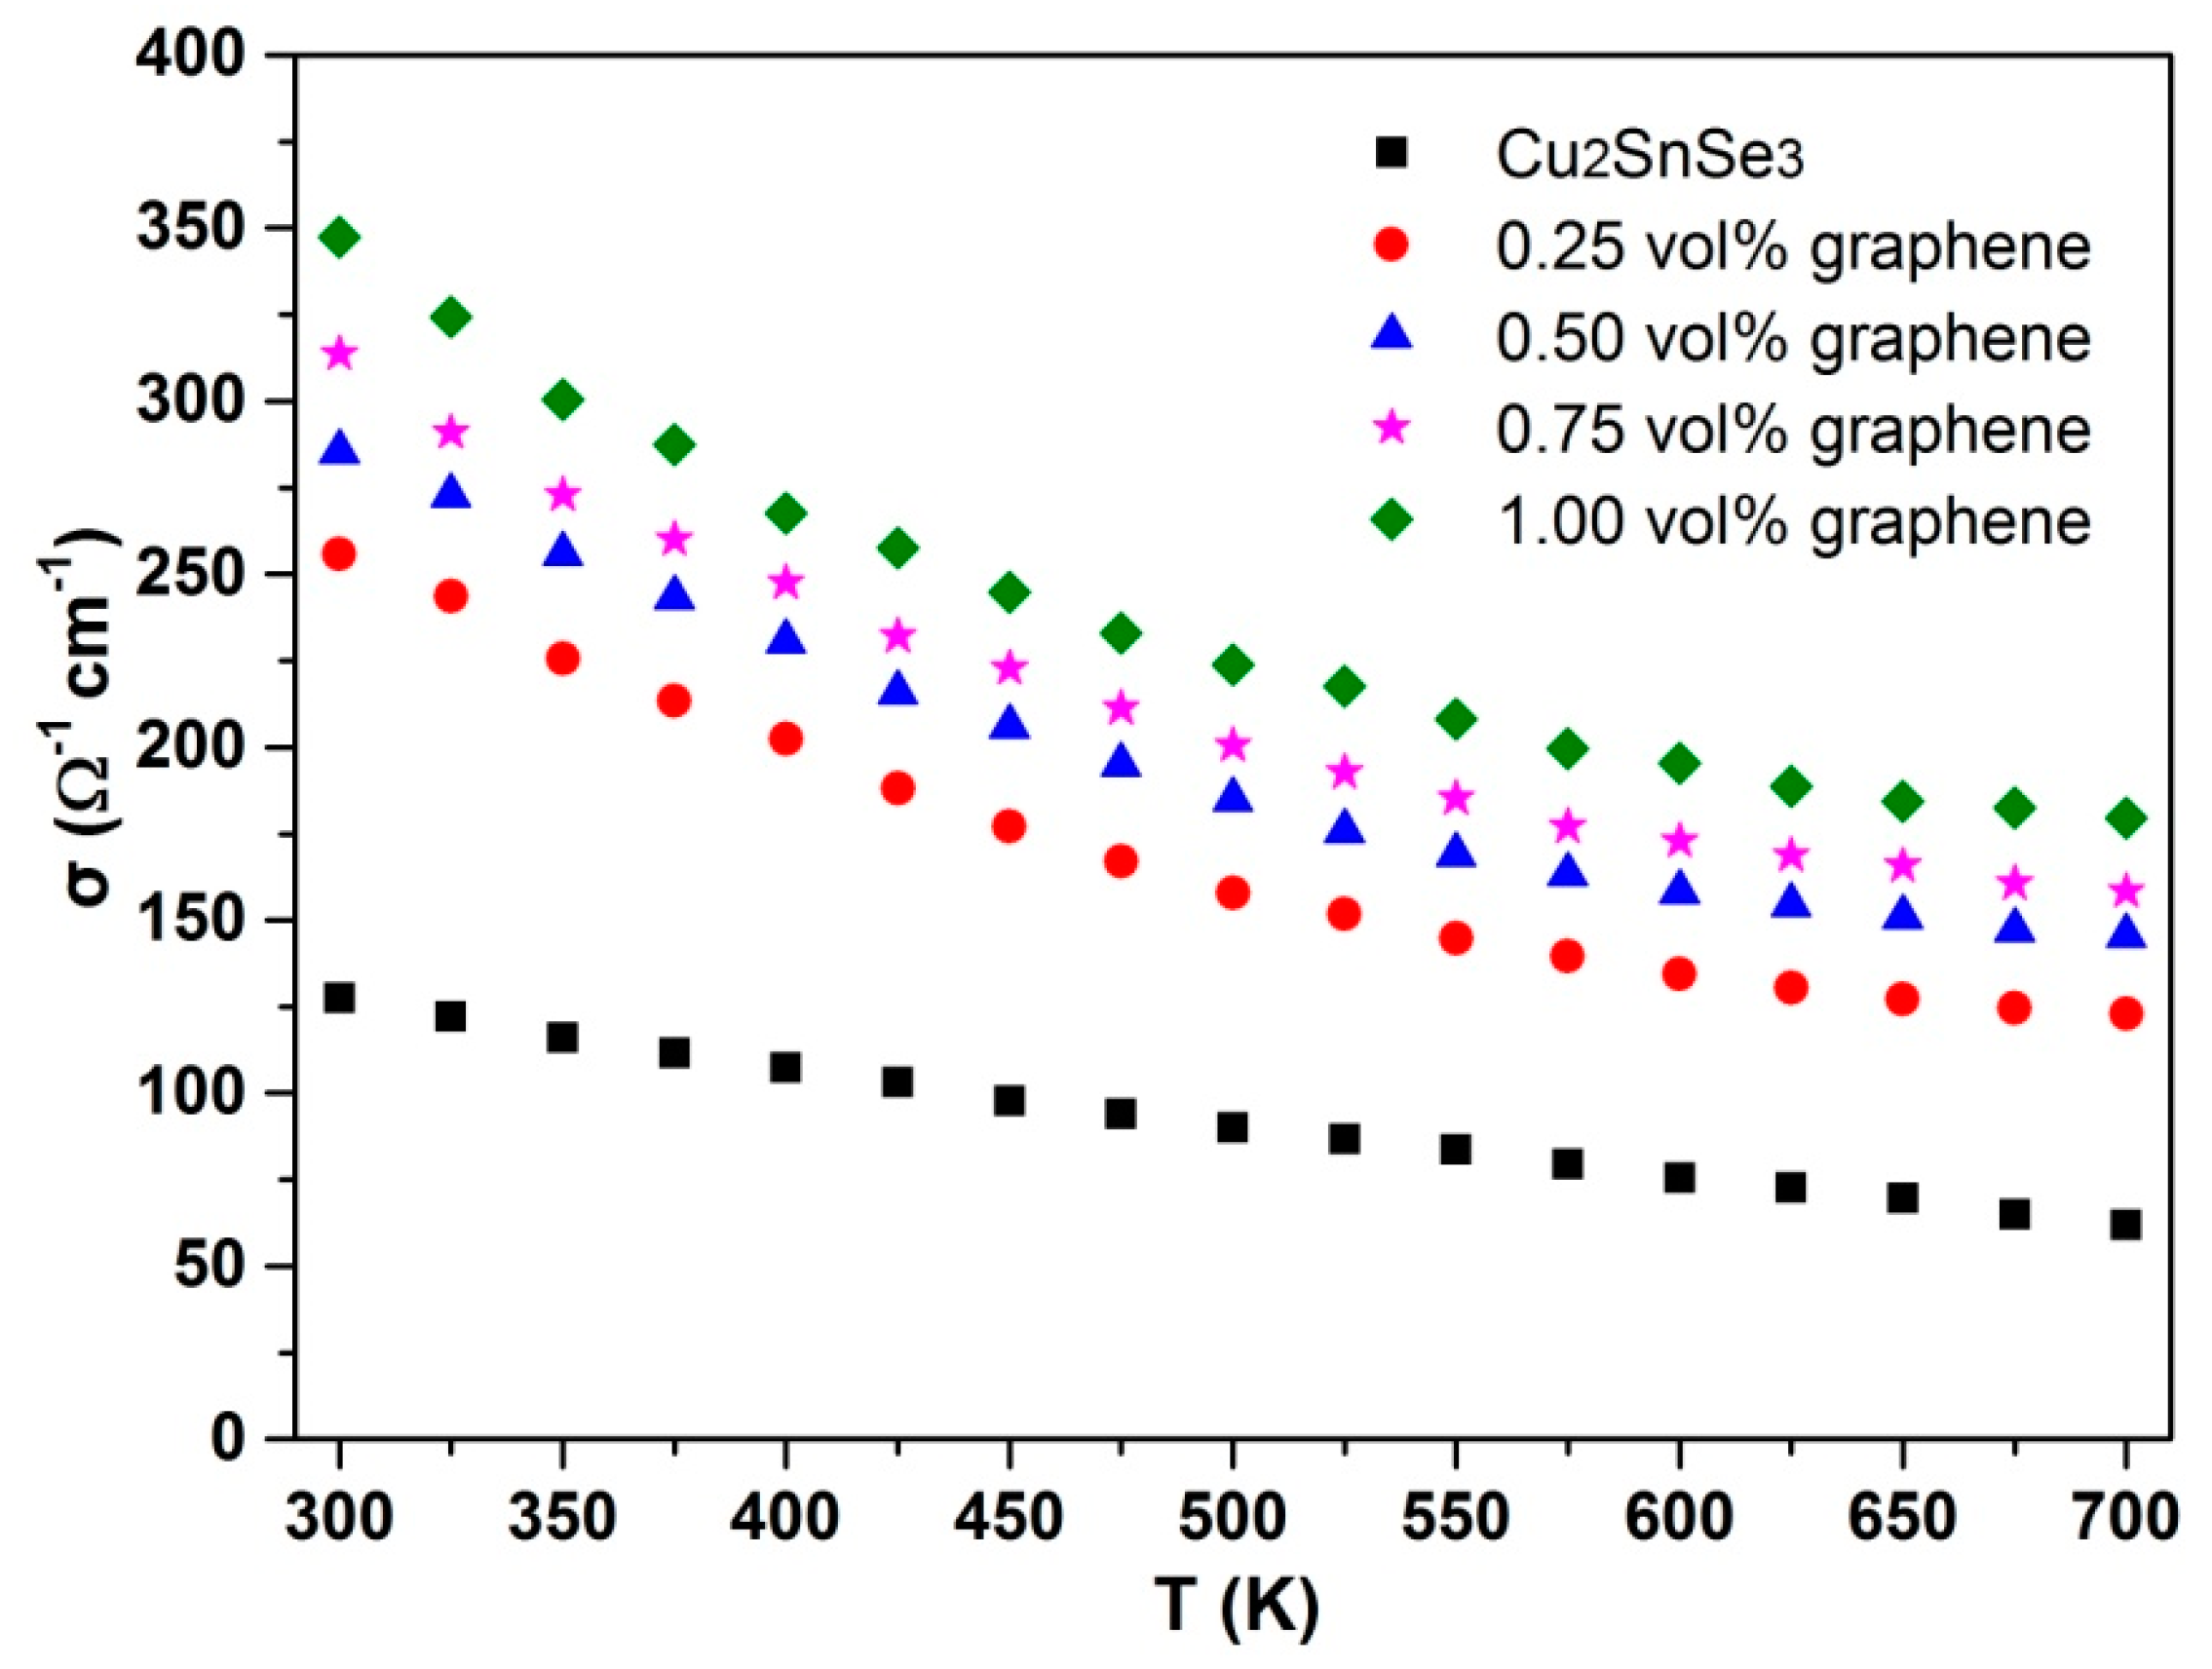
Figure 8 presents the σ of graphene/Cu2SnSe3 composites as a function of temperature. It can be observed that the σ of the pristine Cu2SnSe3 sample declines steeply with the temperature increasing across the overall temperature range, showing a typical heavily doped degenerate semiconducting behavior. It is noteworthy that graphene/Cu2SnSe3 samples show an obvious increased σ compared with pristine Cu2SnSe3 due to the introduction of conductivity graphene nanosheets. In addition, the σ of graphene/Cu2SnSe3 samples increases with the increasing fraction of graphene. The σ of 1.0 vol % graphene/Cu2SnSe3 sample at room temperature is about 350 Ω−1·cm−1, which is about 3 times the value of the pristine Cu2SnSe3. Even at the high-temperature region, the σ of graphene/Cu2SnSe3 sample still retains a high value. The σ of 0.25 vol % graphene/Cu2SnSe3 sample is around 124 Ω−1·cm−1 at 700 K. The enhancement in σ for graphene/Cu2SnSe3 samples may be ascribed to either an increase of carrier concentration (p), or the increment in carrier mobility (μH), or both. Table 1 lists some physical and structural parameters of the graphene/Cu2SnSe3 composites at room temperature. As shown in Table 1, the carrier concentration of graphene/Cu2SnSe3 composites is higher than that of pristine Cu2SnSe3. The carrier mobility increases from 21.2 cm2/V·s for Cu2SnSe3 to 34.3 cm2/V·s for the 1.0 vol % graphene/Cu2SnSe3 sample. Therefore, it can be concluded that incorporating graphene nanosheets into a Cu2SnSe3 matrix can improve the electrical conductivity, which is attributed to the increment in both carrier concentration and mobility. This is reasonable because the multilayered graphene is p-type thermoelectric material, and the graphene itself can afford the charged carrier [29]. In addition, the graphene has a relatively high mobility, which is beneficial to increase the carrier mobility of graphene/Cu2SnSe3 composites.
Figure 9 demonstrates the α of graphene/Cu2SnSe3 samples as a function of temperature. It can be seen that the α of all graphene/Cu2SnSe3 samples across the whole temperature range was positive, indicating the major charge carriers in the samples are holes. Moreover, the α of all graphene/Cu2SnSe3 composites and pristine Cu2SnSe3 samples increases approximately linearly with increasing temperature. For example, the α of pristine Cu2SnSe3 increases from 130 μV/K to 255 μV/K in the temperature range of 300–700 K. At the same time, the introduction of graphene nanosheets decreased the Seebeck coefficients of Cu2SnSe3 samples evidently. Compared with the α of pristine Cu2SnSe3 sample, the α of graphene/Cu2SnSe3 samples decreases with the increasing fraction of graphene. At room temperature, the α decreases from 130 μV/K for Cu2SnSe3 matrix to 70 μV/K for the 1.0% graphene/Cu2SnSe3 composite. The decrease of α for graphene/Cu2SnSe3 composites can be explained by the equation
α = ± k B e [ 2 + ln 2 ( 2 π m k B T ) 3 2 h 3 p ]
where kB, m*, h, and p are Boltzmann constant, density of states effective mass, Planck’s constant, and charge carrier concentration, respectively. The introduction of graphene nanosheets leads to the improved carrier density. Herein, according to the equation, the α is reduced.
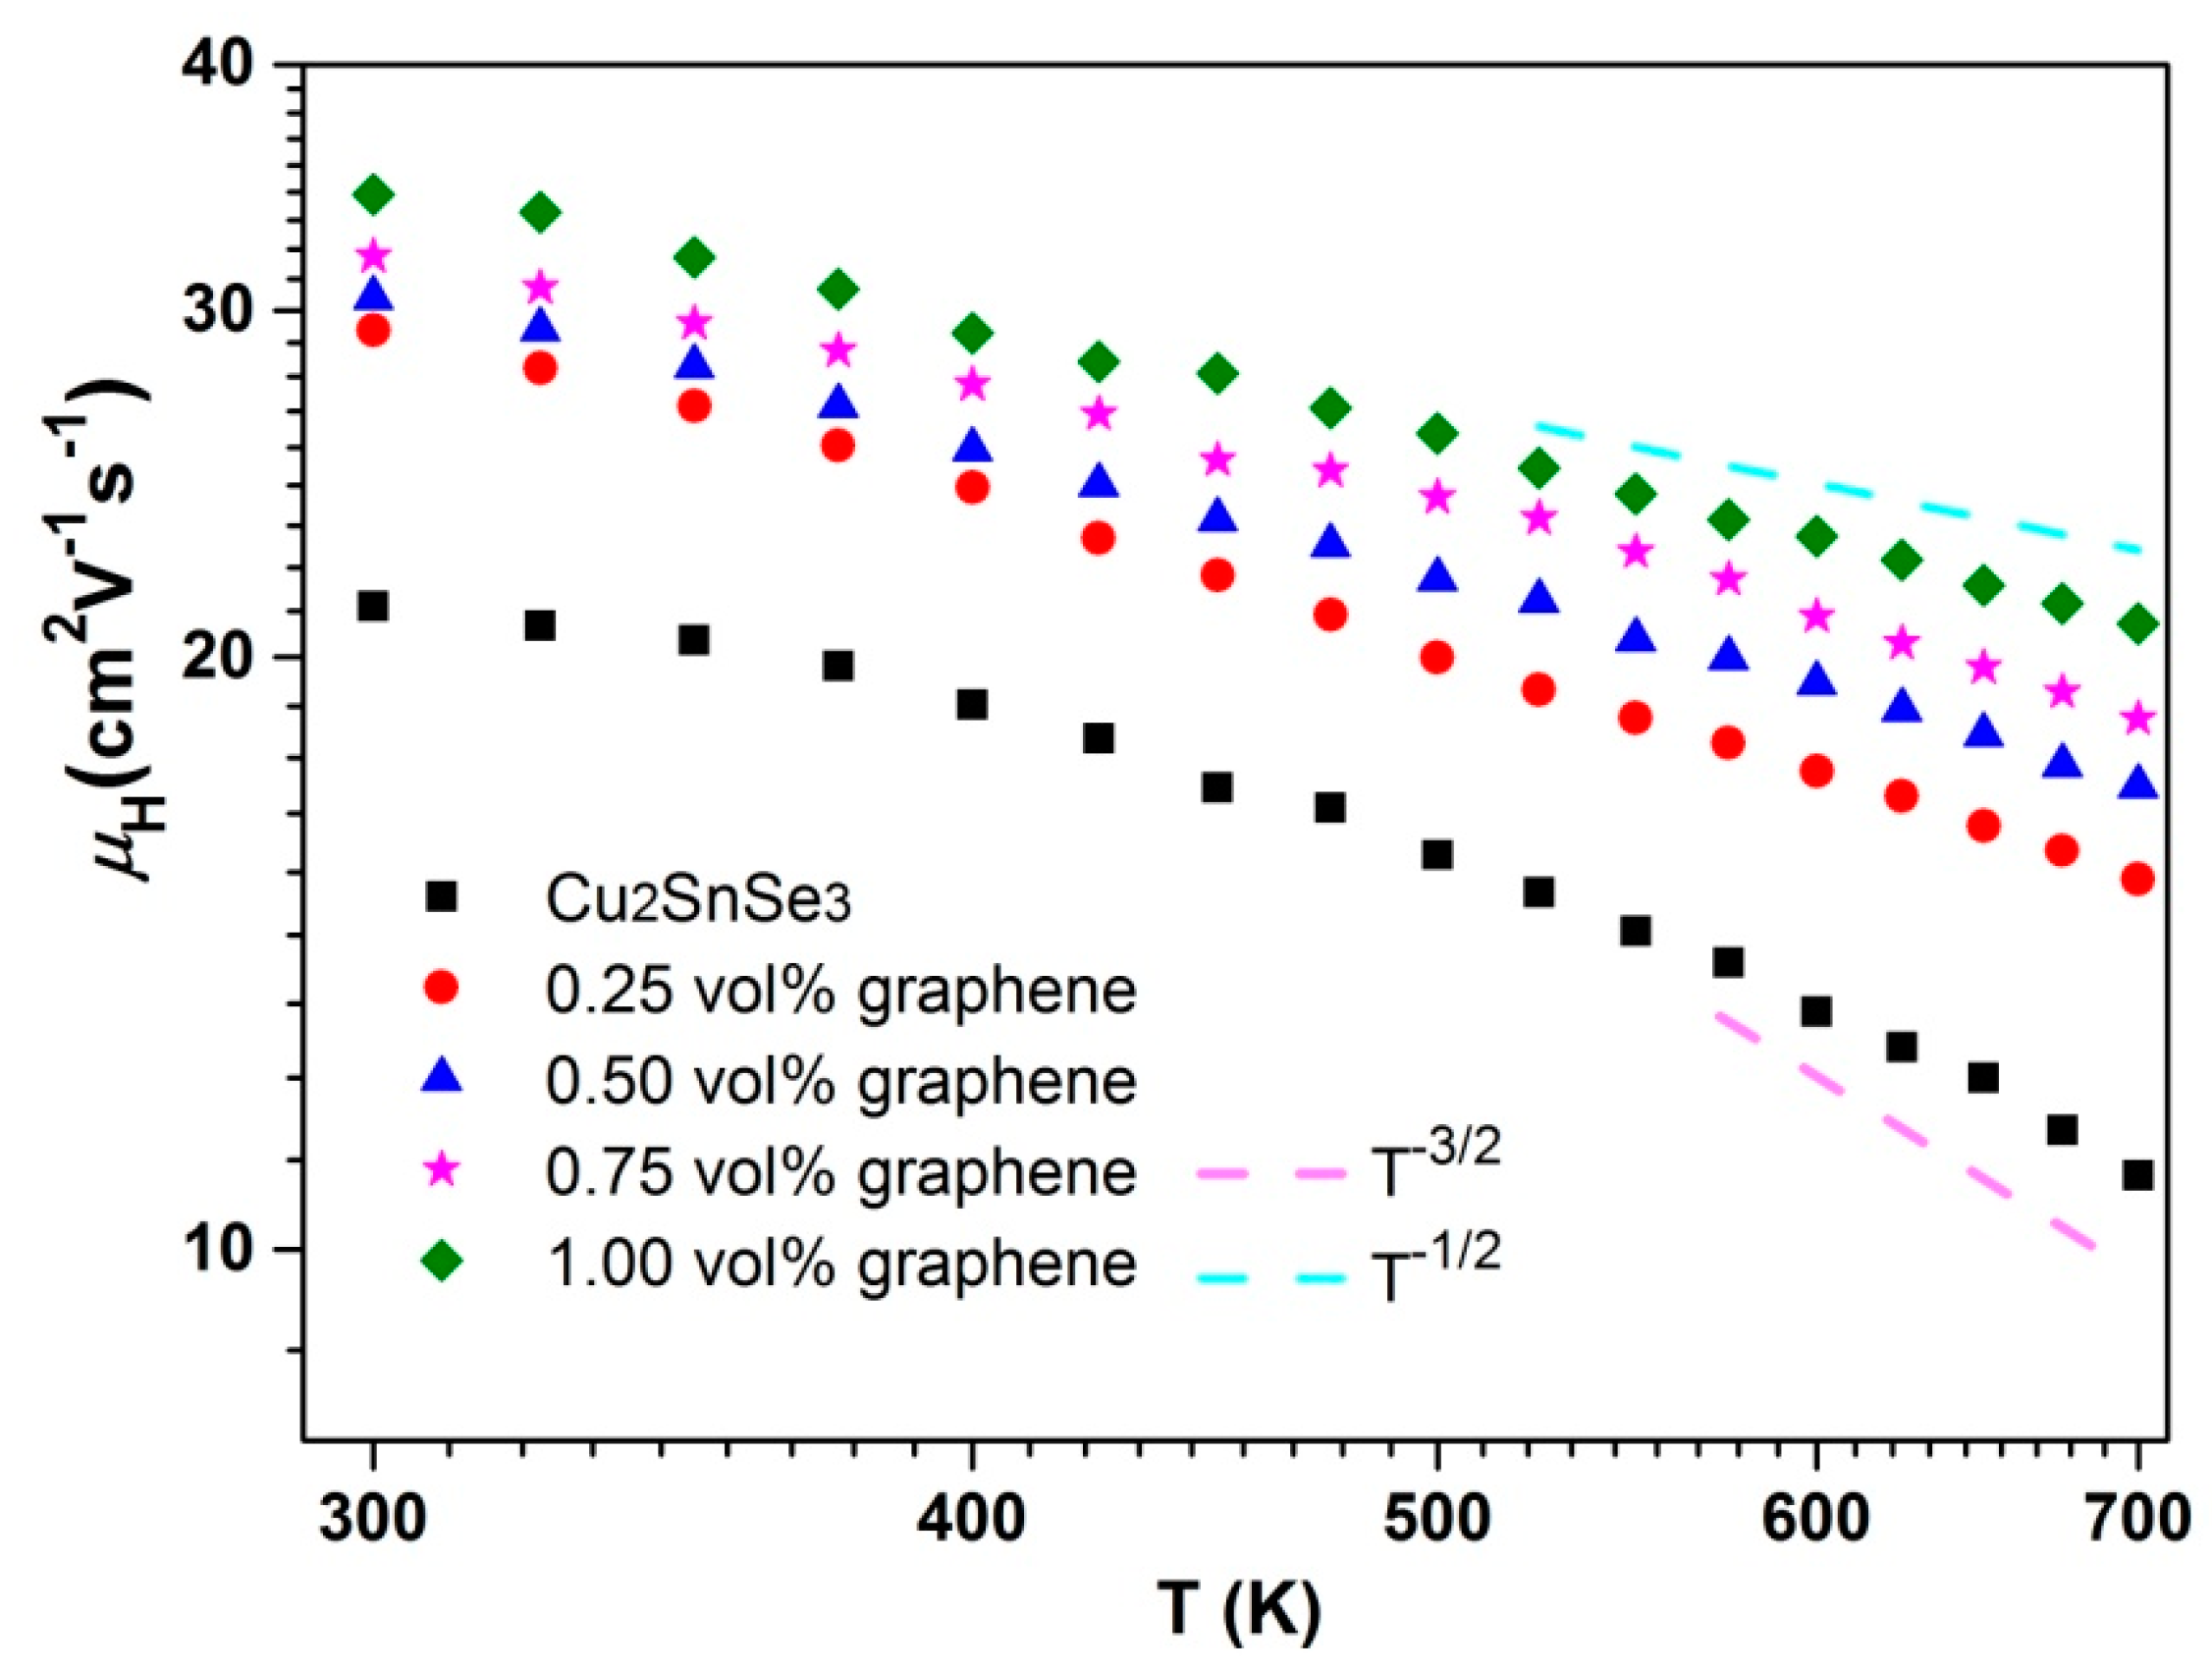
The μH of graphene/Cu2SnSe3 composites as a function of temperature is displayed in Figure 10. The μH of graphene/Cu2SnSe3 composites increases with the increasing fraction of graphene. Moreover, the μH of graphene/Cu2SnSe3 samples in this study is between 20 and 35 cm2·V−1·s−1 at room temperature, which is close with that of CoSb3 [30,31]. This may be attributed to the similar carrier effective mass (m*) of Cu2SnSe3 and skutterudite compounds. The m* can be calculated by the following equations based on single parabolic band model.
Table 1 lists the evaluated equivalent m* of graphene/Cu2SnSe3 samples at room temperature. Meanwhile, it can also be observed in Figure 10 that the μH of pristine Cu2SnSe3 shows a temperature dependence of T−3/2 above 520 K, suggesting that the dominant scattering mechanism is phonon scattering in the temperature range from 520 K to 700 K. Below 520 K, the μH of pristine Cu2SnSe3 proportional to T−3/2 is weak, and the relationship of μH as function of temperature dependence of T−0.5 can be seen, showing that alloy scattering is the dominate mechanism in this temperature range. However, the μH of graphene/Cu2SnSe3 samples deviates from the T−1.5 or T−0.5 dependence across the entire temperature range, indicating the dominative mechanism is mixed scattering in these composites.

3.3. Thermal Conductivity

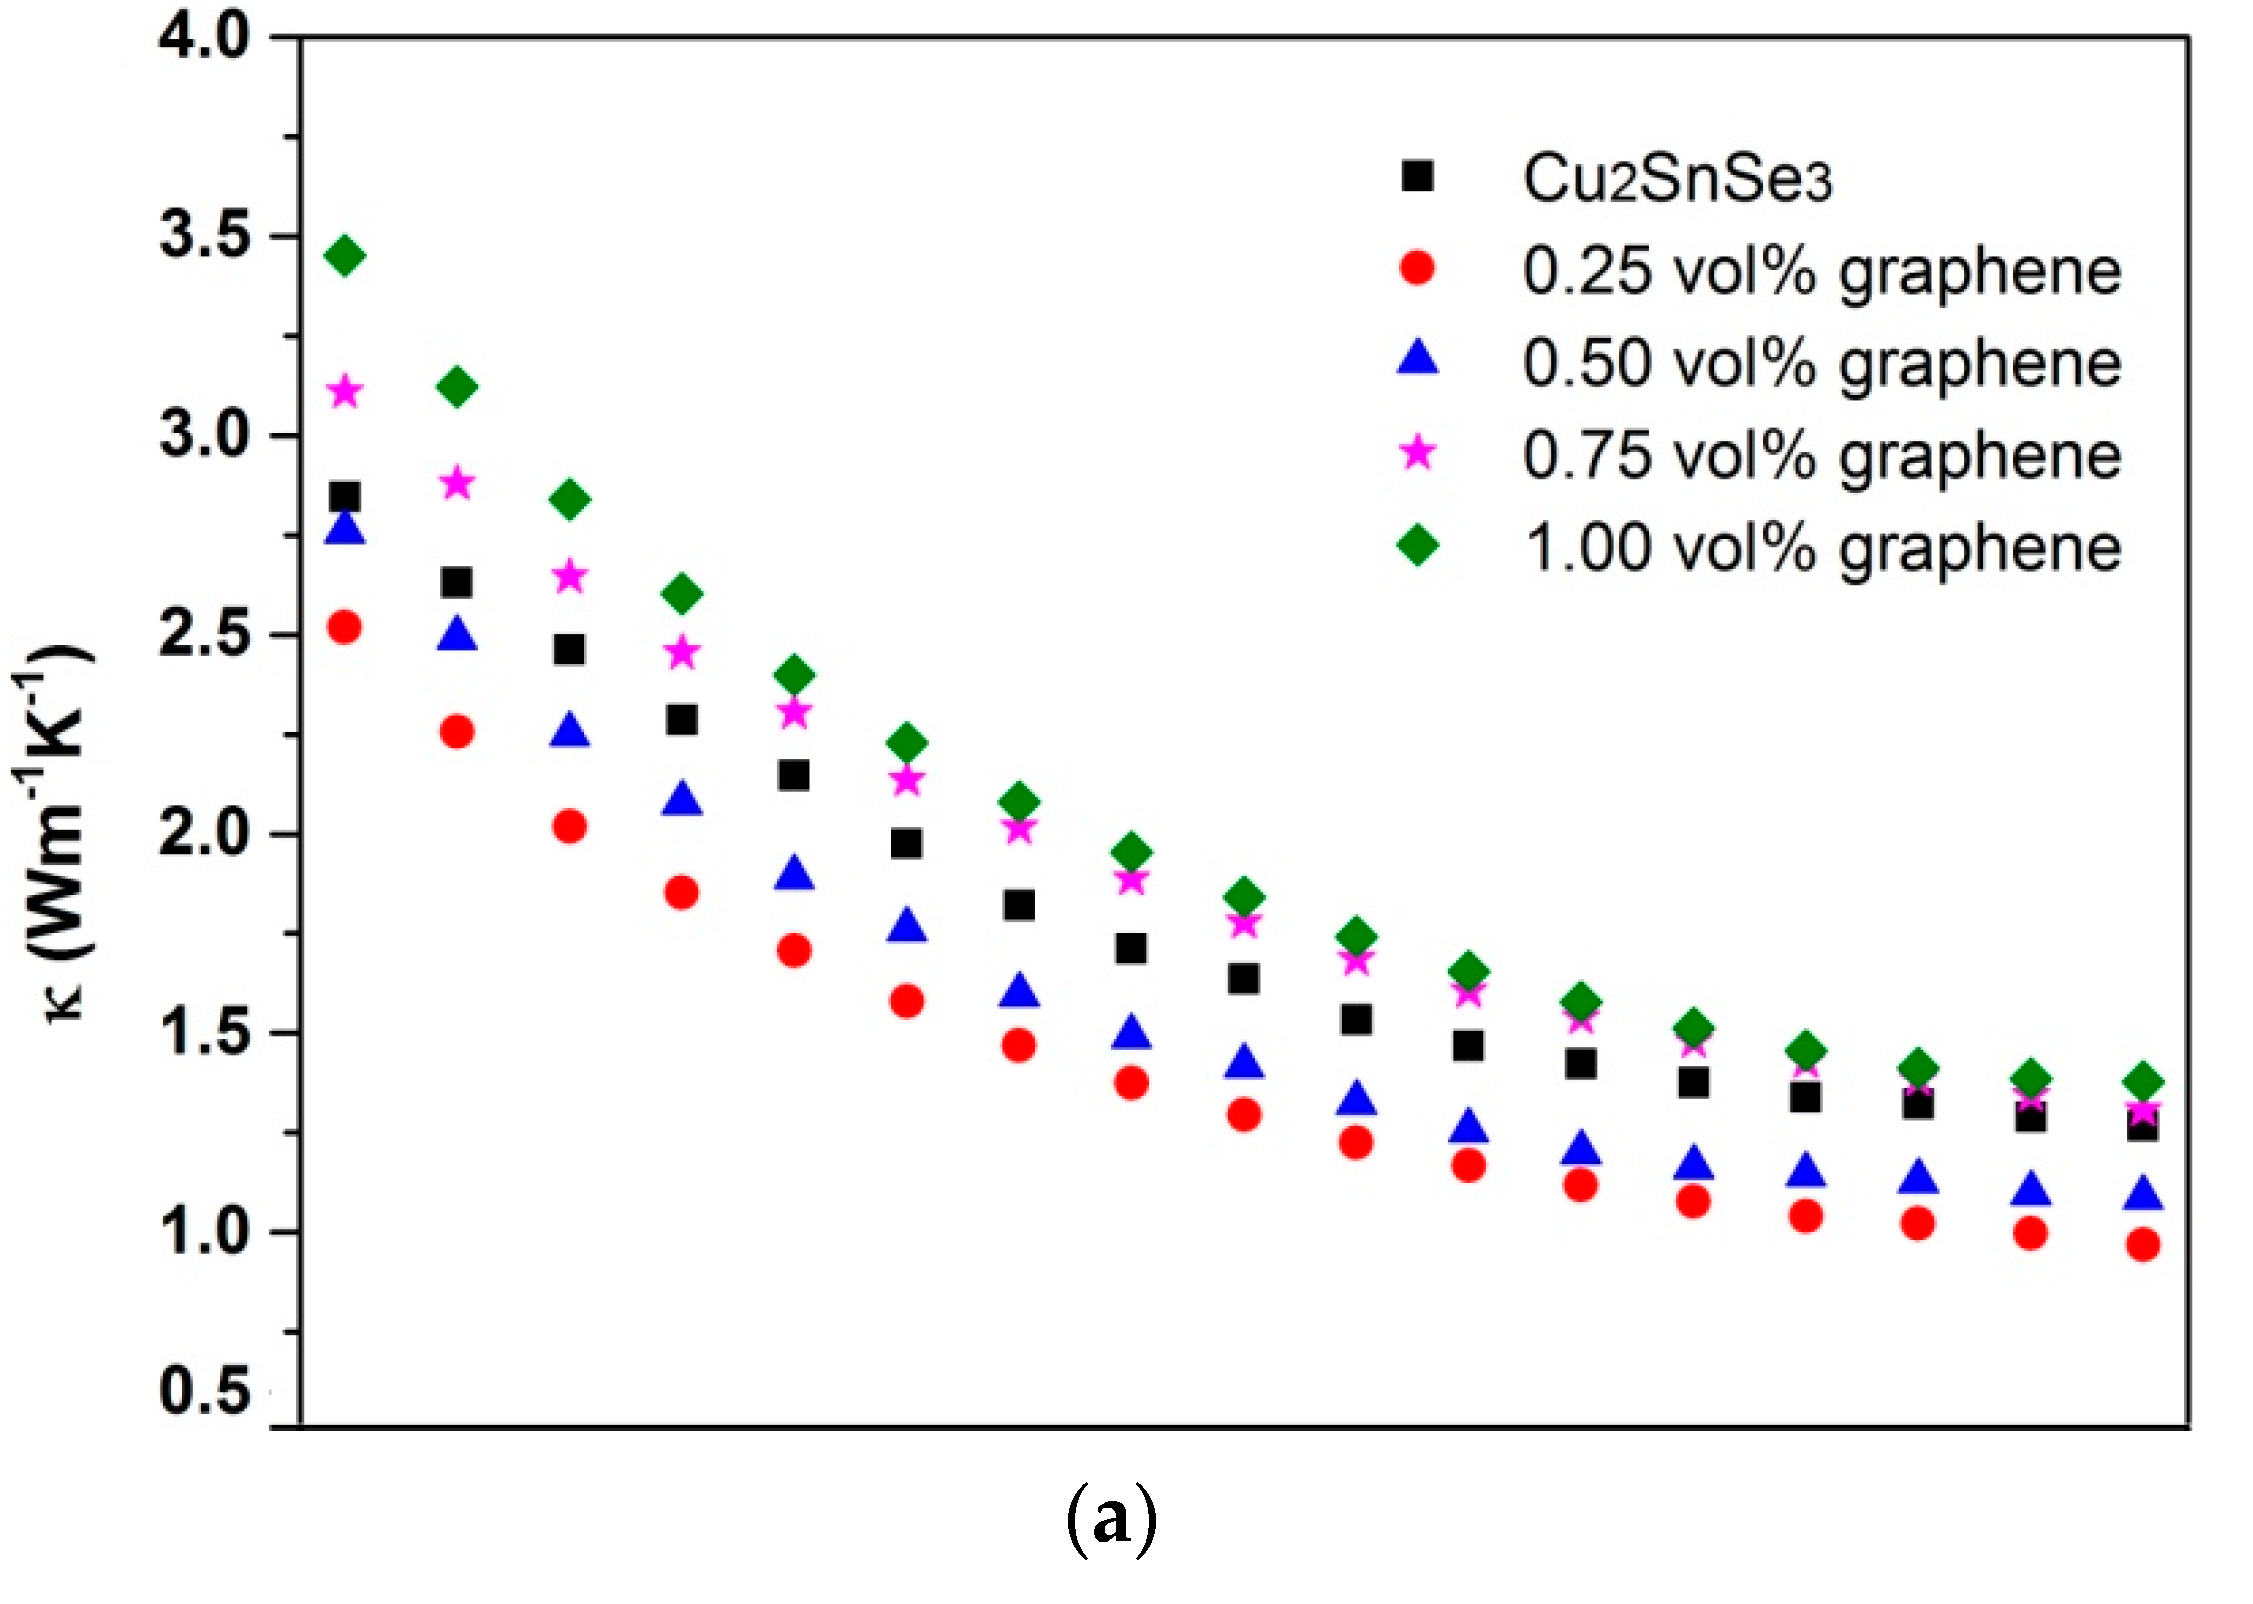
The κ and κl for graphene/Cu2SnSe3 samples as function of temperature is shown in Figure 11. The κl is obtained by directly subtracting the carrier thermal conductivity κc from the total thermal conductivity; κc can be calculated according to the Wiedemann–Franz law, κc = L0σT, where the Lorenz constant L0 is taken as 2.45 × 10⁻⁸ V2/K2. The κ for all composites decreases with the increasing temperature. With the fraction of graphene increasing, the κ of graphene/Cu2SnSe3 composites firstly declines then starts to increase. The achieved κ of 0.25% graphene/Cu2SnSe3 sample at room temperature is 2.5 W/m·K, which is a 12% reduction from that of pristine Cu2SnSe3. On the contrary, the κ of the 1.0% graphene/Cu2SnSe3 sample at room temperature increases to 3.45 W/m·K. The κl of graphene/Cu2SnSe3 samples demonstrates similar changes compared to that of pure Cu2SnSe3. The lowest κl of 0.25% graphene/Cu2SnSe3 samples is 0.78 W/m·K, which is 22% lower than that of the pristine Cu2SnSe3 sample. As is known to all, nanostructuring will reduce the κl of material as the long-wavelength phonon scattering at grain boundaries was suppressed. Because graphene itself has high lattice thermal conductivity and large specific surface area, an opposite effect of graphene nanosheets on the κ of Cu2SnSe3 can be allowed. On one side, the addition of second phase with high κ may increase the total thermal conductivity of composite. On the other side, large specific surface area suggests more newly formed interfaces between the matrix and second phase, which are expected to scatter phonons to depress the κl. For 0.25% graphene/Cu2SnSe3, graphene nanosheets are homogeneously dispersed in the Cu2SnSe3 matrix, which means the dominative factor should be the influence of interface scattering. By comparison, when the content of graphene exceeds a certain value, the graphene in the composites tends to aggregate into thick flakes in the Cu2SnSe3 matrix, as mentioned above. Therefore, the interfacial increment due to the incorporation of graphene should not be significant. This can explain the change in κl of graphene/Cu2SnSe3 composites. The results also confirm that the κl of Cu2SnSe3 can be effectively reduced by introducing graphene nanosheets. The obtained minimum κl in the present work is 0.78 W/m·K at 700 K for the 1.0% graphene/Cu2SnSe3 sample. According to the basic kinetic theory, when the phonon mean free path is equal to the shortest interatomic distance, the lattice thermal conductivity can achieve the minimal value κlmin [32]. The κlmin can be calculated according to the formula κl = 1/3νmCv·l, where νm, Cv, and l are the mean sound velocity, the isochoric specific heat of the system using Dulong and Petit value, and the mean free path of phonon, respectively. The νm is taken as the constant 2.3 × 10³ m/s [33]. It is assumed that the minimum mean free path of phonon l is the interatomic distance (0.238 nm) of the Cu2SnSe3 structure, and the achieved κlmin is 0.52 W·m−1·K−1, just as illustrated by the brown dashed line in Figure 11b. By controlling the content of graphene nanosheets and microstructure of composites, the κl of graphene/Cu2SnSe3 composites may approach the κlmin of Cu2SnSe3 in the high-temperature region. Further optimization will be studied in further work.

3.4. Figure of Merit

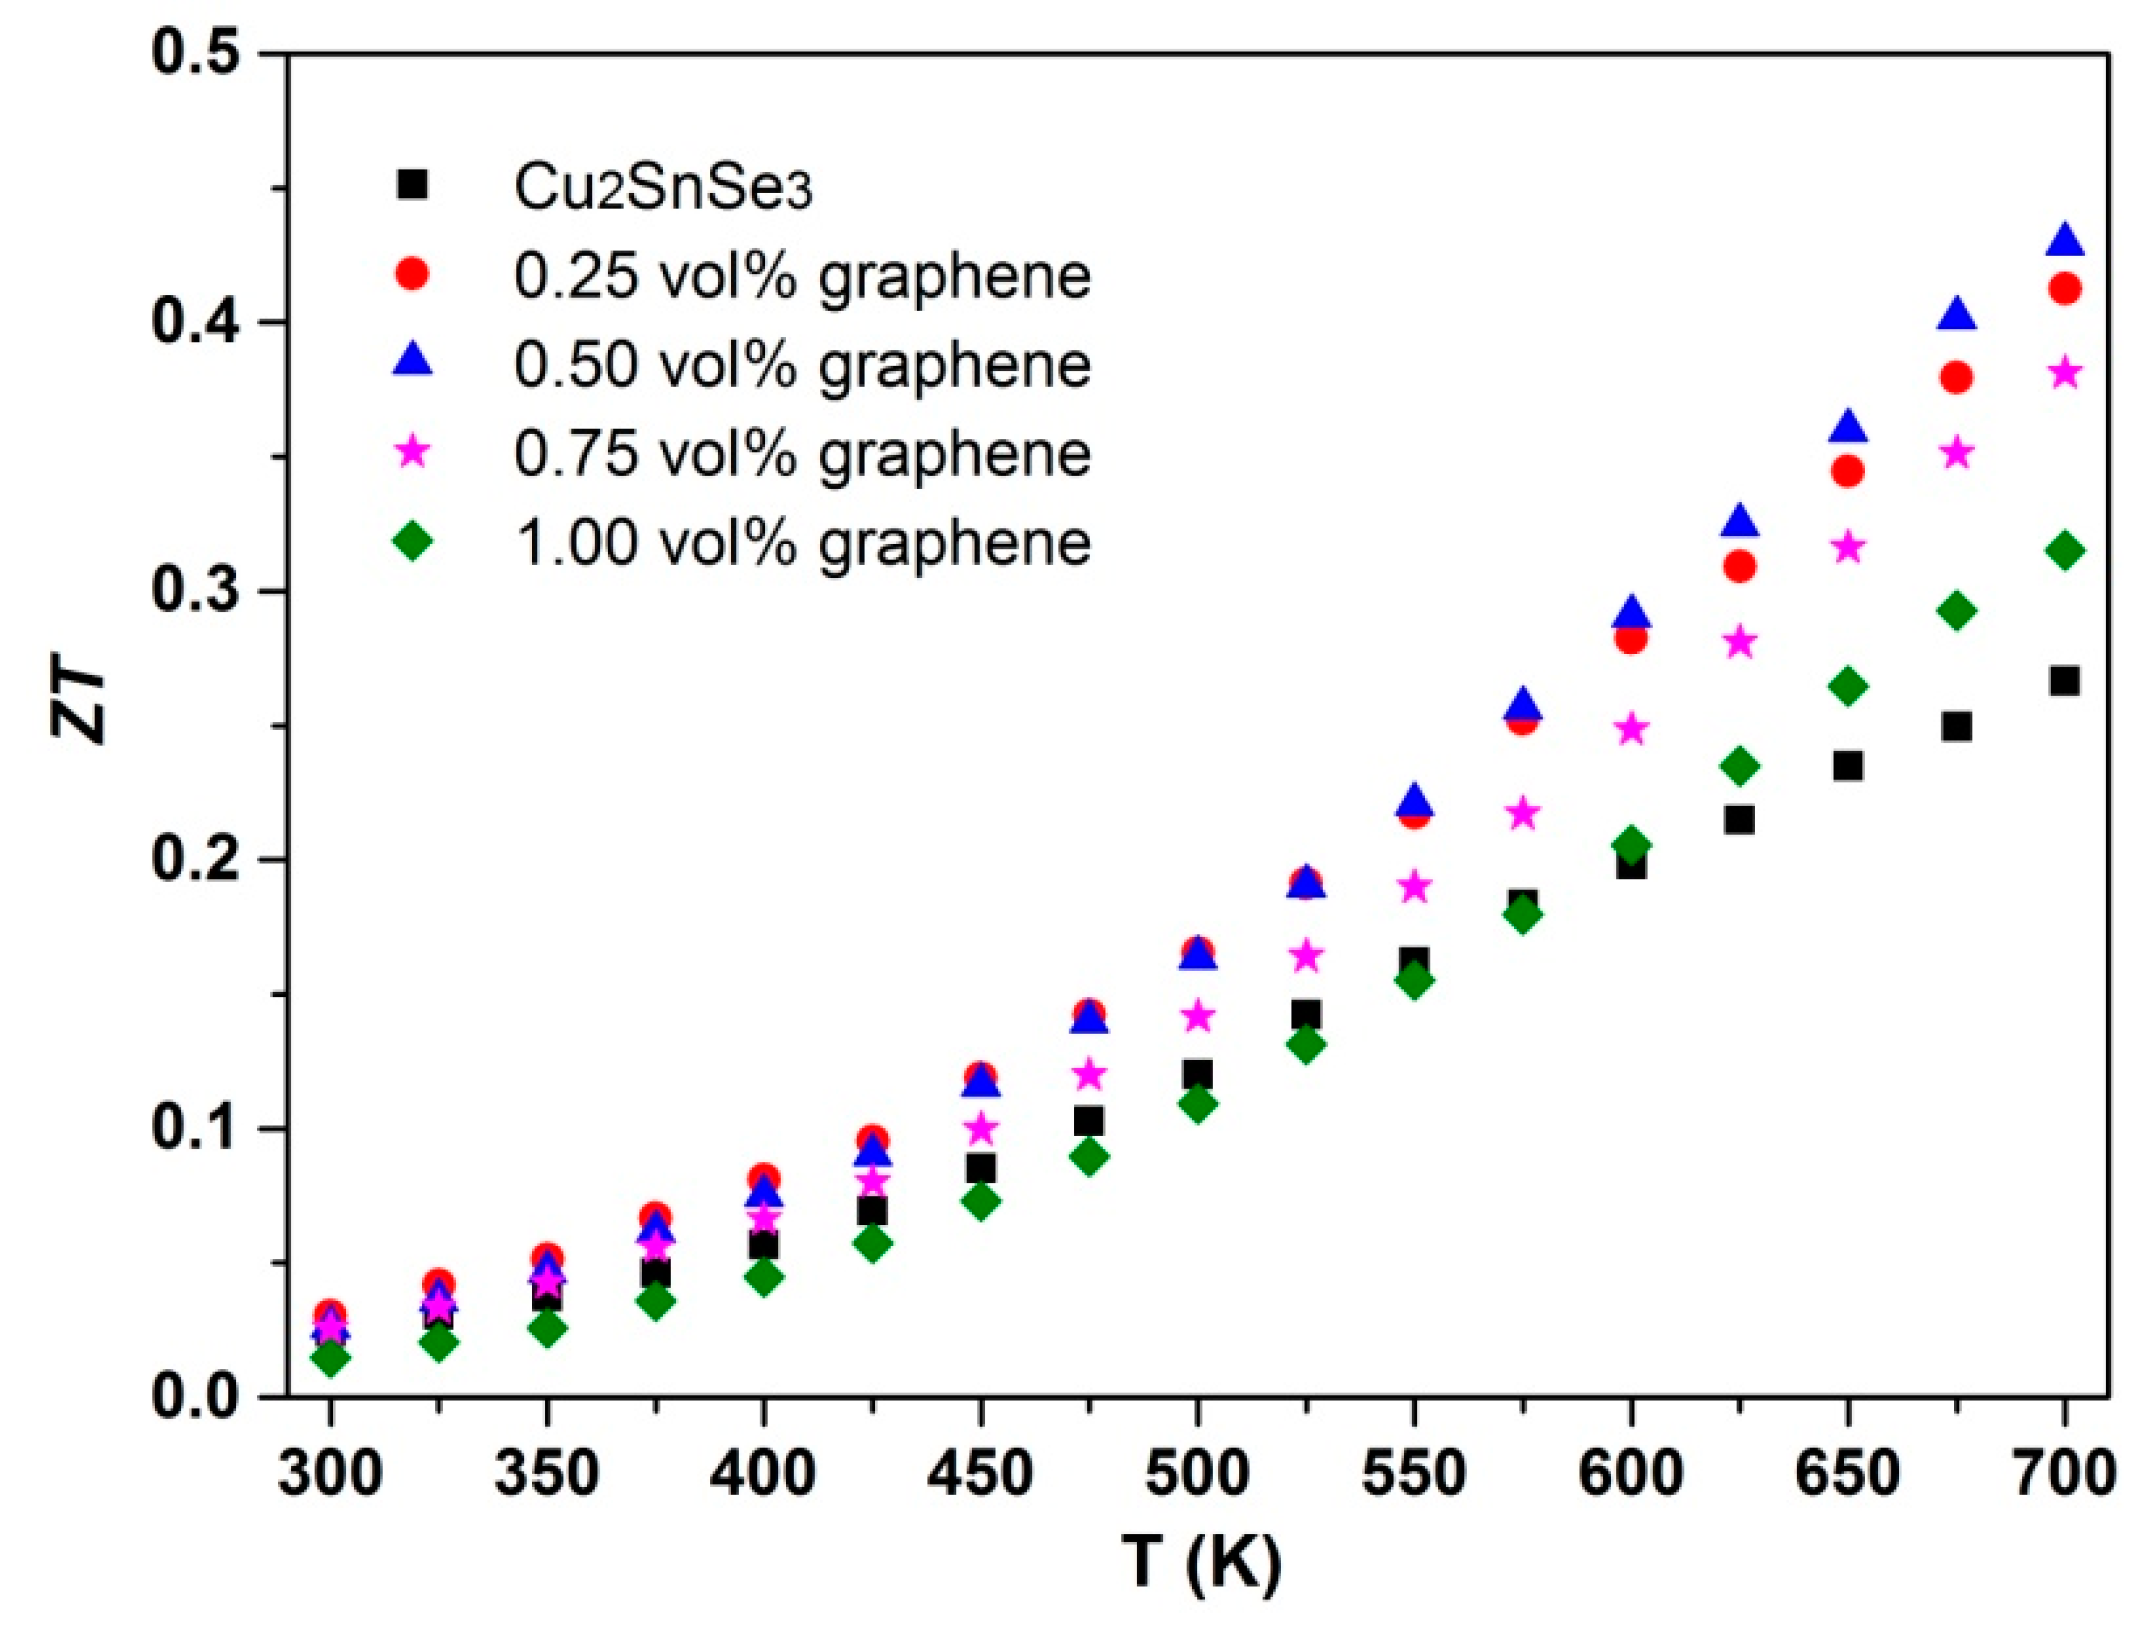
Figure 12 shows the ZT value of graphene/Cu2SnSe3 samples as a function of temperature. Like other related Cu-based ternary chalcogenide compounds with diamond-like structure [17,18], the ZT value of graphene/Cu2SnSe3 samples increases with increasing temperature. Compared with the figure of merit of pristine Cu2SnSe3, the ZT of graphene/Cu2SnSe3 samples is obviously improved. The 0.25% graphene/Cu2SnSe3 composite has the maximal ZT value of 0.44 at 700 K, 45% higher than that of pristine Cu2SnSe3. If the graphene/Cu2SnSe3 samples were coated by a coating film and the measured temperature increased to 850 K, the ZT value is capable of reaching 1.0–1.2. The enhancement of ZT for graphene/Cu2SnSe3 composites is basically ascribed to the depressed κl and the increased σ. The incorporation of graphene nanosheets into the Cu2SnSe3 could enhance the thermoelectric properties. Therefore, if we choose the material with optimized carrier concentration and mobility as the thermoelectric matrix, the thermoelectric composite with a higher ZT value could be achieved.

4. Conclusions

The graphene nanosheets were introduced into the Cu2SnSe3 matrix by ball milling and the graphene/Cu2SnSe3 composite was fabricated by spark plasma sintering. The graphene nanosheets distributed uniformly in the Cu2SnSe3 matrix. Meanwhile, some graphene nanosheets tended to form thick aggregations and the average length of aggregations was about 3 μm. With the increasing content of graphene, the electrical conductivity of graphene/Cu2SnSe3 samples greatly increased, while the Seebeck coefficient was decreased. The introduction of graphene nanosheets reduced the thermal conductivity, effectively resulting from the phonon scattering by the graphene interface. When the fraction of graphene exceeds a certain value, the thermal conductivity of graphene/Cu2SnSe3 composites starts to increase. The maximum figure of merit ZT for 0.25 vol % graphene/Cu2SnSe3 was 0.44 at 700 K.

Acknowledgments

This work is financially supported by National Natural Science Foundations of China (Grants Nos. 51471076, 51202088).

Author Contributions

All authors participated in the research, analysis and edition of the manuscript. Degang Zhao designed the experiments and Xuezhen Wang fabricated the samples. All authors contributed to the characterization and data analysis. Degang Zhao wrote the paper.

Conflicts of Interest

The authors declare no conflicts of interest.

References

  1. Sootsman, J.R.; Chung, D.Y.; Kanatzidis, M.G. New and old concepts in thermoelectric materials. Angew. Chem. Int. Ed. 2009, 48, 8616–8639. [Google Scholar] [CrossRef] [PubMed]
  2. Shi, X.; Chen, L.D.; Uher, C. Recent advance in high-performance bulk thermoelectric materials. Int. Mater. Rev. 2016, 61, 379–415. [Google Scholar] [CrossRef]
  3. Gayner, C.; Kar, K.K. Recent advances in thermoelectric materials. Prog. Mater. Sci. 2016, 83, 330–382. [Google Scholar] [CrossRef]
  4. Zhao, L.D.; Kanatzidis, M.G. An overview of advanced thermoelectric materials. J. Materiomics 2016, 2, 101–103. [Google Scholar] [CrossRef]
  5. Zhou, X.Y.; Wang, G.W.; Guo, L.J.; Chi, H.; Wang, G.Y.; Zhang, Q.F.; Chen, C.Q.; Travis, T.; Jeff, S.; Dravid, V.P. Hierarchically structured TiO2 for Ba-filled skutterudite with enhanced thermoelectric performance. J. Mater. Chem. A 2014, 2, 20629–20635. [Google Scholar] [CrossRef]
  6. Li, G.D.; Baijaj, S.; Aydemir, U.; Hao, S.Q.; Xiao, H.; Goddard, W.A.; Zhai, P.C.; Zhang, Q.J.; Snyder, G.J. P-type Co interstitial defects in thermoelectric skutterudite CoSb3 due to the breakage of Sb4 rings. Chem. Mater. 2016, 28, 2172–2179. [Google Scholar] [CrossRef]
  7. Gelbstein, Y.; Dashevsky, Z.; Dariel, M.P. In-doped Pb0.5Sn0.5Te p-type samples prepared by powder metallurgical processing for thermoelectric applications. Physica B 2007, 396, 16–21. [Google Scholar] [CrossRef]
  8. Gelbstein, Y.; Davidow, J. Highly efficient functional GexPb1-xTe based thermoelectric alloys. Phys. Chem. Chem. Phys. 2014, 16, 20120–20126. [Google Scholar] [CrossRef] [PubMed]
  9. Gelbstein, Y. Phase morphology effects on the thermoelectric properties of Pb0.25Sn0.25Ge0.5Te. Acta Mater. 2013, 61, 1499–1507. [Google Scholar] [CrossRef]
  10. Dado, B.; Gelbstein, Y.; Mogiliansky, D.; Ezersky, V.; Dariel, M.P. Structural evolution following spinodal decomposition of the pseudoternary compound (Pb0.3Sn0.1Ge0.6)Te. J. Electron. Mater. 2010, 39, 2165–2171. [Google Scholar] [CrossRef]
  11. Kirievsky, K.; Shlimovich, M.; Fuks, D.; Gelbstein, Y. An ab-initio study of the thermoelectric enhancement potential in nano-grained TiNiSn. Phys. Chem. Chem. Phys. 2014, 16, 20023–20029. [Google Scholar] [CrossRef] [PubMed]
  12. Kirievsky, K.; Gelbstein, Y.; Fuks, D. Phase separation and antisite defects possibilities for enhancement the thermoelectric efficiency in TiNiSn half-Heusler alloys. J. Solid State Chem. 2013, 203, 247–254. [Google Scholar] [CrossRef]
  13. Sadia, Y.; Dinnerman, L.; Gelbstein, Y. Mechanical Alloying and Spark Plasma Sintering of Higher Manganese Silicides for Thermoelectric Application. J. Electron. Mater. 2013, 42, 1926–1931. [Google Scholar] [CrossRef]
  14. Gelbstein, Y.; Tunbridge, J.; Dixon, R.; Reece, M.J.; Ning, H.P.; Gilchrist, R.; Summers, R.; Agote, I.; Lagos, M.A.; Simpson, K.; et al. Physical, mechanical and structural properties of highly efficient nanostructured n- and p-silicides for practical thermoelectric applications. J. Electron. Mater. 2014, 43, 1703–1711. [Google Scholar] [CrossRef]
  15. Liu, G.H.; Chen, K.X.; Li, J.T.; Li, Y.Y.; Zhou, M.; Li, L.F. Combustion synthesis of Cu2SnSe3 thermoelectric materials. J. Eur. Ceram. Soc. 2016, 36, 1407–1415. [Google Scholar] [CrossRef]
  16. Lu, X.; Morelli, D.T. Thermoelectric properties of Mn doped Cu2SnSe3. J. Electron. Mater. 2012, 41, 1554–1558. [Google Scholar] [CrossRef]
  17. Shi, X.Y.; Xi, L.L.; Fan, J.; Zhang, W.Q.; Chen, L.D. Cu–Se bond network and thermoelectric compounds with complex diamond like structure. Chem. Mater. 2010, 22, 6029–6031. [Google Scholar] [CrossRef]
  18. Fan, J.; Liu, H.L.; Shi, X.Y.; Bai, S.Q.; Shi, X.; Chen, L.D. Investigation of thermoelectric properties of Cu2GaxSn1-xSe3 diamond-like compounds by hot pressing and spark plasma sintering. Acta Mater. 2013, 61, 4297–4304. [Google Scholar] [CrossRef]
  19. Skoug, E.J.; Cain, J.D.; Morelli, D.T. Thermoelectric properties of the Cu2SnSe3-Cu2GeSe3 solid solution. J. Alloys Compd. 2012, 506, 18–23. [Google Scholar] [CrossRef]
  20. Bux, S.K.; Fleurial, J.P.; Kaner, R.B. Nanostructured materials for thermoelectric applications. Chem. Commun. 2011, 46, 8311–8324. [Google Scholar] [CrossRef] [PubMed]
  21. Balaya, P. Size effects and nanostructured materials for energy applications. Energy Environ. Sci. 2008, 1, 645–654. [Google Scholar] [CrossRef]
  22. Amatya, R.; Ram, R.J. Trend for thermoelectric materials and their earth abundance. J. Electron. Mater. 2012, 41, 1011–1558. [Google Scholar] [CrossRef]
  23. Liang, B.B.; Song, Z.J.; Wang, M.H.; Wang, L.J.; Jiang, W. Fabrication and thermoelectric properties of graphene/Bi2Te3 composite materials. J. Nanomater. 2013, 15, 210767–210772. [Google Scholar]
  24. Kim, J.; Lee, E.S.; Kim, J.Y.; Choi, S.M.; Lee, K.H.; Seo, W.S. Thermoelectric properties of unoxidized graphene/Bi2Te2.7Se0.3 composites synthesized by exfoliation/re-assembly method. Phys. Status Solidi (RRL) 2014, 8, 1–5. [Google Scholar] [CrossRef]
  25. Chen, H.J.; Yang, C.Y.; Liu, H.L.; Zhang, G.H.; Wan, D.Y.; Huang, F.Q. Thermoelectric properties of CuInTe2/graphene composites. CrystEngComm 2013, 15, 6648–6651. [Google Scholar] [CrossRef]
  26. Feng, B.; Xie, J.; Cao, G.S.; Zhu, T.J.; Zhao, X.B. Enhanced thermoelectric properties of p-type CoSb3/graphene nanocomposite. J. Mater. Chem. A 2013, 1, 13111–13119. [Google Scholar] [CrossRef]
  27. Faleev, S.V.; Leonard, F. Theory of enhancement of thermoelectric properties of materials with nanoinclusions. Phys. Rev. B 2008, 77, 214304. [Google Scholar] [CrossRef]
  28. Zebarjadi, M.; Esfarjani, K.; Shakouri, A.; Zeng, G.; Lu, H.; Zide, J.; Gossard, A. Effect of nanoparticle scattering on thermoelectric power factor. Appl. Phys. Lett. 2009, 94, 202105. [Google Scholar] [CrossRef]
  29. Dong, J.D.; Liu, W.; Li, H.; Su, X.L.; Tang, X.F.; Uher, C. In situ synthesis and thermoelectric properties of PbTe-graphene nanocomposites by utilizing a facile and novel wet chemical method. J. Mater. Chem. A 2013, 1, 12503–12511. [Google Scholar] [CrossRef]
  30. Gharleghi, A.; Liu, Y.F.; Zhou, M.H.; He, J.; Tritt, T.M.; Liu, C.J. Enhancing the thermoelectric performance of nanosized CoSb3 via short-range percolation of electrically conductive WTe2 inclusions. J. Mater. Chem. A 2016, 4, 13874–13879. [Google Scholar] [CrossRef]
  31. Ortiz, B.R.; Crawford, C.M.; Mckinney, R.W.; Parilla, P.A.; Toberer, E.S. Thermoelectric properties of bromine filled CoSb3 skutterudite. J. Mater. Chem. A 2016, 4, 8444–8449. [Google Scholar] [CrossRef]
  32. Morelli, D.T.; Jovovic, V.; Heremans, J.P. Intrinsically minimal thermal conductivity in cubic I-V-VI2 semiconductors. Phys. Rev. Lett. 2008, 101, 035901. [Google Scholar] [CrossRef] [PubMed]
  33. Cho, J.Y.; Shi, X.; Salvador, J.R.; Meisner, G.P. Thermoelectric properties and investigations of low thermal conductivity in Ga-doped Cu2GeSe3. Phys. Rev. B 2011, 84, 085207. [Google Scholar] [CrossRef]
Figure 1. SEM image of single-layer graphene with an average diameter of 2 μm.
Crystals 07 00071 g001
Figure 2. SEM image of the 1.0 vol % graphene/Cu2SnSe3 powder after ball milling.
Crystals 07 00071 g002
Figure 3. XRD patterns of sintered graphene/Cu2SnSe3 samples.
Crystals 07 00071 g003
Figure 4. SEM image of the sintered (a) Cu2SnSe3; (b) 0.75 vol % graphene/Cu2SnSe3 sample.
Crystals 07 00071 g004
Figure 5. (a) SEM image of the sintered 1.0% graphene/Cu2SnSe3 composite; (b) energy dispersive X-ray spectroscopy (EDS) analysis.
Crystals 07 00071 g005
Figure 6. High-resolution TEM (HRTEM) image of graphene nanosheets in the graphene/Cu2SnSe3 sample.
Crystals 07 00071 g006
Figure 7. Field-emission SEM (FESEM) image of fractured surface of the sintered graphene/Cu2SnSe3 sample.
Crystals 07 00071 g007
Figure 8. Electrical conductivity of graphene/Cu2SnSe3 samples as a function of temperature.
Crystals 07 00071 g008
Figure 9. Seebeck coefficient (α) of graphene/Cu2SnSe3 samples as a function of temperature.
Crystals 07 00071 g009
Figure 10. Carrier mobility (μH) of graphene/Cu2SnSe3 samples as a function of temperature.
Crystals 07 00071 g010
Figure 11. (a) Total thermal conductivity (κ) and (b) lattice thermal conductivity (κl) of graphene/Cu2SnSe3 samples as a function of temperature.
Crystals 07 00071 g011aCrystals 07 00071 g011b
Figure 12. The dimensionless figure of merit of (ZT) of graphene/Cu2SnSe3 samples as a function of temperature.
Crystals 07 00071 g012
Table 1. Chemical composition and some physical and structural parameters of graphene/Cu2SnSe3 composites at room temperature.
x (vol %)Relative Densityσ (Ω−1·cm−1)p (1019 cm−3)μH (cm2/V·s)α (μV/K)κl (W·m−1·K−1)m* (m0)
098.7%1273.7421.21312.652.6
0.2598.1%2555.4329.399.82.362.8
0.5098.0%2855.8630.492.02.592.9
0.7597.8%3136.1331.978.72.922.7
1.0097.5%4488.1634.369.93.243.1
x: volume fraction; σ: electrical conductivity; p: charge carrier concentration; μH: carrier mobility; α: Seebeck coefficient; κl: thermal conductivity; m*: density of states effective mass