1. Introduction
Triaminotrinitrobenzene (TATB) is a high explosive (HE) molecular crystal used in some polymer bonded explosives (PBXs) designed to be relatively insensitive to accidental initiation, for example, from impact or fire. Macroscale models of the thermomechanical response of PBXs used to simulate material response under such scenarios are often based on phenomenology including viscoelasticity of binder [
1], intergranular and transgranular fracture, and viscoplasticity [
2]. In order to capture detailed physical processes associated with the deformation of PBX materials, it is becoming widely recognized that new models must connect critical aspects of the material microstructure with an improved understanding of deformation mechanisms at that scale to build up realistic macroscale constitutive models. For example, in the case of TATB-based explosives, such as PBX 9502, it is recognized that anisotropy of the TATB particles leads to an irreversible accumulation of deformation (both volumetric and volume-preserving thermal strain) as the material is repeatedly cycled through a temperature history [
3,
4], a phenomenon often referred to as “ratchet growth”.
Capturing this behavior in macroscale constitutive models requires understanding the anisotropy of single crystals as well as their collective interaction. There are three sources of anisotropy in TATB crystals that complicate mechanisms of polycrystal response. First, TATB (C
6H
6N
6O
6) has a triclinic crystal structure with space group
that is a source of crystal anisotropy [
5,
6]. As depicted in
Figure 1, each triclinic unit cell of TATB possesses two TATB molecules, each comprising a modified benzene ring. The bonds contained within the modified benzene ring (colored brown in
Figure 1) are sufficiently strong so that the molecules remain flat and aligned in layers along the (001) crystallographic plane (highlighted in blue). The intermolecular bonds formed within these molecular layers of TATB are strong hydrogen bonds, while the bonds between adjacent layers are of relatively weaker van der Waals type, thus providing a second source of anisotropy. For example, TATB thermal expansion is approximately 20 times higher along the c-axis than for the a- and b- lattice directions [
6,
7,
8]. Finally, the geometric morphology of TATB crystals is also anisotropic; depending on the synthesis route, they can be high-aspect ratio graphite-like platelets corresponding to crystallographic (001) planes [
9,
10].
Because of the pronounced anisotropic properties of TATB particles in combination with the non-random crystallographic texture of pressed aggregates, the latter exhibit anisotropic thermomechanical properties [
8,
11,
12]. Understanding and ultimately predicting the crystallographic texture of TATB-based explosives and its influence on thermomechanical properties is critical for interpreting experimental data obtained from specimens of a variety of processing techniques, since they often have different texture. For example, the uniaxial thermal strain of a non-textured specimen would be lower than for a die-pressed specimen measured in the pressing direction (cf. [
12]).
There have been efforts over the last few decades to measure the texture of uniaxially pressed TATB crystals [
8,
11,
13,
14]. These generally found that the (001) plane normal was preferentially aligned with the compaction direction. Modeling the evolution of this texture from randomly-oriented loose powder to the consolidated pellet has been a more recent challenge. Schwarz et al. [
11] adopted the phenomenology that the TATB crystals align with the direction of maximum shearing strain during compaction, based on the idea that shear-driven slip is accommodated by the graphitic planes of the material. However, this method results in an alignment of the (001) poles in an axisymmetric ring inclined 45° from the pressing direction. Recently, Luscher et al. [
12] and Buechler et al. [
15] applied the March [
16] theory to model the TATB powder-to-pellet compaction process at the mesoscale for uniaxial die pressing and for a more general engineered component, respectively. That model results in a realignment of TATB (001) poles with the direction of smallest (i.e., most compressive) principal stretch; for uniaxial compression this results in (001) alignment directly along the pressing direction. In both cases, the model results qualitatively matched the experimental data; however, the corresponding experiments did not have sufficient description or enough control of the compaction process to enable direct model comparison for the evolution of texture during the consolidation process.
In this work we have used neutron diffraction to measure, in situ, the evolution of the preferred orientation of explosive crystallites during the consolidation of an explosive pressing. Loose TATB powder and neat-pressed (i.e., no polymeric binder) pellets were measured at the Lujan Center spallation neutron source at the Los Alamos Neutron Science Center (LANSCE). Based on the previous work of Mang and Hjelm [
17], Yeager et al. [
18], Chellappa et al. [
19], and Yeager et al. [
8], neutron diffraction was identified as a suitable measurement technique. Of especial importance to this effort, the low attenuation of neutrons by many structural materials enables using an aluminum die without significantly affecting the measurement. In addition, the beam cross section at the Lujan Center is sufficiently large (100 mm
2) to interrogate millions of the 10–100
m-sized TATB particles, thus providing excellent grain statistics for texture analysis of the bulk material rather than the near-surface layers with X-rays [
20]. Furthermore, neutron diffraction does not require sample preparation, which is a benefit for characterizing explosive materials, which further enhances the ability of LANSCE to handle these materials in a user facility. In order to evaluate feasibility of the technique, this investigation used deuterated TATB (d-TATB) in order to ensure sufficient signal-to-noise ratio (or non-attenuated diffraction intensity) through walls of the die. In particular, deuterated material is used because of the strong incoherent scattering from hydrogen and the larger scattering factor for deuterium.
Using these measurements, the original texture evolution model has been extended to account for various stages of consolidation that have a varying influence on the rearrangement of TATB particles. A large body of work exists on in situ neutron diffraction characterization during deformation combined with deformation modeling, ranging from cubic materials (e.g., steel, [
21]) to hcp (e.g., magnesium, [
22]) to monoclinic material (e.g., uranium–niobium alloy, [
23]). This study extends in situ neutron diffraction measurements during deformation to materials with triclinic crystal structure. Furthermore, such in situ deformation studies to characterize active deformation mechanisms may produce data for comparison to simulated defect structures such as in Mathew and Sewell [
24].
2. Materials
This work used specially synthesized d-TATB, which is also referred to in the literature as TATB-d6 (cf. [
25]). The d-TATB required for the compaction experiments was synthesized using the approach developed by Benziger [
26], but substituting deuterated ammonia (ND
3) for ammonia (NH
3). Synthesis of d-TATB employed trichloro-2,4,6-trinitrobenzene (TCTNB) that had been previously obtained by nitration of trichlorobenzene following the process outlined by Benziger. Subsequently, 40 g of TCTNB was dissolved in 250 mL of dry toluene, and loaded into a stainless steel pressure vessel (1000 mL volume) with a Teflon stir bar. Once the vessel was sealed, it was evacuated for 15 min using a roughing pump. Deuterated ammonia (ND
3) (Aldrich, 99%) was introduced into the vessel and contents were stirred continuously to a gauge pressure of 275 kPA (40 psi). After the valve was closed, the pressure dropped rapidly as the ND
3 was consumed in the reaction. The vessel was continuously backfilled to 275 kPA and closed off (approximately 15 repeats over a period of
h) until no significant drop in pressure was observed after the ND
3 inlet valve was closed off. The temperature of the pressure vessel increased as the reaction progressed, but no external heat was supplied to the vessel. The reaction was allowed to continue 3 h in the sealed pressure vessel. The excess pressure was then vented in the fume hood, and the yellow precipitate was filtered and washed with dry toluene. The product was subsequently washed with hot water and acetone, then dried overnight under vacuum at 60 °C. This process had a yield of 91.6%, producing 30.7 g of d-TATB. The deuteration was verified using proton nuclear magnetic resonance and confirmed by varying the deuterium to hydrogen ratio in the diffraction profile refinement, both indicating that substantially all of the hydrogen was replaced by deuterium excepting trace impurities from subsequent exchange with the ambient atmosphere.
Figure 2 shows representative scanning electron micrographs (SEM) of (a) conventional, plant-manufactured TATB powder and (b) the lab-scale synthesized d-TATB powder used in this study, and (c) d-TATB particles after consolidation. Individual platelets of TATB are typically sub-
m thick and range from several
m to tens of
m in diameter. A comparison of the particle size distributions as measured by light scattering is included in
Figure 3. Particle size was obtained using laser light scattering in a Beckman Coulter LS 13 320, which uses low angle forward light scattering to analyze particle size, assuming that the particle is spherical. TATB and d-TATB particles were processed through the instrument to provide the particle size distribution. The instrument was calibrated using a paste with 1% solids with a known particle size distribution. While it would be useful information, it is prohibitively difficult to directly measure aspect ratio and size of individual platelets since they tend to agglomerate. In this context, it is reasonable to consider “particle size" as measured by light scattering to be more representative of “agglomerate size", where the agglomerates are a stack-up of several platelets.
From
Figure 2 and
Figure 3, it is clear that both the particle morphology and size of the d-TATB used in this investigation are different than for typical, plant-manufactured lots of conventional TATB. This is primarily due to differences in the reaction conditions under which the materials were produced, and not associated with any factors attributed to the presence of hydrogen vs. deuterium. For example, process variables that will affect the final particle size distribution and morphology include the stirring rate/agitation, reaction temperature, concentrations, and ammonia feed rate. In previous theoretical modeling, the plate-like morphology of the normal-TATB particles (cf.
Figure 2a) was presumed to play a significant role in the reorientation process. On the other hand, the d-TATB particles used in this work (cf.
Figure 2b) initially appear as oblate spheroids with a lower aspect ratio than normal-TATB. In
Section 4, it is supposed that cleavage fracture of particles like those depicted in
Figure 2b during initial consolidation lead to the more plate-like morphology exhibited in
Figure 2c. Indeed, cleavage of TATB crystals along
planes during consolidation has been considered to play a critical role in other aspects of its thermomechanical behavior [
5,
11,
27,
28,
29].
3. Experimental Method and Results
Uniaxial die pressing is a relevant experimental case for model development because (1) the deformation field is relatively easy to describe; and (2) many PBX test specimens for characterization experiments are pressed using cylindrical dies. Here, d-TATB powder was loaded into a high strength aluminum die and placed into an Instron load frame in the Spectrometer for Materials Research at Temperature and Stress (SMARTS) at the Lujan Center [
30]. The SMARTS is well-suited to monitor very small changes in the intensities of specific diffraction peaks [
30], obtaining high resolution due in part to the small amount of peak broadening originating from the instrument.
To achieve adequate neutron scattering statistics, as well as to compare with commonly used HE pellet sizes, the diameter of the die was chosen to be
mm (
"). A specimen aspect ratio of 2.4 was chosen to effectively accommodate the
angles of the incident and diffracted beams and limit the amount of shading from the plungers. Accordingly, the ideal as-pressed length of the pellet is
mm. Typical densities for neat-pressed TATB range from 1.8 to 1.9 g/cc [
6,
31,
32]. For a
-mm diameter pellet at a 1:1 aspect ratio (i.e., height of
mm), a pressure of
MPa is usually sufficient to press normal TATB to
g/cc [
33]. However, because of the relative increase in wall friction effects, the longer aspect ratio of a SMARTS sample necessarily means the as-pressed density of the in situ compacted pellet is expected to be approximately 10% lower than normal.
Generally, HE uniaxial pressings are carried out using relatively thick stainless steel dies. Often, the pressing operation is conducted using heating, holding the material under high pressure, and cycling the load in order to achieve maximum pellet density. The compaction experiment conducted in this research was designed to be similar to typical HE pressing conditions with two primary adjustments made to mitigate experimental concerns, viz. (1) stainless steel would likely attenuate too much of the beam resulting in inadequate signal-to-noise; and (2) heating the die above ambient conditions during compression is not feasible due to the type of equipment, the available space in the instrument room, and the safety protocol governing heating of confined explosives. The second concern was not addressed within the scope of this experiment other than to conduct the compaction at room temperature. In order to balance between the desired final pellet density with signal-to-noise ratio of the diffracted neutron beam, while ensuring an acceptable margin of safety against die rupture, a high-strength aluminum alloy (6061-T91) die was used instead of typical stainless steel. For a given margin of safety from die rupture, 6061-T91 aluminum results in less neutron attenuation than stainless steel. However, the additional wall thickness needed to accommodate the consolidation stress requisite for attaining typical pellet densities, would cause an unacceptable increase in neutron attenuation. Thus, MPa was kept as the maximum consolidation pressure, recognizing that the final pressed density would be lower than typical.
An aluminum die-and-plunger press was machined according to the schematic in
Figure 4. The plungers or rods and the inside of the die were polished to a mirror finish to avoid trapping and pinching HE crystals between the plunger face and die wall. A total of
g of d-TATB was loaded into the die, lightly hand-packed to avoid loss of material, and the plungers inserted into die prior to setup at the SMARTS. A 10 mm × 10 mm square beam was used to probe across the 9.5-mm-diameter specimen at an angle of incidence of 45° from the specimen’s cylindrical axis.
After aligning the sample on the Instron frame on the SMARTS instrument, initial measurements were made to ensure that the d-TATB powder specimen was adequately positioned within the neutron beam. An example diffraction pattern and the corresponding fits from full-pattern Rietveld refinement are shown in
Figure 5. Changes in diffraction peak positions (corresponding to strain), peak width, and peak intensity were computed from data collected using the SMARTS via the GSAS package [
34,
35] and SMARTSware [
36]. Specifically, the diffraction data was analyzed by fitting the orientation distribution function (ODF), represented by a spherical harmonics model, to a single pattern. While this approach does not provide a reliable ODF due to the insufficient coverage in orientation space provided by the SMARTS instrument, it can be used to provide an inverse pole figure for the sample direction corresponding to the diffraction vector for the given detector. This approach was used to measure the relative change in diffracted intensity from (002) along the consolidation direction. The detector configuration allows for measurements with scattering vectors parallel to the compaction axis (longitudinal) and perpendicular to the compaction direction (transverse) as seen in
Figure 4. In addition to realignment of (001) derived from the Rietveld refinement, we also determined the intensity variation of the diffraction peak observed at about
(cf.
Figure 5). Although this peak contains intensity from three reflections, the
,
, and
peaks, almost all of the intensity is from the
reflection, which can be seen from the magnitudes of the structure factors listed in
Table 1. Thus, the in situ texture change during compaction was quantified by two independent analyses of the diffraction data; the relative change of the (001) pole density from the Rietveld refinement and the relative change of the peak intensity of the (002) reflection by single peak refinement.
During the consolidation experiment, compaction of loose d-TATB powder into a final pellet was paused briefly at several times to collect diffraction data in situ. The SMARTS load frame was operated using displacement control, such that during collection of diffraction data the consolidated pellet length was held fixed. This enabled some relaxation of the material over the approximately five-minute measurements, which is visible in the data presented in
Figure 6a. A total of 34 measurements were taken over the course of the compaction, approximately evenly spaced in the resulting axial force from each other. The final compacted d-TATB pellet length was
mm, yielding a final pellet density of
g/cc, or approximately 90% of the target density of
g/cc and resulting in an axial stress of at
MPa. As noted above, this discrepancy is attributed to the larger aspect ratio than used in conventional uniaxial pressings.
The resulting uniaxial stress (negative for compression) versus the uniaxial stretch (
) is plotted in
Figure 6a. Note, uniaxial stretch,
, is related to the small strain measure of
. The vertical portions of the curve represent the viscous relaxation of the d-TATB while the pellet is held at a fixed length, i.e., consolidated density, for the duration of each neutron data collection period/dwell time. The corresponding plot of relative (001) pole density aligned with the pressing (
Z) direction, is plotted versus compressive stretch in
Figure 6b. Here pole densities are expressed as multiples of a random distribution (MRD), where a value of one indicates the same relative likelihood for a particular orientation as in a non-textured material. Consistent with measurements of Cady [
13] and Yeager et al. [
8], the measured (001) intensities evolve during compaction because of the reorientation of TATB (001) poles towards the pressing direction while (100) and (010) poles generally reorient away from the pressing direction as needed to geometrically accommodate the preferred alignment of (001).
The evolution of density of (001) poles aligned with the pressing direction (relative to initial) during compaction is computed with high confidence by measuring an inverse pole figure along an individual sample direction with the SMARTS instrument. However, unambiguous determination of the full orientation distribution of triclinic crystals is not possible with the SMARTS using two detectors. After the experiment was conducted on the SMARTS instrument to the final pressed pellet density of
g/cm
3, the full texture of the resulting pellet was measured using all 45 detector panels of the high pressure preferred orientation (HIPPO) diffractometer [
20,
37] at the LANSCE Lujan Center. The data analysis performed to determine texture from data collected using HIPPO followed procedures described by Matthies et al. [
38], and Wenk et al. [
39]. The sample was not removed from the die between the in situ measurements performed using the SMARTS and the final texture measurements using HIPPO; however, a small amount of relaxation in the sample during that period of time was possible. Prior to the in situ measurements on the SMARTS, the 10 mm × 10 mm beam center on the SMARTS was marked on the exterior of the sample die. When the specimen was subsequently mounted within the 10-mm diameter beam at HIPPO, this fiducial marking was used to align the specimen with a similar incidence. Thus, similar, although not identical, representative volumes were probed on both the HIPPO and SMARTS instruments.
The HIPPO data for texture was analyzed using the GSAS Rietveld package [
34] operated with a script written in gsaslanguage [
35]. Due to the limitation of GSAS of refining a maximum of 99 histograms simultaneously, with some of those histograms taken up by constraints, a total of 96 histograms were included in the refinement. The histograms were manually selected to optimize the coverage of the histogram locations projected in pole figure space, i.e., minimizing the number of closely located histograms and avoiding larger gaps in the coverage. Refined parameters included the background parameters for each histogram; the diffractometer constants that relate neutron time-of-flight to d-spacing (thus, recalibrating the sample location with the aluminum lattice parameter as an internal standard); lattice parameters for d-TATB (using the structure published by Cady and Larson [
5] as starting values); eighth- and sixth-order spherical harmonics description of the ODF for aluminum and TATB, respectively; thermal motion parameters for each atomic species (i.e., one for Al and four for TATB, thus constraining that C, N, O, and H atoms have the same thermal motion parameters); peak width parameters; and absorption parameters. The parameter turn-on sequence was controlled by the gsaslanguage script to avoid refining highly correlated parameters (e.g., thermal motion and absorption parameters) simultaneously until parameter values of substantially better fit than the initial values were identified. The refinement consisted of 19 steps with the final step refining 1252 variables for 197,793 data points from the 96 histograms, resulting in an overall reduced error (
) of 42.83,
of 3.21%, and
of 4.83 (see Toby [
40] for an explanation of R factors in Rietveld analysis). Pole figures were computed from the refined ODF using the GSAS program POLFPLOT and exported in popLA data format [
41].
4. Theory
Self-consistent homogenization schemes, such as the viscoplastic self-consistent (VPSC) theory are frequently applied to characterizing evolving texture within polycrystalline materials for cases when the grain boundaries can be represented as nearly perfect bonds [
42]. On the other hand, the explosive d-TATB is initially a loose powder and does not have perfectly bonded, i.e., relatively rigid grain boundaries. The Green’s function solutions that are an integral part of Eshelby-based self-consistent homogenization schemes do not pertain to the case of particle sliding without modification. We note that recent developments by Bennett et al. [
43] seek to ameliorate this limitation for application to granular materials such as explosive powders whose particles can interact, for example, by sliding. Furthermore, it is unlikely that the deformation mechanisms associated with the development of texture in powdered microstructures are related to dislocation-mediated intra-crystalline slip. Schwarz et al. [
11] developed a phenomenological model by assuming that shear-driven slip is accommodated on the graphitic (001) planes of the material such that TATB crystals align with the direction of maximum shearing strain during compaction. However, the predicted preferred orientation of (001) using this assumption is inconsistent with published results for uniaxial pressing [
8,
12]. As noted by Sintubin et al. [
44], crystal plasticity-based theories may not be justified for explaining the texture evolution of such materials and that it is likely necessary to refine models such as that of March to allow for rigid-particle interactions. Here we apply the approach followed by Luscher et al. [
12] and Buechler et al. [
15] using March [
16] theory to model the TATB powder-to-pellet compaction process.
March [
16] developed a model describing the orientation distribution of aggregates of plate-like crystals that have undergone deformation. The phenomenology of the model is purely geometric by assuming that, because of the pronounced aspect ratio of plate-like crystals, the crystallographic planes oriented normally to the thickness direction of each particle convect with the deformation. Tullis [
45] demonstrated that the preferred orientation acquired by ellipsoids of much less extreme aspect ratio approximate that of March’s theory (cf. also Oertel [
46].)
Application of the March theory to cases of volume-preserving deformation along a primary axis results in the March–Dollase [
47,
48] orientation distribution and has seen extensive use for experimental characterization of a variety of materials (cf. [
45,
49,
50]). During the consolidation of powders comprising high aspect ratio particles, the same approach is useful, but the deformation is generally not volume-preserving because space that is initially occupied by voids prior to consolidation is removed during the process. Luscher et al. [
12] applied the March theory to predict texture of pressed explosives consolidated from loose powder. Here we follow this approach to develop an expression for the evolution of pole density with uniaxial deformation during powder compaction of high-aspect ratio particles.
4.1. Original March Theory
According to the March theory, prominent vectors associated with the particle morphology convect with the overall macroscopic deformation field. The direction normal to a surface of a plate-like particle morphology, i.e.,
, is a
covector which convects with the deformation field according to (cf. [
12])
where
is a unit vector normal to a particular plane in the reference configuration,
is the (non-unit) normal to the same plane in the current configuration and
is the spatial gradient of the macroscopic deformation field and is used to map from the undeformed reference to deformed current configuration. We parameterize this orientation space by the angles
and
such that
.
The material is deformed from its unconsolidated reference state into its current configuration by the deformation of the consolidation flow such that each of the particle poles with initial orientation
is now aligned with
. The length of each reoriented covector represents the radius of an associated deformed sphere
, i.e.,
where the
unit normal
. This radius is inversely proportional to the material stretch,
, because material vectors convect with
rather than its inverse. Based on the relationship of the infinitesimal regions of orientation space over which the normalized pole density is computed [
12], the relative pole density in the consolidated state is computed as:
The dominant or preferred orientation exhibited by the model is that orientation which maximizes Equation (
3). If the initial powder has no texture in the reference state, i.e.,
, then the maximum of Equation (
3) occurs at an orientation
which maximizes Equation (
2). By inspection, it is clear that this orientation is obtained by solving the eigenvalue problem:
where
is the eigenvector corresponding to the smallest eigenvalue,
. Thus,
is the smallest principal stretch of the deformation and the preferred orientation,
, is the eigenvector of the
left Cauchy deformation tensor
.
If we further decompose the deformation
into components reflecting volume change,
, and volume-preserving shape change,
, then Equation (
2) can be expressed as:
Substitution of Equation (
5) into Equation (
3) results in:
which suggests that, according to the March theory, the strength of texture is independent of the relative volume change during consolidation.
4.2. Application to Uniaxial Die Pressing
Application of Equation (
3) to the case of uniaxial die-pressing is relevant because (1) the deformation field is relatively uniform and easy to describe and (2) it provides an experimental configuration for which in situ measurements of evolving texture can be directly interpreted. As the piston compresses the material in the die, the flake-like particles will preferentially reorient such that their basal normal gradually aligns toward the pressing direction, which is the eigenvector,
, of the macroscopic deformation.
Assuming an initially uniform orientation distribution, i.e.,
such that there is no preferred orientation of crystallographic (001) planes, and uniaxial deformation of a specimen along the z-axis from an initial thickness
to a final thickness
d such that
, the minimum eigenvalue of stretch
, leads to:
Equation (
7) can be extended to cases where
, by careful inclusion of the relationship between
and
. Note, Equation (
7) is different from the March–Dollase equation [
48] often used in Rietveld refinement for some materials [
50], because that expression was developed for volume-preserving deformation. Our Equation (
7) is consistent with the expression given by Baker et al. [
49] for uniaxial consolidation of clay and shale. In an investigation closely related to this research, Tullis [
45] compared predictions of texture evolution using the March model with measurements obtained using in situ x-ray diffraction during consolidation of various powdered micas. The March–Dollase equation has also been used to describe texture of templated grain growth
-alumina, sintered gel-cast
-alumina platelet composites [
51], and molybdite and calcite powders [
52] for example. In those efforts, a parameter corresponding to the deformation ratio,
, is used as a refinement parameter to characterize the observed pole density distribution of the final as-processed microstructure. More recently, Tutuncu et al. [
53] have used the March–Dollase method to study templated grain growth in situ during sintering of piezoceramic materials.
4.3. Modified March Theory
The objective of this work is to measure the uniaxial deformation and the corresponding pole density such that
is not a free-fitting parameter. As discussed with more detail in
Section 5, our results indicate that the predicted magnitude of texture is larger than what is measured for a given amount of uniaxial stretch,
. Seabaugh et al. [
54] used a weighted March–Dollase expression in which it is assumed the orientation of a volume fraction of particles,
, is unaffected by the deformation, thus resulting in a weighting of the initial and March pole densities, i.e.,
Here, we propose a new extension of March’s theory, which we refer to as the modified March theory, based upon the three-stage consolidation phenomenology depicted in
Figure 7. Initially, the die contains a loose powder of moderately oblate spheroidal particles such as those depicted in
Figure 2b. This state corresponds to a uniaxial compression ratio of
. The early stage of consolidation is accommodated by rearranging the position of otherwise rigid particles in order to reduce the free volume within the aggregate. While the aggregate material undergoes uniaxial stretch of
during this stage, the crystals are undeformed (on average) such that the mean crystal stretch ratio
and crystals have no net mean reorientation. During the second phase of consolidation, the particles are interacting with each other more strongly and a multi-granular load path of significant compressive stresses forms. Our theory assumes that the accompanying shear stresses lead to cleavage fracture along the relatively weak (001) crystallographic planes within TATB particles. This fracturing process evolves the initially spherical particle morphology into clustered stacks of aligned high-aspect-ratio platelets. Finally, in the latter stage of consolidation these platelets are rearranged in accordance with the geometric evolution theory of March [
16]. These three continuous and overlapping stages of deformation lead to an evolving proportion of the extent of crystallite deformation within the aggregate material. In order to express this evolving relationship, we propose the following differential relationship, i.e.,
where
is the rate of compressive stretch accommodated by high-aspect-ratio fractured crystal particles and
is a proportionality function. The proportionality function is subject to two requirements based on the phenomenology of
Figure 7 where early deformation is accommodated entirely by rigid motion of particles while, at infinite compression, all deformation is accommodated by the particles themselves, i.e.,
While the texture evolution theory is entirely kinematic (it does not depend upon explicit distribution of driving forces), the proportionality function
serves as a constitutive approximation for the proposed phenomonology. We propose a simple expression that satisfies Equation (
10), i.e.,
Integration of Equation (
9) with Equation (
11) leads to an explicit relationship between the uniaxial stretch of the aggregate pressing and the mean uniaxial stretch of a high-aspect-ratio crystallite, i.e.,
Finally, effective pole density is estimated from Equation (
7) by evaluating at
.
5. Comparison of Simulation and Experimental Results
Our experimental results confirm that during consolidation, the (001) poles (geometrically equivalent to (002)) reorient to align with the pressing direction in uniaxial die pressings. The relative change in (001) pole density aligned in the pressing direction predicted using the original March [
16] theory is compared with our measurements from the in situ compression on the SMARTS instrument in
Figure 8a. The theory over-predicts the accumulation of texture at all levels of consolidation. The slope of the predicted texture evolution (red curve) indicates that the model predicts significant texture evolution immediately in the consolidation process, i.e.,
. On the other hand, the corresponding slope of the measured texture is nearly zero at
. The approximately zero slope of the measured pole density versus stretch at the initial state is consistent with the alternate mechanism accommodating early deformation proposed in
Section 4 and
Figure 7.
Figure 8b (thin blue curve) demonstrates an improved match of model results with measurements by using the weighted March distribution of Equation (
8) and adjusting
w as a free fitting parameter. In this case, a weighting parameter value of
leads to good agreement of the relative change in (002) pole density aligned in the pressing direction with that measured in the final pressed configuration (
). However, the slope of the simulated (thin blue) evolution curve in
Figure 8b indicates that the weighted March theory is inadequate in describing the evolution of texture. As with the original March theory, the weighted March theory cannot adequately capture the increasing rate of (001) pole rearrangement throughout the consolidation process.
Finally,
Figure 8b demonstrates agreement between the evolving (001) pole density measured during the experiment and simulations employing our modified March model (thick red curve) using Equations (
12) and (
7). The material exponent
m was used as an empirical free fitting parameter; the plot in
Figure 8b depicts model results that employ a value of
. The evolving proportionality of the amount of deformation accommodated by rigid rearrangement of particles versus deformation of the particles themselves is represented by Equation (
11). While the effect of introducing this phenomenology to the texture evolution model is to delay the onset of texture evolution, which is in accordance with the measured data, there is no physical significance assigned to particular values of
m.
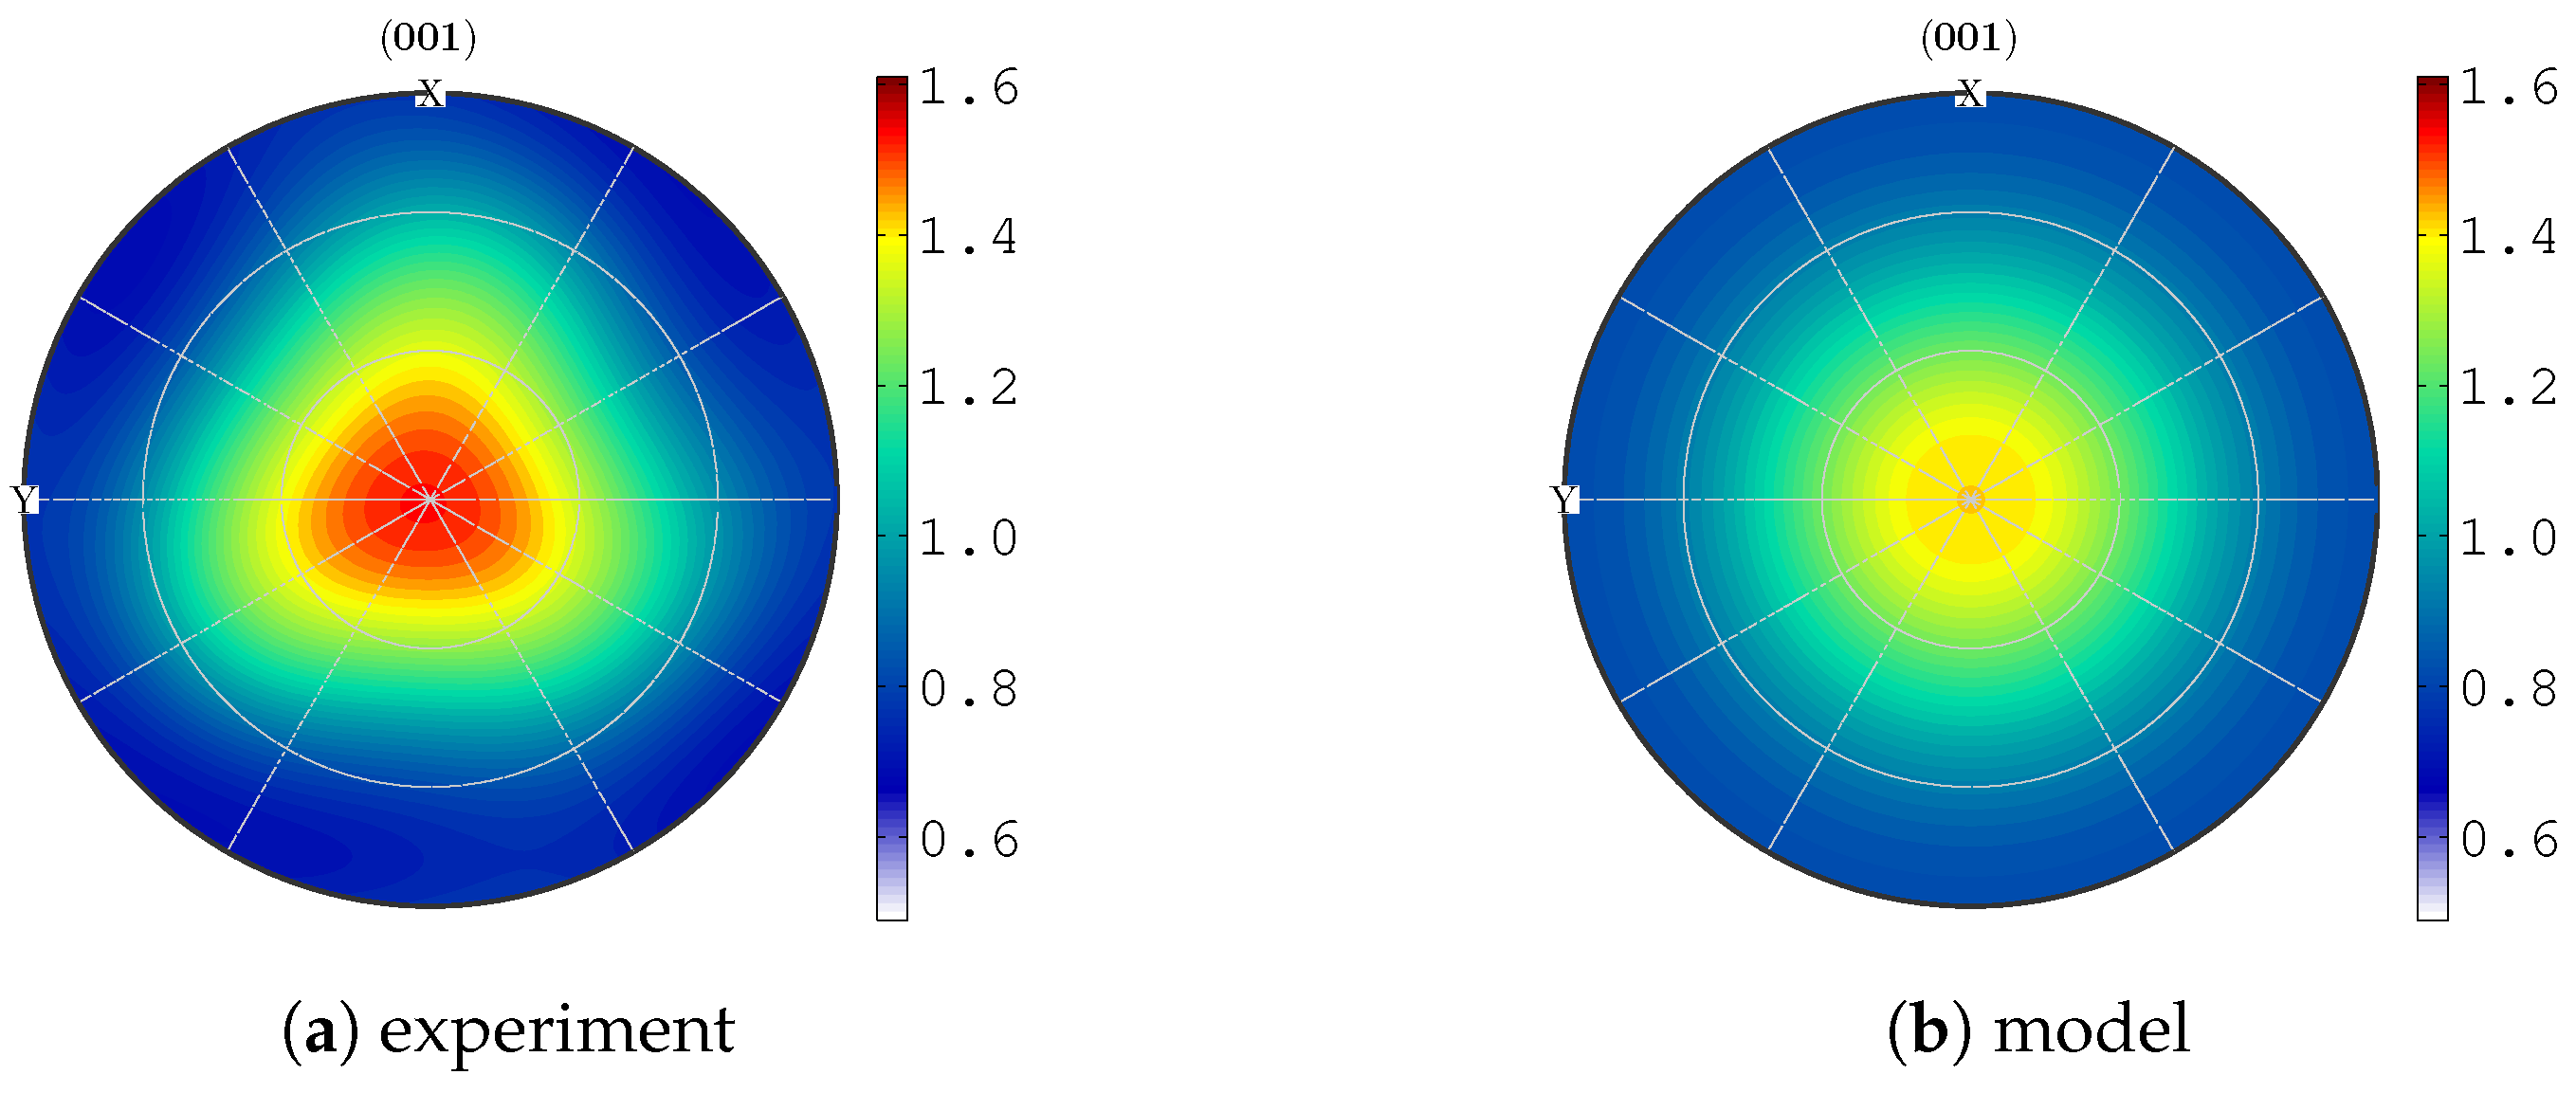
The (001) pole figures computed from an orientation distribution function fit to the diffraction intensities measured on the HIPPO diffractometer are presented in
Figure 9a. The peak intensity of the (001) pole figure (i.e., ≈1.75) is larger than the corresponding relative change in (002) diffracted intensity measured along pressing direction using the SMARTS instrument (i.e., ≈1.5). This difference could be attributed to the initial powder having non-uniform orientation distribution prior to beginning the consolidation experiment. Future work will attempt to characterize the initial orientation distribution in more detail.
Both the original and our modified March theory lead to analytical expressions of relative pole density for the concerned pole—in the case of TATB it is the crystallographic (001) pole—under specific idealized cases of deformation such as uniaxial deformation. Luscher et al. [
12] developed a numerical approach to generate a discrete representation of the full crystallographic orientation distribution function for arbitrary deformation
. That approach was employed here to compute a discrete representation of the orientation distribution function from which the (001) pole figure was computed corresponding to the final as-compacted texture predicted by our modified March theory. The predicted pole figures are plotted in
Figure 9b for comparison with corresponding pole figures from the neutron texture analysis after the compression on HIPPO in
Figure 9a. The measured and simulated (001) pole figures exhibit similar, approximately axi-symmetric distributions about the pressing direction (i.e., center of pole figure). However, the pole figure from experiment is not perfectly axisymmetric as predicted by theory. Additionally, the peak magnitude resulting from our modified March model (≈1.5) is smaller than that measured using HIPPO (≈1.75), because the modified March theory was fit to measurements from the SMARTS. In this case, the relative change in (002) intensity of ≈1.5 measured using the SMARTS is lower than the final peak (001) MRD of from HIPPO (≈1.75); this difference may indicate that the initial powder texture was not random (i.e., MRD
). We note that while texture analysis of structural materials (e.g., steels, magnesium or zirconium alloys etc.) is routine, the texture analysis of a triclinic material with any probe is less common (e.g., Drummy and Martin [
55]). New analysis approaches, e.g., by selecting the d-spacing range, using d-spacing ranges not routinely used for materials with smaller unit cells, the ODF description and resolution, and treatment of neutron beam attenuation by the incoherent scattering by hydrogen atoms had to be developed and are under continued development.


 ,
, 


