Modeling and Analysis of Novel Horizontal Ribbon Growth of Silicon Crystal

1
School of Mechanical Engineering, Jiangsu Collaborative Innovation Center for Photovoltaic Science and Engineering, Jiangsu Province Cultivation base for State Key Laboratory of Photovoltaic Science and Technology, Changzhou University, Changzhou 213164, China
2
Micro/Nano Science and Technology Center, Jiangsu University, Zhenjiang 212013, China
*
Authors to whom correspondence should be addressed.
Crystals 2018, 8(1), 36; https://doi.org/10.3390/cryst8010036
Submission received: 7 December 2017
/
Revised: 30 December 2017
/
Accepted: 9 January 2018
/
Published: 16 January 2018
(This article belongs to the Special Issue Crystal Growth for Optoelectronic and Piezoelectric Applications)
Abstract
:We present a novel horizontal ribbon growth (HRG) process and a theoretical analysis of this method. Assuming that the existence of the meniscus is defined by diffuse growth, we determine analytically the thickness and height of the meniscus and an explicit expression for the performance of meniscus under different conditions. We then calculate the thermal profile in melt part, as well as the conditions under which the undercooling is sufficient around the solidification point. We find that diffuse growth is more sensitive to small initial thickness, and find the minimum length of the melt part to obtain undercooling. Finally, we calculate the change rule of solidification position by a variational approach, as well as the stability of the process under different conditions. We also give an expression to the instability of past HRG methods.
1. Introduction
The horizontal ribbon growth technique is generally described as a technology to directly produce thin and zonal silicon crystal from silicon melt. With this technique, a heat-sink extracts heat from the surface of the solidification interface, thereby generating a vertical thermal gradient in the solidification zone. In general, growth techniques enable realization of continuous growth via continuous extraction of silicon ribbon. To date, a variety of different growth techniques have been fabricated as based on this concept [1,2,3,4], e.g., the Horizontal supported web (HSW) [5], Ribbon growth on substrate (RGS) [6], Horizontal ribbon growth (HRG) [7,8], and Floating silicon method (FSM) [9,10]; all of these methods have provided excellent ideas and references for the method we have developed and described in this paper.
The horizontal ribbon growth method was introduced by Shockley [7] in 1962, and later verified by Bleil [8] with a different substance. In 1980, Kudo [3] designed a similar process and successfully grew a silicon ribbon. Subsequently, in 1986, Hoyler [5] presented a type of method that grew ribbon on a carbonic substrate. Despite its significant technological and economic potential, an HRG method capable of solving the problem of unstable growth has not been developed. Moreover, although numerous related studies have been conducted, most of them focus on the impact of the meniscus, impurities, and/or the pulling angle associated with ribbon growth.
In terms of modeling, an HRG mathematic model was first proposed by Zoutendyk in 1976 [11]; by solving the heat transfer equation, a wedge-shaped interface was identified, and the relationship between the pulling rate and ribbon thickness was described. In 2011, Oliveros [12] designed an experiment that employed water instead of silicon to simulate the HRG process; he also developed a simple crystallization model to describe the evolution of the ice film. Through his work, he was able to further validate the mathematic model that was proposed decades before his study. In 2013, Oliveros and his colleagues [13] presented and analyzed a theoretical meniscus model, and were subsequently able to investigate the meniscus via his relatively simple polyethylene-water system and validate their theoretical meniscus model. In Oliveros et al.’s following report published in 2015 [14], he quantified the existence and static stability of the meniscus. In his presentation, the height and angle of the meniscus were described and the optimal pulling angle was found; he also investigated the influence of the shape corner of a graphite crucible on the meniscus. Daggolu [15,16,17] et al. combined heat transfer with fluid flow, interfacial phenomenon, thermal-capillary theory and crystal growth theory to discuss how meniscus influences the growth process. By implementing numerical simulations, they determined a critical value for the pulling rate at which the meniscus recedes and the melt escapes. Moreover, they think that a long wedge interface and small heat removal rate can yield a higher pulling rate and preserve sheet thickness. All of the above-mentioned studies provide general theories supporting the static stability of the silicon growth process.
These studies may provide significant analytical insight into the theoretical basis and guiding conclusions regarding HRG, but the question remains as to how to describe the respective relationships between heat extraction on the surface, pulling velocity, ribbon thickness, and location of the solidification interface. Towards the primary goal of increased speed and a stable thickness, in the DOE [10] presented by Kellerman, it was found that a considerably higher heat extraction rate is required to achieve a higher pulling rate than was previously thought. However, as it is generally difficult to fabricate a large thermal sink in such a small area, the most efficient means of increasing the heat extraction rate is impinging jet heat transfer. In previous studies, a method yielding a low heat extraction rate on the surface has been employed, and the researchers have tended to focus on how the meniscus influences the stability of the growth process. For example, as has been reported by Kudo [3], they increased the limit velocity to 85 cm/min; however, this resulted in a solidification interface that is larger than 12 cm, which thereby complicates the process of stabilization. In a simulation performed by Dagglu [15], they implemented a limit velocity of 16.6 cm/min and 32.4 cm/min to yield an interface length of L = 3 cm and 5.5 cm, respectively. Considering these previous studies, we decided to develop a novel method for HRG modeling that yields a significantly shorter interface and employs a significantly higher heat extraction rate to dissipate the freezing heat. Thus, we combined the FSM reported by Helenbrook [9], and the HRG method reported by Kudo [3] to minimize the influence of the meniscus on ribbon growth, and to implement a higher pulling velocity while also decreasing the thickness. The simulation proposed in the following sections verifies that our model is practical; furthermore, we also explain the influence of various system parameters on the growth process.
2. Analytical Model
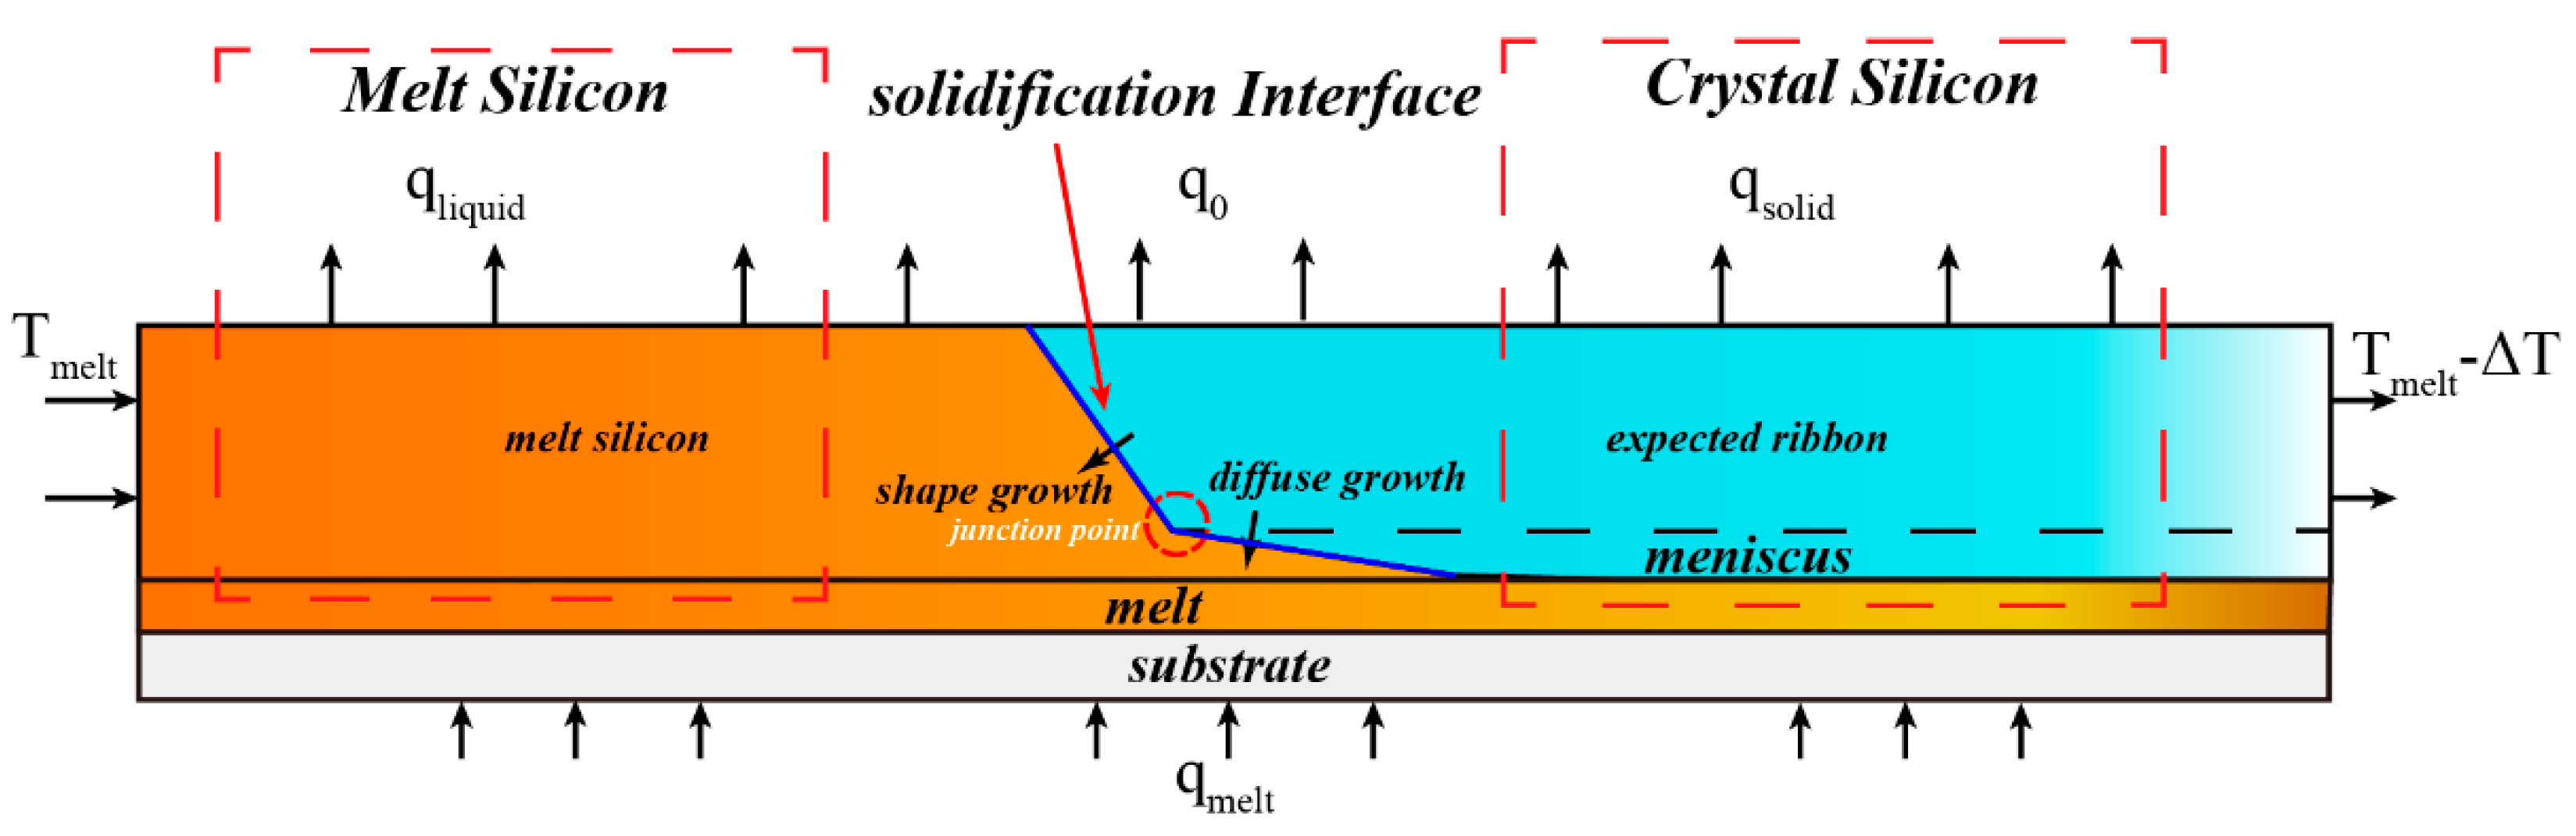
Past studies [11,12,15,17] have shown that, because of the viscosity, pulling rate, and heat extraction on the surface, an unstable meniscus forms on the underside of the silicon crystal at the edge of the crucible. Consequently, the unstable meniscus generates a heat imbalance in the growth process, which thus results in an irregular lower surface. The shape of the solidification interface will change because of the heat imbalance, thereby disrupting the crystallization process. With the aim of reducing the influence of the meniscus, we developed a new structure and attempted to grow a thin and regular silicon ribbon. A schematic diagram of the designed device is shown in Figure 1 it can be seen that it departs from the conventional structure, as we shrink the molten bath and distance it away from the solidification interface; this permits sufficient heating to maintain the melting velocity. We have also increased the length of the substrate at the edge of the crucible to facilitate the freezing process on the substrate. Furthermore, we designed a double heaters system to ensure that the bottom temperature remains as higher than the melting temperature, and that the melt at the edge will not freeze. Moreover, to enable a high heat extraction rate, a slot jet-impingement-based heat exchanger was implemented in the device design, and helium gas is used as the cooling gas to extract heat from the solidification surface. The 2-D analytical model of this structure is shown in Figure 2. In the 2-D model, we attempted to limit the meniscus growth between the crystal and silicon melt to reduce its overall growth and influence. Then, a mathematical model was developed to examine and validate the effectiveness of our attempt to restrict meniscus growth. It should be noted that, in our simulation, several variables were varied. Additionally, in our study, we have selected the <111> plane as the growth plane because of its excellent ability to act as a solar cell; the edge angle of the seeding was 54.7°. To facilitate model development, we divided the entire model into two smaller elements: the melt component and solid component.
2.1. Mathematic Model of Solid Part
2.1.1. Diffuse Growth Angle
As shown in Figure 3 and are the characteristic heat extraction on the solidification surface which include the heat extraction via radiation, convention and conduction and heat exchange on solidification interface, respectively. is the growth angle, is the diffuse growth angle, the diffuse growth length is and the diffuse thickness is . Under steady state conditions, we can have:
Substituting function (1) into (2), then we have:
2.1.2. Pulling Rate
In past studies [9,12,15], the phase change energy conservation equation is given as follows:
where is heat conductivity and thermal gradient of silicon crystal and silicon melt respectively, where in all of the following subscripts of s and m denote solid and melt respectively. and are the horizontal and vertical component of heat extraction on solidification interface, respectively. Changing the thermal gradient into heat flux, then we have:
2.1.3. Diffuse Growth Part
In our simulation, we know the diffuse angle is quite small and we approximated the proportion of heat extraction at the diffuse growth interface as follows:
where A, B and C is the coefficient for different initial thickness value, mathematical calculations are described in Appendix A. The diffuse growth thickness can be de defined as follows:
As show in Figure 3, we divided the diffuse growth part into two parts: growth part (0 ~ ) and crystal part (). In the paper presented by KMU [18], convection take the larger proportion than conduction what is defined by Péclet number. We considered the growth process as a one-dimensional thin finny heat transfer question. The heat transfer form at the solidification interface is heat conduction. So, the governing equation in growth part is:
where is the thermal diffusivity and heat conductivity respectively. But in crystal part, oppositely, heat conduction is in charge. So the governing equation is given by:
where is convective heat transfer coefficient of silicon.
2.1.4. Boundary Conditions of Solid Part
As we defined in Figure 2, diffuse part is in touch with melt silicon, so the left boundary condition of the diffuse part is:
Temperature and temperature variation is continuous at the junction of two parts, so the boundary condition for the connection is:
We assume a fixed boundary condition on the right:
To simplify the computational process, we use a fixed boundary to replace this infinite boundary condition, then we have:
where is temperature variation at the right border.
2.2. Mathematic Model of Melt Part
Heat transfer process in melt part is similar as what in solid part. In the melt part, we combine the heat extraction caused by radiation between melt surface and cold sink, conduction from hot substrate and forced-convection via slot jet as a characteristic heat extraction on the surface, so the governing equation is:
where and are the characteristic heat extraction on the surface of melt silicon and thermal diffusivity of melt silicon respectively. The characteristic heat extraction is defined as followed:
where is temperature variation and thermal resistance in melt silicon.
Boundary Conditions in Melt Part
As shown in Figure 2, melt silicon is discharged into the cold zone from the melt zone, and the temperature in the melt zone is always higher than melting temperature () to guarantee the melt will not freeze when it passes through thermal insulation layer. We assumed the melt part length is , so the boundary condition is given as:
where is temperature variation in melt silicon.
2.3. Solidification Position
As we know, the solidification position is not a fixed point and it changes when working conditions change. To study how working conditions influence the solidification position, we use the phase change energy conservation equation to determine the solidification position in steady state with different working conditions. We change function (5) into heat gradient form again, then:
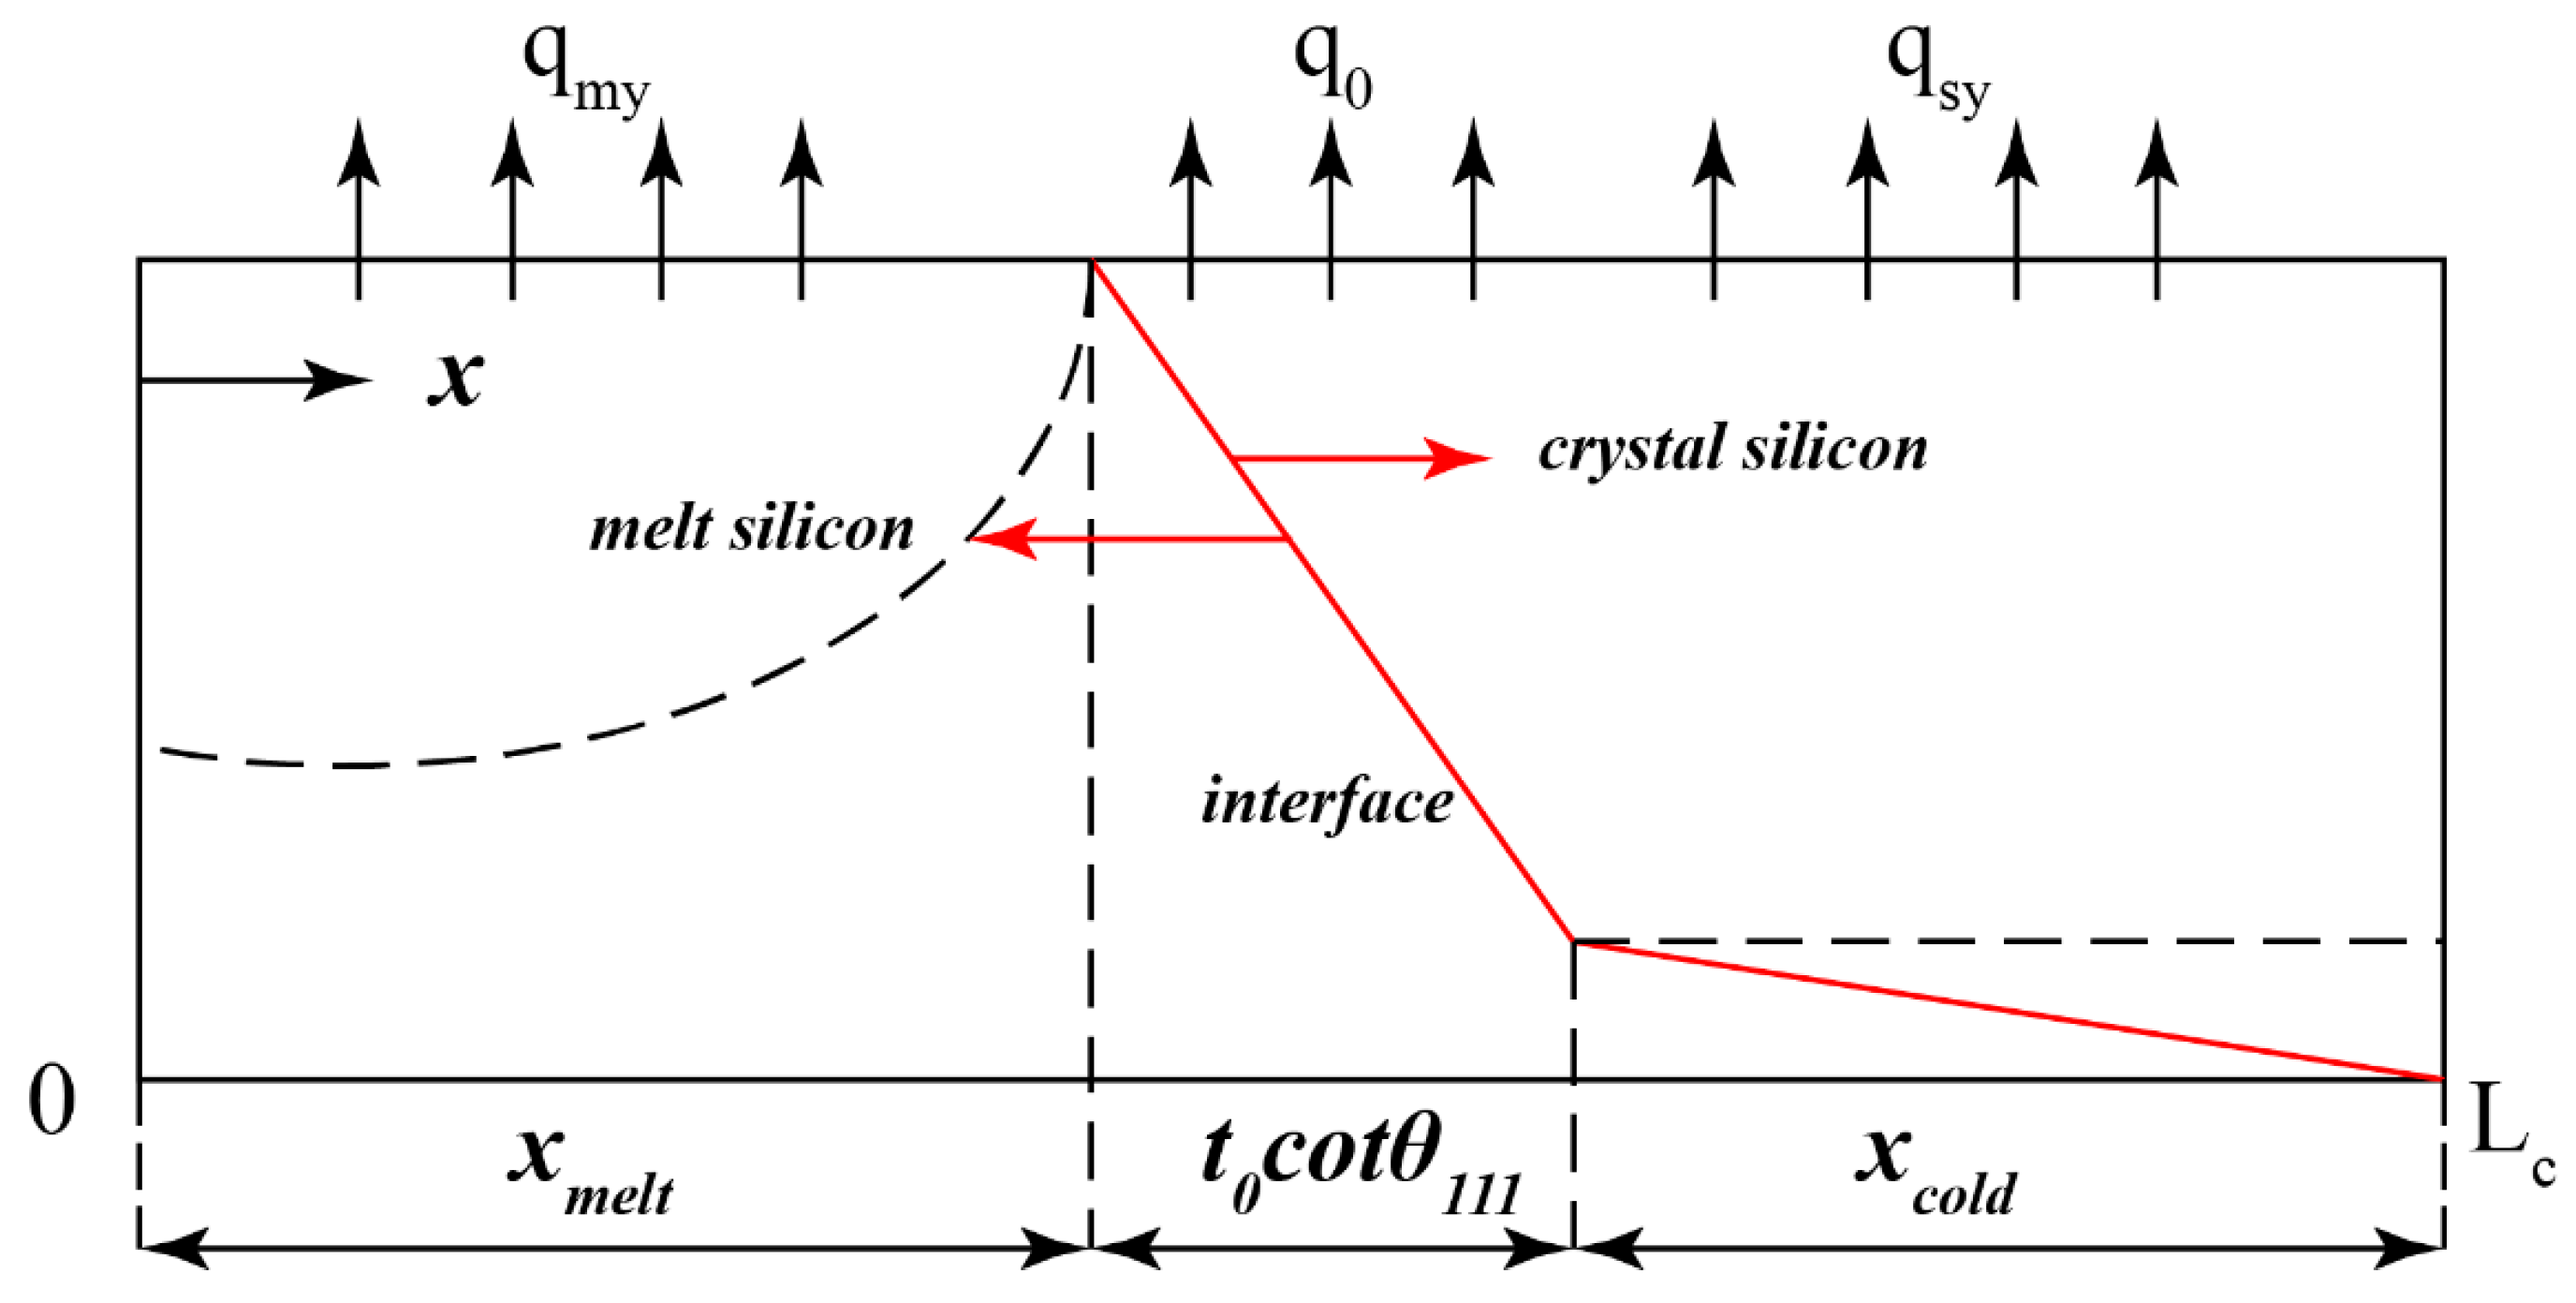
where is the heat of fusion of silicon and is the pulling velocity we expect. Then we combine the solid part model with melt part model, the whole mathematic model is shown in Figure 4. We assume that the length of this control volume is , then we can redefine as follows:
By iterative compute different to satisfied function (21) under different , we can determine the solidification position by function (22). All the values of the parameters we use can be found in Table 1.
3. Results and Discussion
3.1. Diffuse Growth Length
Numerous researchers have attempted to optimize heat extraction to achieve high and stable growth, and these researchers are in agreement that the heat extraction must rapidly dissipate melting heat. Thus, in our simulation, we investigate the effects of surface heat extraction on the solidification interface, and the effects of various parameters on the growth process. In Figure 5a, the amount of heat exchange is shown to exponentially decrease with the increase of growth length, tending to 20% of . As is shown in Figure 5b, when the initial thickness is 50, 100, or 200 , the temperature nadir is consistently on the left side of a given stop-growth point. However, when the initial thickness is increased to 300 or 400 , the temperature nadir is located on the opposite side of the stop-growth point because the influence of heat convection decreases with increased initial thickness. By simultaneously considering the results of Figure 5b and Figure 6a, it can be ascertained that the temperature nadir can be reliably obtained when the growth length is mm; this means that the final thickness can be constrained to . Furthermore, the temperature increases subsequent to reaching the nadir, which indicates the generation of a negative thermal gradient and a diffuse growth pattern.
In Figure 5c,d, the growth rate and thickness variation as respective functions of the length of the diffuse growth are given. As was expected, higher growth rates corresponded to lesser thickness and increased thickness variation. Here, the growth rate can be described as rapid when the initial thickness is small. Moreover, it can be seen that varying the initial thickness yields no significant impact on the thickness variation. A substantial change in growth length at the solidification interface was found to significantly affect the growth process, because this large change means that an increased amount of latent heat is extracted, and there is a heat imbalance. The results obtained via the study described in this section do not agree with a finding presented by Dagglou [15], as the simulation performed in this study demonstrated that a long interface may facilitate heat dissipation while also disrupting growth stability as a result of the meniscus growing in size and consequently restricting the length of silicon growth. Although sufficient heat extraction is necessary because the thickness is dependent on the rate of heat extraction, the interface length must be controlled to ensure that changes to the shape of the interface will be minimized, as this would mandate a higher heat extraction rate on the surface or a smaller initial thickness.
3.2. Temperature Boundary Layer
To understand the influence of the length of melt located in the cold zone, we calculated the temperature gradient in only the melt component, and assumed that the heat exchange amount was uniform on the surface of the melt. As is shown in Figure 6a, the degree of undercooling and size of the thermal gradient were each found to have a directly proportional relationship with the length of the melt component. Additionally, although indirectly proportional, a negative thermal gradient was observed to form about the solidification point as the length of the melt decreased. Here, it can be seen that the growth length maximum was 2 mm when the heat extraction rate was 120 W/cm2, indicating that there is no undercooling for lengths less than 2 mm. Additionally, we also found that the extent at which undercooling varies is dependent on the initial thickness value; this is because latent heat extraction decreases as the thickness is decreased, and the amount of surface heat extraction decreases as a result of reduced latent heat released through the surface. Galvin [19] reported that undercooling is dependent on the solidification velocity. Additionally, it has been previously reported that the solidification velocity increases as the undercooling temperature is increased, and that a high nucleation rate is helpful to generate smaller grains, whereas quasi-crystal and non-crystal silicon are generated when the undercooling temperature exceeds 225 K [20]. Thus, in this study, we have proposed a method to determine the limitations on melt length and the optimal growth length that would yield an appropriately sized silicon grain. As is shown in Figure 6b, under the conditions of a rate of heat extraction on the surface of 120 W/cm2, and an initial thickness value of 200 , the thermal gradient increased and the undercooling temperature decreased as the boundary temperature increased. It should also be noted that there was no undercooling in the melt when the boundary temperature exceeded 1427 °C. These findings thus provide further insight into how the length and boundary temperature influence the thermal profile in the melt. Furthermore, this numerical simulation demonstrated optimized behavior of the designed device.
3.3. Heat Exchange Amount and Pulling Velocity
In this section, we employed MATLAB (The MathWorks, Inc., Natick, MA, USA) to implement Function 21 to estimate the solidification position for varying amounts of heat exchange and pulling velocity . As is illustrated in Figure 7a,b, when the heat extraction rate increased, the solidification position shifted leftward, whereas it shifted rightward as the rate decreased. Conversely, the solidification position was found to shift rightward in response to an increase in pulling velocity, and leftward in response to a decrease in pulling velocity. These findings are consistent with those presented by Oliveros [12], which confirmed that slowly pulling the seed results in the formation of an excessive amount of ice near the lip of the bath, whereas extracting the seed too quickly would result in the ice becoming detached from the flat piece serving as a nucleation point. The amount of moving distance is similar as those presented by Helenbrook [21]. Figure 7c shows that the solidification position shifted to the right as the heat extraction rate on the surface decreased, and that the thermal gradient increased in the solid component while decreasing in melt component. From Figure 7d, it can be ascertained that the thermal gradient in the solid component was not influenced by a change in pulling velocity, whereas the thermal gradient increased as a result of the solidification position shifting to the right. This is because the freezing velocity is related to the degree of undercooling [10]; the change in melt length can modify the thermal profile to maintain heat balance. Via this simulation, we discovered that the direction and amount of positional shifting varied according to changes in velocity. In a continuous growth process, although the pulling velocity can be precisely controlled, it is difficult to regulate the rate of heat extraction; moreover, because pulling velocity is fixed as the rate of heat extraction fluctuates, the thickness varied because of a fluctuating freezing velocity. Lastly, it was found that the growth process will be disrupted because the freezing velocity, shape of the interface, and precipitated latent heat are continuously changing. If a stable heat extraction rate on the surface is assumed and the pulling velocity is increased, the solidification position will remain temporarily fixed as a result of the delayed heat transfer; this means that the length of the melt cannot be increased in that moment. Thus, to restabilize the system, the thickness will be reduced, thereby inducing shape change.
4. Conclusions
In this paper, we have presented the development of a novel numerical HRG model. We have provided a qualitative description of our method, and discussed the development of a numerical model that couples heat transfer and impingement heat transfer that is based on phase-change energy conservation to better understand the variables associated with HRG systems and how these variables change as a result of implementation of the proposed method. Furthermore, we have presented theory supporting our proposal that our method can precisely regulate the thickness of the meniscus. We also demonstrated the influence of melt length and boundary temperature on the melt, and the effects of a fluctuating heat extraction rate and pulling velocity on the solidification position. Lastly, we have provided an explanation for unstable growth.
Acknowledgments
This study was supported by the National Natural Science Foundation of China (Grant No. 51335002) and Priority Academic Program Development of Jiangsu Higher Education Institutions.
Author Contributions
Jianning Ding and Ningyi Yuan conceived the study concepts and experiments; Dapeng Shen performed the experiments; Jiawei Xu analyzed the data; Tao Sun contributed analysis tools; Jianning Ding, Ningyi Yuan and Jiawei xu wrote the paper.
Conflicts of Interest
The authors declare no conflict of interest. The manuscript has not been published or presented elsewhere in part or in entirety and is not under consideration by another journal. We have read and understood your journal’s policies, and we believe that neither the manuscript nor the study violates any of these. The founding sponsors had no role in the design of the study; in the collection, analyses, or interpretation of data; in the writing of the manuscript, and in the decision to publish the results
Appendix A
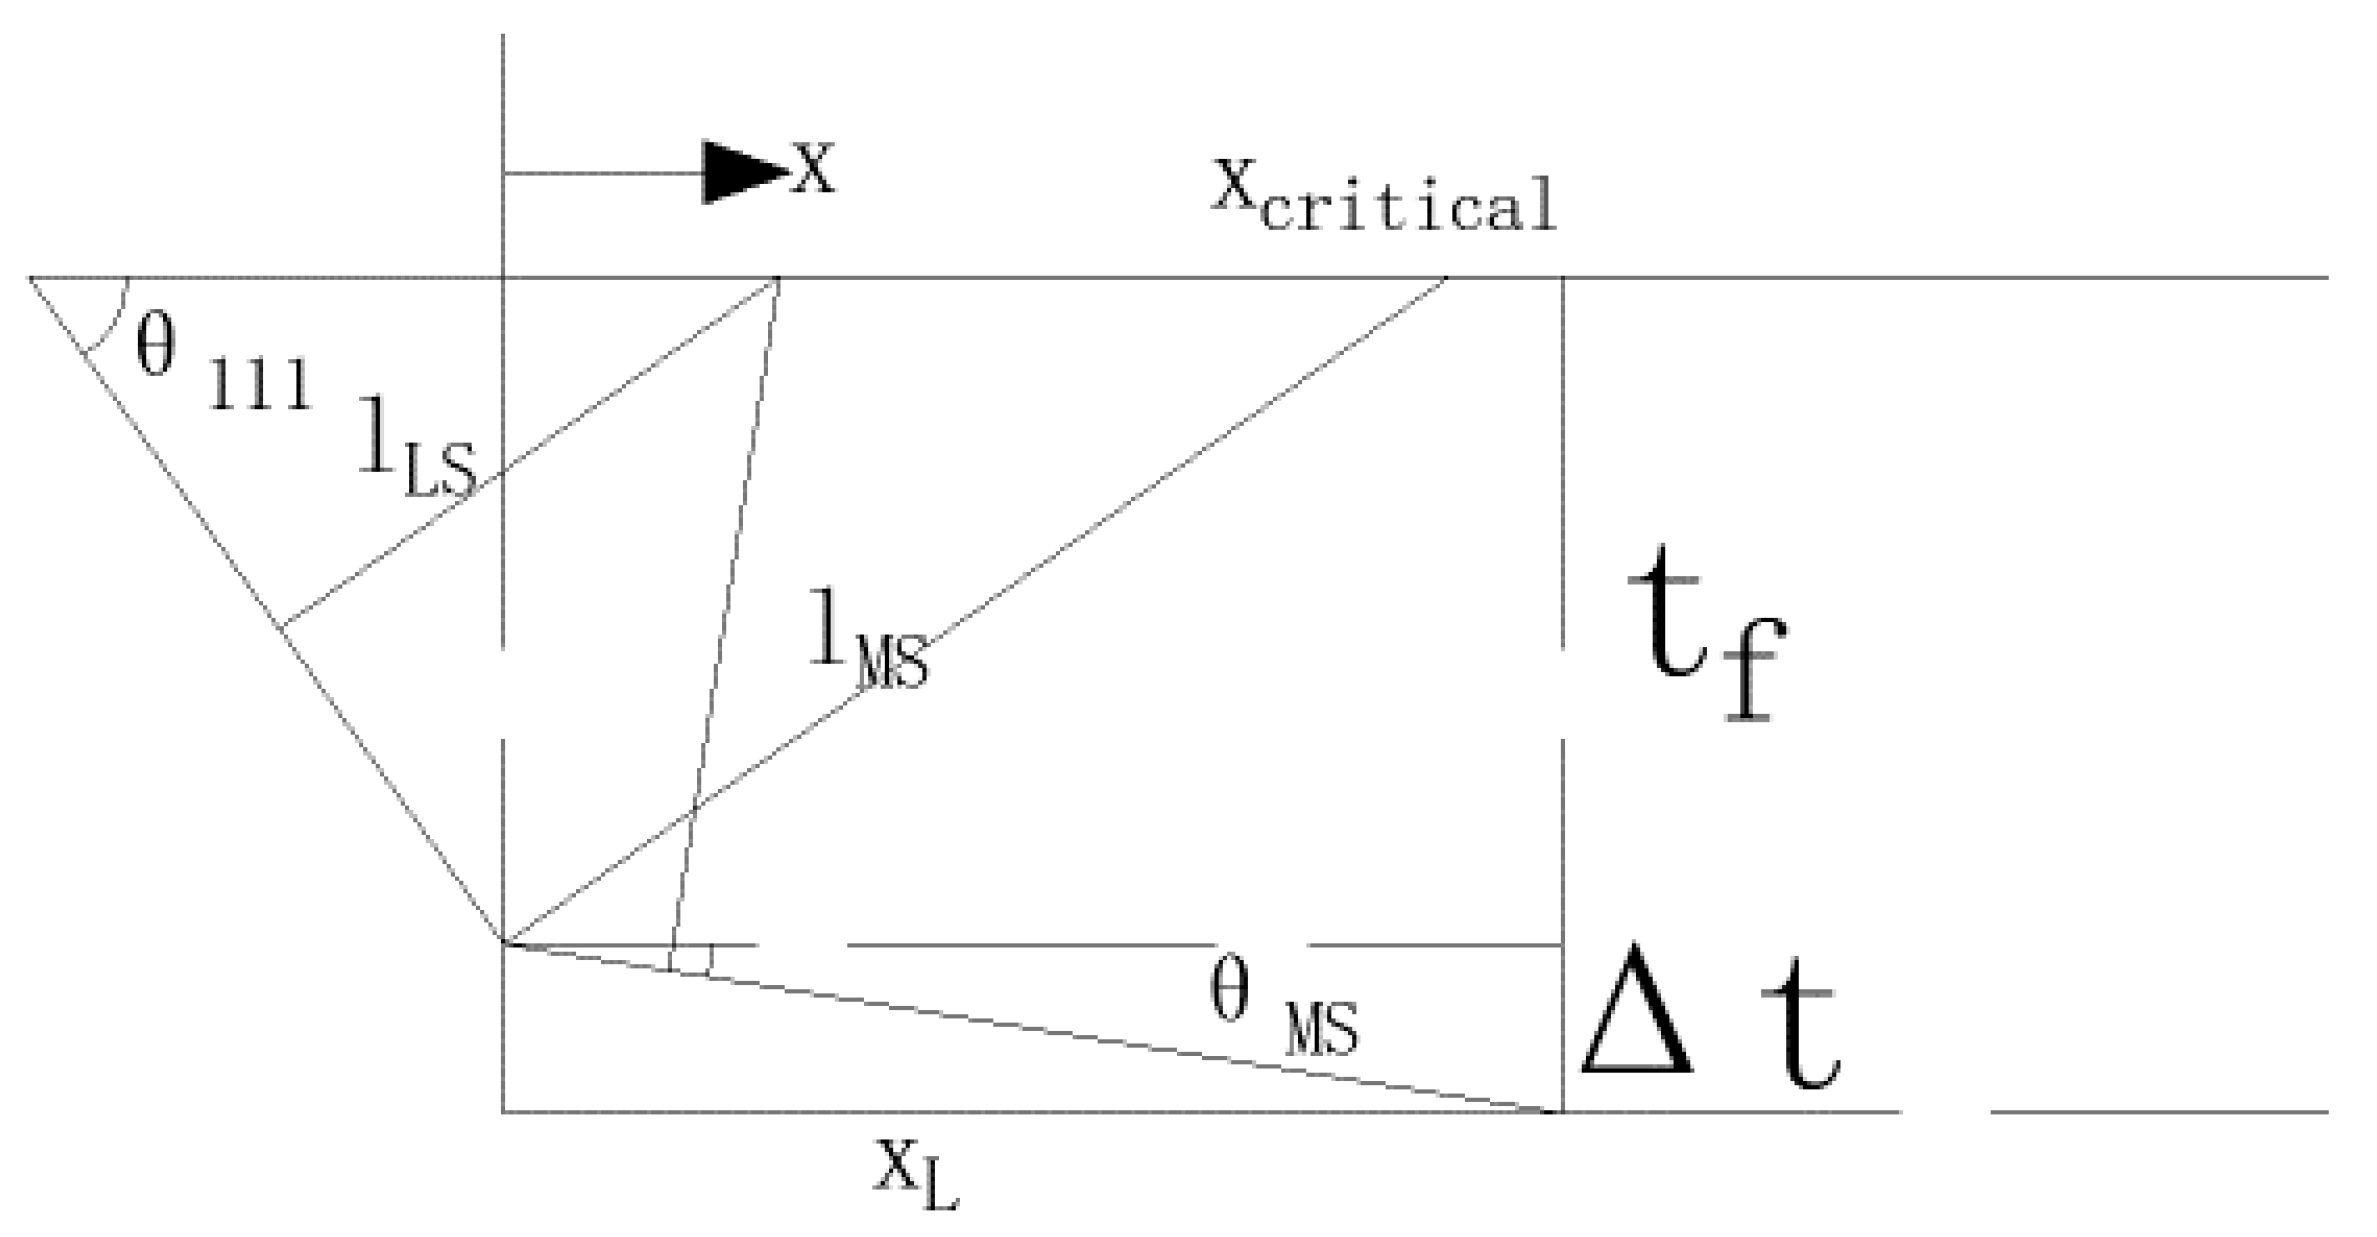
Starting from expression function (8), we can easily know that the diffuse growth angle must be less than 9° when we substitute the expected pulling rate into function (3). So we use 9° as the characteristic angle among the following calculation. The value of is small which lead to growth direction is nearly orthogonality to pulling direction and only a quiet small ratio of heat can escape from horizontal direction. But heat extraction become larger when verge on the ‘shape’ face. Now we consider a thermal resistance question, as show in Figure A1, is the beeline to ‘shape’ face and ‘diffuse’ face respectively and
is a point to distinguish.
when
when
The thermal resistances from surface to ‘shape’ face and ‘diffuse’ face are in direct proportion to and respectively. The heat extracted from these two faces is also in direct proportion to and . We can use the following function to express the relationship between heat extraction from ‘diffuse’ face and the total heat extraction.
Substituting different initial value of thickness into function (A5), we can know the relationship clearly by Figure 6a. And we fitted the figure with the curve fitting tool in MATLAB by the following fitting function:
We chose the L~M arithmetic to make the fitting result more reliable, the fitted coefficients of A, B, C are showed in Table A1. In this table, we can know the value of A and C are not sensitive to the change of initial value of thickness t0, but the value of B is changed when thickness change. We earn the relationship between B and t0 use the same method with MATLAB, and we have that:
To express the function (9), we need to use the mathematical description that used by Oliveros [12].
We transformed function (A8) to make it adapt to our steady state question as following
Integrating function (A9) then we have
In order to obtain the possible solution for this crystal growth, we made some approximate within a reasonable range to simplify and smooth the calculate process.

Table A1.
Coefficients for different initial thickness.
| Thickness (μm) | 50 | 100 | 200 | 300 | 400 |
|---|---|---|---|---|---|
| A | 0.401 | 0.3975 | 0.38 | 0.361 | 0.341 |
| B | 6.858 | 4.303 | 2.712 | 2.111 | 1.806 |
| C | 0.1764 | 0.201 | 0.233 | 0.243 | 0.261 |
Figure A1.
Distance between the surface of the ribbon and the respective solidification interfaces control the relative amount of heat flow at each interface.
Figure A1.
Distance between the surface of the ribbon and the respective solidification interfaces control the relative amount of heat flow at each interface.

References
- Ciszek, T.F. Techniques for the crystal growth of silicon ingots and ribbons. J. Cryst. Growth 1984, 66, 655–672. [Google Scholar] [CrossRef]
- Narayanan, M.; Ciszek, T. Silicon Solar Cells: Materials, Devices, and Manufacturing. In Springer Handbook of Crystal Growth; Springer-Verlag Berlin Heidelberg Press: London, UK, 2010; pp. 1701–1718. [Google Scholar]
- Kudo, B. Improvements in the Horizontal Ribbon Growth technique for single crystal silicon. J. Cryst. Growth 1980, 50, 247–259. [Google Scholar] [CrossRef]
- Helenbrook, B.T.; Kellerman, T.; Carlson, F.; Desai, N.; Sun, D. Experimental and numerical investigation of the horizontal ribbon growth process. J. Cryst. Growth 2016, 453, 163–172. [Google Scholar] [CrossRef]
- Hoyler, G.; Falckenberg, R.; Grabmaier, J.G.; Freienstein, B. Fast Si sheet growth by the horizontal supported web technique. J. Cryst. Growth 1986, 79, 572–577. [Google Scholar] [CrossRef]
- Lange, H.; Schwirtlich, I.A. Ribbon Growth on Substrate (RGS)—A new approach to high speed growth of silicon ribbons for photovoltaics. J. Cryst. Growth 1990, 104, 108–112. [Google Scholar] [CrossRef]
- William, S. Process for Growing Single Crystals. U.S. Patent 3,031,275, 24 April 1962. [Google Scholar]
- Bleil, C.E. A new method for growing crystal ribbons. J. Cryst. Growth 1969, 5, 99–104. [Google Scholar] [CrossRef]
- Kellerman, P.; Kernan, B.; Helenbrook, B.T.; Sun, D.; Sinclair, F.; Carlson, F. Floating Silicon Method single crystal ribbon—Observations and proposed limit cycle theory. J. Cryst. Growth 2016, 451, 174–180. [Google Scholar] [CrossRef]
- Kellerman, P. Floating Silicon Method; Applied Materials-Varian Semiconductor Equipment: Gloucester, MA, USA, 2013. [Google Scholar]
- Zoutendyk, J.A. Theoretical analysis of heat flow in horizontal ribbon growth from a melt. J. Appl. Phys. 1978, 49, 3927–3932. [Google Scholar] [CrossRef]
- Oliveros, G.A.; Wang, R.; Seetharaman, S.; Ydstie, B.E. Modeling and laboratory scale proof of concept of the horizontal ribbon growth process: Application to silicon wafer manufacturing. In Proceedings of the 38th IEEE Photovoltaic Specialists Conference, Austin, TX, USA, 3–8 June 2012. [Google Scholar]
- Oliveros, G.A.; Church, J.; Sridhar, S.; Ydstie, B.E. Analysis of the meniscus in the horizontal ribbon growth process. In Proceedings of the 40th Photovoltaic Specialists Conference IEEE, Denver, CO, USA, 8–13 June 2014. [Google Scholar]
- Oliveros, G.A.; Sridhar, S.; Ydstie, B.E. Existence and static stability of the meniscus in horizontal ribbon growth. J. Cryst. Growth 2015, 411, 96–105. [Google Scholar] [CrossRef]
- Daggolu, P. Thermal-Capillary Analysis of the Horizontal Ribbon Growth of Solar Silicon. Ph.D. Thesis, University of Minnesota, Minneapolis, MN, USA, 2013. [Google Scholar]
- Daggolu, P.; Yeckel, A.; Derby, J.J. An analysis of segregation during horizontal ribbon growth of silicon. J. Cryst. Growth 2014, 390, 80–87. [Google Scholar] [CrossRef]
- Daggolu, P.; Yeckel, A.; Bleil, C.; Derby, J.J. Stability limits for the horizontal ribbon growth of silicon crystals. J. Cryst. Growth 2013, 363, 132–140. [Google Scholar]
- Ke, J.; Khair, A.S.; Ydstie, B.E. The effects of impurity on the stability of Horizontal Ribbon Growth. J. Cryst. Growth 2017, 480, 34–42. [Google Scholar] [CrossRef]
- Galvin, G.J.; Mayer, J.W.; Peercy, P.S. Solidification kinetics of pulsed laser melted silicon based on thermodynamic considerations. Appl. Phys. Lett. 1985, 46, 644–646. [Google Scholar] [CrossRef]
- Narayan, J.; Brown, W.L.; Ross, A. Laser-Solid Interactions and Transient Thermal Processing of Materials; Elsevier Science Press: North-Holland, The Netherlands, 1983. [Google Scholar]
- Helenbrook, B.T.; Barlow, N.S. Spatial–temporal stability analysis of faceted growth with application to horizontal ribbon growth. J. Cryst. Growth 2016, 454, 35–44. [Google Scholar] [CrossRef]
Figure 1.
Schematic diagram of the experimental configuration.

Figure 2.
2-D analysis model of our demonstrated machine.

Figure 3.
Mathematical model of solid part.

Figure 4.
Mathematic model of both solid and melt part.

Figure 5.
(a) Relationship between percentage of heat extracted from surface and diffuse growth length with different initial thickness (, ). (b) Relationship between normalized minimum temperature position () and diffuse growth length with different initial thicknesses. (c) Under the same working condition with (a), the relationship between diffuse growth rate and growth length with different initial thickness. (d) Under the same working condition with (a), relationship between diffuse growth thickness and growth length with different initial thickness.

Figure 6.
(a) Relationship between thermal profile in melt and different length with different initial thickness. (b) Influence to thermal profile in melt caused by different boundary temperature when initial thickness .
Figure 6.
(a) Relationship between thermal profile in melt and different length with different initial thickness. (b) Influence to thermal profile in melt caused by different boundary temperature when initial thickness .

Figure 7.
For different initial thicknesses, the change of solidification position with (a) heat extraction on surface, (b) pulling velocity. The change of thermal profile with (c) heat extraction and (d) pulling velocity ( = 200 μm).
Figure 7.
For different initial thicknesses, the change of solidification position with (a) heat extraction on surface, (b) pulling velocity. The change of thermal profile with (c) heat extraction and (d) pulling velocity ( = 200 μm).

Table 1.
Furnace heat transfer parameters and material properties used in all calculations.
| Descriptions | Material | Symbol | Value |
|---|---|---|---|
| Density () | Silicon solid | 2330 | |
| Silicon melt | 2550 | ||
| Conductivity ( | Silicon melt | 64 | |
| Silicon solid | 28 | ||
| Melting temperature (K) | Silicon | 1687 | |
| Temperature variation (K) | 3.9 | ||
| Hear of fusion () | Silicon | ||
| Growht angle (°) | Silicon | 54.7 | |
| Diffuse growth angle (°) | Silicon | 9 | |
| Diffusivity () | Silicon solid | ||
| Silicon melt | |||
| Convective coefficient () | Silicon with helium | 64,864.9 | |
| Thermal resistance () | Silicon melt |
© 2018 by the authors. Licensee MDPI, Basel, Switzerland. This article is an open access article distributed under the terms and conditions of the Creative Commons Attribution (CC BY) license (http://creativecommons.org/licenses/by/4.0/).
Share and Cite
MDPI and ACS Style
Xu, J.; Shen, D.; Sun, T.; Ding, J.; Yuan, N. Modeling and Analysis of Novel Horizontal Ribbon Growth of Silicon Crystal. Crystals 2018, 8, 36. https://doi.org/10.3390/cryst8010036
AMA Style
Xu J, Shen D, Sun T, Ding J, Yuan N. Modeling and Analysis of Novel Horizontal Ribbon Growth of Silicon Crystal. Crystals. 2018; 8(1):36. https://doi.org/10.3390/cryst8010036
Chicago/Turabian StyleXu, Jiawei, Dapeng Shen, Tao Sun, Jianning Ding, and Ningyi Yuan. 2018. "Modeling and Analysis of Novel Horizontal Ribbon Growth of Silicon Crystal" Crystals 8, no. 1: 36. https://doi.org/10.3390/cryst8010036
Note that from the first issue of 2016, this journal uses article numbers instead of page numbers. See further details here.