Monoclinic Paracetamol vs. Paracetamol-4,4′-Bipyridine Co-Crystal; What Is the Difference? A Charge Density Study

 ,
,  , ,
, , 
Abstract
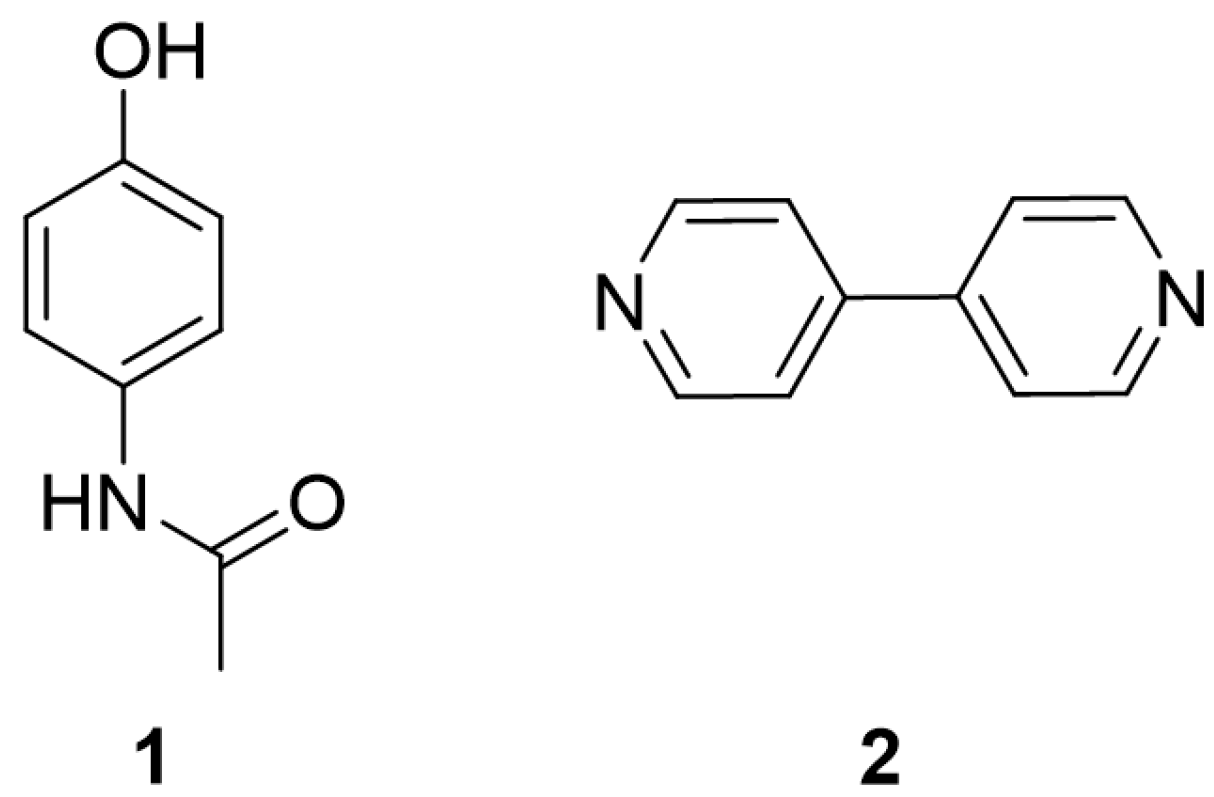
:1. Introduction
2. Methods
Computational Methods
3. Results
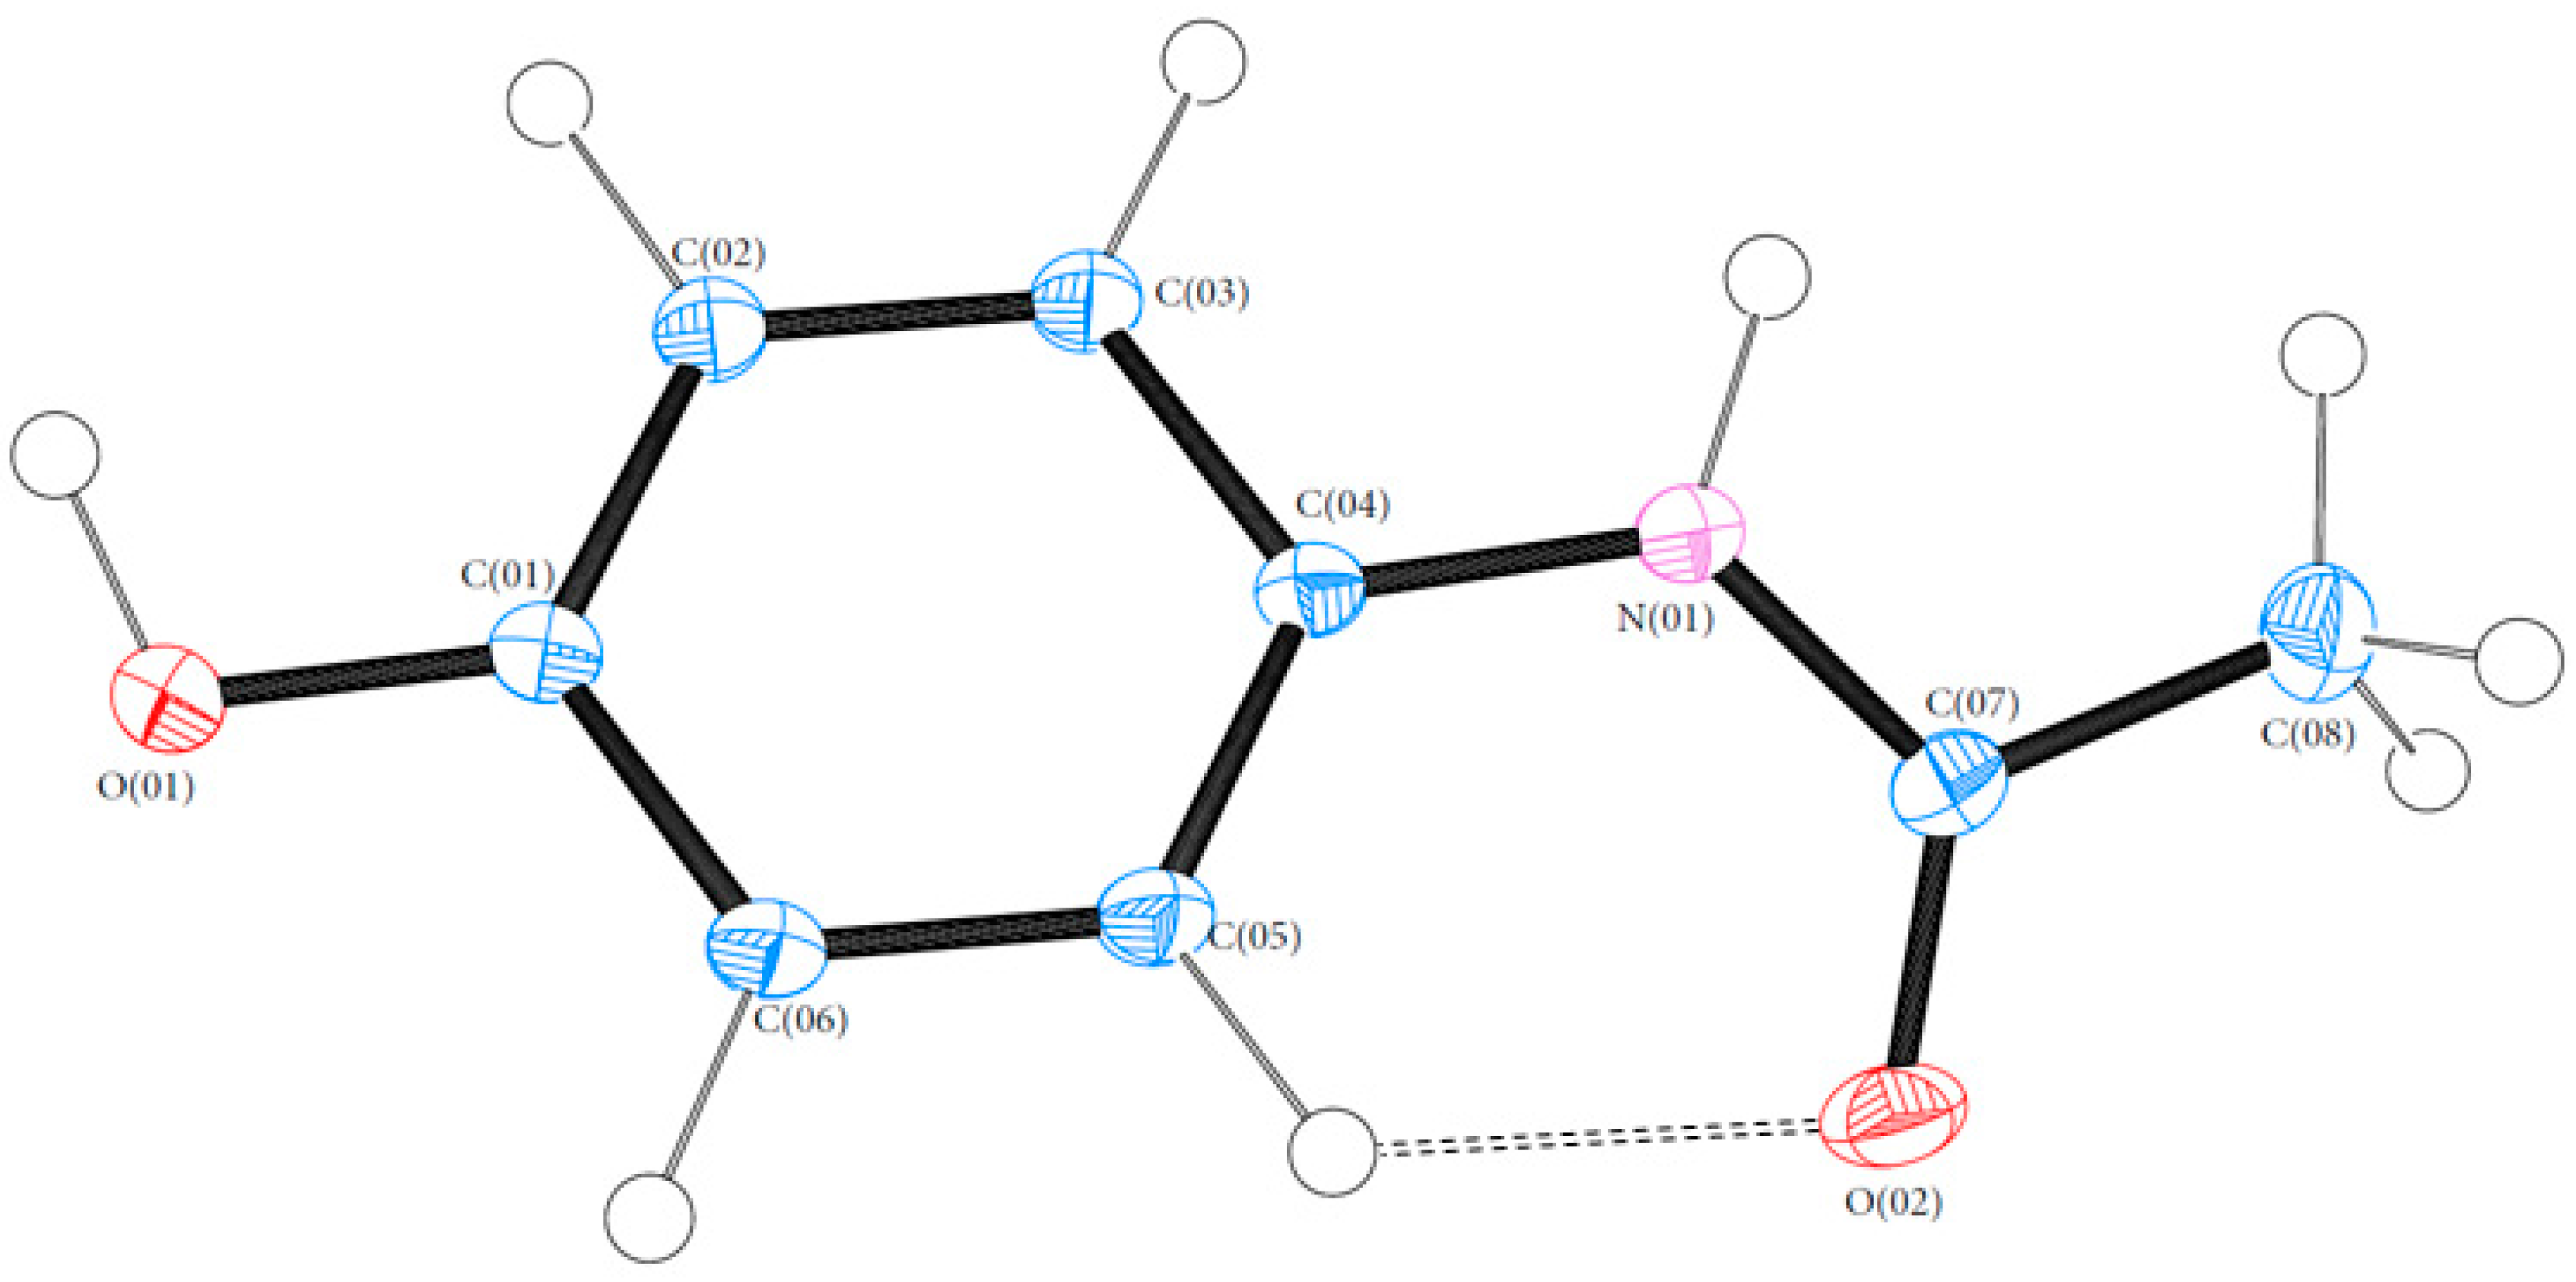
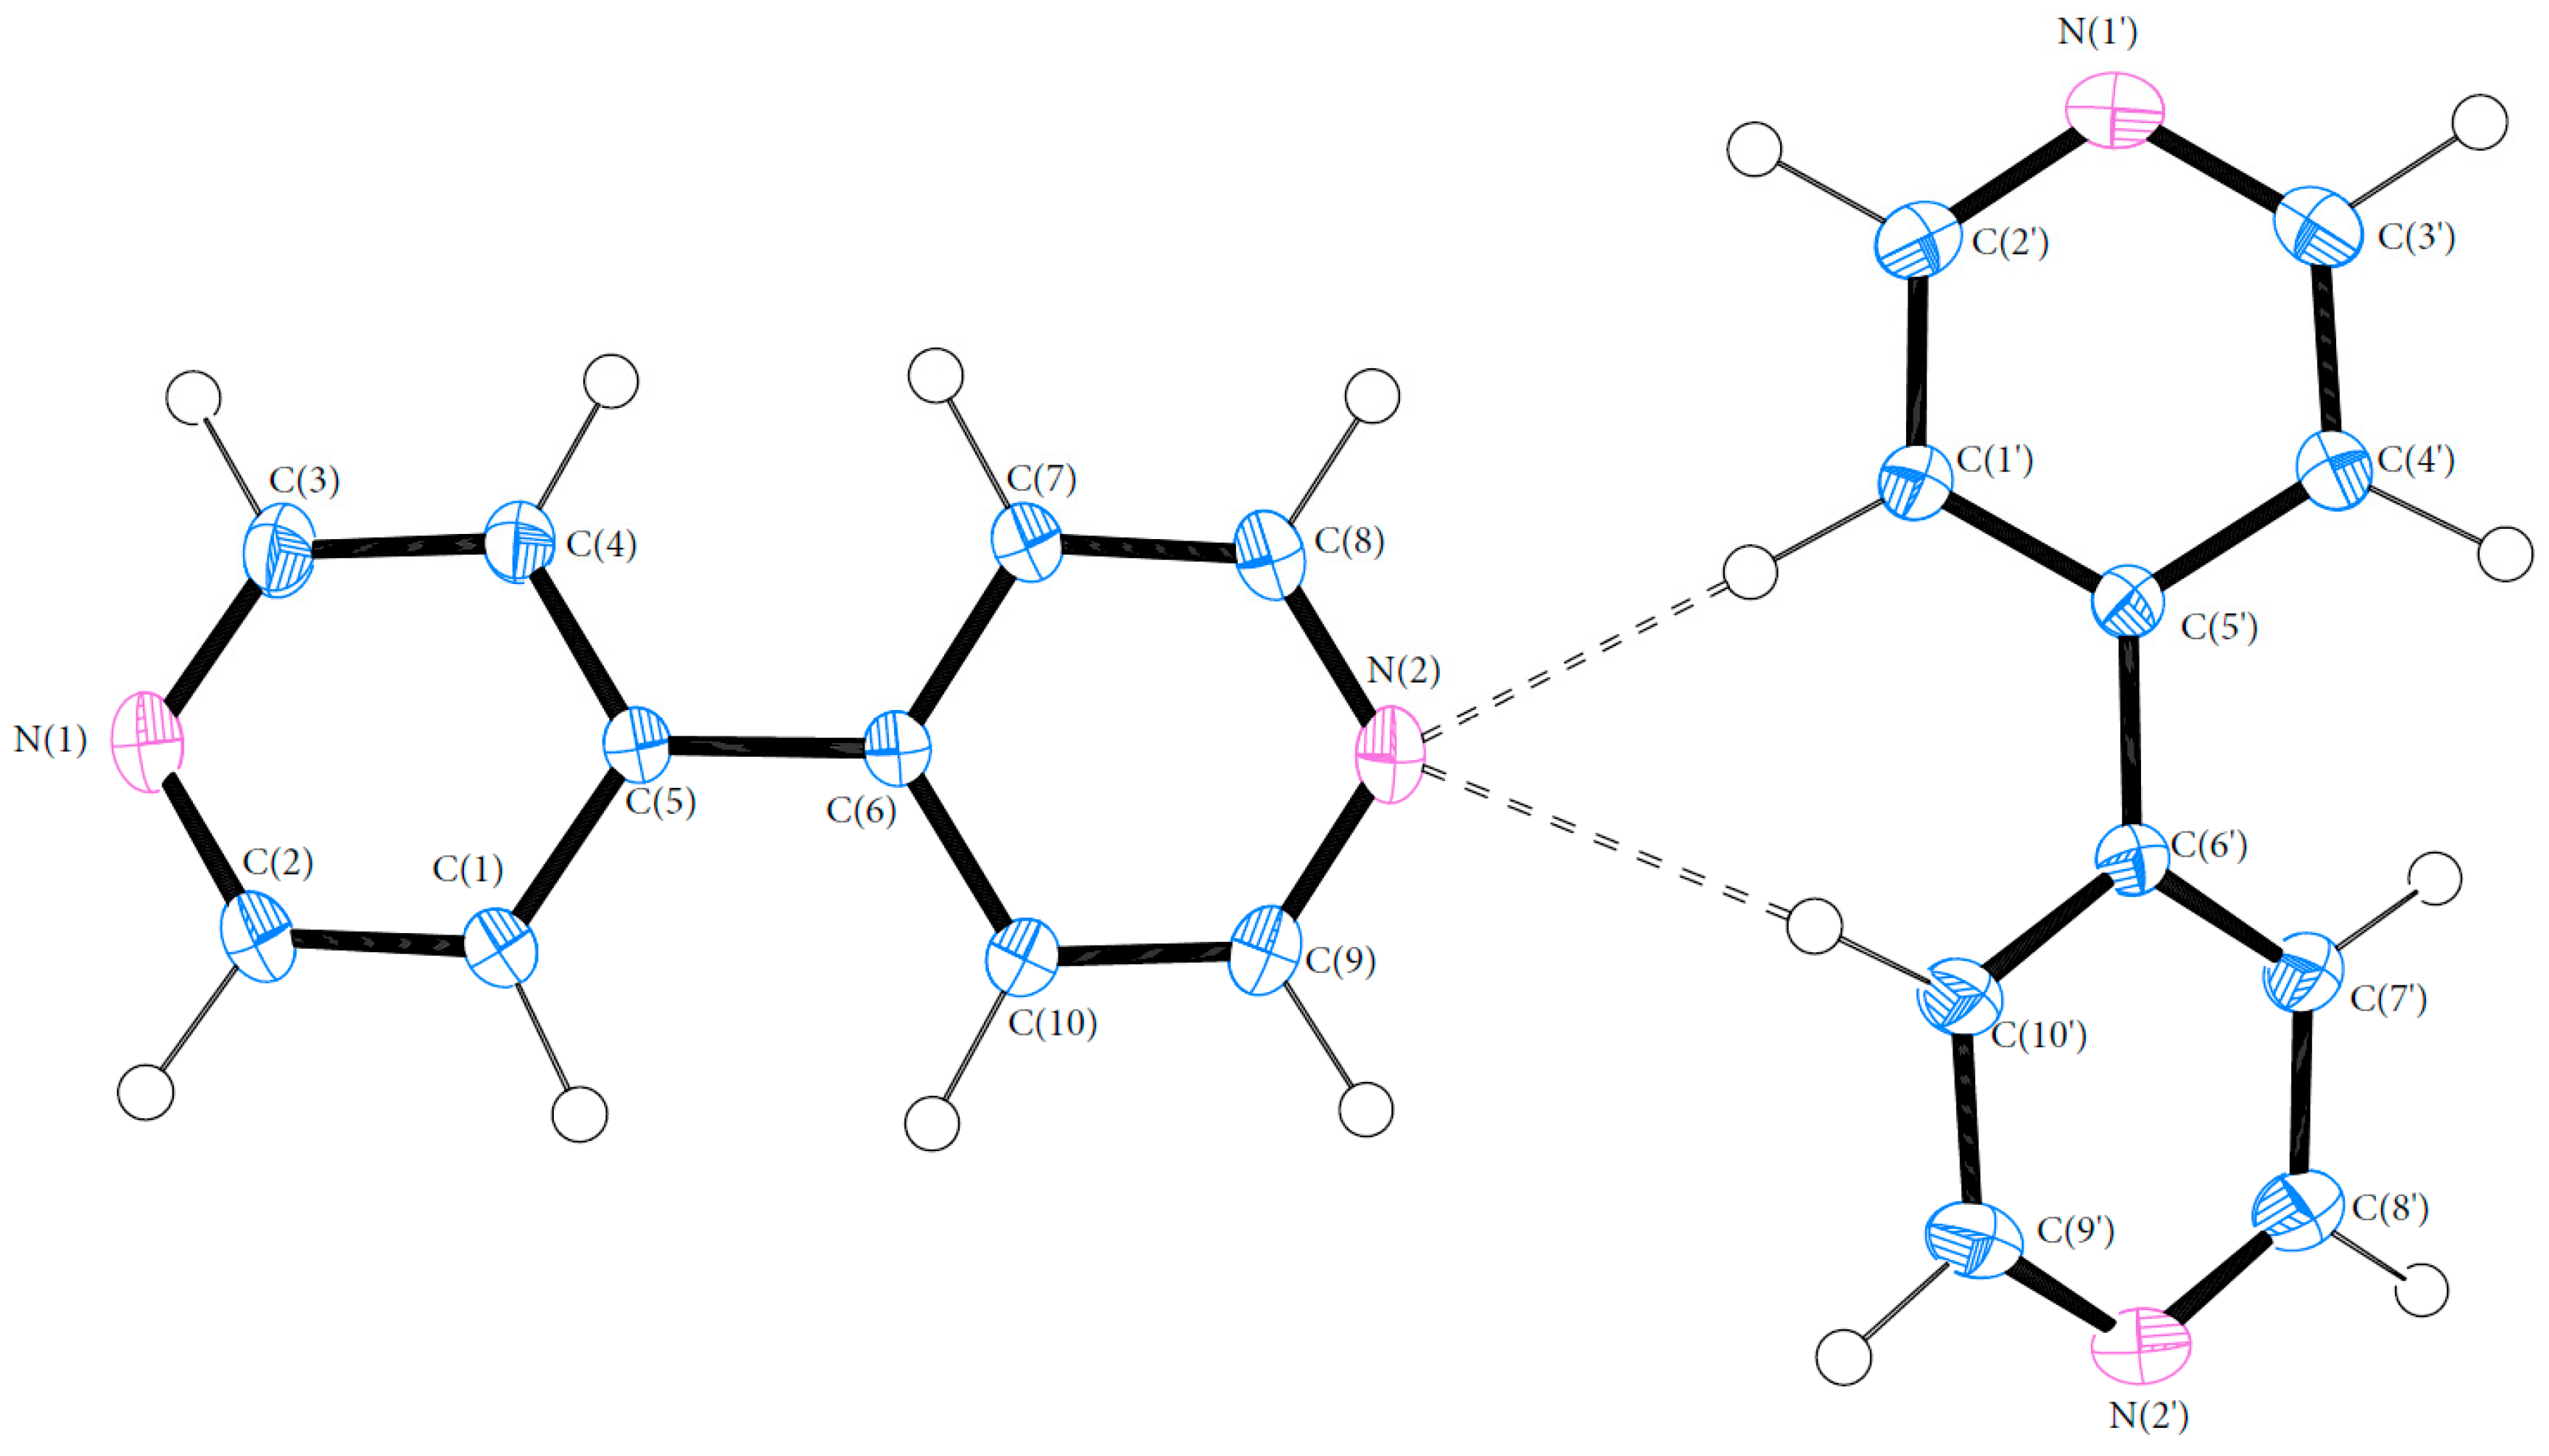
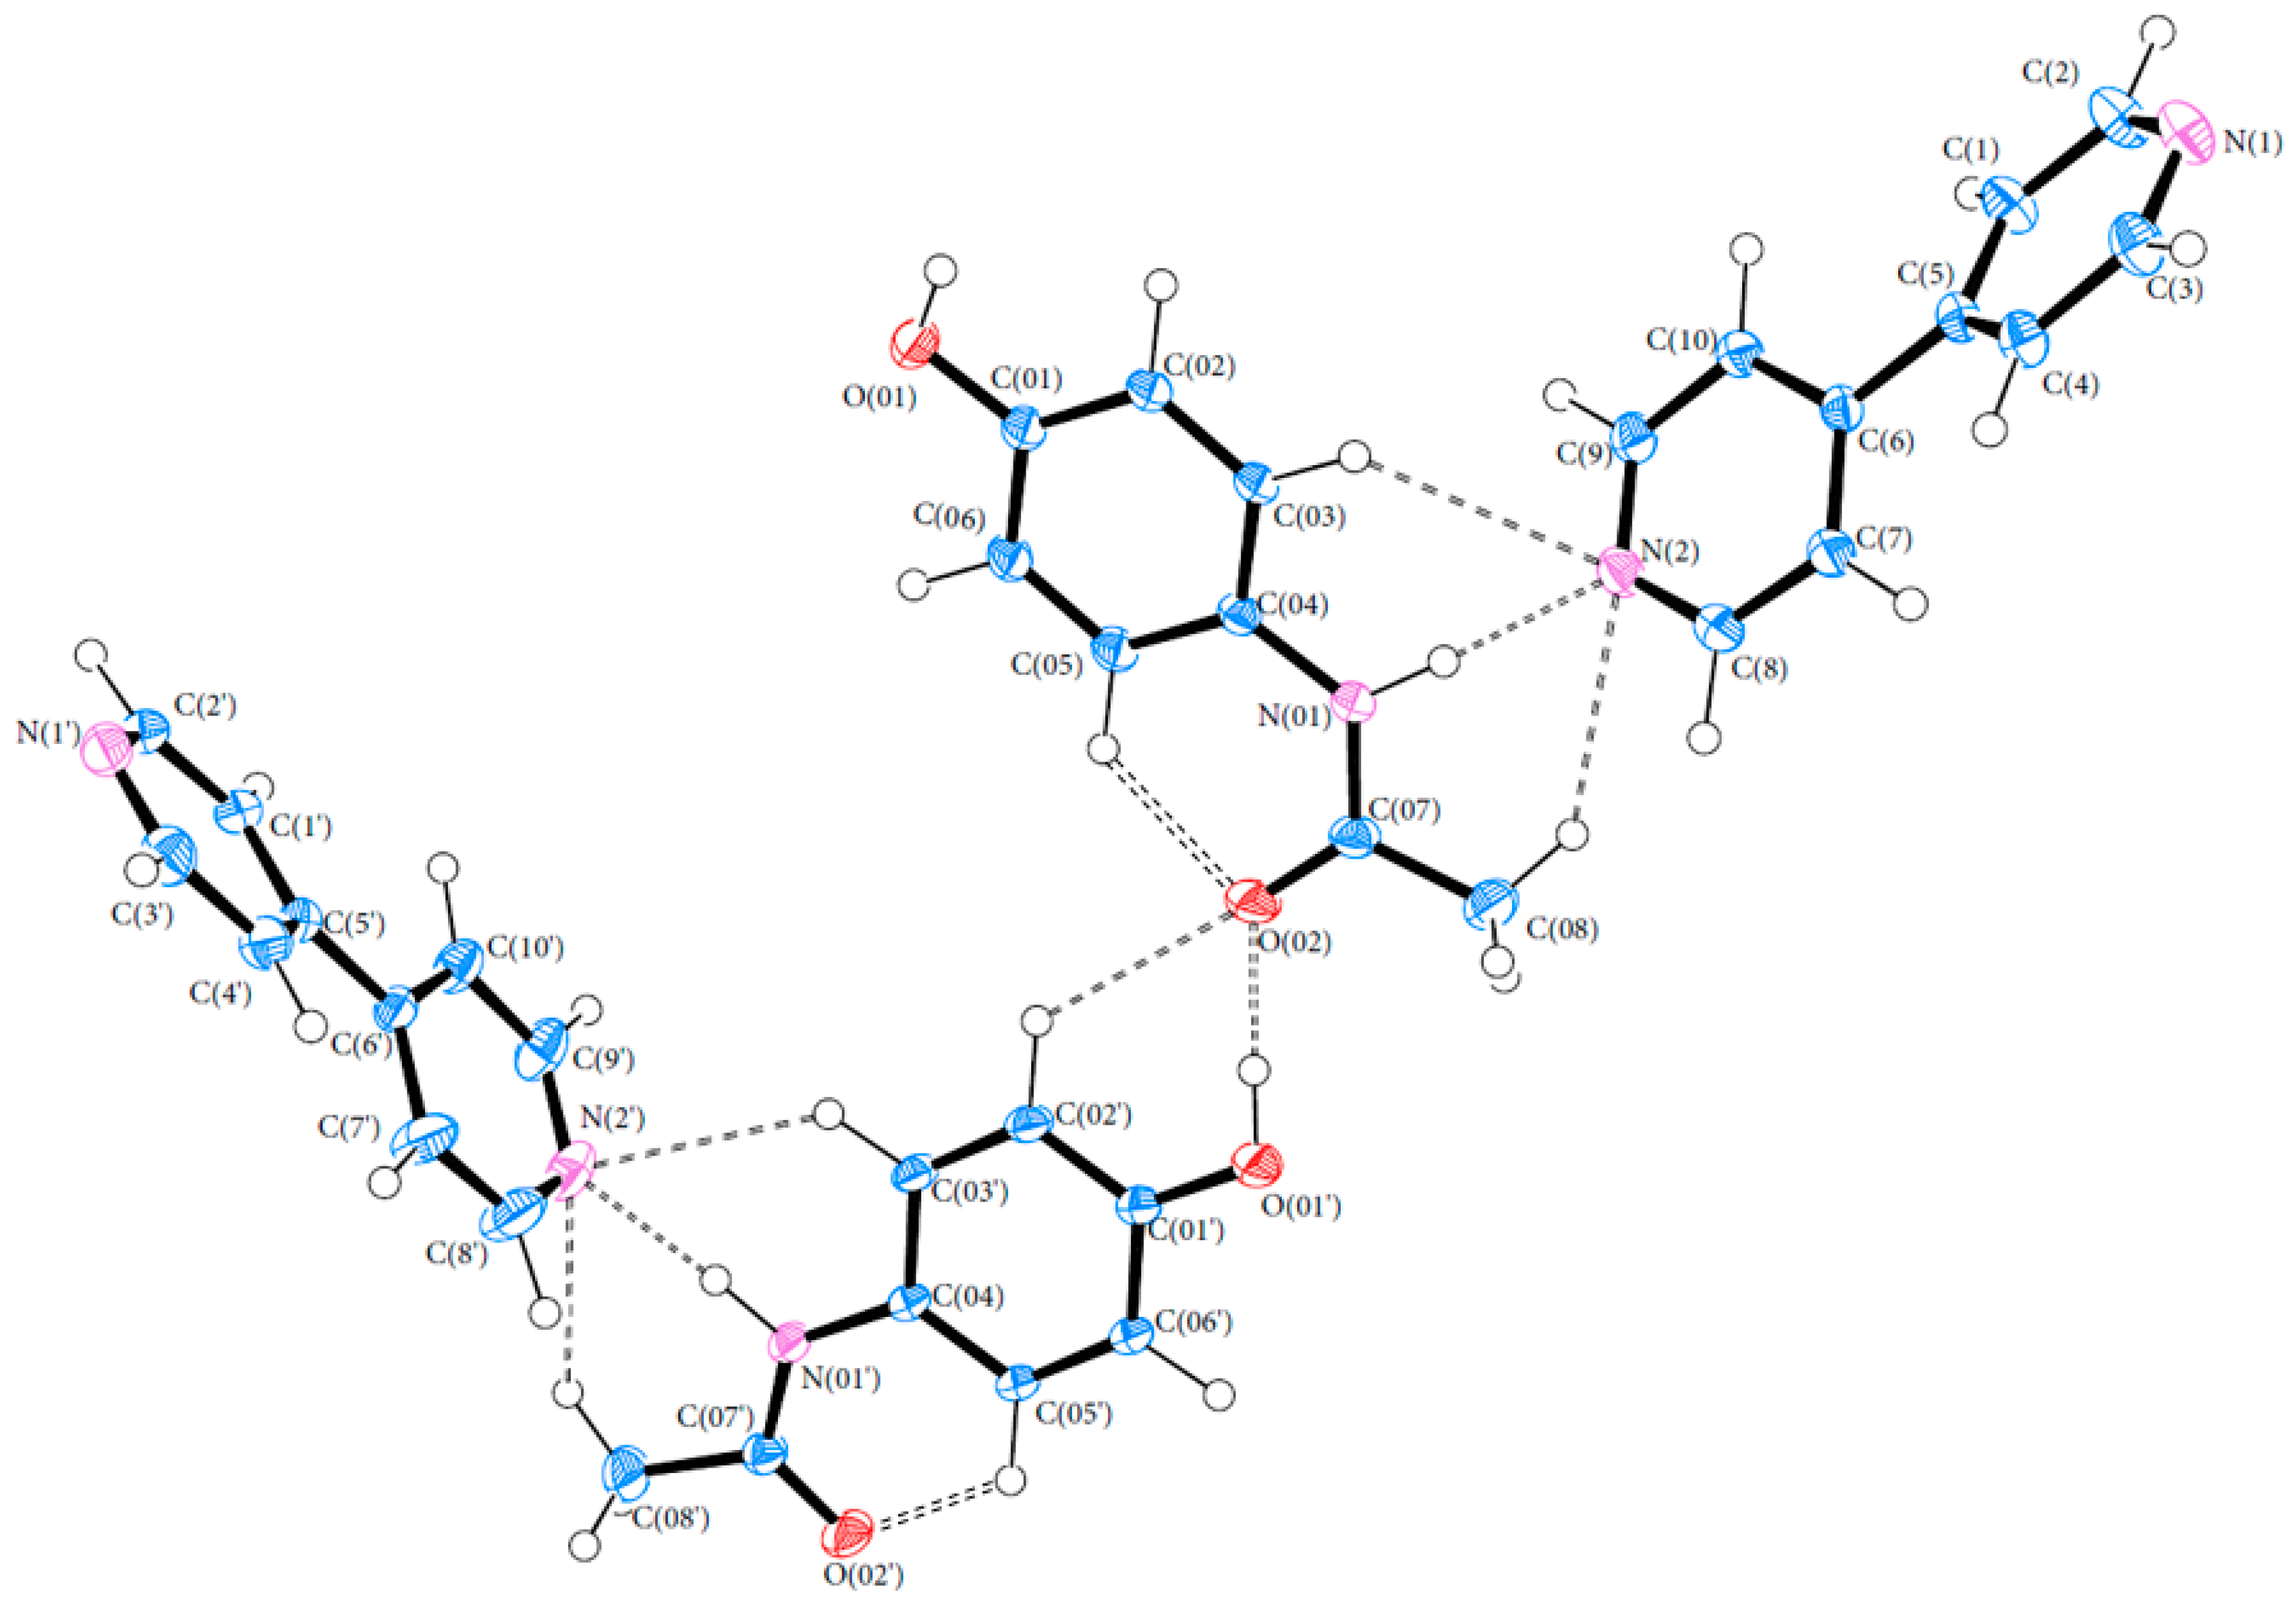
3.1. Geometry
3.2. Topological Analysis
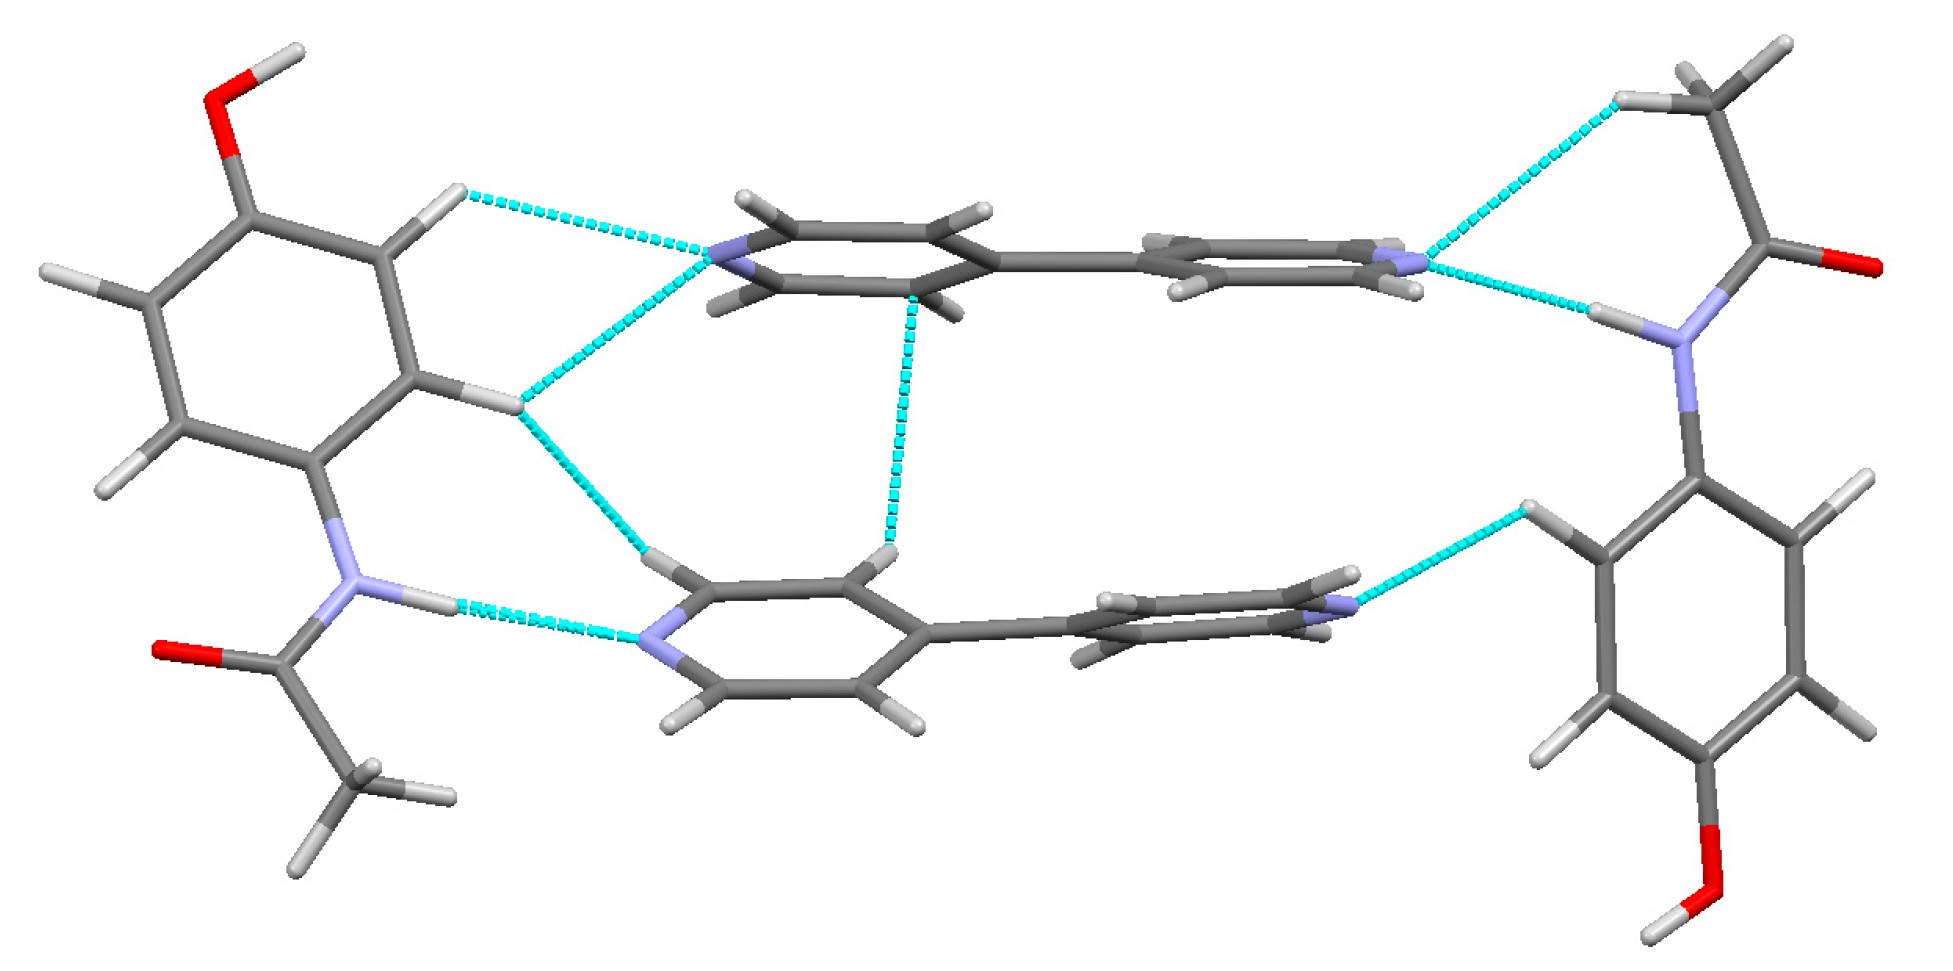
3.3. Hydrogen Bonds
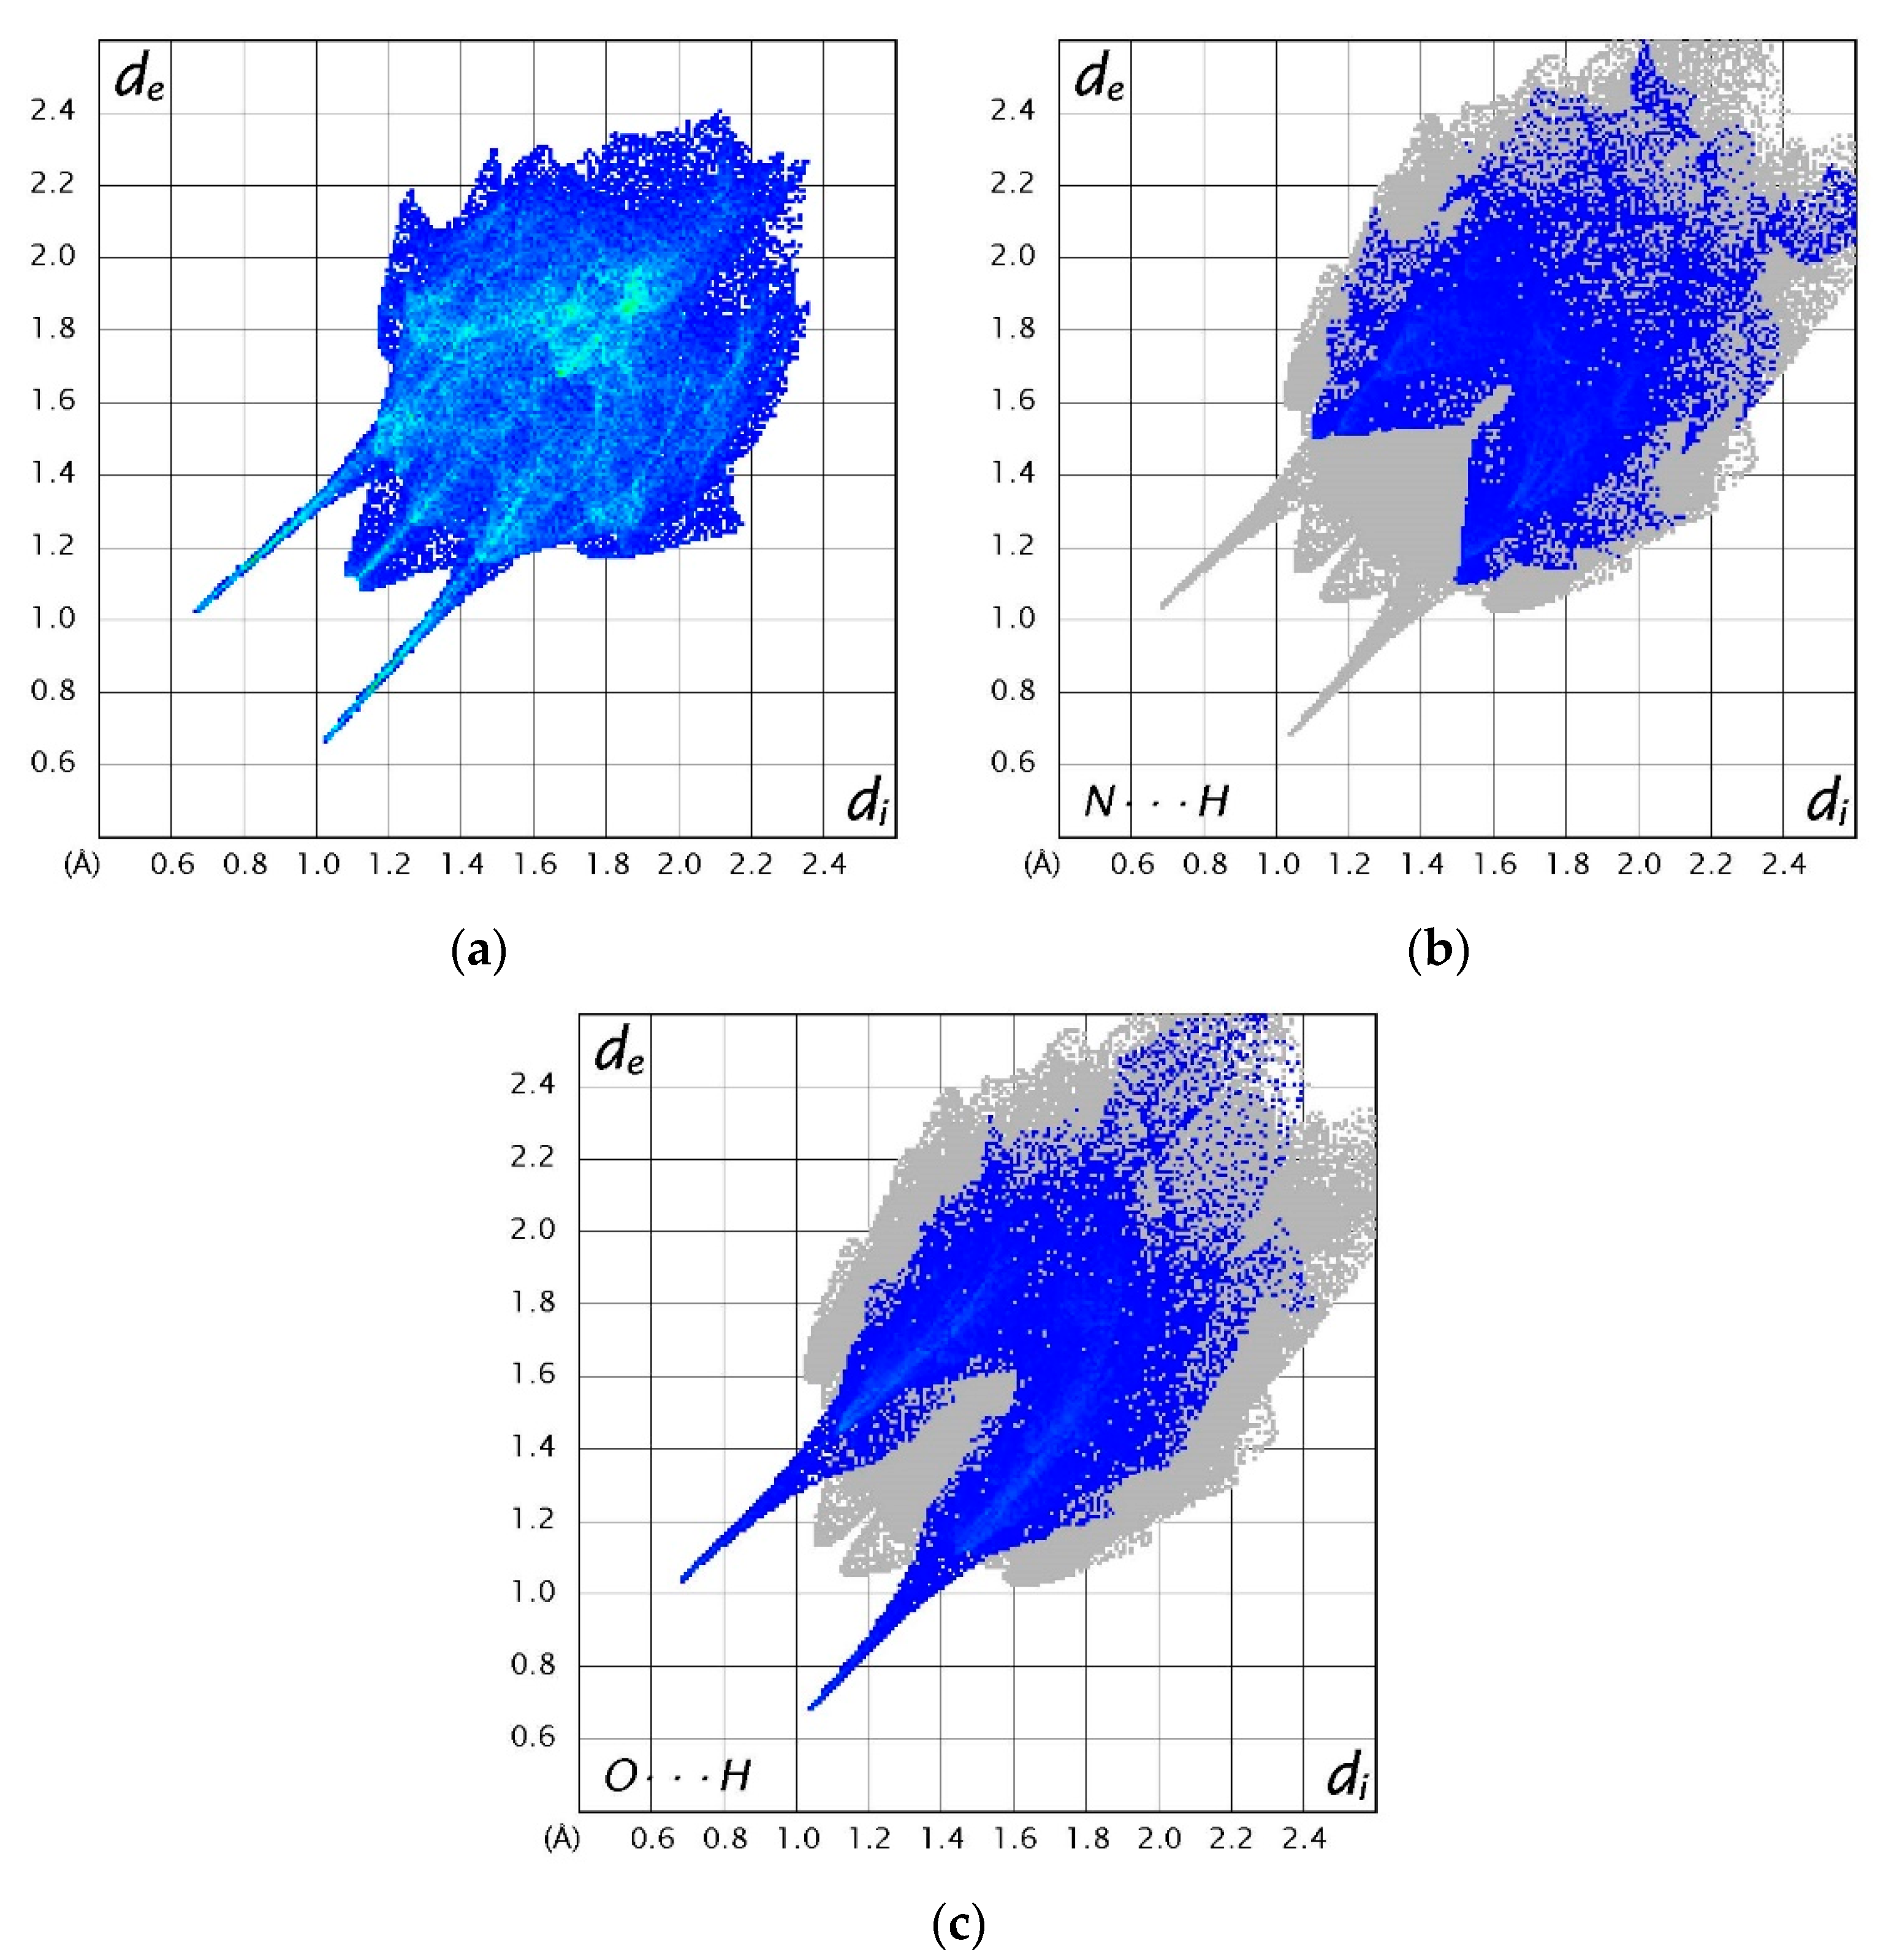
3.4. Hirshfeld Surfaces Analysis
3.5. Atomic Charges
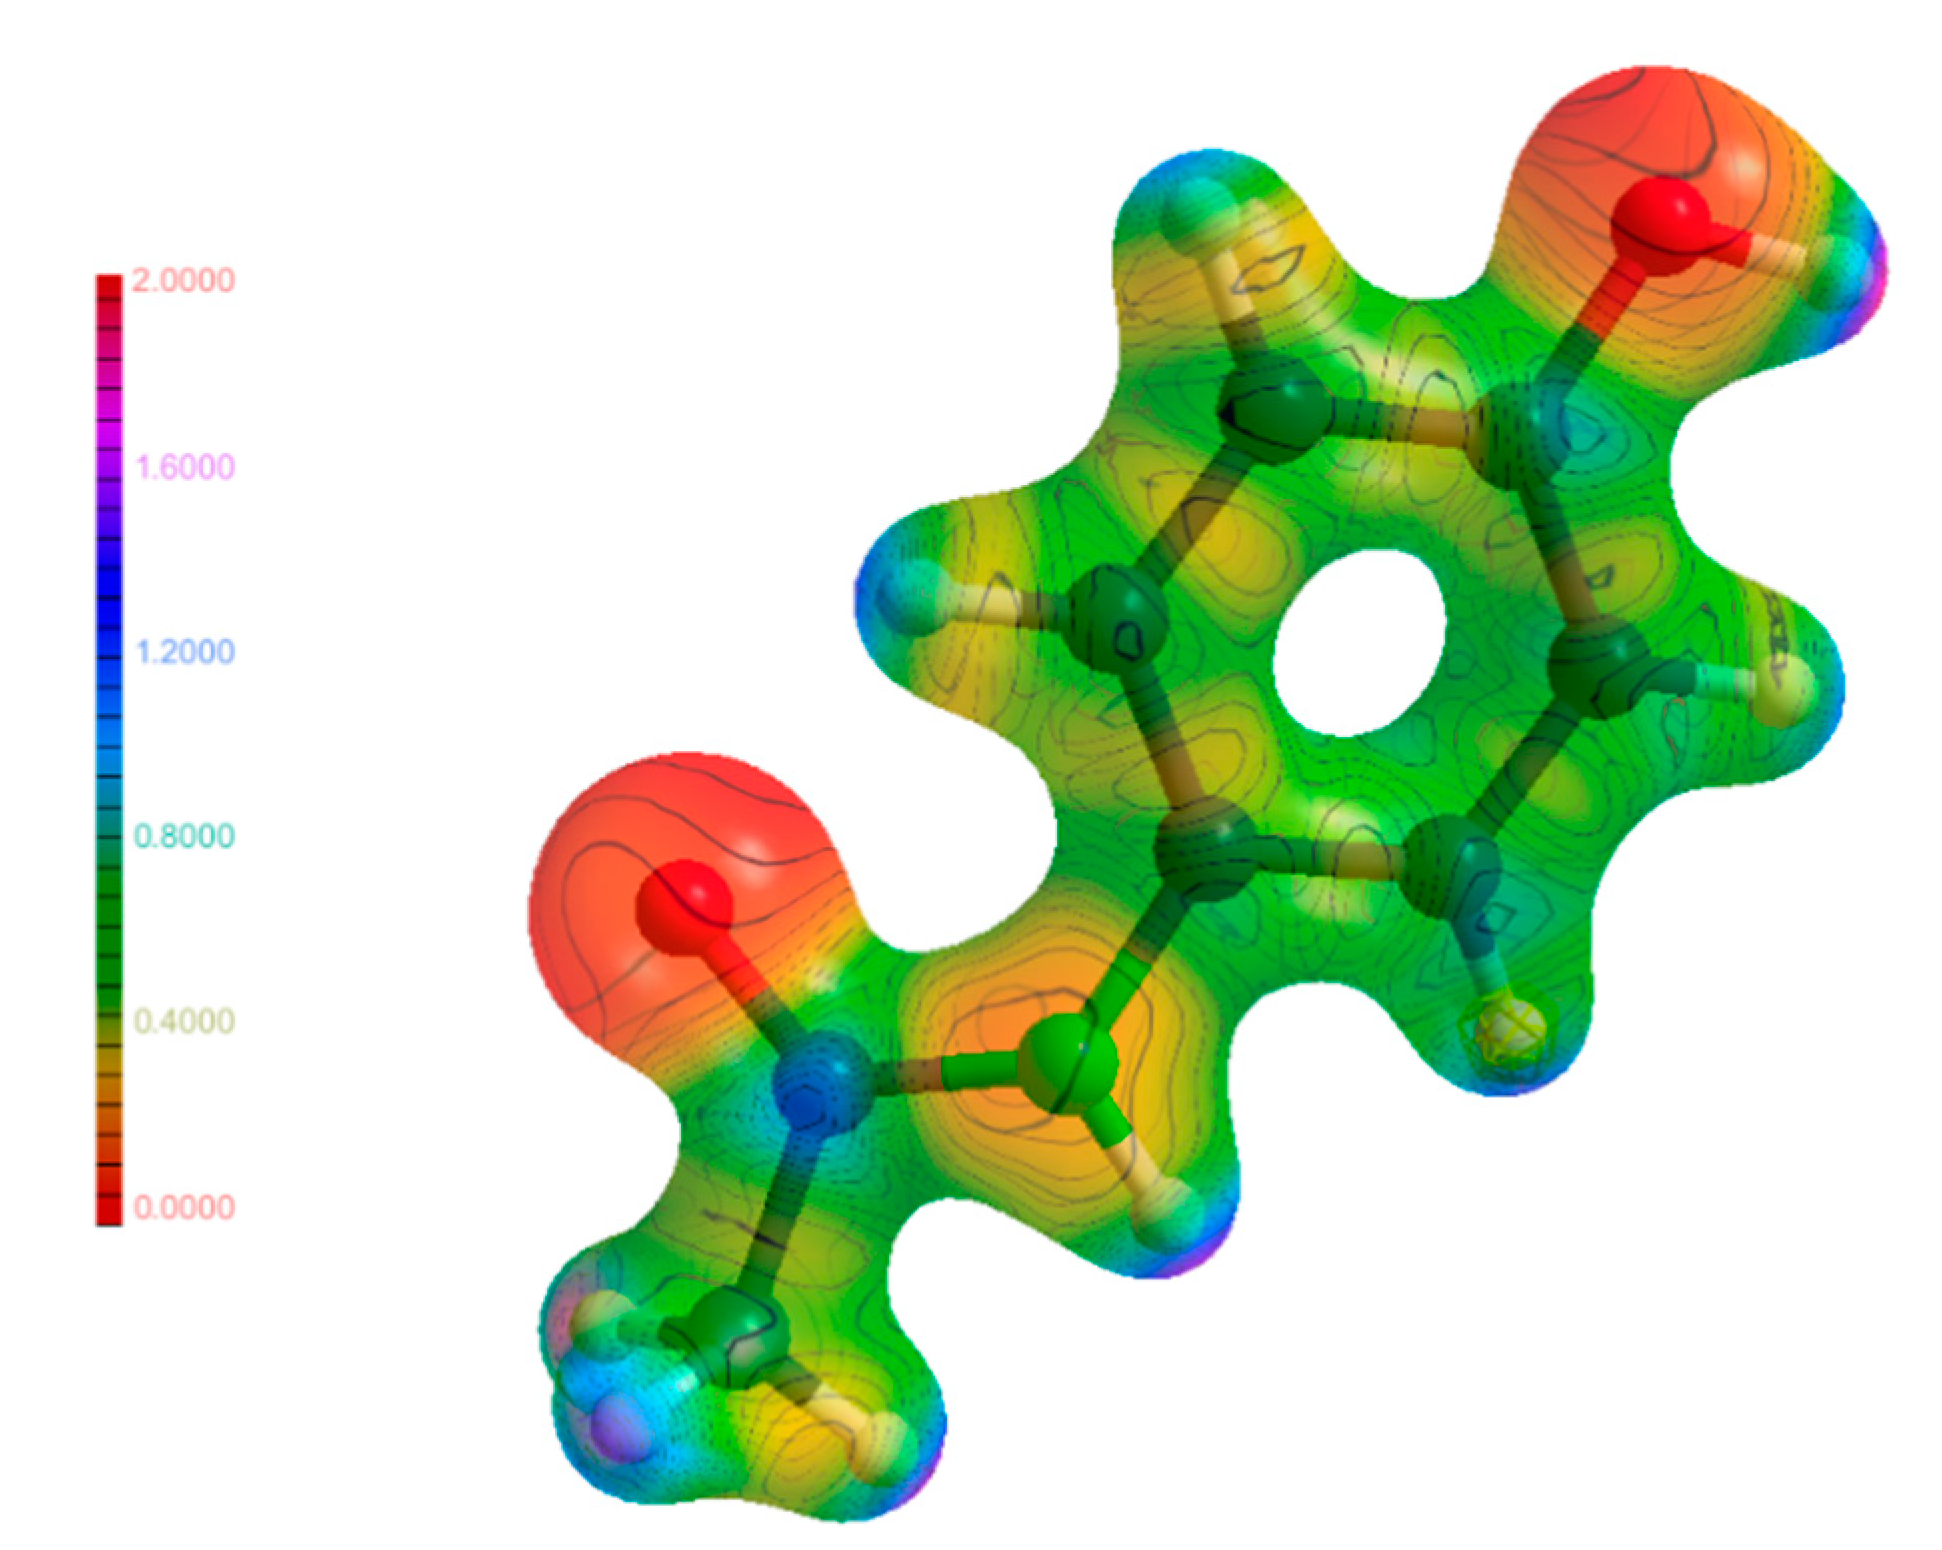
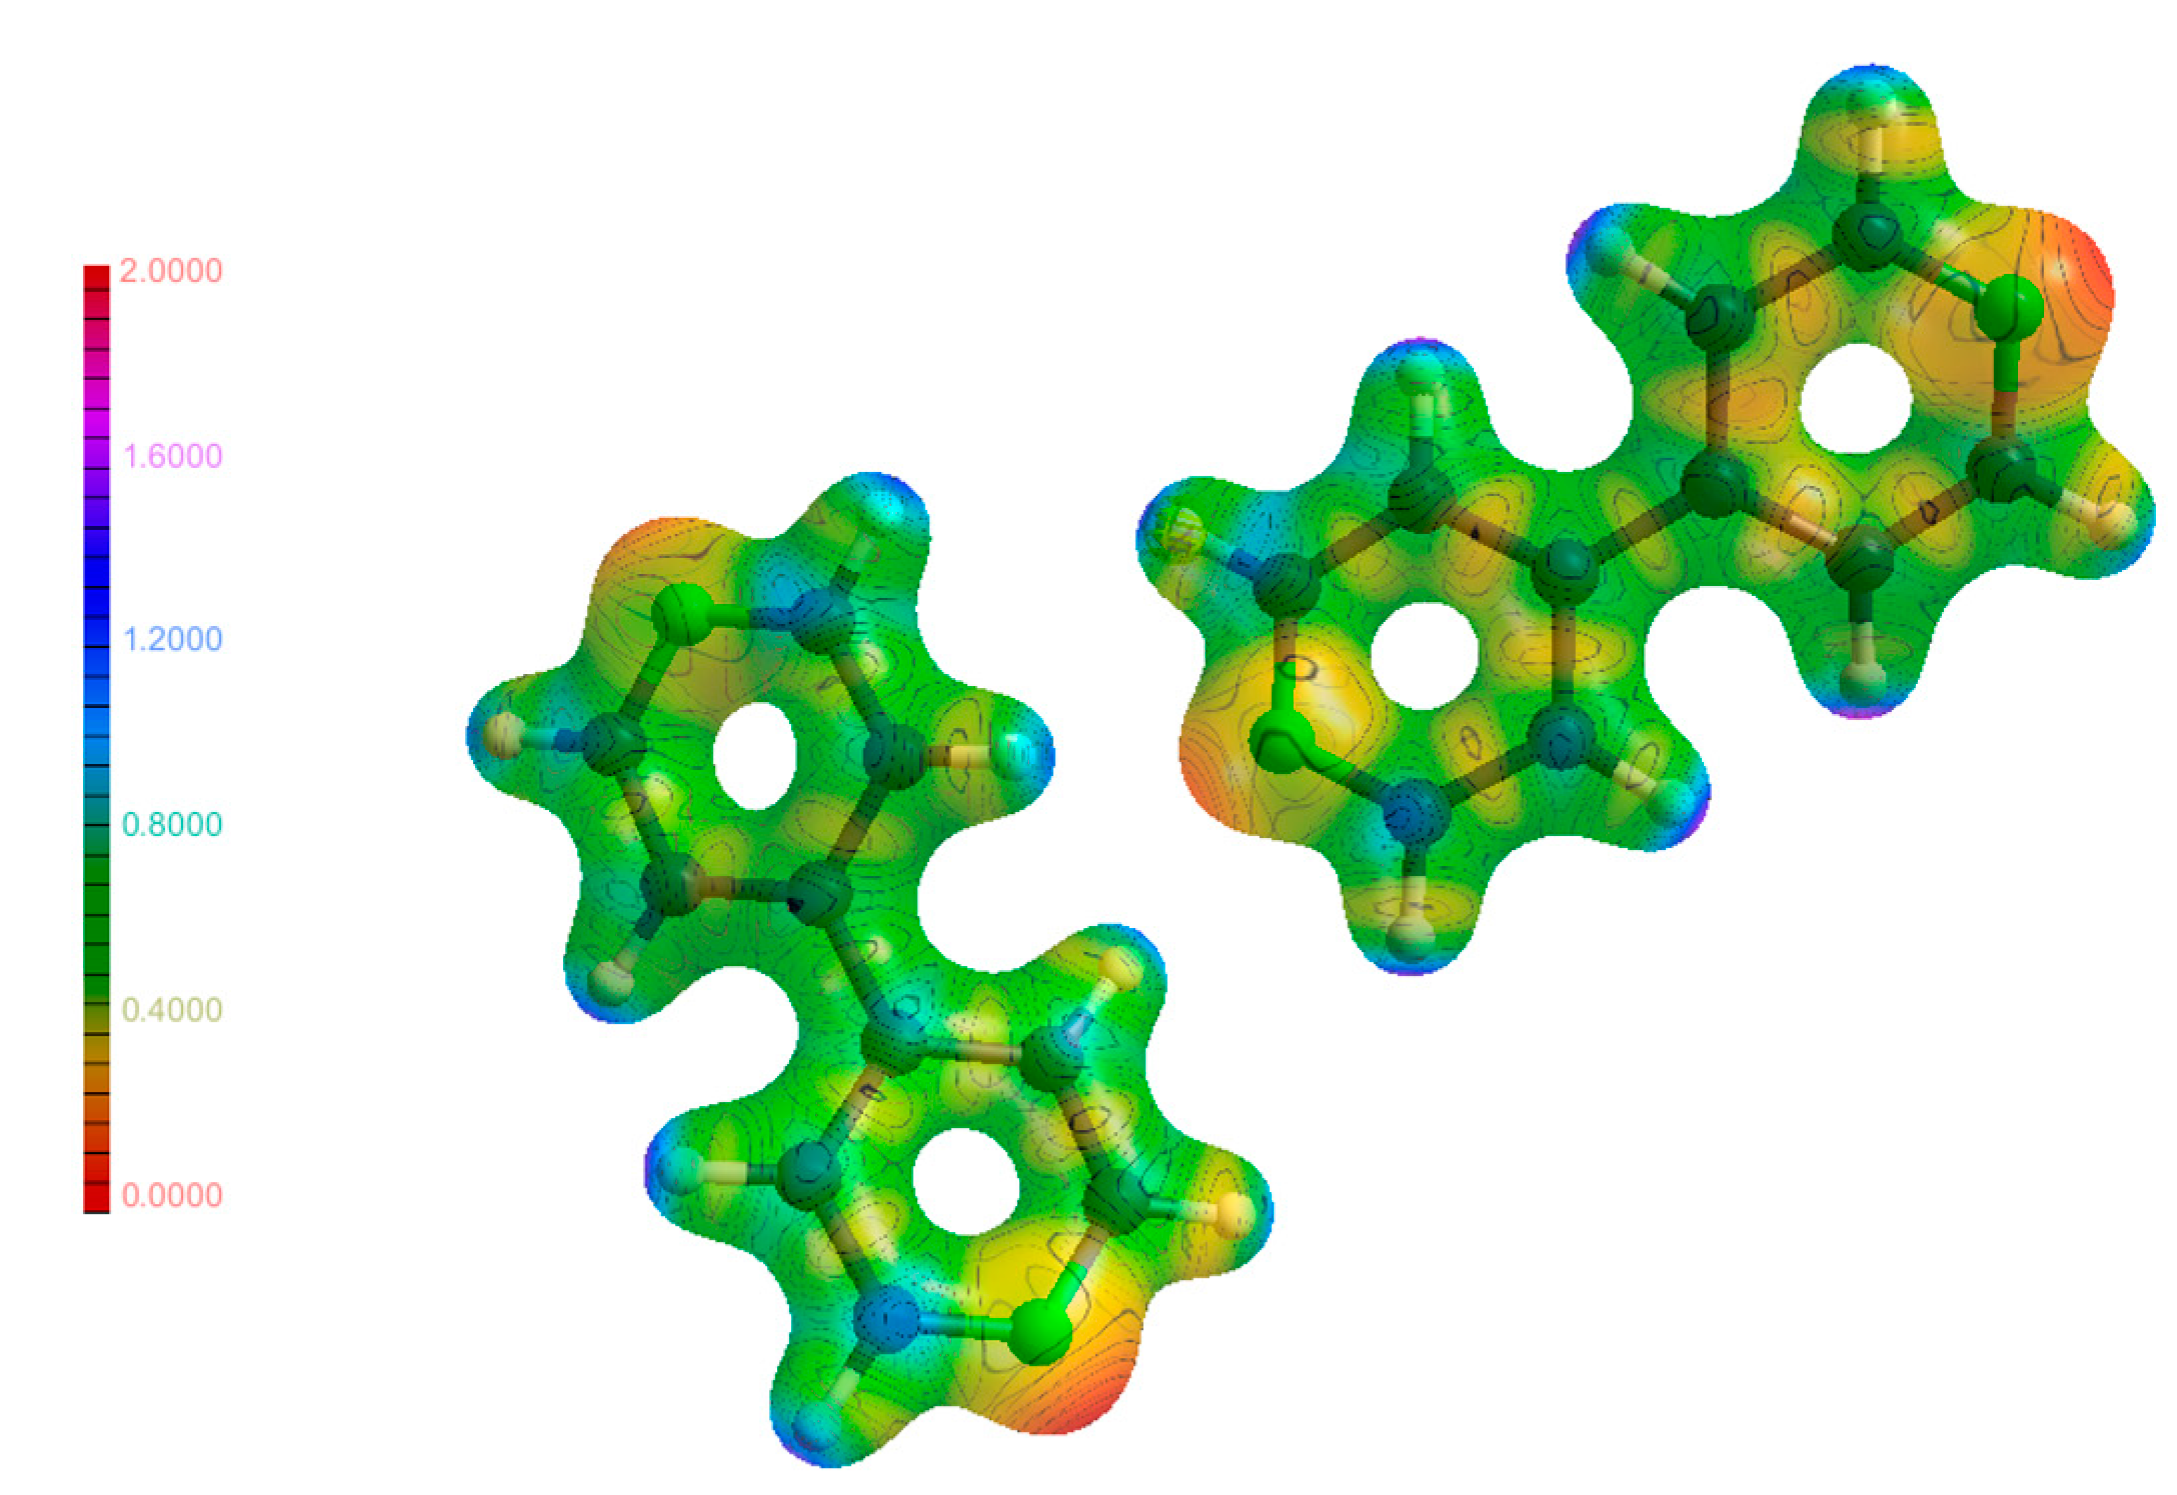
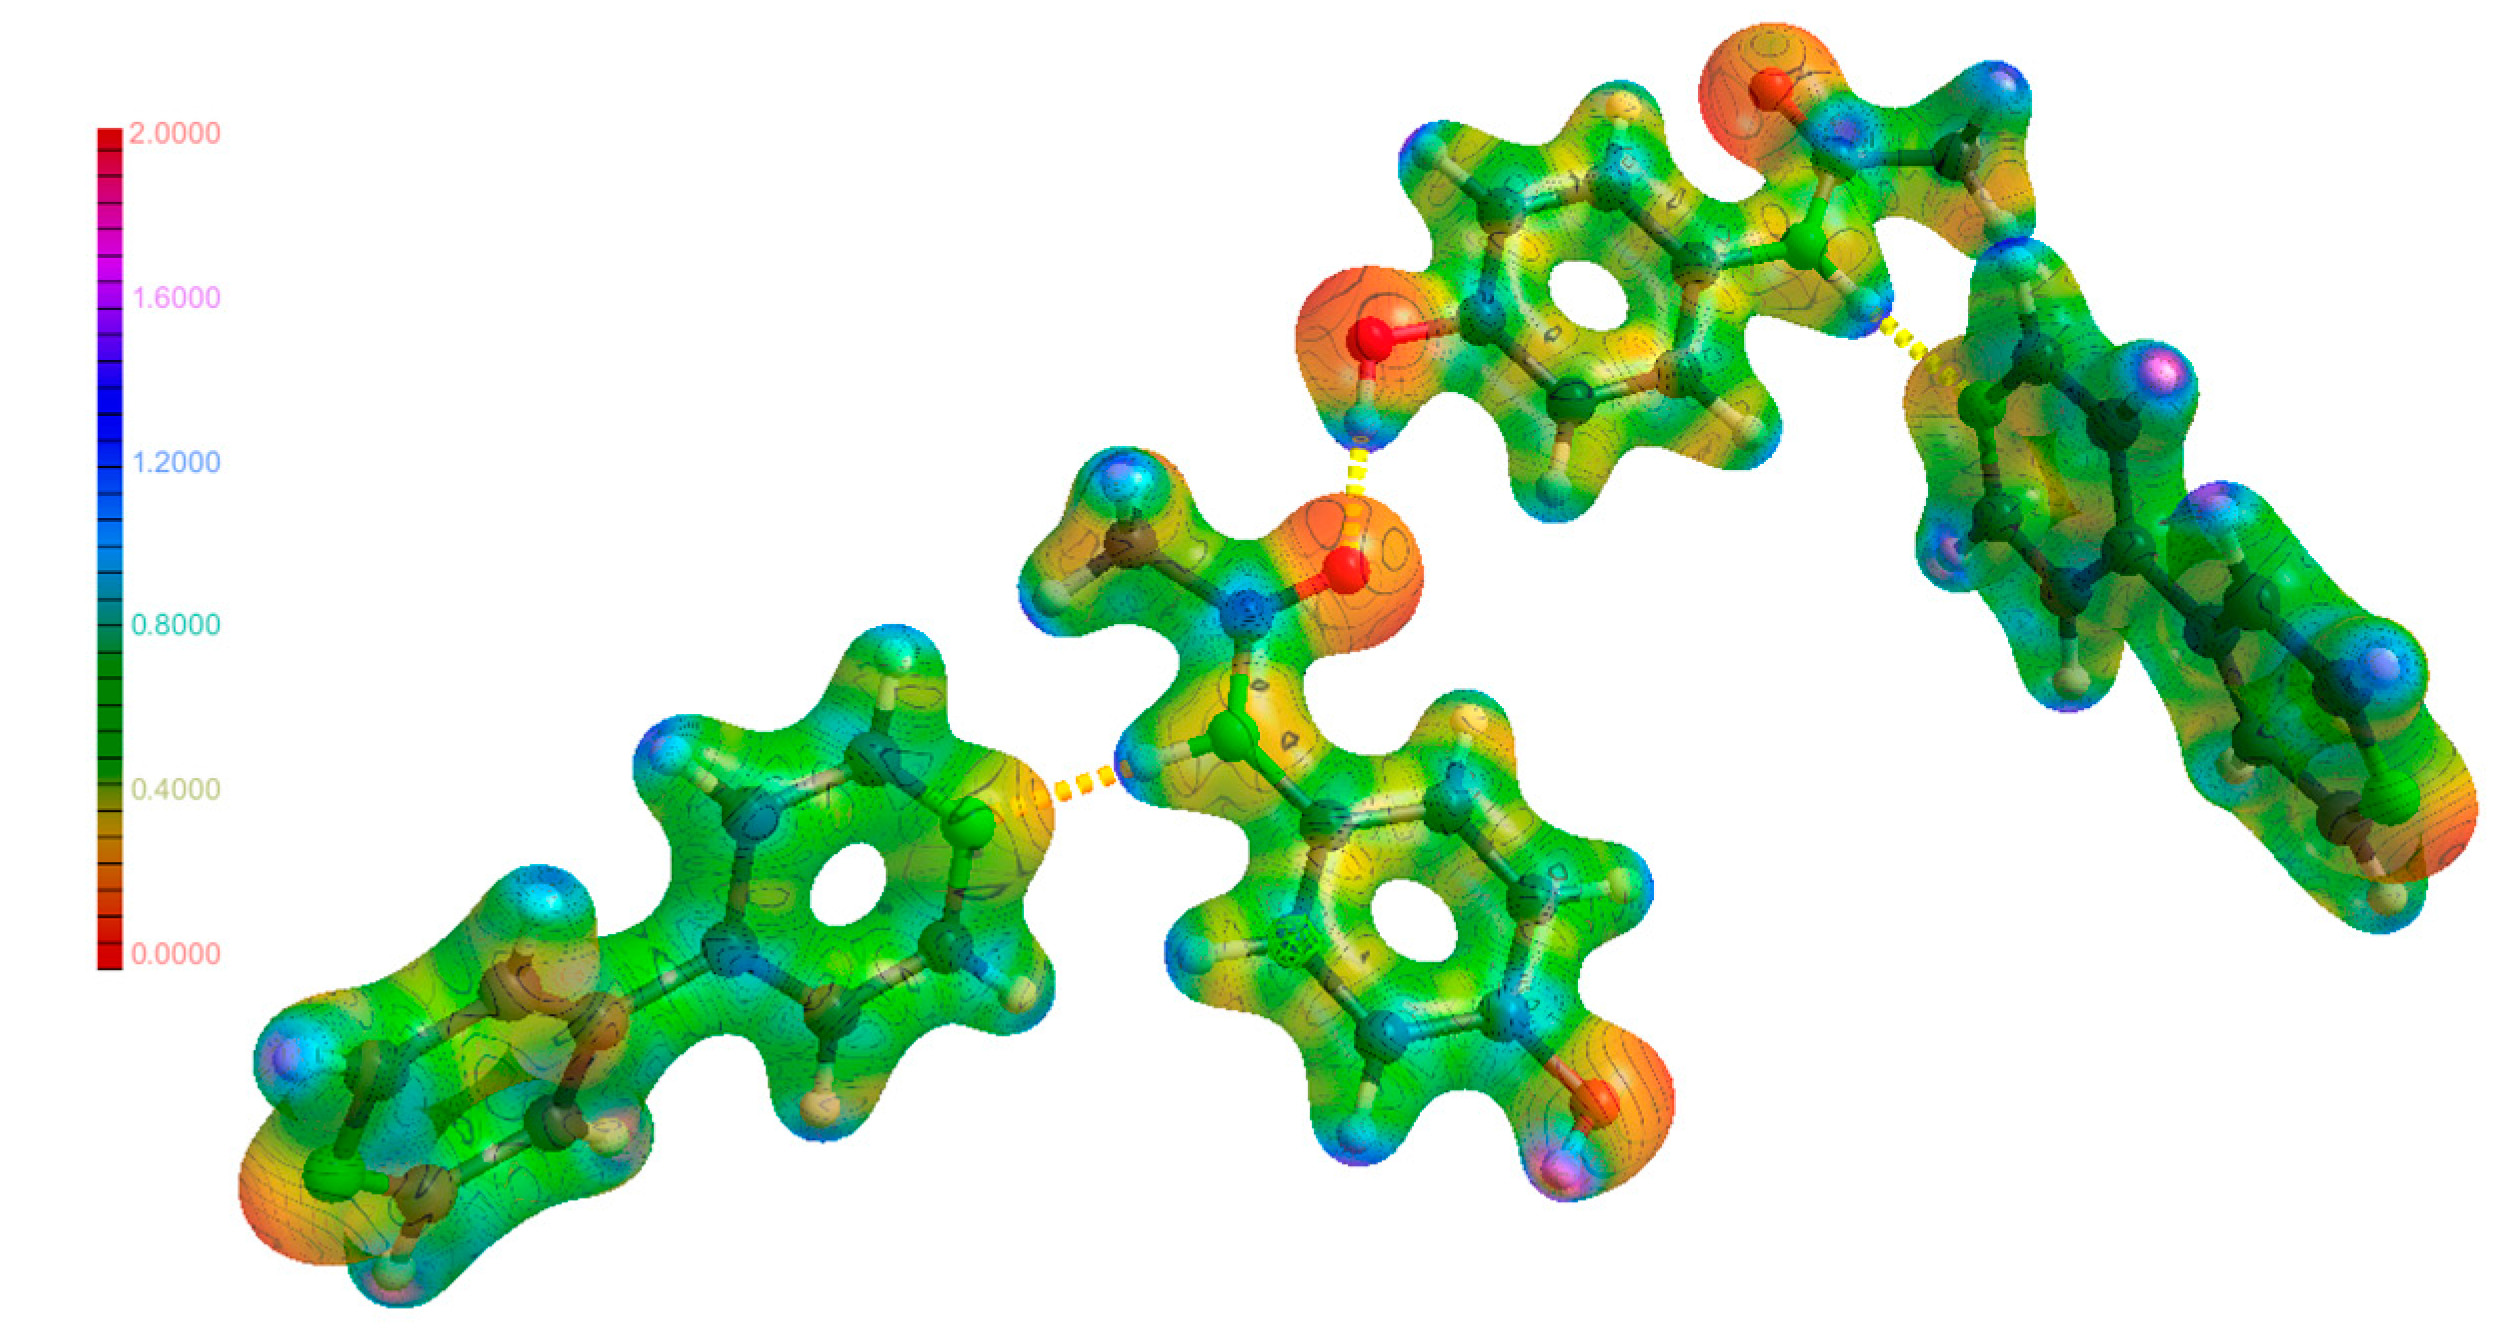
3.6. Electrostatic Potential
3.7. Lattice Energies
4. Conclusions
Supplementary Materials
Acknowledgments
Author Contributions
Conflicts of Interest
References and Note
- Desiraju, G.R. Crystal engineering: A holistic view. Angew. Chem. Int. Ed. 2007, 46, 8342–8356. [Google Scholar] [CrossRef] [PubMed]
- Mullard, A. 2012 FDA drug approvals. Nat Rev. Drug Discov. 2013, 12, 87–90. [Google Scholar] [CrossRef] [PubMed]
- Qiao, N.; Li, M.; Schlindwein, W.; Malek, N.; Davies, A.; Trappitt, G. Pharmaceutical cocrystals: An overview. Int. J. Pharm. 2011, 419, 1–11. [Google Scholar] [CrossRef] [PubMed]
- Springuel, G.; Norberg, B.; Robeyns, K.; Wouters, J.; Leyssens, T. Advances in pharmaceutical co-crystal screening: Effective co-crystal screening through structural resemblance. Cryst. Growth Des. 2012, 12, 475–484. [Google Scholar] [CrossRef]
- Aitipamula, S.; Banerjee, R.; Bansal, A.K.; Biradha, K.; Cheney, M.L.; Choudhury, A.R.; Desiraju, G.R.; Dikundwar, A.G.; Dubey, R.; Duggirala, N.; et al. Polymorphs, salts, and cocrystals: What’s in a name? Cryst. Growth Des. 2012, 12, 2147–2152. [Google Scholar] [CrossRef]
- Wood, P.A.; Feeder, N.; Furlow, M.; Galek, P.T.A.; Groom, C.R.; Pidcock, E. Knowledge-based approaches to co-crystal design. CrystEngComm 2014, 16, 5839–5848. [Google Scholar] [CrossRef]
- Di Martino, P.; Guyot-Hermann, A.M.; Conflant, P.; Drache, M.; Guyot, J.C. A new pure paracetamol for direct compression: The orthorhombic form. Int. J. Pharm. 1996, 128, 1–8. [Google Scholar] [CrossRef]
- Hiendrawan, S.; Veriansyah, B.; Widjojokusumo, E.; Soewandhi, S.N.; Wikarsa, S.; Tjandrawinata, R.R. Physicochemical and mechanical properties of paracetamol cocrystal with 5-nitroisophthalic acid. Int. J. Pharm. 2016, 497, 106–113. [Google Scholar] [CrossRef] [PubMed]
- Perrin, M.-A.; Neumann, M.A.; Elmaleh, H.; Zaske, L. Crystal structure determination of the elusive paracetamol form III. Chem. Commun. 2009, 3181–3183. [Google Scholar] [CrossRef] [PubMed]
- Beyer, T.; Day, G.M.; Price, S.L. The prediction, morphology, and mechanical properties of the polymorphs of paracetamol. J. Am. Chem. Soc. 2001, 123, 5086–5094. [Google Scholar] [CrossRef] [PubMed]
- Joiris, E.; Martino, P.D.; Berneron, C.; Guyot-Hermann, A.-M.; Guyot, J.-C. Compression behavior of orthorhombic paracetamol. Pharm. Res. 1998, 15, 1122–1130. [Google Scholar] [CrossRef] [PubMed]
- Ahmed, H. Relationship between Crystal Structure and Mechanical Properties in Cocrystals and Salts of Paracetamol. Licenciate Thesis, Luleå University of Technology, Luleå, Sweden, December 2014. [Google Scholar]
- Karki, S.; Friščić, T.; Fábián, L.; Laity, P.R.; Day, G.M.; Jones, W. Improving mechanical properties of crystalline solids by cocrystal formation: New compressible forms of paracetamol. Adv. Mater. 2009, 21, 3905–3909. [Google Scholar] [CrossRef]
- Gaussian09, Gaussian, Inc.: Wallingford, CT, USA, 2006.
- Becke, A.D. A new mixing of hartree-fock and local-density-functional theories. J. Chem. Phys. 1993, 98, 1372–1377. [Google Scholar] [CrossRef]
- Lee, C.; Yang, W.; Parr, R.G. Development of the colle-salvetti correlation-energy formula into a functional of the electron density. Phys. Rev. B Condens. Matter 1988, 37, 785–789. [Google Scholar] [CrossRef] [PubMed]
- Tawada, Y.; Tsuneda, T.; Yanagisawa, S.; Yanai, T.; Hirao, K. A long-range-corrected time-dependent density functional theory. J. Chem. Phys. 2004, 120, 8425–8433. [Google Scholar] [CrossRef] [PubMed]
- Yanai, T.; Tew, D.P.; Handy, N.C. A new hybrid exchange–correlation functional using the coulomb-attenuating method (cam-b3lyp). Chem. Phys. Lett. 2004, 393, 51–57. [Google Scholar] [CrossRef]
- Volkov, A.; Macchi, P.; Farrugia, L.J.; Gatti, C.; Mallinson, P.; Richter, T.; Koritsanszky, T. XD2006—A computer program for multipole refinement, topological analysis of charge densities and evaluation of intermolecular energies from experimental or theoretical structure factors. Available online: http://www.chem.gla.ac.uk/~louis/xd-home/docs/xd2006manual.pdf (accessed on 18 January 2018).
- Aimall, 14.06.21, TK Gristmill Software: Overland Park, KS, USA, 2014.
- Du, J.J.; Váradi, L.; Tan, J.; Zhao, Y.; Groundwater, P.W.; Platts, J.A.; Hibbs, D.E. Experimental and theoretical charge density distribution in pigment yellow 101. Phys. Chem. Chem. Phys. 2015, 17, 4677–4686. [Google Scholar] [CrossRef] [PubMed]
- Du, J.J.; Váradi, L.; Williams, P.A.; Groundwater, P.W.; Overgaard, J.; Platts, J.A.; Hibbs, D.E. An analysis of the experimental and theoretical charge density distributions of the piroxicam-saccharin co-crystal and its constituents. RSC Adv. 2016, 6, 81578–81590. [Google Scholar] [CrossRef]
- Lai, F.; Du, J.J.; Williams, P.A.; Váradi, L.; Baker, D.; Groundwater, P.W.; Overgaard, J.; Platts, J.A.; Hibbs, D.E. A comparison of the experimental and theoretical charge density distributions in two polymorphic modifications of piroxicam. Phys. Chem. Chem. Phys. 2016, 18, 28802–28818. [Google Scholar] [CrossRef] [PubMed]
- Farrugia, L.J. Ortep-3 for windows-a version of ortep-III with a graphical user interface (GUI). J. Appl. Crystallogr. 1997, 30, 565. [Google Scholar] [CrossRef]
- Ahmed, H.; Shimpi, M.R.; Velaga, S.P. Relationship between mechanical properties and crystal structure in cocrystals and salt of paracetamol. Drug Dev. Ind. Pharm. 2017, 43, 89–97. [Google Scholar] [CrossRef] [PubMed]
- Alkorta, I.; Elguero, J.; Roussel, C. A theoretical study of the conformation, basicity and nmr properties of 2,2′-, 3,3′-and 4,4′-bipyridines and their conjugated acids. Comput. Theor. Chem. 2011, 966, 334–339. [Google Scholar] [CrossRef]
- Surov, A.O.; Solanko, K.A.; Bond, A.D.; Bauer-Brandl, A.; Perlovich, G.L. Polymorphism of felodipine co-crystals with 4,4'-bipyridine. CrystEngComm 2014, 16, 6603–6611. [Google Scholar] [CrossRef]
- Macrae, C.F.; Bruno, I.J.; Chisholm, J.A.; Edgington, P.R.; McCabe, P.; Pidcock, E.; Rodriguez-Monge, L.; Taylor, R.; Streek, J.; Wood, P.A. Mercury CSD 2.0-new features for the visualization and investigation of crystal structures macrae. J. Appl. Cryst. 2008, 41, 466–470. [Google Scholar] [CrossRef]
- Maestro, Version 10.1, Schrödinger, LLC: New York, NY, USA, 2015.
- Bader, R.F. Atoms in Molecules: A Quantum Theory; Oxford University Press: Oxford, UK, 1990. [Google Scholar]
- Coppens, P. X-ray Charge Densities and Chemical Bonding; Oxford University Press: New York, NY, USA, 1997. [Google Scholar]
- Abramov, Y. On the possibility of kinetic energy density evaluation from the experimental electron-density distribution. Acta Crystallogr. A Found. Crystallogr. 1997, 53, 264–272. [Google Scholar] [CrossRef]
- Espinosa, E.; Souhassou, M.; Lachekar, H.; Lecomte, C. Topological analysis of the electron density in hydrogen bonds. Acta Crystallogr. B Struct. Sci. 1999, 55, 563–572. [Google Scholar] [CrossRef]
- Hibbert, F.; Emsley, J. Hydrogen bonding and chemical reactivity. Adv. Phys. Org. Chem. 1990, 26, 255–379. [Google Scholar]
- Hambley, T.W.; Hibbs, D.E.; Turner, P.; Howard, S.T.; Hursthouse, M.B. Insights into bonding and hydrogen bond directionality in thioacetamide from the experimental charge distribution. J. Chem. Soc. Perkin Trans. 2 2002, 0, 235–239. [Google Scholar] [CrossRef]
- Nguyen, T.H.; Groundwater, P.W.; Platts, J.A.; Hibbs, D.E. Experimental and theoretical charge density studies of 8-hydroxyquinoline cocrystallized with salicylic acid. J. Phys. Chem. A 2012, 116, 3420–3427. [Google Scholar] [CrossRef] [PubMed]
- Waller, M.P.; Robertazzi, A.; Platts, J.A.; Hibbs, D.E.; Williams, P.A. Hybrid density functional theory for π-stacking interactions: Application to benzenes, pyridines, and DNA bases. J. Comput. Chem. 2006, 27, 491–504. [Google Scholar] [CrossRef] [PubMed]
- Gibbs, G.V.; Hill, F.C.; Boisen, M.B.; Downs, R.T. Power law relationships between bond length, bond strength and electron density distributions. Phys. Chem. Miner. 1998, 25, 585–590. [Google Scholar] [CrossRef]
- Crystal Explorer, ver. 3.1; University of Western Australia: Perth, Australia, 2013.
- Spackman, M.A.; Jayatilaka, D. Hirshfeld surface analysis. CrystEngComm 2009, 11, 19–32. [Google Scholar] [CrossRef]
- Surov, A.O.; Simagina, A.A.; Manin, N.G.; Kuzmina, L.G.; Churakov, A.V.; Perlovich, G.L. Fenamate cocrystals with 4,4′-bipyridine: Structural and thermodynamic aspects. Cryst. Growth Des. 2015, 15, 228–238. [Google Scholar] [CrossRef]
- Volkov, A.; Coppens, P. Calculation of electrostatic interaction energies in molecular dimers from atomic multipole moments obtained by different methods of electron density partitioning. J. Comput. Chem. 2004, 25, 921–934. [Google Scholar] [CrossRef] [PubMed]
- Volkov, A.; Koritsanszky, T.; Coppens, P. Combination of the exact potential and multipole methods (ep/mm) for evaluation of intermolecular electrostatic interaction energies with pseudoatom representation of molecular electron densities. Chem. Phys. Lett. 2004, 391, 170–175. [Google Scholar] [CrossRef]
- Gavezzotti, A. Calculation of lattice energies of organic crystals: The pixel integration method in comparison with more traditional methods. Z. Krist. Cryst. Mater. 2005, 220, 499. [Google Scholar] [CrossRef]
- Spackman, M.A. How reliable are intermolecular interaction energies estimated from topological analysis of experimental electron densities? Cryst. Growth Des. 2015, 15, 5624–5628. [Google Scholar] [CrossRef]
- Volkov, A.; Wu, G.; Coppens, P. X-ray charge density study of p-amino-p′-nitrobiphenyl at 20 K using a CCD area detector and synchrotron radiation: A very large dipole moment enhancement in the solid state. J. Synchrotron Radiat. 1999, 6, 1007–1015. [Google Scholar] [CrossRef]


| 1 | 2 | 3 | |
|---|---|---|---|
| Formula | C8H9N1O2 | C20H16N4 | C36H34N6O4 |
| Molecular Mass | 151.16 | 312.37 | 614.69 |
| Crystal Size (mm) | 0.1 × 0.25 × 0.15 | 0.1 × 0.2 × 0.5 | 0.3 × 0.25 × 0.3 |
| Temperature (K) | 150 | 150 | 150 |
| Crystal System | Monoclinic | Triclinic | Monoclinic |
| Space Group | P21/n | P | P21/c |
| a (Å) | 7.093(1) | 8.693(2) | 11.307(1) |
| b (Å) | 9.241(1) | 8.735(2) | 24.118(2) |
| c (Å) | 11.635(1) | 10.982(2) | 11.566(1) |
| α (o) | 85.14(2) | ||
| β (o) | 97.75(1) | 85.37(2) | 96.21(1) |
| γ (o) | 98.95(2) | ||
| Volume (Å3) | 755.67(1) | 813.80(3) | 3135.72 |
| Z | 4 | 2 | 4 |
| Refinement Method | Full-matrix least-squares on F2 | Full-matrix least-squares on F2 | Full-matrix least-squares on F2 |
| No. of Reflections collected | 325,928 | 55,114 | 410,446 |
| No. Unique | 12,351 | 13,284 | 35,389 |
| Rint | 0.0344 | 0.0162 | 0.0518 |
| Completeness (%) | 99.9 | 99.1 | 99.0 |
| No. Reflections Used | 10,0164 | 19,186 | 170,540 |
| ρc (g·cm−1) | 1.329 | 1.275 | 1.336 |
| F(000) | 320 | 328 | 1316 |
| μ (mm−1) | 0.096 | 0.078 | 0.102 |
| sin θ/λmax | 1.25 | 1.00 | 1.11 |
| θ Range for Data Collection (°) | 3.534–62.673 | 2.920–45.294 | 3.379–52.222 |
| Index Ranges | −17 ≤ h ≤ 17 −23 ≤ k ≤ 23 −29 ≤ l ≤ 29 | −17 ≤ h ≤ 17 −17 ≤ k ≤ 17 −21 ≤ l ≤ 21 | −24 ≤ h ≤ 25 −53 ≤ k ≤ 53 −25 ≤ l ≤ 25 |
| IAM Refinement | |||
| Final R1, wR2 | 0.0329, 0.118 | 0.0470, 0.150 | 0.0612, 0.195 |
| Goodness of Fit | 0.983 | 1.018 | 1.012 |
| Residual Density (eÅ−3) | −0.31, 0.5 | −0.27, 0.49 | 0.26, 0.56 |
| Multipole Refinement | |||
| Nobs/Nvar | 31.13 | 16.76 | 15.29 |
| R(F), R(F2), all data | 0.0388, 0.0377 | 0.0435, 0.0305 | 0.1027, 0.0439 |
| R(F), R(F2) > 2σ(F) | 0.0221, 0.0370 | 0.0271, 0.0298 | 0.0408, 0.0350 |
| Goodness of Fit | 2.8370 | 1.4609 | 1.5576 |
| Residual Density (eÅ−3) | −0.256, 0.107 | −0.126, 0.116 | −0.130, 0.130 |
| Bond | ρ (eÅ−3) | ∇2ρ (eÅ−5) | ε | dH···bcp (Å) | dA···bcp (Å) | G/Eh (eÅ−3) | V/Eh (eÅ−3) | H/Eh (eÅ−3) | G/ρ | EHB (kJ·mol−1) |
|---|---|---|---|---|---|---|---|---|---|---|
| Intramolecular | ||||||||||
| C(05′)–H(05′)···O(02′) | 0.129 | 1.7 | 0.21 | 0.911 | 1.307 | 0.11 | −0.09 | 0.01 | 36.18 | |
| C(05)–H(05)···O(02) | 0.135 | 1.8 | 0.15 | 0.918 | 1.303 | 0.11 | −0.1 | 0.01 | 0.83 | 38.4 |
| Intermolecular | ||||||||||
| N(01)–H(01)···N(2) | 0.14 | 2.5 | 0.06 | 0.698 | 1.316 | 0.15 | −0.12 | 0.03 | 1.06 | 46.45 |
| N(01′)–H(01′)···N(2′) | 0.172 | 2.8 | 0.05 | 0.668 | 1.267 | 0.17 | −0.15 | 0.02 | 1.02 | 58.97 |
| C(02)–H(02)···N(1′) a | 0.051 | 0.6 | 0.30 | 1.187 | 1.576 | 0.03 | −0.03 | 0.01 | 0.68 | 10.02 |
| C(03′)–H(03′)···N(1) b | 0.050 | 0.6 | 0.09 | 1.136 | 1.516 | 0.04 | −0.03 | 0.01 | 0.71 | 10.09 |
| C(3′)–H(3′)···O(01′) c | 0.030 | 0.5 | 0.41 | 1.102 | 1.562 | 0.03 | −0.02 | 0.01 | 0.87 | 6.44 |
| C(4)–H(4)···O(02′) d | 0.033 | 0.5 | 0.11 | 1.061 | 1.531 | 0.03 | −0.02 | 0.01 | 0.85 | 7.04 |
| C(8′)–H(8′)···O(01) e | 0.01 | 0.4 | 5.05 | 1.048 | 1.716 | 0.02 | −0.01 | 0.01 | 1.98 | 4.08 |
| C(08)–H(08A)···O(01′) f | 0.011 | 0.5 | 4.47 | 1.041 | 1.656 | 0.02 | −0.01 | 0.01 | 1.95 | 4.44 |
| C(9)–H(9)···O(02) g | 0.036 | 0.6 | 0.24 | 1.096 | 1.503 | 0.03 | −0.02 | 0.01 | 0.81 | 7.53 |
| O(01)–H(01A)···O(02′) h | 0.203 | 4.5 | 0.02 | 0.575 | 1.161 | 0.26 | −0.22 | 0.05 | 1.3 | 84.33 |
| Short Contacts | ||||||||||
| H(9)···H(03) | 0.041 | 0.6 | 0.91 | 1.301 | 1.105 | 0.03 | −0.02 | 0.01 | 0.73 | 8.07 |
| Paracetamol |  |  | 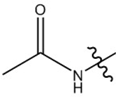 |
|---|---|---|---|
| Ω(1) | −0.52 | 0.97 | −0.39 |
| Ω(3) Molecule 1 | −0.71 | 0.86 | −0.13 |
| Ω(3) Molecule 2 | −0.63 | 0.78 | −0.17 |
| 4,4-bipyridine | 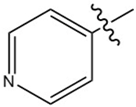 | ||
| Ω(2) Molecule 1 | −0.03 | 0.05 | |
| Ω(2) Molecule 2 | 0.08 | −0.05 | |
| Ω(3) Molecule 1 | 0.03 | 0.03 | |
| Ω(3) Molecule 2 | 0.02 | 0.06 |
| PCM | 44BP | PCM-44BP | |
|---|---|---|---|
| LATEN | −188.5 | −311.2 | −271.3 |
| PIXEL | −170.7 | −110.5 | −228.9 * |
© 2018 by the authors. Licensee MDPI, Basel, Switzerland. This article is an open access article distributed under the terms and conditions of the Creative Commons Attribution (CC BY) license (http://creativecommons.org/licenses/by/4.0/).
Share and Cite
Du, J.J.; Lai, F.; Váradi, L.; Williams, P.A.; Groundwater, P.W.; Platts, J.A.; Hibbs, D.E.; Overgaard, J. Monoclinic Paracetamol vs. Paracetamol-4,4′-Bipyridine Co-Crystal; What Is the Difference? A Charge Density Study. Crystals 2018, 8, 46. https://doi.org/10.3390/cryst8010046
Du JJ, Lai F, Váradi L, Williams PA, Groundwater PW, Platts JA, Hibbs DE, Overgaard J. Monoclinic Paracetamol vs. Paracetamol-4,4′-Bipyridine Co-Crystal; What Is the Difference? A Charge Density Study. Crystals. 2018; 8(1):46. https://doi.org/10.3390/cryst8010046
Chicago/Turabian StyleDu, Jonathan J., Felcia Lai, Linda Váradi, Peter A. Williams, Paul W. Groundwater, James A. Platts, David E. Hibbs, and Jacob Overgaard. 2018. "Monoclinic Paracetamol vs. Paracetamol-4,4′-Bipyridine Co-Crystal; What Is the Difference? A Charge Density Study" Crystals 8, no. 1: 46. https://doi.org/10.3390/cryst8010046