Article

Febuxostat-Minoxidil Salt Solvates: Crystal Structures, Characterization, Interconversion and Solubility Performance

1
School of Biology and Biological Engineering, South China University of Technology, Guangzhou 510006, China
2
Université Paris Diderot, Sorbonne Paris Cité, ITODYS, UMR 7086 CNRS, 15 rue J-A de Baïf, 75205 Paris CEDEX 13, France
3
MOE Joint International Research Laboratory of Synthetic Biology and Medicine, South China University of Technology, Guangzhou 510006, China
*
Author to whom correspondence should be addressed.
Crystals 2018, 8(2), 85; https://doi.org/10.3390/cryst8020085
Submission received: 5 January 2018 / Revised: 2 February 2018 / Accepted: 2 February 2018 / Published: 5 February 2018
(This article belongs to the Special Issue Novel Pharmaceutical Cocrystals and Their Applications)

Abstract

:
Three febuxostat-minoxidil salt solvates with acetone (ACE), tetrahydrofuran (THF) and isopropanol (IPA) are synthesized by solvent-assisted grinding and characterized by infrared (IR), nuclear magnetic resonance (1H-NMR), single crystal and powder X-ray diffraction (PXRD), thermogravimetry (TG) and differential scanning calorimetry (DSC). These febuxostat-minoxidil salt solvates feature isostructural with the same stoichiometries (1:1:1 molecule ratio). The proton transfers from the carboxylic group of febuxostat (FEB) to imino N atom of minoxidil (MIN), which forms the motif with combined R 2 2 (9) R 4 2 (8) R 2 2 (9) graph set in the three solvates. The solvents occupy the different positions related to the motif, which results in the apparent differences in PXRD patterns before/after desolvation although they are isostructures. The FEB-MIN·THF was more thermostable than FEB-MIN·ACE and FEB-MIN·IPA relative to solvent removal from DSC patterns, which is different from the results from the solvent-exchange experiments in chemical kinetics. All three salt solvates exhibit increased equilibrium solubility compared to FEB in aqueous medium.

1. Introduction

The performance of medication solubility has received more attention from the pharmaceutical industry in the past few years, because it generally can affect the bioavailability of Biopharmaceutics Classification System (BCS) class II drug [1]. The solubility of BCS II drug could be improved by many methods, such as nanosuspensions, nanocrystals, solid dispersions, co-crystals, hydrates, salts and so on [2,3,4,5]. Among these strategies, salt formation always features high solubility for the acid or basic drug to improve the bioavailability, and is also an important way to develop a new drug or to avoid the patent. In recent years, some solvates (Jevtana®, Cabazitaxel Acetone; Makinist®, Trametinib Dimethyl Sulfoxide) and salt hydrates (Tenelia®, Teneligliptin Hydrobromide Hydrate; Acofide®, Acotiamide Hydrochloride Hydrate) have been approved by the Federal Drug Administration (FDA) to market, which encourages pharmacologists and chemists to seek for new pharmacologically acceptable salt formation or solvates. Since multicomponent crystallization screening has begun to be routinely performed, solvates or hydrates of salt formation have been a subject of keen interest in order to control polymorphic formation and to explore the formation mechanism [6,7,8,9,10].
Febuxostat (2-[3-cyano-4-isobutoxyphenyl]-4-methylthiazole-5-carboxylc acid, FEB in short) is a non-purine selective inhibitor of xanthine oxidase which is used for lowering the level of serum uric acid (sUA) in vivo [11,12]. FEB has become the most regularly and widely applied drug for the treatment of hyperuricemia in patients with gout [13]. FEB is classified as a BCS II drug due to its low solubility (12.9 mg/L) and high permeability [14]. In recent years, several FEB polymorphs [15], solvates [16,17,18], cocrystals [19,20], and salts [21,22] have been reported. All salts feature increased dissolution rates and enhanced solubility compared with FEB.
FEB can conjugate with pyridine to form cocrystal through hydrogen bonding interaction [17], and with 2-methylimidazole or di-2-pyridylamine [21] to form salts and dimeric monoanion. Minoxidil (MIN) is a nitrogen heterocyclic compound with multiple hydrogen-bonding sites, which has been used as a coformer in cocrystallization of carboxyl- and hydroxy-derived molecules and enhanced the solubility of poor water soluble active pharmaceutical ingredients (APIs) [23]. In the past, we find that the solvent can tune the self-assembly of API due to the different molecular size or hydrogen-bonding potency. Hence, in order to understand the effect of solvent on self-assembly and to improve the FEB solubility, MIN is selected to conjugate with FEB under different solvents (Scheme 1), and three salts solvates have been obtained by solvent-assisted grinding. The properties of the three salt solvates (namely FEB-MIN·ACE, FEB-MIN·THF and FEB-MIN·IPA) have also been determined through different physical methods.

2. Materials and Methods

2.1. Materials and Equipment

All reagents were purchased commercially and used without further purification. Nuclear magnetic resonance (1H-NMR) spectra were obtained on a Bruker 400 MHz instrument using DMSO-d6 as solvent and TMS as an internal standard. Thermogravimetric analysis (TG) was carried out in a TA corporation Q500 equipment with the heating rate of 10 °C/min under a nitrogen gas purge with a flow of 60 mL/min. Thermal analysis (DSC) was carried out in a TA corporation Q2000 equipment with the heating rate of 10 °C/min under a nitrogen gas purge with a flow of 50 mL/min. Fourier infrared spectra (IR) were performed on a PerkinElmer Spectrum Two instrument in the scan range of 4000–500 cm−1 range. Powder X-ray diffraction (PXRD) patterns were recorded on a German Bruker corporation D8 ADVANCE powder diffractometer coupled with a Cu Kα radiation tube (λ = 1.5418 Å, V = 40 kV and I = 40 mA) and 2θ scan in the 5–40° range. Variable-temperature powder (PXRD) patterns were recorded on a Netherlands PANalytical Empyrean diffractometer coupled with a Cu Kα radiation tube (λ = 1.5406 Å, V = 45 kV and I = 40 mA) and 2θ scan in the 3–60° range, with an increasing step size of 0.0167° and counting time duration of 10 s for each step.

2.2. Preparation of FEB-MIN·ACE

FEB-MIN·ACE was obtained upon acetone-assisted grinding about a total of 200 mg of a 1:1 stoichiometric ratio of FEB and MIN for 1 h. Single crystals of FEB-MIN·ACE were obtained by slow evaporation from the saturated solutions as follow. About 100 mg of the grinding sample of FEB-MIN·ACE was mixed with ACE solvent (15 mL), and then distilled water (about 1500 μL) was added into the above mixture under stirring until the solid was completely dissolved. The resulting solution was filtered and maintained at room temperature for slow evaporation. Fine block shaped crystals were obtained after 10–14 days. Yield: 56% (based on FEB) (Figure S13).

2.3. Preparation of FEB-MIN·THF

The preparation of FEB-MIN·THF was analogue to FEB-MIN·ACE only replacing ACE with THF. Fine block shaped crystals were obtained after 15–21 days. Yield: 51% (based on FEB) (Figure S14).

2.4. Preparation of FEB-MIN·IPA

The preparation of FEB-MIN·IPA was analogue to FEB-MIN·ACE only replacing ACE with IPA. Fine block shaped crystals were obtained after 15–21 days. Yield: 62% (based on FEB) (Figure S16).

2.5. Desolvation Experiments

Solid samples of the three salt solvates were placed in a vacuum drying oven at 110 °C for 24 h. The solids were analyzed by PXRD.

2.6. X-ray Crystallographic Studies

All the crystal structures were measured by single-crystal X-ray diffraction and the diffraction data were collected on a Bruker Apex II CCD diffractometer operating at 50 kV and 30 mA using Mo Kα radiation (λ = 0.71073 Å). All the crystal structures were solved by direct method with SHELXS program and refined with SHELXL or OLEX2 program [24,25]. The final refinements of all non-hydrogen atoms were performed through full-matrix least-squares methods with anisotropic thermal parameters on F2. The hydrogen atoms on non-carbon atoms were located from difference Fourier maps and the hydrogen atoms riding on the carbon atoms were determined by theoretical calculation and refined isotropically. Crystallographic parameters and hydrogen bonds are listed in Table 1 and Table 2.

2.7. Solvent-Exchange Experiments

Transformation studies were measured in a round bottomed flask at 37.0 ± 0.5 °C in different solvents, including ACE, THF, IPA and mixed solvents (nACE:nTHF:nIPA = 1:1:1). The sole solvent-exchange was performed by adding the solid sample (about 250 mg) into the corresponding solvent (5 mL) and stirring for 24 h. Entry 13 was carried out by adding 250.0 mg of FEB-MIN·ACE, or FEB-MIN·THF or FEB-MIN·IPA into 5 mL of mixed solvent and stirring at 500 rpm for 24 and 48 h, respectively. After stirring for 24 or 48 h, the un-dissolved solids were collected, washed quickly with diethyl ether (2 mL), and dried at 40 °C for 12 h. The obtained samples were analyzed by PXRD and NMR.

2.8. Equilibrium Solubility Experiments

Equilibrium solubility experiments were conducted on a round bottomed flask at 37.0 ± 0.5 °C in aqueous medium. In a typical experiment, 25 mL of aqueous medium was added to a round bottomed flask containing 200 mg of solid samples at 500 rpm. The resulting solution was filtered with 0.22 μm nylon filter. The equilibrium solubility of FEB and three salt solvates was measured by an Agilent 1200 HPLC system at 315 nm using a C18 column (Diamonsil C18 column, 5 μm, 4.6 mm × 250 mm). The mobile phase consisted of methanol/acetonitrile/0.05% phosphoric acid 24/46/30 (v/v/v) under isocratic elution with a flow rate of 1.0 mL/min.

3. Results and Discussion

3.1. Crystal Structures

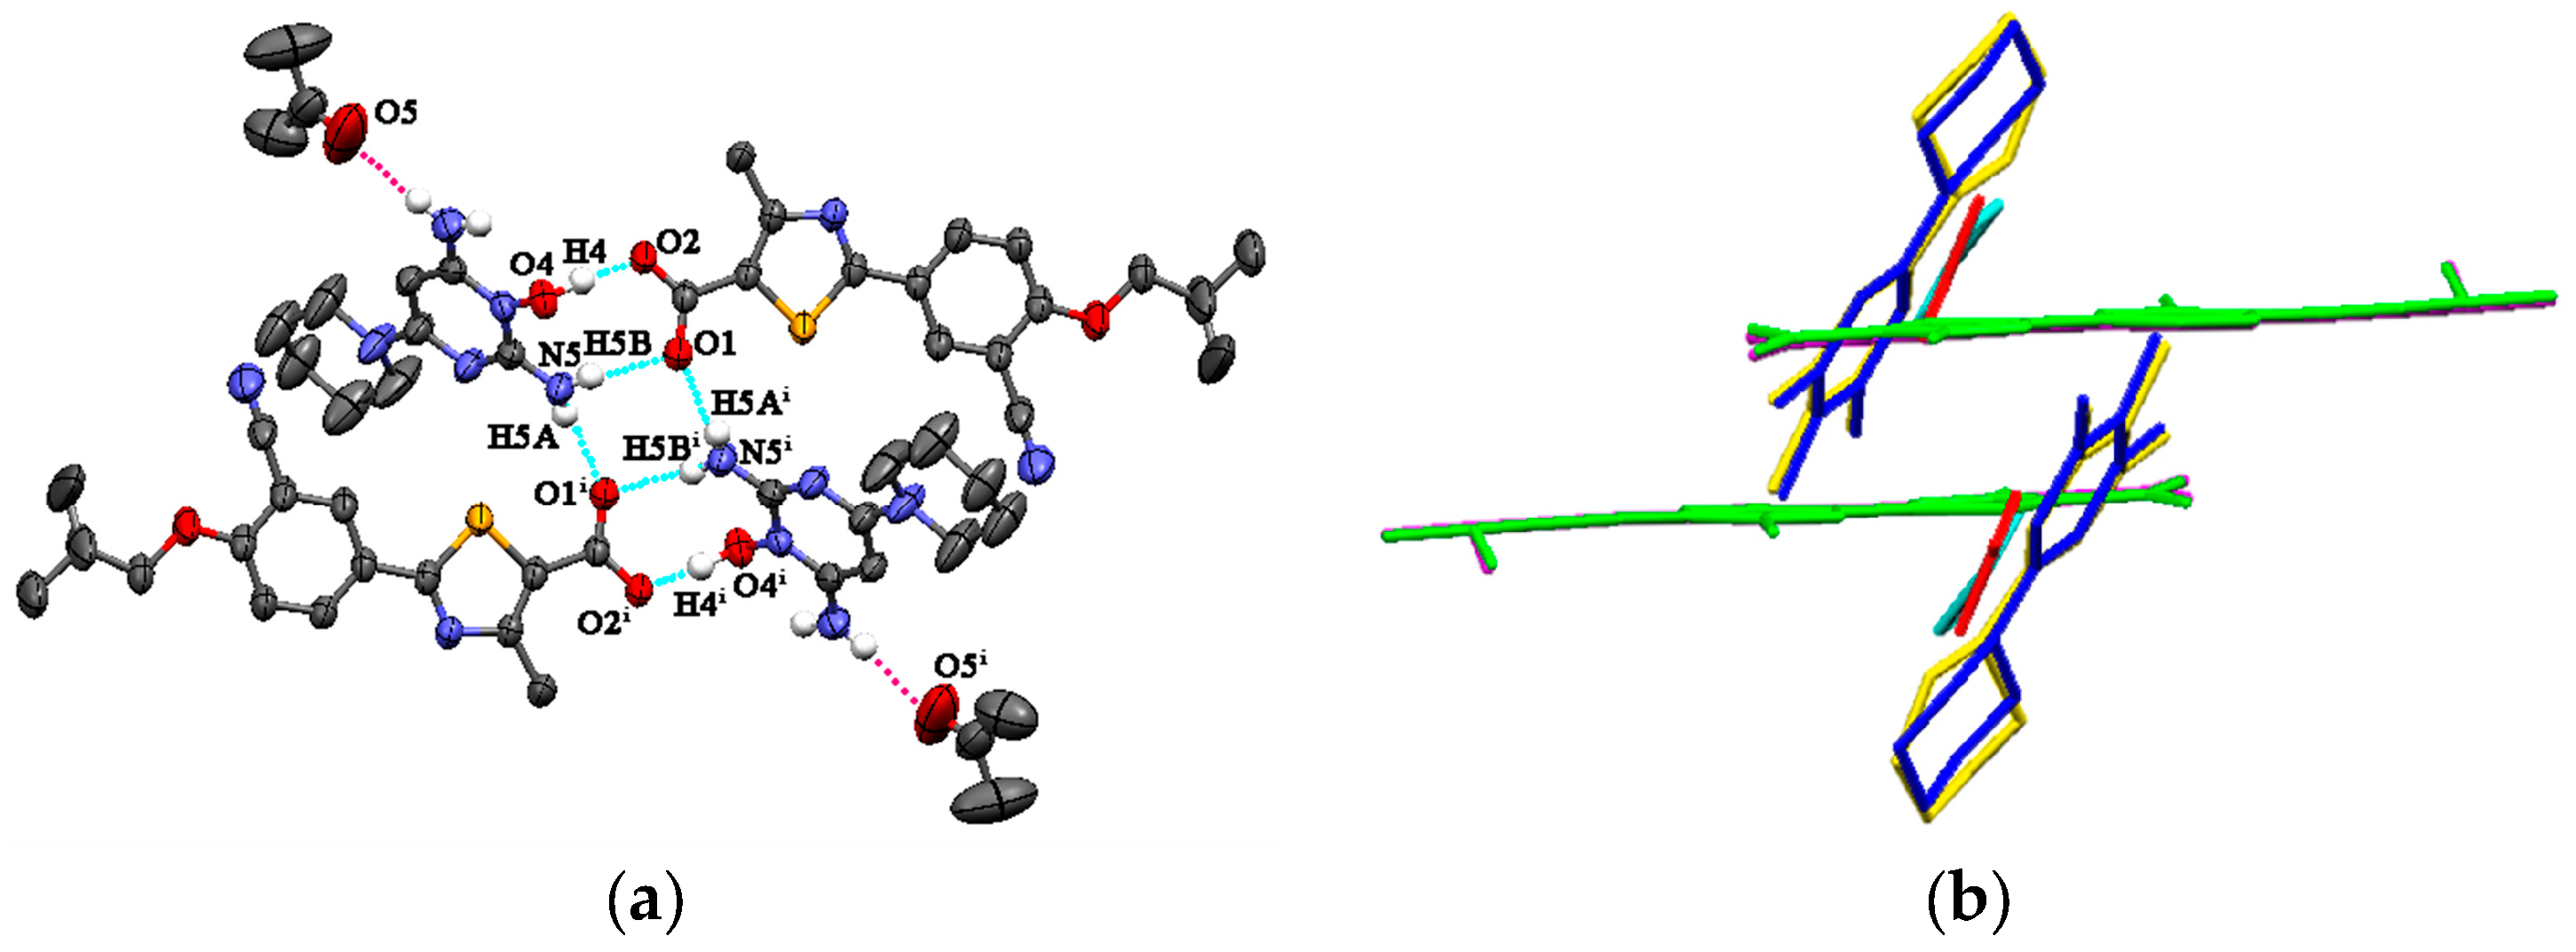
3.1.1. Crystal Structures of FEB-MIN·ACE and FEB-MIN·THF

FEB-MIN·ACE and FEB-MIN·THF are isostructural salt solvates, and both crystallize in the triclinic P-1 space group with a 1:1:1 stoichiometry. The isostructural FEB-MIN·ACE and FEB-MIN·THF have the same basic structural motif, in which one proton from the carboxylic group of FEB transfers to the imino N5 atom of MIN. In the compounds of FEB-MIN·ACE and FEB-MIN·THF, two FEB anions and two MIN cations form a tetrameric R 2 2 (9) R 4 2 (8) R 2 2 (9) graph set through O4-H4···O2, N5-H5A···O1i and N5-H5B···O1 hydrogen bonds (Figure 1a). Meanwhile, two solvent molecules are centrosymmetrically tethered to protonated MIN molecules by weak N-HMIN···OACE/THF hydrogen bond interactions in FEB-MIN·ACE and FEB-MIN·THF, respectively. The imino C19-N5 and amino C17-N3 are nearly equal within error (1.316 vs. 1.332 Å for FEB-MIN·ACE, 1.323 vs. 1.345 Å for FEB-MIN·THF) due to the conjugate interaction. The dihedral angles of thiazole and phenyl rings are 2.4° and 3.1° in FEB-MIN·ACE and FEB-MIN·THF, respectively, which suggests the coplanarity as shown in Figure 1b. The dihedral angles of the solvent and FEB molecule in FEB-MIN·ACE and FEB-MIN·THF are 65.8° and 57.0°, respectively.

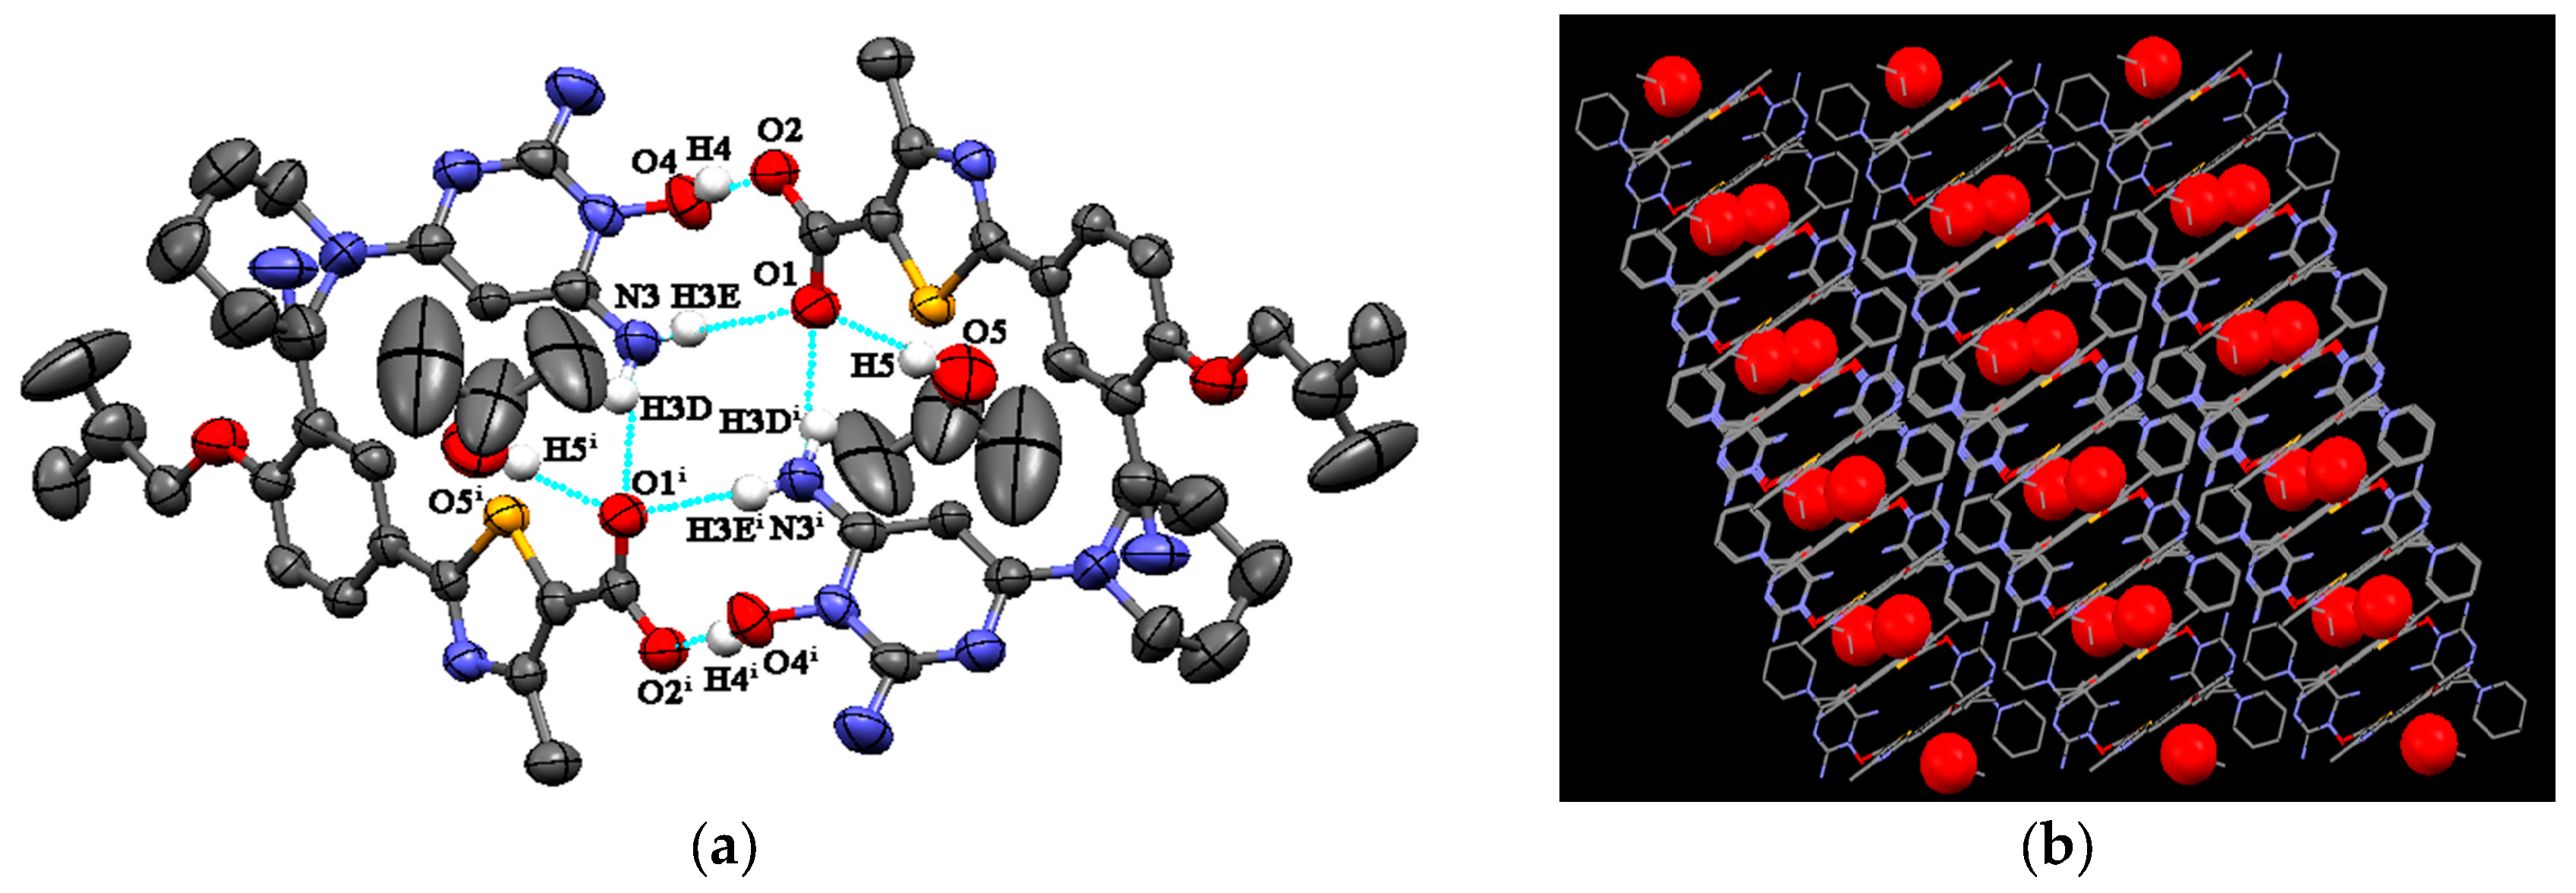
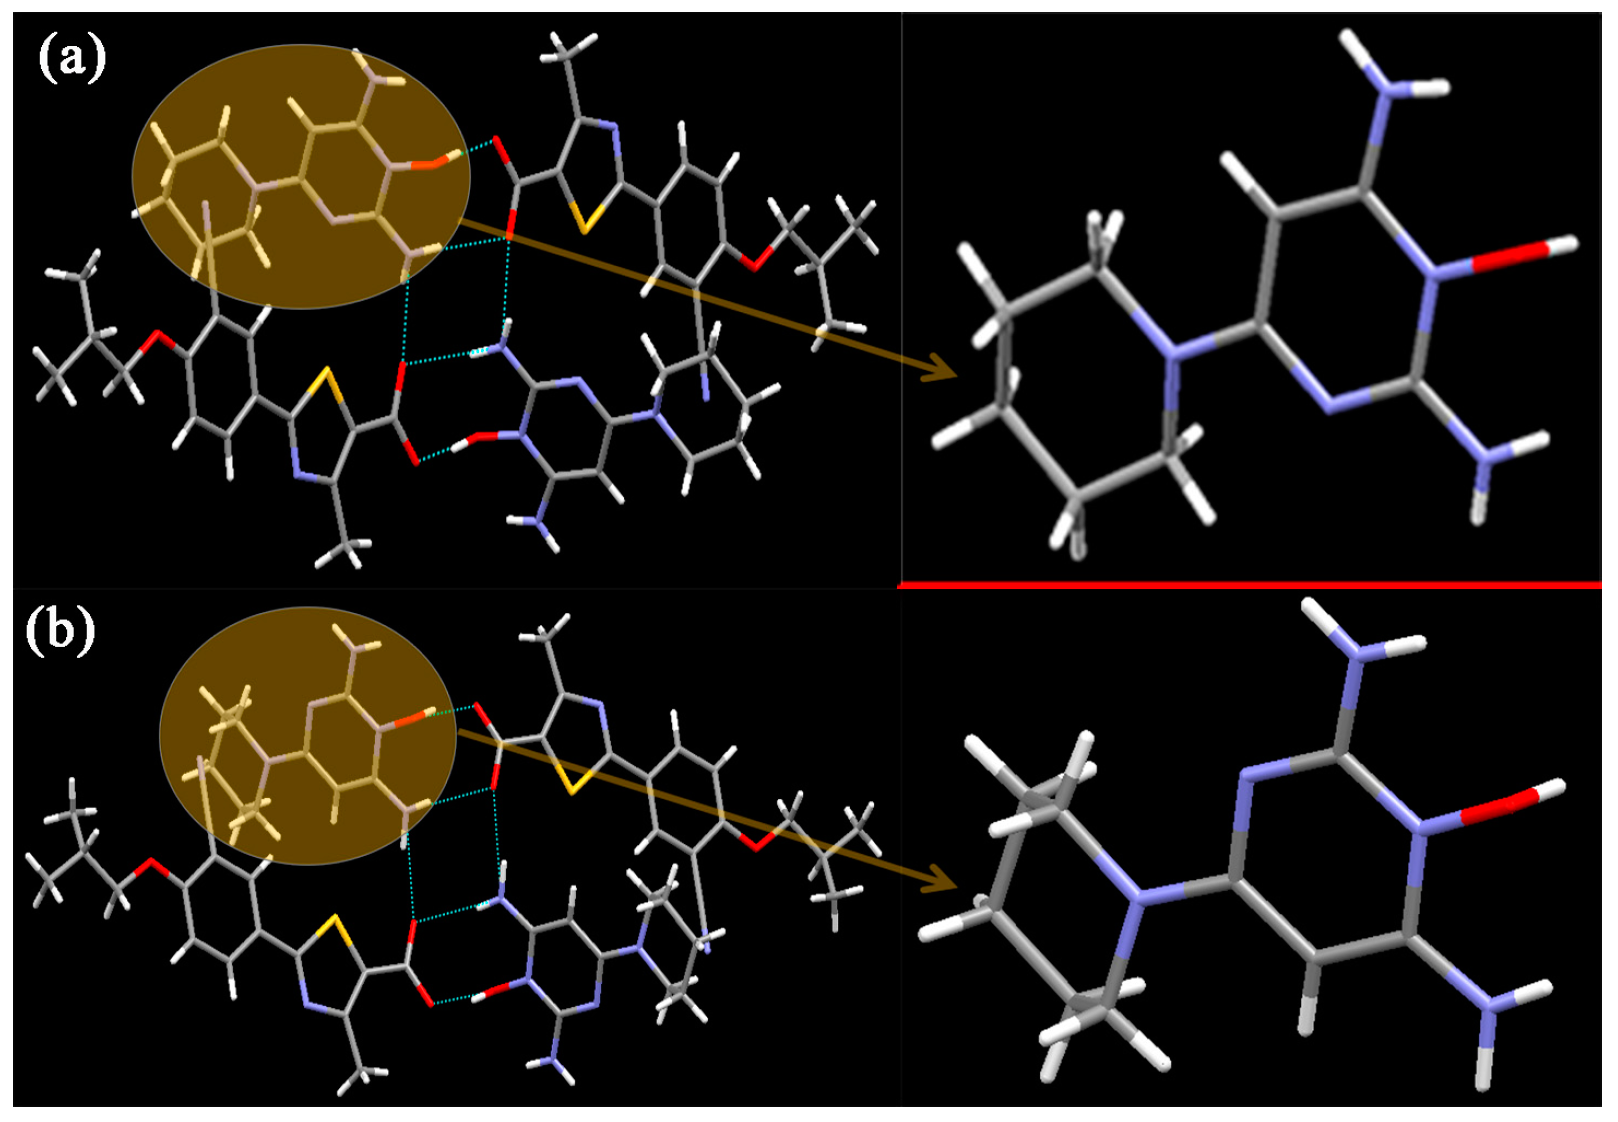
3.1.2. Crystal Structure of FEB-MIN·IPA

FEB-MIN·IPA crystallizes in the triclinic P-1 space group with a 1:1:1 stoichiometry as found in FEB-MIN·ACE and FEB-MIN·THF, and the asymmetric units are also analogues as shown in Figure 2a. In the structure, the proton transfers from the carboxylic group of FEB to imino N5 atom of MIN, and two FEB and two MIN molecules construct a tetrameric R 2 2 (9) R 4 2 (8) R 2 2 (9) motif through O4-H4···O2, N3-H3D···O1i and N3-H3E···O1 hydrogen bonds. Isopropanol (IPA) molecules are linked by strong hydrogen bonds to carboxylic O1 atom, different from ACE and THF solvates. Meanwhile, two centrosymmetric IPA molecules are inserted into the same channel of crystal lattice (Figure 2b). Also, compared with the FEB-MIN·ACE and FEB-MIN·THF, the diaminopyrimidine ring of the MIN molecules in FEB-MIN·IPA exit flipping architectures (Figure 3).

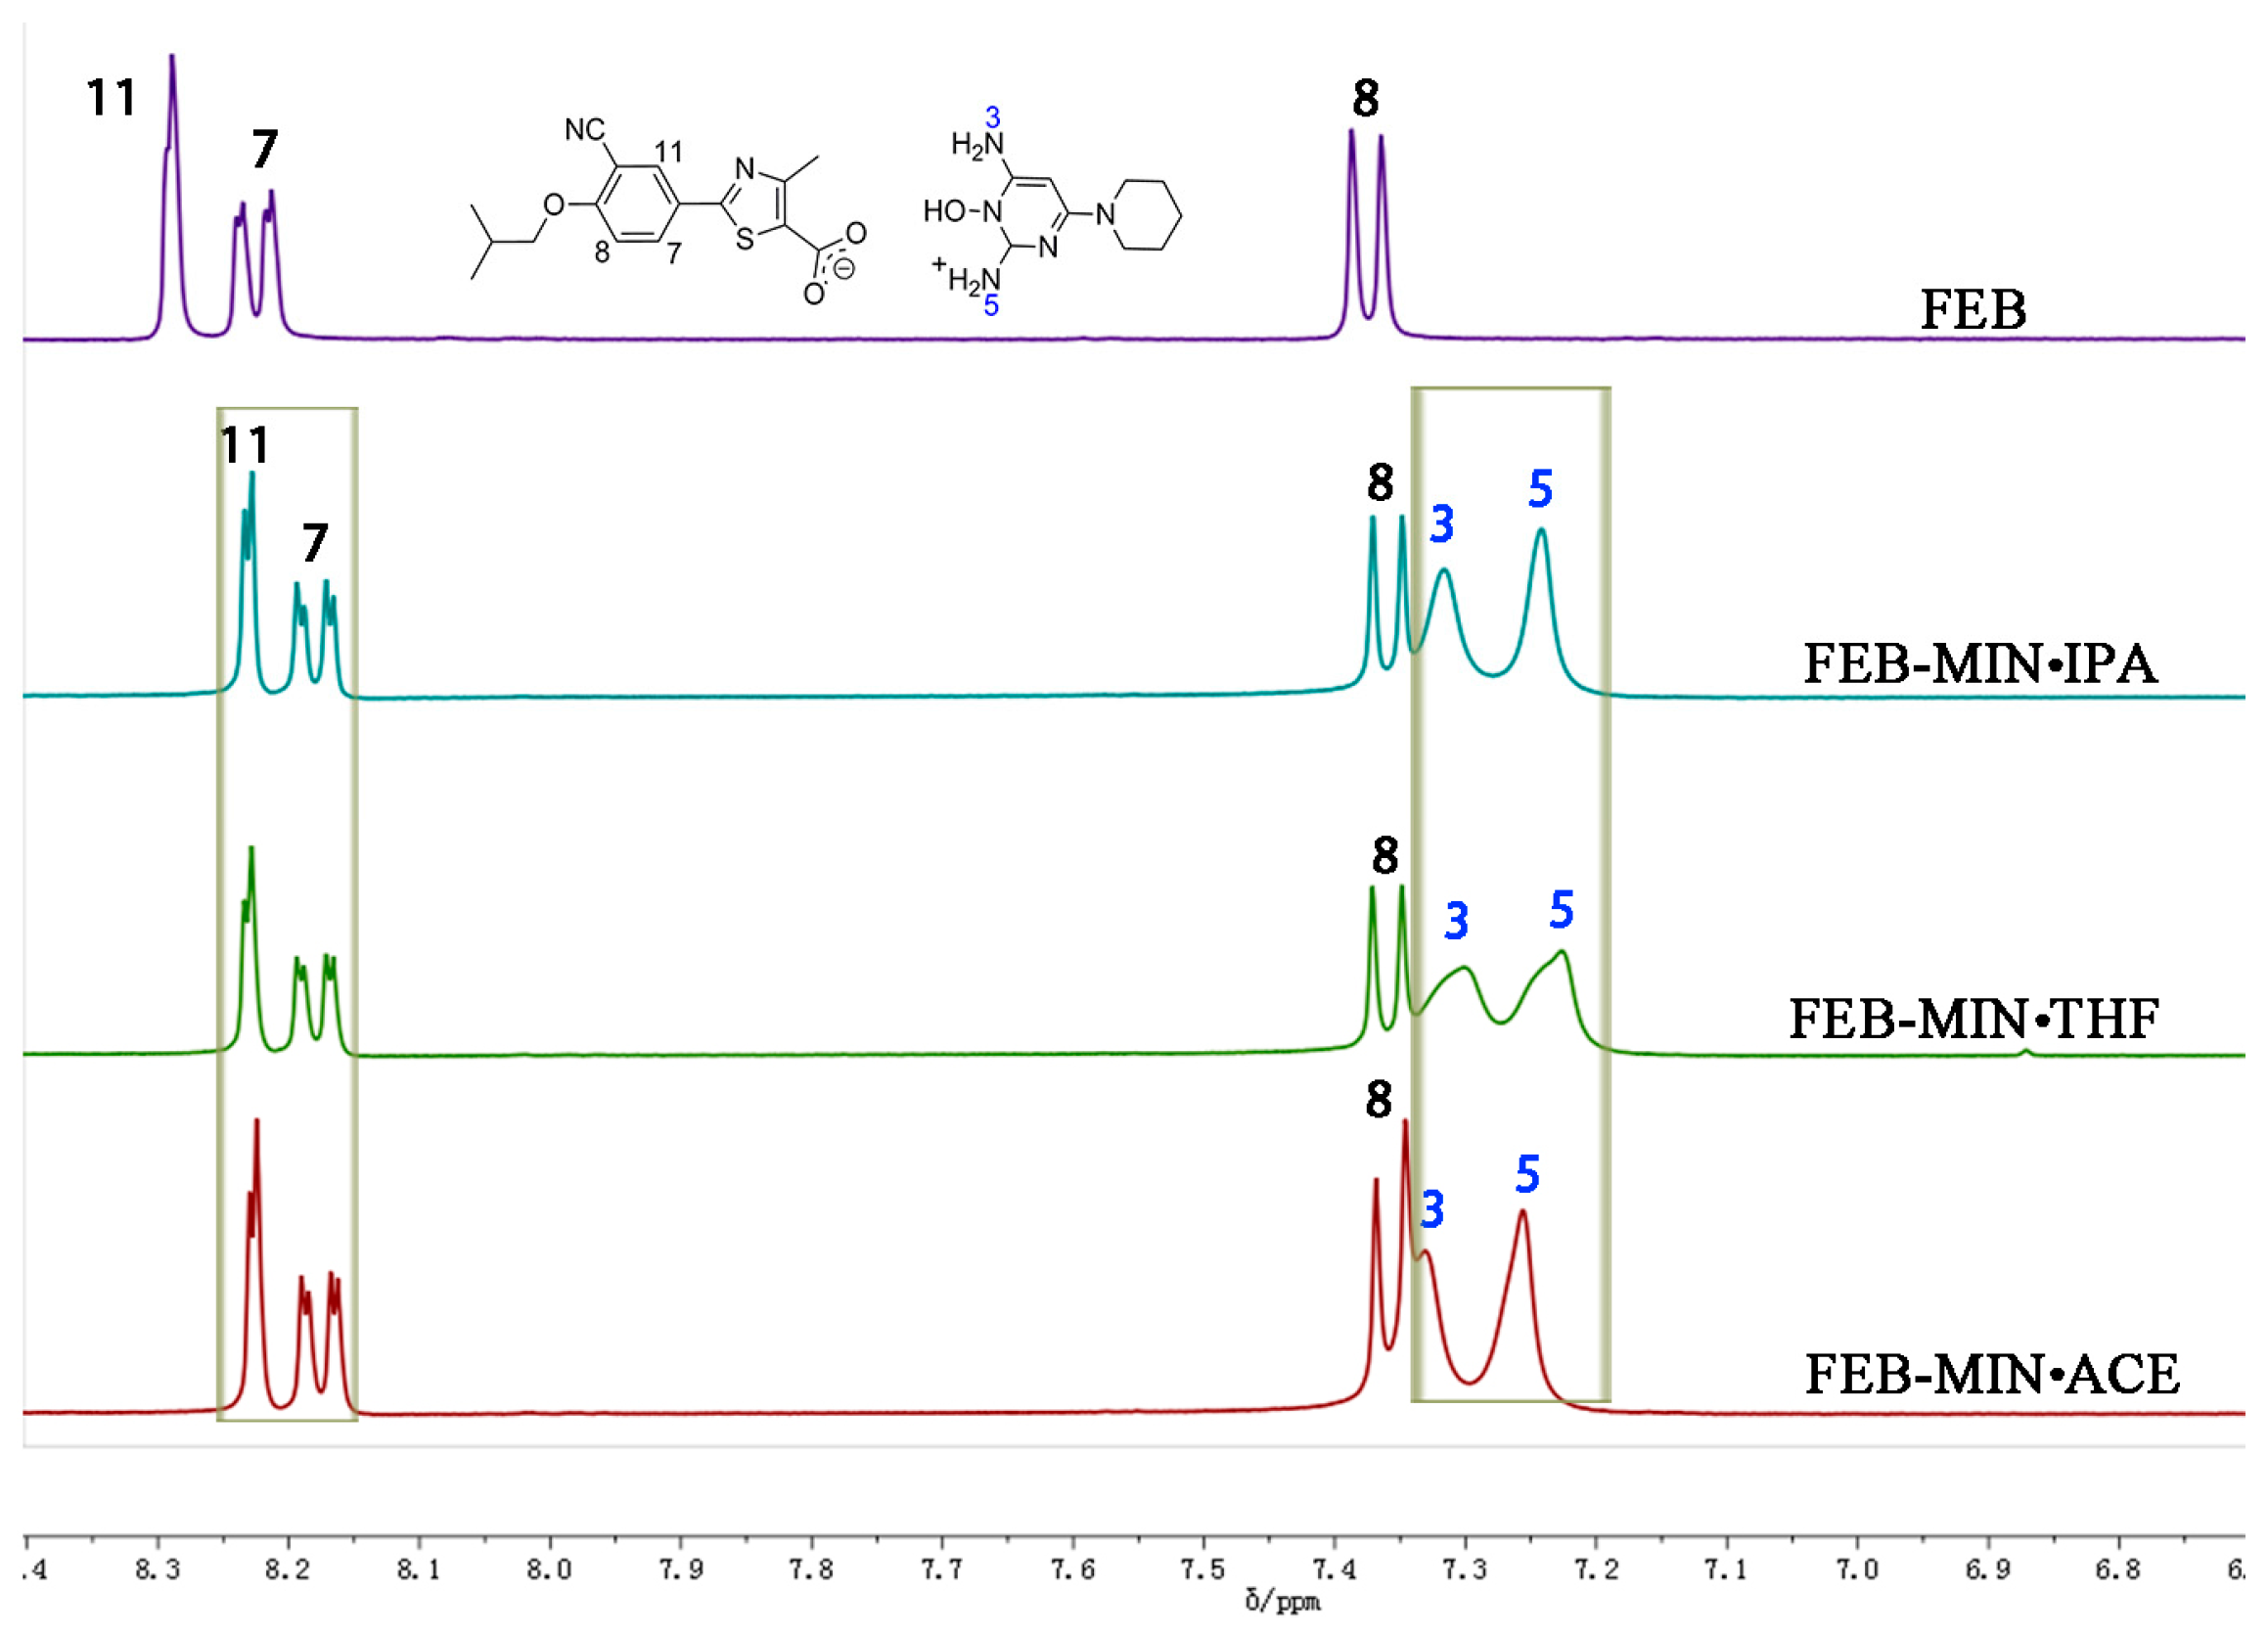
3.2. Nuclear Magnetic Resonance (1H-NMR) Spectral Analysis

The samples of FEB, FEB-MIN·ACE, FEB-MIN·THF and FEB-MIN·IPA were dissolved in DMSO-d6 solvent, respectively. A comparative analysis of 1H-NMR spectra was shown in Figure 4. There were two protons at N5 for three salt solvates, which were attributed to one proton of FEB transferring to the N5 atom of MIN. The three salt solvates showed different peak shifts of protons at N3 and N5 atoms, which were mainly attributed to the hydrogen bonding interaction. Due to the anisotropy shielding effect of chemical bonds, the characteristic peaks of protons at C11, C7, and C8 atoms of three salt solvates showed apparent chemical shifts compared with that of FEB.

3.3. IR Spectral Analysis

Comparative IR spectra for FEB, FEB-MIN·ACE, FEB-MIN·THF and FEB-MIN·IPA are shown in Figure 5. Characteristic peak at 1675 cm−1 of FEB is attributed to C=O stretching frequency, which shifts to 1658 cm−1 due to the deprotonation of carboxylic group. The stretching frequency of C=N of MIN molecule in three salt solvates occurs at 1632 cm−1, 1633 cm−1 and 1633 cm−1, respectively. Characteristic peaks at 1568 cm−1 of FEB-MIN·ACE and FEB-MIN·THF are attributed to C=C stretching frequency of MIN molecules [26]. Compared FEB-MIN·IPA with FEB-MIN·ACE and FEB-MIN·THF, the peak of C=C stretching frequency shifts from 1568 to 1541 cm−1. This phenomenon is mainly attributable to the different arrangement of MIN molecules. A characteristic peak at 1706 cm−1 of FEB-MIN·ACE salt is attributed to C=O which belongs to acetone molecules.

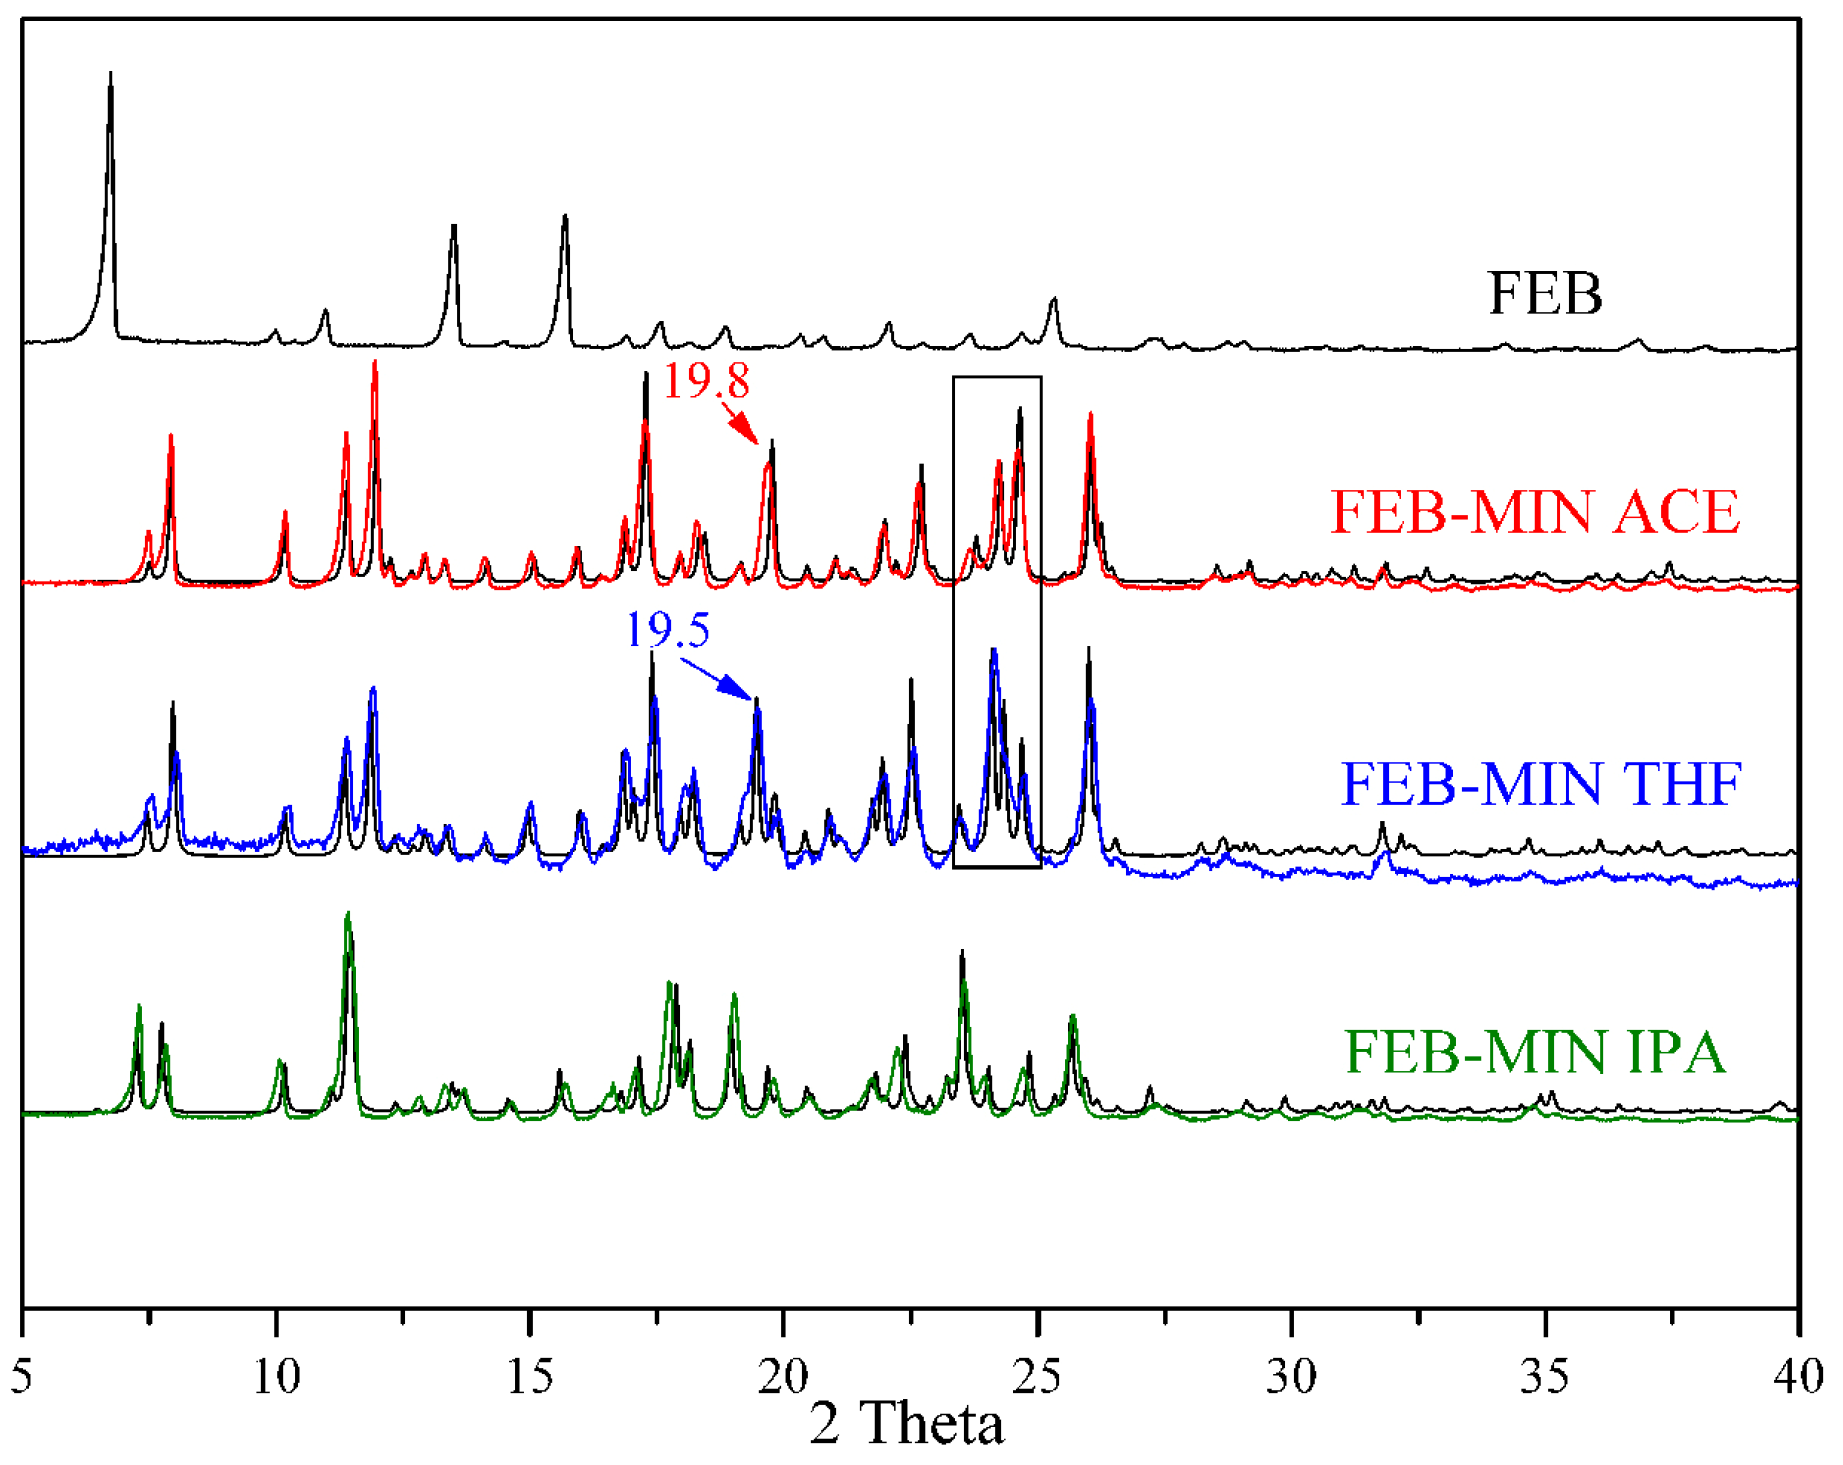
3.4. Powder X-ray Diffraction (PXRD) Analysis

The experimental PXRD patterns for FEB, FEB-MIN·ACE, FEB-MIN·THF and FEB-MIN·IPA are shown in Figure 6. The PXRD patterns match well with the calculated patterns from the X-ray single crystal data, which indicate the excellent phase purity of solid samples. The positions of characteristic diffraction peaks of FEB-MIN·ACE and FEB-MIN·THF are similar except 19.8°/19.5° and the range of 23–25°. The dominating PXRD peaks of the three salt solvates are depicted in Table 3. The detailed PXRD values for the three salt solvates are shown in Tables S1–S3.

3.5. Thermal Analysis

The differential scanning calorimetry (DSC) and thermogravimetry (TG) profiles of the three salt solvates and the corresponding FEB-MIN after desolvation are shown in Figure 7. For FEB-MIN·ACE, FEB-MIN·THF and FEB-MIN·IPA, the DSC traces exhibit similar DSC profiles with two successive endothermic peaks (131.3/144.8 °C for FEB-MIN·ACE (ΔHtotal = 52.8 J/g); 138.4/151.8 °C for FEB-MIN·THF (ΔHtotal = 65.9 J/g); 133.5/144.6 °C for FEB-MIN·IPA (ΔHtotal = 52.6 J/g). These suggest that two centrosymmetric solvent molecules in three salt solvates have two different desolvation potentials before the decomposition. Meanwhile, the DSC curves of three FEB-MIN salts show endothermic peaks at the identical temperatures within the experimental error (209.5 °C for FEB-MIN·ACE; 209.9 °C for FEB-MIN·THF and 210.1 °C for FEB-MIN·IPA), which suggests that the solvates may be form the concordant crystal phase after desolvation. The decomposition temperature before and after desolvation are very similar, which suggests that the three salt solvate form the identical crystalline phase under desolvation in vacuum or in N2 atmosphere.
The stoichiometry of solvates is also determined by measuring the mass loss when heating in certain temperature ranges using a thermal gravimetric analyzer. All three salt solvates show two successive desolvation process with mass loss (w/w) of 10.3% (10.0% theoretically) for FEB-MIN·ACE, 12.4% (12.1% theoretically) for FEB-MIN·THF and 10.1% (10.3% theoretically) for FEB-MIN·IPA.

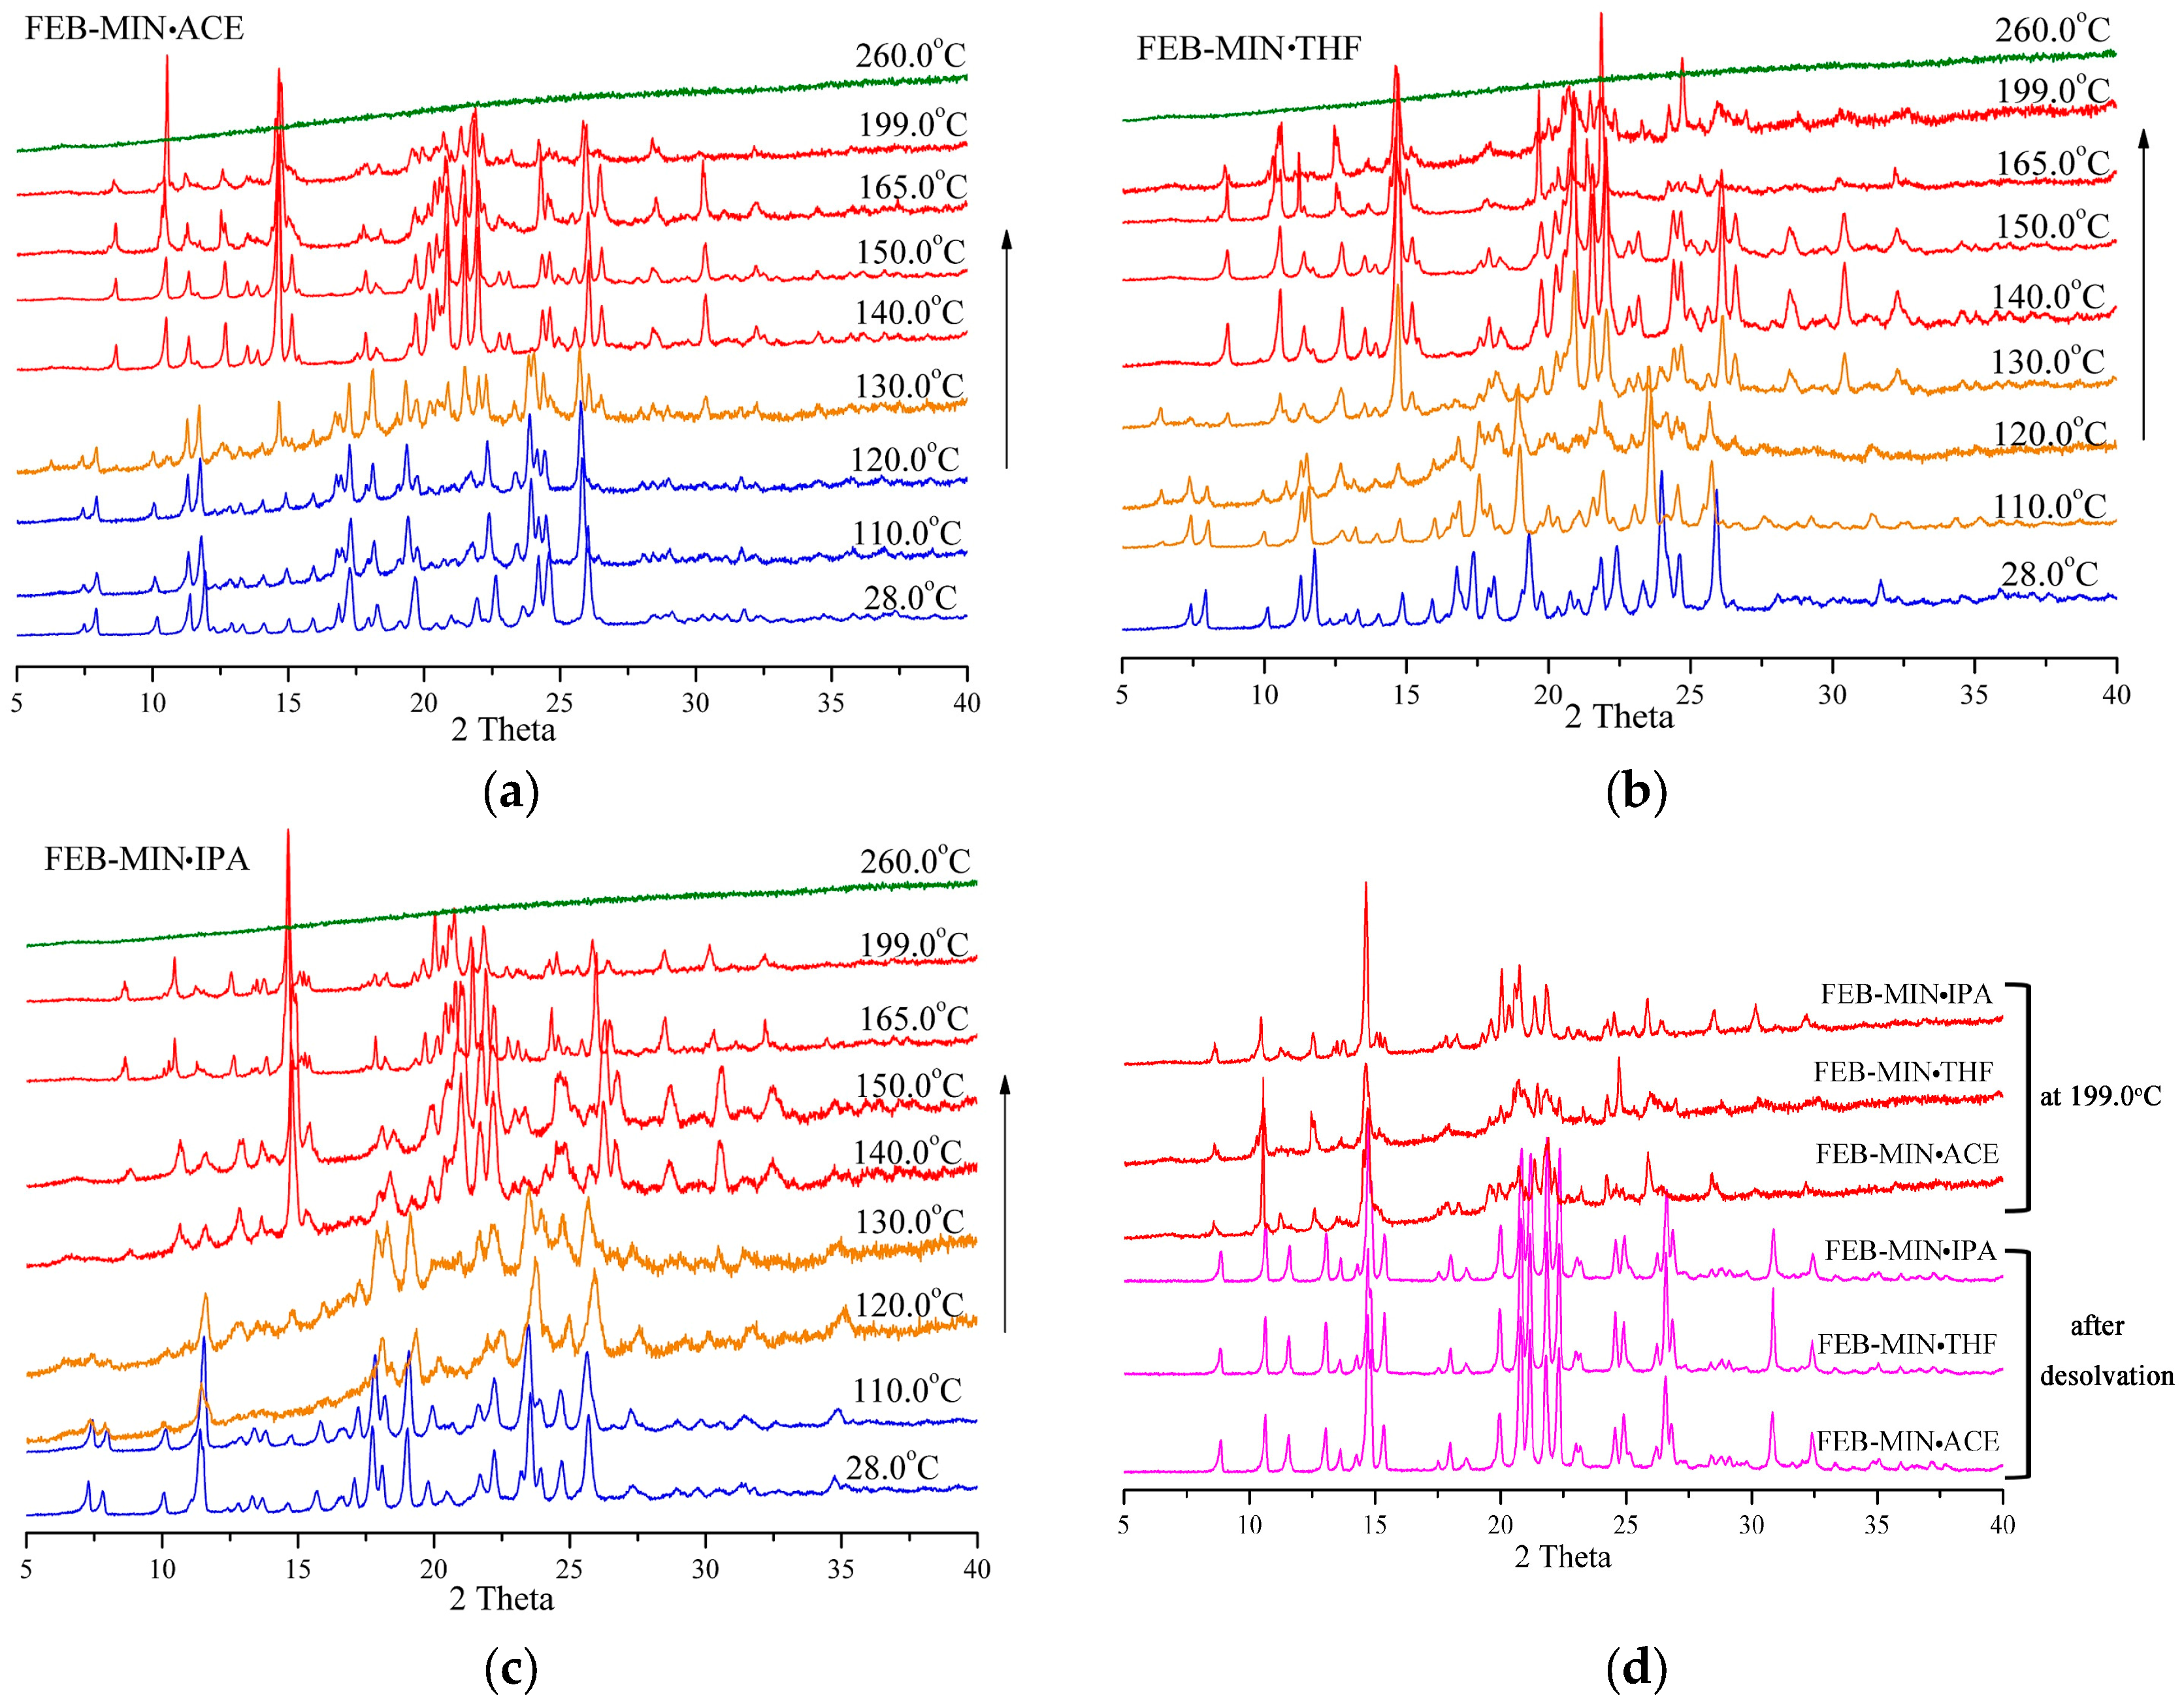
3.6. Variable Temperature Powder X-ray Diffraction (VT-PXRD) Analysis

As shown in Figure 8, the PXRD patterns of three salt solvates keep approximately constant from room temperature to 110.0 °C. At 260 °C the three salt solvates decompose completely. For FEB-MIN·ACE, the crystalline phase is stable until 120 °C, although the subtle changes are observed in the larger 2θ moiety due to the change in volume of unit cell upon heating. A transition state is formed at 130 °C with apparent formation of weak peaks at 6.27°, 14.64°, 22.01° and 30.37°, which quickly transforms into a new crystalline phase at 140 °C. For FEB-MIN·THF, an apparent transition state is found at 110 °C with the generations of new peaks at 6.42°, 12.74°, 17.93° and 24.55°, which gradually transforms into the new phase in the temperature range of 110–140 °C. FEB-MIN·IPA is also stable below 110 °C. However, the characteristic peaks at 7.34°, 7.82° and 18.17° fade away to form a new crystalline phase at 140 °C. Importantly, the PXRD patterns for the three salt solvates are completely consistent with each other after desolvation, which suggest that the salt solvates can form the uniform crystalline phase through desolvation. The slight differences in 2θ diffraction angle in the temperature range of 165–199 °C may be caused by phase impurity or decomposition. Hence, the stability of solvent molecules in the salt solvates are not only involved in hydrogen bonds but also in steric hinerance thermodynamically.

3.7. Solvent-Exchange Experiments

The solvent-exchange experiments were conducted by the 1H-NMR method. According to the NMR results, the three salt solvates could transform into each other upon soaking the solids in the corresponding sole solvents at 24 h (Table S4, Figures S1–S6). Interestingly, the transformation yield is near 100% when soaking FEB-MIN·IPA in sole THF solution. FEB-MIN·ACE and FEB-MIN·THF can transform into FEB-MIN·IPA with about 95% yield. In order to further explore the interconversion, the mixed solution of ACE/THF/IPA with 1/1/1 stoichiometry was applied for solvent-exchange experiments for 24 h and 48 h, and the NMR results are shown in Table 4 (Figures S7–S12). From these results, we can find that there are three salt solvates compatibly in the residual solid. Also, FEB-MIN·ACE was the maximum proportion (about 75%) in the three salt solvates in mixed solution regardless of 24 h or 48 h when FEB-MIN·ACE was soaked. FEB-MIN·THF maintains about 50% in the solid and transforms into FEB-MIN·ACE with about 48% yield at 48 h. Only FEB-MIN·IPA maintains the least content (about 11%) in the residual sample and transforms into FEB-MIN·ACE (about 50%) and FEB-MIN·THF (about 38%), respectively. Compared with the results at 24 h with those at 48 h for the three salt solvates, the proportion of FEB-MIN·IPA becomes lower, which suggests that FEB-MIN·IPA is the most unstable dynamically.

3.8. Solubility Study

The solubility experiments of FEB and its salt solvates were performed in aqueous medium at 37 ± 0.5 °C. The equilibrium solubility of FEB, FEB-MIN·ACE, FEB-MIN·IPA and FEB-MIN·THF in aqueous are 12.23, 29.37, 33.88 and 26.48 mg/L, respectively. Obviously, the solubilities of the three salt solvates were improved compared to FEB.

4. Conclusions

Three novel salt solvates of FEB with MIN in different solvents were successfully obtained by solvent-assisted grinding and featured the same stoichiometry. The three salt solvates possessed the unique and combined R 2 2 (9) R 4 2 (8) R 2 2 (9) graph set through two FEB and two MIN molecules. The solvents were adhered to the [2 + 2] tetrameric units through different weak and strong hydrogen bonding interactions. Three salt solvates could transform into the same crystalline phase of solvent-free FEB-MIN form by the removal of solvent molecules in vacuum at 110 °C from thermal and VT-PXRD analyses. The three salt solvates can transform into each other under the corresponding solvent, while the transformation rate was different due to the different stabilities. The stability of solvents in the salt solvates was involved in both steric hinerance and hydrogen bonds. The FEB solubility for the three salt solvates showed about 100–200% increase over FEB. This research work revealed that salt solvate was an important strategy to produce the solvent-free form and to improve the solubility.

Supplementary Materials

The following are available online at https://www.mdpi.com/2073-4352/8/2/85/s1, Table S1: The detailed PXRD values of FEB-MIN·ACE, Table S2: The detailed PXRD values of FEB-MIN·THF, Table S3: The detailed PXRD values of FEB-MIN·IPA, Figure S1: 1H-NMR spectra of FEB-MIN·ACE in IPA solution after 24 h, Figure S2: 1H-NMR spectra of FEB-MIN·ACE in THF solution after 24 h, Figure S3: 1H-NMR spectra of FEB-MIN·IPA in ACE solution after 24 h, Figure S4: 1H-NMR spectra of FEB-MIN·IPA in THF solution after 24 h, Figure S5: 1H-NMR spectra of FEB-MIN·THF in ACE solution after 24 h, Figure S6: 1H-NMR spectra of FEB-MIN·THF in IPA solution after 24 h, Figure S7: 1H-NMR spectra of FEB-MIN·ACE in mixed solution after 24 h, Figure S8: 1H-NMR spectra of FEB-MIN·THF in mixed solution after 24 h, Figure S9: 1H-NMR spectra of FEB-MIN·IPA in mixed solution after 24 h, Figure S10: 1H-NMR spectra of FEB-MIN·ACE in mixed solution after 48 h, Figure S11: 1H-NMR spectra of FEB-MIN·IPA in mixed solution after 48 h, Figure S12: 1H-NMR spectra of FEB-MIN·THF in mixed solution after 48 h, Figure S13: 1H-NMR spectra of FEB-MIN·ACE, Figure S14: 1H-NMR spectra of FEB-MIN·THF, Figure S15: 1H-NMR spectra of FEB-MIN·IPA.

Acknowledgments

The work was supported by Guangdong Science and Technology Department (Grant No. 2015B090901029 and 2014A020210002) and Guangzhou Science Technology and Innovation Commission (Grant No. 201704020036). We are also thankful to MOE Joint International Research Laboratory of Synthetic Biology and Medicine in South China University of Technology for providing the experimental facility.

Author Contributions

L.Z. and C.-Z.D. conceived and designed the experiments; L.-Y.L. and R.-K.D. performed the experiments and analyzed the data; Y.-L.D. and C.-J.Z. analyzed the TG-DSC and PXRD data; S.G. contributed materials/analysis tools; L.-Y.L. and L.Z. wrote and revised the paper.

Conflicts of Interest

The authors declare no conflict of interest.

References

  1. Shan, N.; Perry, M.L.; Weyna, D.R.; Zaworotko, M.J. Impact of pharmaceutical cocrystals: The effects on drug pharmacokinetics. Expert Opin. Drug Metab. Toxicol. 2014, 10, 1255–1271. [Google Scholar] [CrossRef] [PubMed]
  2. Domingos, S.; Andre, V.; Quaresma, S.; Martins, I.C.B.; Piedade, M.D.; Duarte, M.T. New forms of old drugs: Improving without changing. J. Pharm. Pharmacol. 2015, 67, 830–846. [Google Scholar] [CrossRef] [PubMed]
  3. Sharma, O.P.; Patel, V.; Mehta, T. Design of experiment approach in development of febuxostat nanocrystal: Application of soluplus as stabilizer. Powder Technol. 2016, 302, 396–405. [Google Scholar] [CrossRef]
  4. Pandya, R.B.; Mehta, T.A.; Gohel, M.C. Solid dispersion adsorbate-a novel technique for dissolution enhancement of febuxostat. Int. J. Pharm. Sci. Res. 2015, 6, 4236–4242. [Google Scholar]
  5. Ahuja, B.K.; Jena, S.K.; Paidi, S.K.; Bagri, S.; Suresh, S. Formulation, optimization and in vitro-in vivo evaluation of febuxostat nanosuspension. Int. J. Pharm. 2015, 478, 540–552. [Google Scholar] [CrossRef] [PubMed]
  6. Prohens, R.; Barbas, R.; Portell, A.; Font-Bardia, M.; Alcobe, X.; Puigjaner, C. Polymorphism of cocrystals: The promiscuous behavior of agomelatine. Cryst. Growth Des. 2016, 16, 1063–1070. [Google Scholar] [CrossRef]
  7. Sanphui, P.; Bolla, G.; Nangia, A. High solubility piperazine salts of the nonsteroidal anti-inflammatory drug (NSAID) meclofenamic acid. Cryst. Growth Des. 2012, 12, 2023–2036. [Google Scholar] [CrossRef]
  8. Aitipamula, S.; Chow, P.S.; Tan, R.B.H. Polymorphism in cocrystals. A review and assessment of its significance. CrystEngComm 2014, 16, 3451–3465. [Google Scholar] [CrossRef]
  9. Zhang, X.R.; Zhang, L. Solvent effect on the self-assembly of salt solvates of an antihypertensive drug azilsartan and 2-methylimidazole. J. Mol. Struct. 2017, 1137, 320–327. [Google Scholar] [CrossRef]
  10. Du, M.; Jiang, X.J.; Tan, X.; Zhang, Z.H.; Cai, H. Co-crystallization of a versatile building block 4-amino-3,5-bis (4-pyridyl)-1,2,4-triazole with R-isophthalic acids (R = –H, –NH2, –SO3H, and –COOH): Polymorphism and substituent effect on structural diversity. CrystEngComm 2009, 11, 454–462. [Google Scholar] [CrossRef]
  11. Okamoto, K.; Eger, B.T.; Nishino, T.; Kondo, S.; Pai, E.F.; Nishino, T. An extremely potent inhibitor of xanthine oxidoreductase. J. Biol. Chem. 2003, 278, 1848–1855. [Google Scholar] [CrossRef] [PubMed]
  12. Becker, M.A.; Schumacher, H.R., Jr.; Wortmann, R.L.; MacDonald, P.A.; Eustace, D.; Palo, W.A.; Streit, J.; Joseph-Ridge, N. Febuxostat compared with allopurinol in patients with hyperuricemia and gout. N. Engl. J. Med. 2005, 353, 2450–2461. [Google Scholar] [CrossRef] [PubMed]
  13. Ernst, M.E.; Fravel, M.A. Febuxostat: A selective xanthine-oxidase/xanthine-dehydrogenase inhibitor for the management of hyperuricemia in adults with gout. Clin. Ther. 2009, 31, 2503–2518. [Google Scholar] [CrossRef] [PubMed]
  14. Dass, R.; Jaiswal, S.; Gupta, G.D. Formulation and evaluation of febuxostat fast disintegrating tablet. Indo Am. J. Pharm. Res. 2014, 4, 2928–2936. [Google Scholar]
  15. Yadav, J.A.; Khomane, K.S.; Modi, S.R.; Ugale, B.; Yadav, R.N.; Nagaraja, C.M.; Kumar, N.; Bansal, A.K. Correlating single crystal structure, nanomechanical, and bulk compaction behavior of febuxostat polymorphs. Mol. Pharm. 2017, 14, 866–874. [Google Scholar] [CrossRef] [PubMed]
  16. Jiang, Q.Y.; Qian, J.J.; Gu, J.M.; Tang, G.P.; Hu, X.R. Febuxostat methanol solvate. Acta Crystallogr. Sect. E Struct. Rep. Online 2011, 67, o1232. [Google Scholar] [CrossRef] [PubMed]
  17. Zhu, X.; Wang, Y.; Lu, T. 2-[3-cyano-4-(2-methylpropoxy) phenyl]-4-methylthiazole-5-carboxylic acid pyridine solvate. Acta Crystallogr. Sect. E Struct. Rep. Online 2009, 65, o2603. [Google Scholar] [CrossRef] [PubMed]
  18. Wu, M.; Hu, X.R.; Gu, J.-M.; Tang, G.P. Crystal structure of febuxostat-acetic acid (1/1). Acta Crystallogr. Sect. E Struct. Rep. Online 2015, 71, o295–o296. [Google Scholar] [CrossRef] [PubMed]
  19. Kang, Y.; Gu, J.; Hu, X. Syntheses, structure characterization and dissolution of two novel cocrystals of febuxostat. J. Mol. Struct. 2017, 1130, 480–486. [Google Scholar] [CrossRef]
  20. Maddileti, D.; Jayabun, S.K.; Nangia, A. Soluble cocrystals of the xanthine oxidase inhibitor febuxostat. Cryst. Growth Des. 2013, 13, 3188–3196. [Google Scholar] [CrossRef]
  21. Zhang, X.R.; Zhang, L. Simultaneous enhancements of solubility and dissolution rate of poorly water-soluble febuxostat via salts. J. Mol. Struct. 2017, 1137, 328–334. [Google Scholar] [CrossRef]
  22. Han, X.M.; Qi, W.P.; Dong, W.X.; Guo, M.R.; Ma, P.Q.; Wang, J. Preparation, optimization and in vitro-in vivo investigation for capsules of the choline salt of febuxostat. Asian J. Pharm. Sci. 2016, 11, 715–721. [Google Scholar] [CrossRef]
  23. Zeng, Q.Z.; Ouyang, J.; Zhang, S.; Zhang, L. Structural characterization and dissolution profile of mycophenolic acid cocrystals. Eur. J. Pharm. Sci. 2017, 102, 140–146. [Google Scholar] [CrossRef] [PubMed]
  24. Sheldrick, G.M. A short history of SHELX. Acta Crystallogr. Sect. A Found. Crystallogr. 2008, 64, 112–122. [Google Scholar] [CrossRef] [PubMed]
  25. Dolomanov, O.V.; Bourhis, L.J.; Gildea, R.J.; Howard, J.A.K.; Puschmann, H. OLEX2: A complete structure solution, refinement and analysis program. J. Appl. Crystallogr. 2009, 42, 339–341. [Google Scholar] [CrossRef]
  26. Rani, D.; Singh, C.; Kumar, A.; Sharma, V.K. Formulation Development and In-vitro Evaluation of Minoxidil Bearing Glycerosomes. Am. J. Biomed. Res. 2016, 4, 27–37. [Google Scholar]
Scheme 1. Chemical structures of FEB, MIN and the solvents.
Crystals 08 00085 sch001
Figure 1. (a) Hydrogen bond interactions observed in FEB-MIN·ACE, (b) the structural overlay for FEB-MIN·ACE and FEB-MIN·THF (green, FEB; blue, MIN molecule in FEB-MIN·ACE; yellow, MIN molecule in FEB-MIN·THF; red, ACE; cyan, THF).
Crystals 08 00085 g001
Figure 2. (a) Hydrogen bond interactions observed in FEB-MIN·IPA; (b) the channels occupied by isopropanol (IPA) molecules.
Crystals 08 00085 g002
Figure 3. Illustration for the crystal structure of (a) FEB-MIN·ACE, (b) FEB-MIN·IPA.
Crystals 08 00085 g003
Figure 4. Partial nuclear magnetic resonance (1H-NMR) spectrum of FEB and three salt solvates.
Crystals 08 00085 g004
Figure 5. Infrared (IR) spectra of FEB, FEB-MIN·ACE, FEB-MIN·THF and FEB-MIN·IPA salt solvates.
Crystals 08 00085 g005
Figure 6. Comparisons of experimental (black) and simulated (red, blue and green) powder X-ray diffraction (PXRD) patterns for FEB, FEB-MIN·ACE, FEB-MIN·THF and FEB-MIN·IPA salt solvates.
Crystals 08 00085 g006
Figure 7. Differential scanning calorimetry (DSC) and thermogravimetry (TG) curves before/after desolvation for (a) FEB-MIN·ACE, (b) FEB-MIN·THF, and (c) FEB-MIN·IPA.
Crystals 08 00085 g007
Figure 8. Variable temperature powder x-ray diffraction (VT-PXRD) measurements showing phase transformations, (a) FEB-MIN·ACE, (b) FEB-MIN·THF, and (c) FEB-MIN·IPA, (d) PXRD patterns at 199 °C and after desolvation.
Crystals 08 00085 g008
Table 1. Crystallographic data for the three novel salt solvates.
FormulaFEB-MIN·ACEFEB-MIN·THFFEB-MIN·IPA
(C16H15N2O3S) (C9H16N5O) (C3H6O)(C16H15N2O3S) (C9H16N5O) (C4H8O)(C16H15N2O3S) (C9H16N5O) (C3H8O)
Formula Weight583.71597.73585.80
Crystal Systemtriclinictriclinictriclinic
Space groupP-1P-1P-1
Wavelength (Å)0.710730.710730.71073
a(Å)8.7459(8)8.8090(8)8.8360(8)
b(Å)12.5214(10)12.6426(15)13.1049(13)
c(Å)14.9201(13)14.9052(13)14.6481(11)
α(°)109.959(8)109.349(10)110.509(8)
β(°)95.476(7)96.149(7)96.687(7)
γ(°)94.023(7)94.585(9)96.470(8)
V(Å3)1519.5(2)1545.4(3)1556.2(2)
Z222
F(000)620636624
D/g·cm−31.2761.2851.250
T(K)293(2)293(2)293(2)
Reflections collected286925001932
Independent reflections535954025328
Reflections observed (I > 2σ(I))372335223090
θ range (°)2.93 to 25.032.84 to 25.022.86 to 25.02
Data/restraints/parameters5359/10/3955402/16/4095328/3/383
Goodness-of-fit on F21.0541.0491.010
Final R indices [I > 2σ(I)]R1 = 0.0847R1 = 0.0942R1 = 0.0699
ωR2 = 0.2297ωR2 = 0.2654ωR2 = 0.1624
R indices (all data)R1 = 0.1131,R1 = 0.1282,R1 = 0.1235,
ωR2 = 0.2599ωR2 = 0.3116ωR2 = 0.2039
Largest diff. peak and hole (eÅ−3)0.935, −0.6130.644, −0.7590.389, −0.242
Table 2. Hydrogen bond distances and angles for the three salt solvates.
Salt SolvatesD-H···ASymmetryD–H (Å)H···A (Å)D···A (Å)∠D–H···A (◦)
FEB-MIN·ACEO4-H4···O2−x + 2, −y + 2, −z0.971.502.465174
N5-H5B···O1−x + 2, −y + 2, −z0.802.052.864162
N5-H5A···O1ix, y, z0.782.283.034164
FEB-MIN·THFO4-H4···O2x + 1, y, z0.821.672.472167
N5-H5B···O1x + 1, y, z0.862.102.854146
N5-H5A ···O1ii−x + 1, −y + 1, −z + 10.862.173.003164
FEB-MIN·IPAO4-H4···O2−x + 1, −y + 1, −z + 10.821.672.484172
N3-H3D···O1ix, y, z0.862.162.994165
N3-H3E···O1−x + 1,−y + 1, −z + 10.862.112.878148
Table 3. The dominating PXRD peaks (2θ) for the three salt solvates.
Number2θ (FEB-MIN·ACE)2θ (FEB-MIN·THF)2θ (FEB-MIN·IPA)
ExperimentalSimulatedExperimentalSimulatedExperimentalSimulated
17.557.567.427.467.347.30
27.967.987.927.967.827.80
310.1910.2210.1510.1610.1610.22
411.4211.4811.3011.3411.4711.52
511.9912.0411.8111.8613.4913.52
612.9512.9912.9012.9414.6514.62
713.3413.4013.3113.3415.6315.64
814.1714.2614.0614.1016.7316.84
915.0915.1814.8914.9617.1717.20
1015.9616.0215.8915.9817.8517.92
1117.3017.4216.7616.8418.1718.20
1217.9918.1117.3317.4019.0319.00
1318.3418.5818.1218.1819.7719.74
1419.7519.9019.0919.1420.5320.50
1521.0621.1619.4819.4621.7721.86
1622.0022.1219.7419.8422.3522.44
1722.7122.8422.4722.5023.5523.56
1824.2624.4024.0524.1024.0024.08
1924.6324.7824.6324.6824.8224.88
2026.0526.1825.9726.0025.6825.70
Table 4. The mole percentage of the three salt solvates in mixed solvent.
Salt Solvates24 h48 h
FEB-MIN·ACE (%)FEB-MIN·THF (%)FEB-MIN·IPA (%)FEB-MIN·ACE (%)FEB-MIN·THF (%)FEB-MIN·IPA (%)
Entry 1FEB-MIN·ACE74.718.27.175.821.23.0
Entry 2FEB-MIN·THF40.450.09.347.850.02.2
Entry 3FEB-MIN·IPA45.634.020.450.538.411.1

