The Electrical Properties of Tb-Doped CaF2 Nanoparticles under High Pressure
by
 ,
,
Tingjing Hu
1 ,
,
Xiaoyan Cui
1,*,
Jingshu Wang
1,
Xin Zhong
1,
Yinzhu Chen
1,
Junkai Zhang
1,
Xuefei Li
1,
Jinghai Yang
1 and
Chunxiao Gao
2 1
Key Laboratory of Functional Materials Physics and Chemistry of the Ministry of Education, National Demonstration Center for Experimental Physics Education, Jilin Normal University, Siping 136000, China
2
State Key Laboratory of Superhard Materials, Jilin University, Changchun 130012, China
*
Author to whom correspondence should be addressed.
Crystals 2018, 8(2), 98; https://doi.org/10.3390/cryst8020098
Submission received: 9 January 2018
/
Revised: 11 February 2018
/
Accepted: 12 February 2018
/
Published: 15 February 2018
(This article belongs to the Special Issue High-Pressure Studies of Crystalline Materials)
Abstract
:The high-pressure transport behavior of CaF2 nanoparticles with 3 mol% Tb concentrations was studied by alternate-current impedance measurement. All of the electrical parameters vary abnormally at approximately 10.76 GPa, corresponding to the fluorite-cotunnite structural transition. The substitution of Ca2+ by Tb3+ leads to deformation in the lattice, and finally lowers the transition pressure. The F− ions diffusion, electronic transport, and charge-discharge process become more difficult with the rising pressure. In the electronic transport process, defects at grains play a dominant role. The charge carriers include both F− ions and electrons, and electrons are dominant in the transport process. The Tb doping improves the pressure effect on the transport behavior of CaF2 nanocrystals.
1. Introduction
Recently, rare earth (RE)-doped nanomaterials have attracted much attention [1,2,3,4,5], due to their potential applications such as advanced phosphor [6], display monitors [7], light amplification [8], and biological labeling [9,10], etc. Among these host materials, calcium fluoride (CaF2) is an attractive host for RE doping because of its high transparency in a wide wavelength region and low phonon energy [11,12,13,14,15].
As an important optical and optoelectronic functional material, a thorough study of the electrical transport properties is essential, and the underlying physical transport behaviors, such as charge carrier type and scattering processes, are worthy of exploration. The impedance spectrum measurement method has long been conventional in studies of electrical charge transportation and related physical properties [16,17,18,19,20]. Specially, using the impedance method, the presence of independent pathways for charge transportation in an inorganic material [21], and the mixed electronic and ionic conduction in various organic and inorganic materials have been satisfactorily addressed [22,23,24,25,26]. We have investigated the electrical properties of CaF2 nanoparticles with Tb concentrations from 1 mol% to 5 mol% at atmospheric pressure, and it was found that the resistance of the sample with a concentration of 3 mol% Tb is the smallest. Therefore, in this work, the electrical properties of CaF2 nanoparticles with 3 mol% Tb concentrations under high pressure were investigated by alternate-current (AC) impedance measurement up to 26 GPa. The underlying physical transport behaviors were discussed. Additionally, the pressure effect on the structural and electrical properties of Tb-doped CaF2 nanocrystals was compared with that of un-doped nanocrystals.
2. Materials and Methods
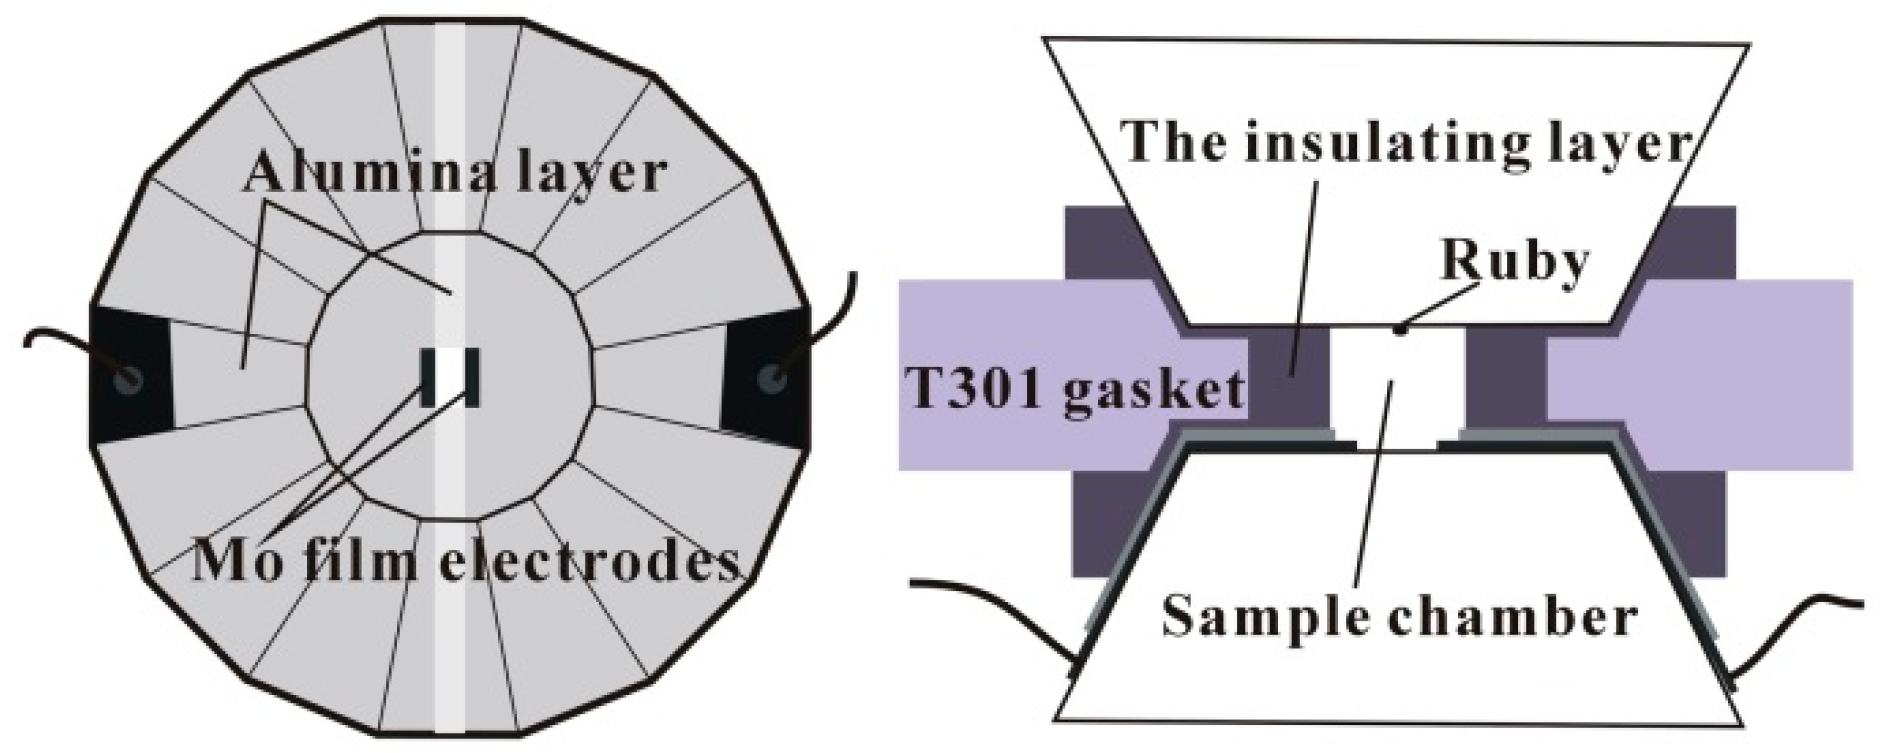
A diamond anvil cell (DAC) was used to generate high pressure. The detailed configuration of the electrodes and sample has been illustrated in previous works [27,28,29]. The final microcircuit and the profile of our designed DAC are shown in Figure 1. Pressure was calibrated by using ruby fluorescence. The ruby measurement scale is 100 GPa [30] and the accuracy of our measurement is 0.1 GPa. To avoid additional error on the electrical transport measurements, no pressure-transmitting medium was used. This will cause non-hydrostatic conditions [31]; however, the effects on the transport measurements can be neglected in our experiment pressure range [32].
Impedance spectroscopy was measured by a Solartron 1260 impedance analyzer (Solartron, Hampshire, UK) equipped with a Solartron 1296 dielectric interface. A voltage signal with an amplitude of 1 V was applied to the sample and its frequency ranged from 0.1 to 107 Hz.
The sample was prepared by the hydrothermal synthesis method as reported in our previous work [33]. The Tb doping concentrations were 3 mol%. The sample was characterized by transmission electron microscopy (TEM) (JEOL Ltd., Tokyo, Japan) and X-ray diffraction (XRD λ = 1.5406 Å) (Rigaku, Tokyo, Japan). Figure 2 exhibits the TEM image and the size distribution histogram. It can be seen that the shape of the sample is square with a mean dimension of 8 ± 2 nm.
3. Results and Discussion
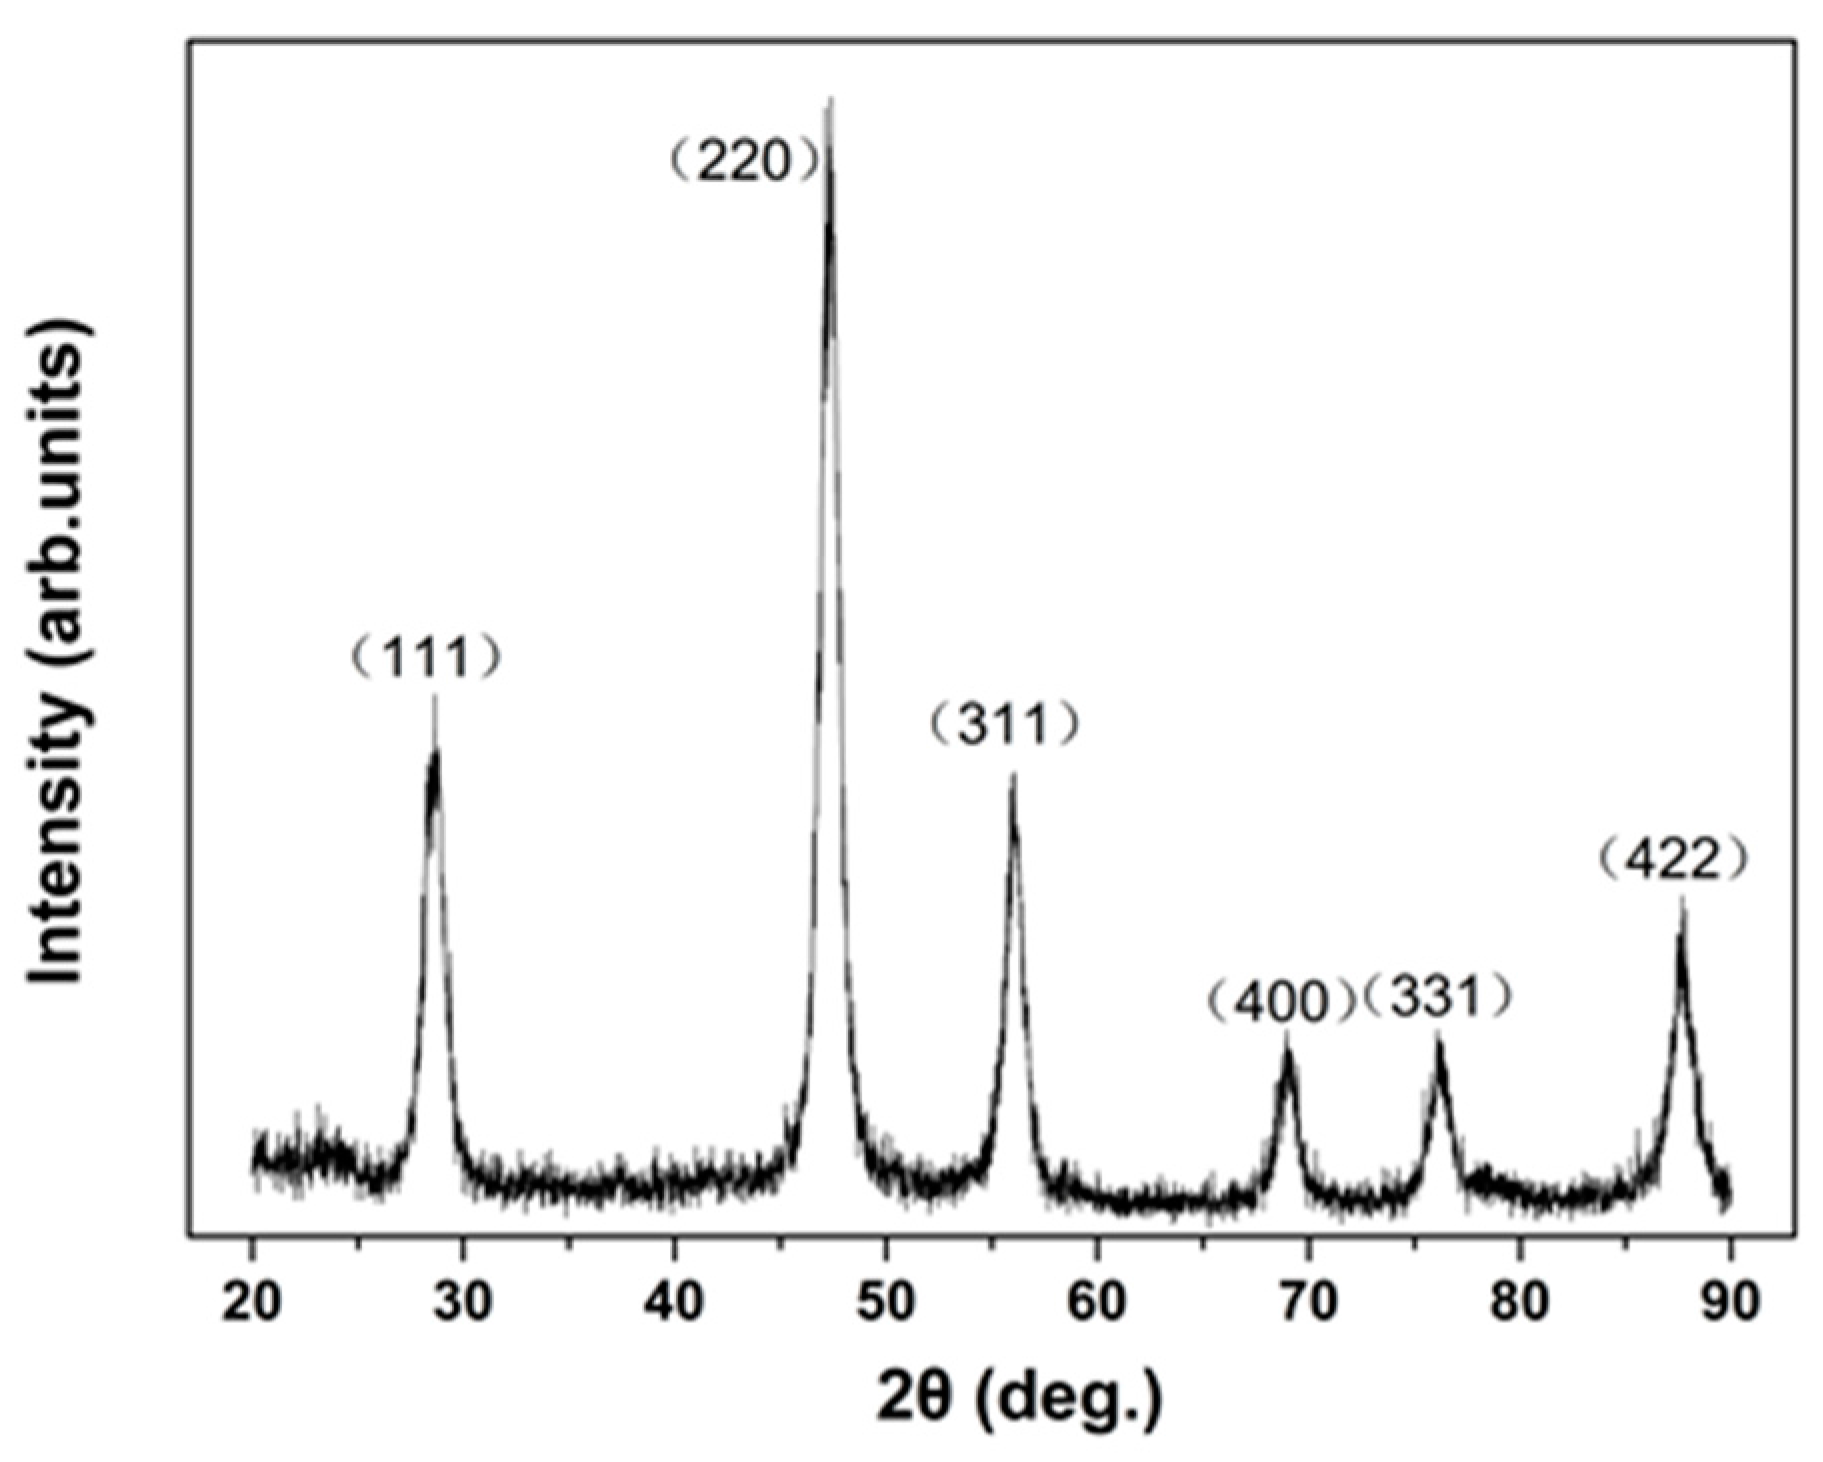
Figure 3 shows the X-ray diffraction pattern of CaF2 nanoparticles with 3 mol% Tb concentrations. The diffraction peaks of the sample match well with the pure cubic (space group: Fm3m (225) α = β = γ = 90°) phase of CaF2 (Joint Committee on Powder Diffraction Standards JCPDS Card No. 35-0816) and the lattice constant is 5.432 Å, which suggests that the original structure of CaF2 was retained after doping. No impurity peaks are observed in the pattern, indicating that the Tb3+ ions were incorporated into the CaF2 lattice and substitute Ca2+ ions. The average size estimated from the full width at half maximum (FWHM) using the Debye-Scherrer formula is 8.3 nm, which has good agreement with the TEM result.
The Nyquist impedance spectra of CaF2 nanoparticles with 3 mol% Tb concentrations under several pressures are presented in Figure 4.
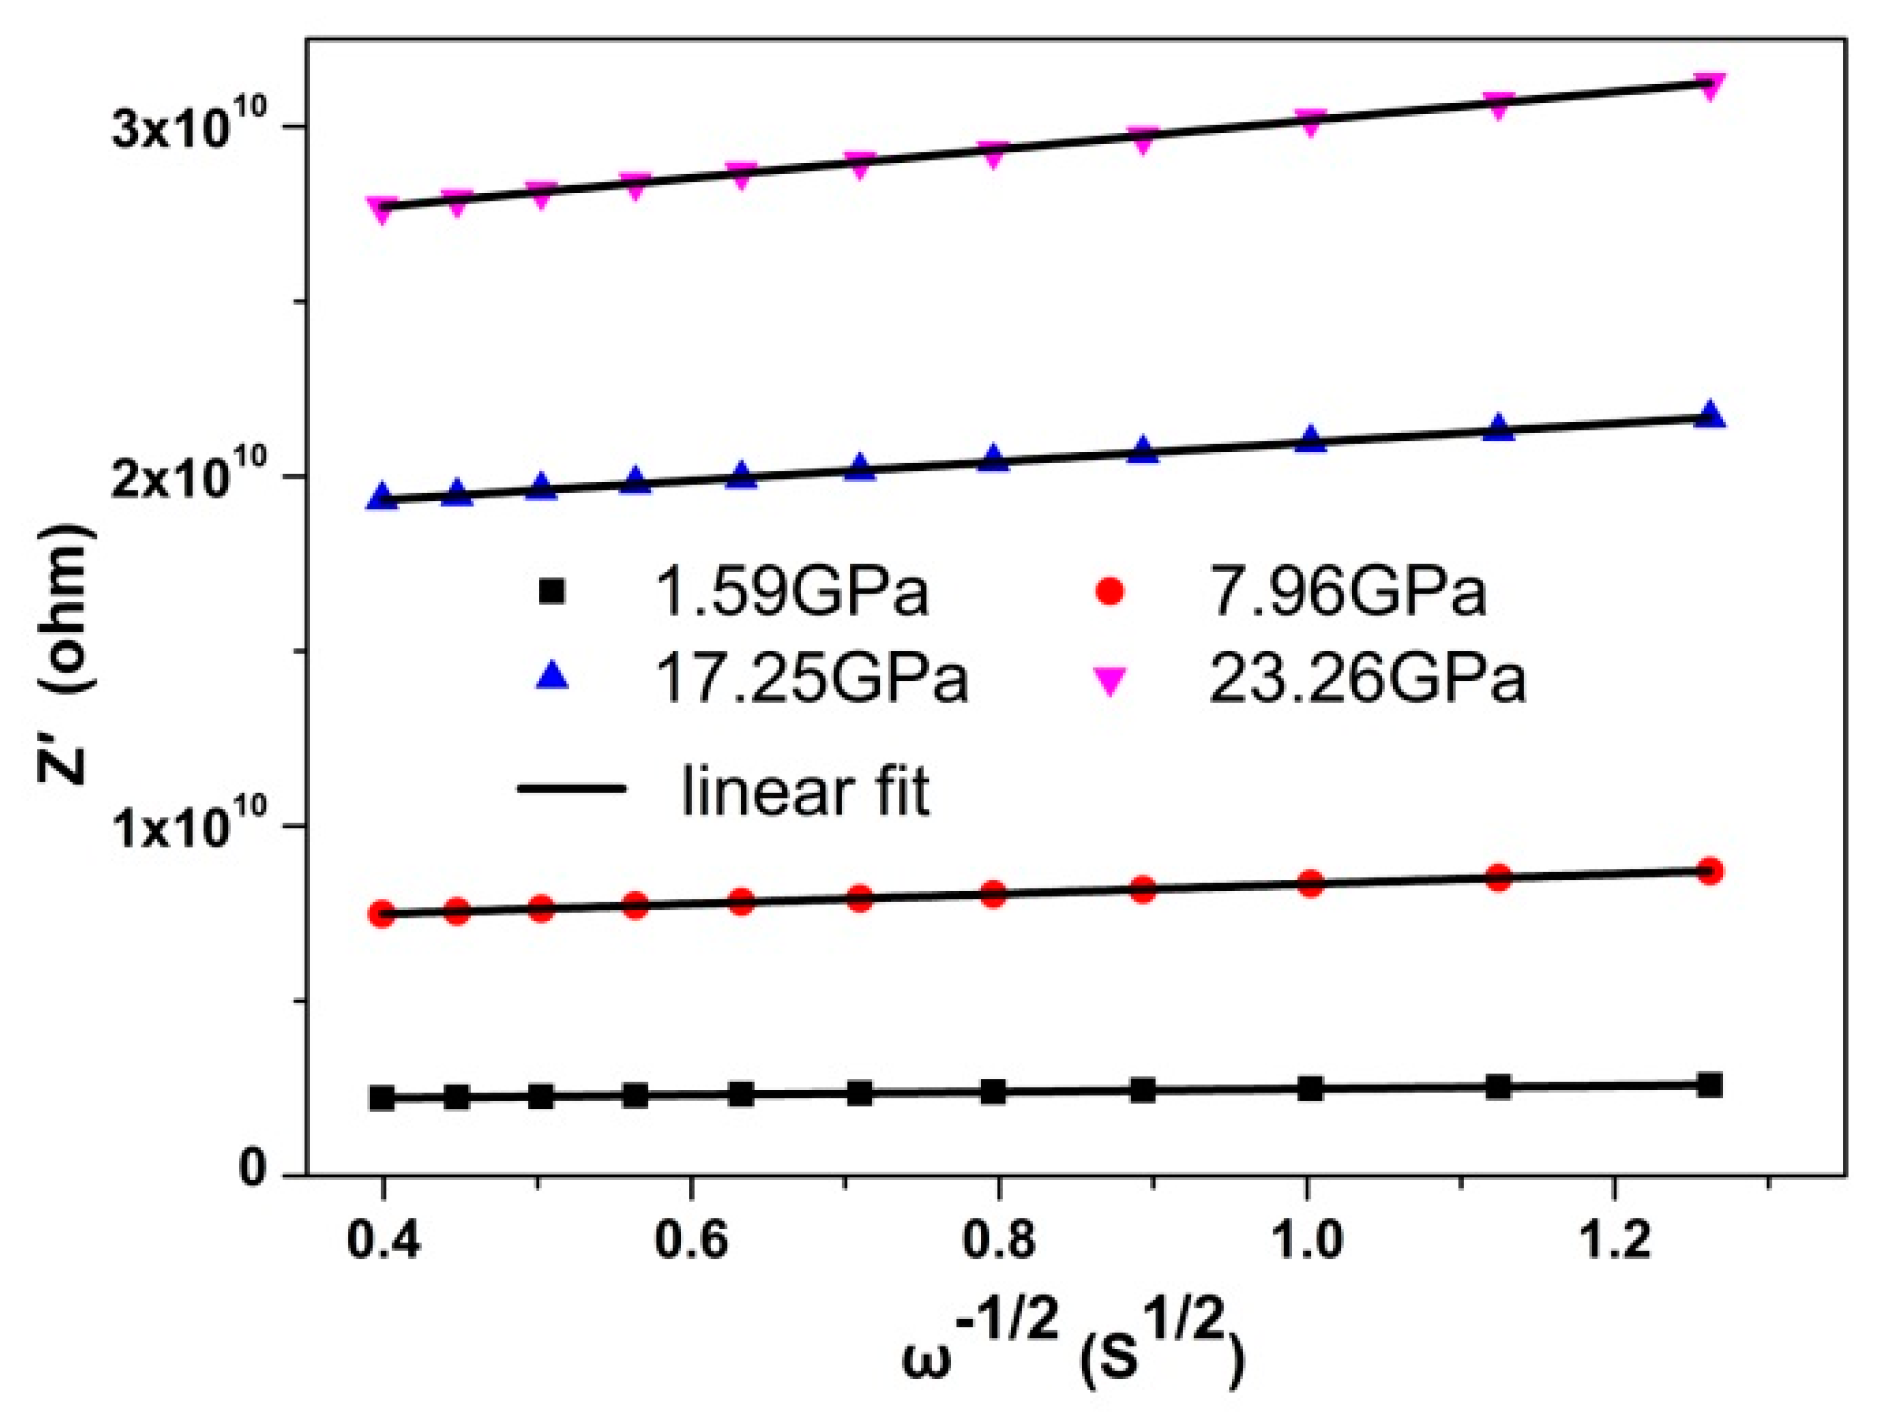
To analyze the ionic conduction, the impedance spectra were replotted into Z′~ω−1/2 plots, as shown in Figure 5.
In the low frequency region, the Z′ can be expressed as:
where is a parameter independent of frequency, σ is the Warburg coefficient, and ω is the frequency. By linear fitting the Z′~ω−1/2 plots, the Warburg coefficient of various pressure was obtained. The diffusion coefficient of the ions (Di) can be obtained from:
where R is the ideal gas constant, T is the temperature, A is the electrode area, F is the Faraday constant, and C is the F− ions molar concentration. We set the F− ion diffusion coefficient at 0 GPa as D0, and the curve Di/D0 under different pressures was obtained and is shown in Figure 6a.
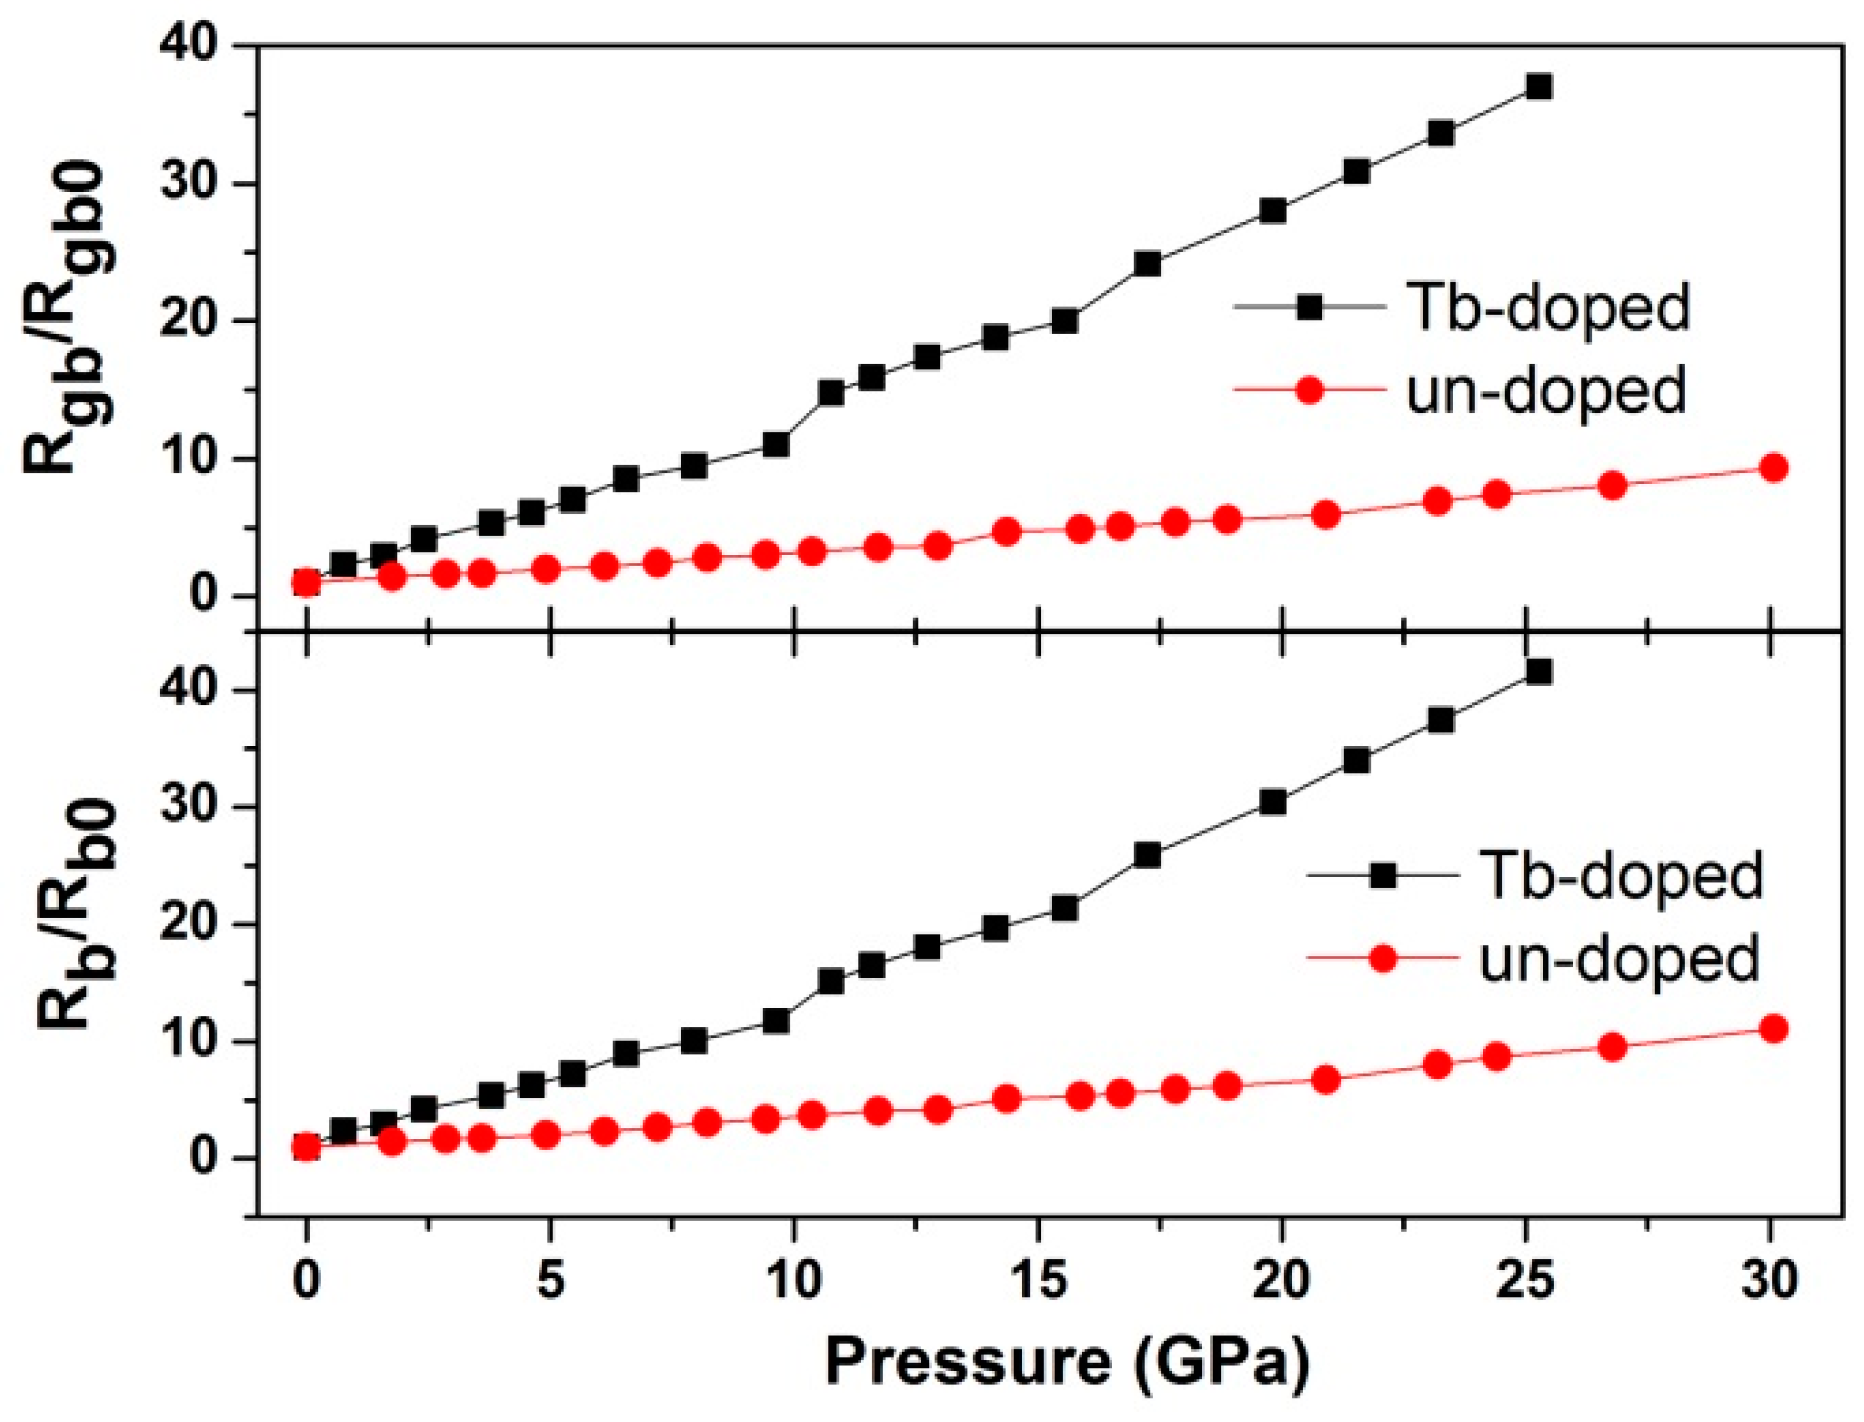
To quantify the pressure effect on the electrical transport properties, the impedance spectra were fitted with the equivalent circuit model (the inset (a) of Figure 4) on the Zview2 impedance analysis software. The obtained bulk and grain boundary resistances (Rb, Rgb) are plotted in Figure 6. The relaxation frequency of bulk (fb) under different pressures was obtained from the Z”~f curve and is presented in Figure 6d.
From Figure 6, it can be seen that all of the parameters vary discontinuously at approximately 10.76 GPa, corresponding to the fluorite-cotunnite (Fm3m–Pnma) structural transition of the sample. According to our previous works [29,33], this phase transition of un-doped CaF2 nanocrystals occurs at about 14 GPa. The variation in the phase transition pressure with the substitution of Ca2+ by Tb3+ can be discussed as follows: the ionic radius of Tb3+ (0.092 nm) is smaller than that of Ca2+ (0.099 nm), and the valence of Tb3+ is different with that of Ca2+; these result in deformation in the lattice and the increasing of the deformation potential, and finally make the transition pressure lower.
In the whole pressure range, the diffusion coefficient decreases with pressure; however, the grain and grain boundary resistance increase, indicating that the F− ions diffusion and electronic transport become more difficult with the rising pressure. The grain resistance is larger than the grain boundary resistance, which indicates that defects at grains play a dominant role in the electronic transport process.
The pressure dependence of grain activation energy (dH/dP) can be obtained from:
where kB is the Boltzmann constant and T is the temperature. By linear fitting to the curve lnfb~P, the dH/dP of the Fm3m and Pnma phases were obtained and are listed in Table 1. The dH/dP of un-doped CaF2 nanocrystals were obtained by the data of Reference [27] and are also shown in Table 1.
The positive values of dH/dP in Fm3m and Pnma phases indicate that the charge-discharge process becomes more difficult under compression. In the Fm3m and Pnma phases, the dH/dP values of the Tb-doped CaF2 nanocrystals are larger than those of un-doped CaF2 nanocrystals. This indicates that pressure has a larger effect on the charge-discharge process of the Tb-doped sample.
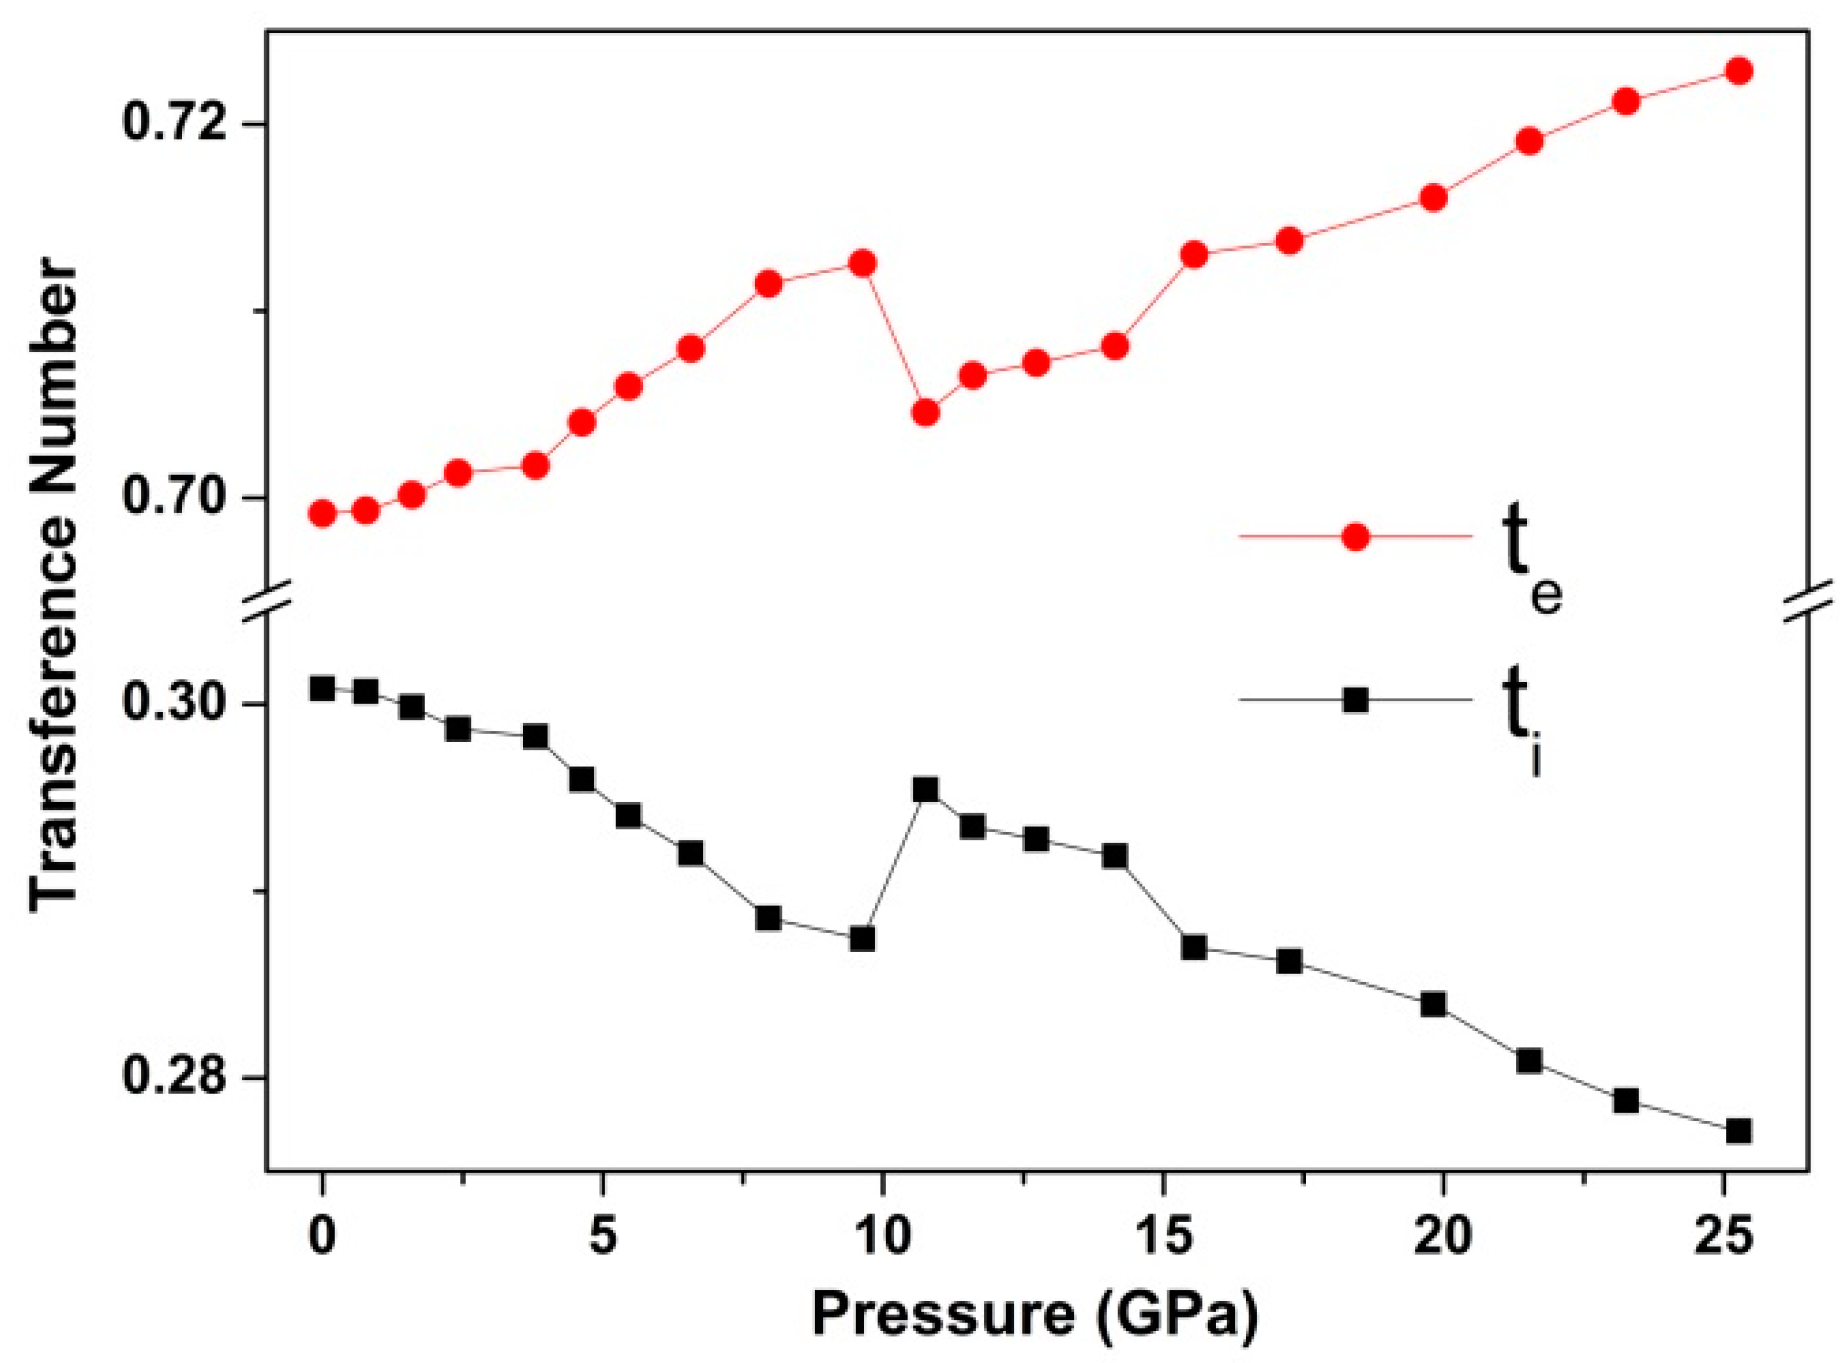
To distinguish the contributions of F− ions and electrons to the transport process, the transference number were calculated by the following equations [34]:
where ti is the transference number of F− ions, te is the transference number of electrons, and R1 and R2 are the intercepts on the real impedance axis as shown in the inset (b) of Figure 4. ti and te under various pressures are shown in Figure 7. It can be seen that electrons play a dominant role in the transport process and the electron transference number slightly increases as the pressure rises.
To further revealing the effect of Tb doping on the high-pressure transport behavior, the resistance variation of Tb-doped CaF2 nanocrystals is compared with that of un-doped CaF2 nanocrystals. The bulk and grain boundary resistances at 0 GPa were set as Rb0 and Rgb0, then the Rb/Rb0 and Rgb/Rgb0 of Tb-doped and un-doped CaF2 nanocrystals were obtained and are shown in Figure 8. It can be observed that both in the bulk and grain boundary, the resistance variation of the Tb-doped sample is larger than that of the un-doped sample. This indicates that the Tb doping improves the pressure effect on the transport behavior of CaF2 nanocrystals.
4. Conclusions
The electrical properties of CaF2 nanoparticles with 3 mol% Tb concentrations under high pressure were investigated by impedance measurement. All of the electrical parameters vary abnormally at approximately 10.76 GPa, corresponding to the Fm3m–Pnma structural transition. The substitution of Ca2+ by Tb3+ leads to deformation in the lattice, and finally lowers the transition pressure. The F− ions diffusion, electronic transport, and charge-discharge process become more difficult with the rising pressure. In the electronic transport process, defects at grains play a dominant role. The charge carriers include both F− ions and electrons, and electrons are dominant in the transport process. The Tb doping improves the pressure effect on the transport behavior of CaF2 nanocrystals. Other lanthanides such as Yb, Er, Ce, etc. would cause similar effects and should be explored in the future.
Acknowledgments
This work was financially supported by the National Natural Science Foundation of China (Grant Nos. 11674404, 11704151 and 11404137), the Twentieth Five-Year Program for Science and Technology of Education Department of Jilin Province, China (Grant No. 20150221), and the Open Project of State Key Laboratory of Superhard Materials (Jilin University) (Grant No. 201710)
Author Contributions
Tingjing Hu conceived and designed the experiments; Jingshu Wang and Yinzhu Chen fabricated and characterized the sample; Xin Zhong and Junkai Zhang collaborated in XRD, TEM measurements; Xiaoyan Cui, Jinghai Yang and Chunxiao Gao analyzed the data. All authors discussed the experiment results and contributed to writing the paper.
Conflicts of Interest
The authors declare no conflict of interest.
References
- Bazzi, R.; Flores, M.A.; Louis, C.; Lebbou, K.; Zhang, W.; Dujardin, C.; Roux, S.; Mercier, B.; Ledoux, G.; Bernstein, E.; et al. Synthesis and properties of europium-based phosphors on the nanometer scale: Eu2O3, Gd2O3: Eu, and Y2O3: Eu. J. Colloid Interface Sci. 2004, 273, 191–197. [Google Scholar] [CrossRef] [PubMed]
- Nishi, M.; Tanabe, S.; Inoue, M.; Takahashi, M.; Fujita, K.; Hirao, K. Optical-telecommunication-band fluorescence properties of Er3+-doped YAG nanocrystals synthesized by glycothermal method. Opt. Mater. 2005, 27, 655–662. [Google Scholar] [CrossRef]
- Rulison, A.J.; Flagan, R.C. Synthesis of yttria powders by electrospray pyrolysis. J. Am. Ceram. Soc. 1994, 77, 3244–3250. [Google Scholar] [CrossRef]
- Patra, A.; Friend, C.S.; Kapoor, R.; Prasad, P.N. Fluorescence upconversion properties of Er3+-doped TiO2 and BaTiO3 nanocrystallites. Chem. Mater. 2003, 15, 3650–3655. [Google Scholar] [CrossRef]
- Masenelli, B.; Melinon, P.; Nicolas, D.; Bernstein, E.; Prevel, B.; Kapsa, J.; Boisron, O.; Perezl, A.; Ledoux, G.; Mercier, B.; et al. Rare earth based clusters for nanoscale light source. Eur. Phys. J. D 2005, 34, 139–143. [Google Scholar] [CrossRef]
- Wei, Z.G.; Sun, L.D.; Liao, C.S.; Yan, C.H. Fluorescence intensity and color purity improvement in nanosized YBO3: Eu. Appl. Phys. Lett. 2002, 80, 1447–1449. [Google Scholar] [CrossRef]
- Matsuura, D. Red, green, and blue upconversion luminescence of trivalent-rare-earth ion-doped Y2O3 nanocrystals. Appl. Phys. Lett. 2002, 81, 4526–4528. [Google Scholar] [CrossRef]
- Barber, D.B.; Pollock, C.R.; Beecroft, L.L.; Ober, C.K. Amplification by optical composites. Opt. Lett. 1997, 22, 1247–1249. [Google Scholar] [CrossRef] [PubMed]
- Yi, G.; Lu, H.; Zhao, S.; Ge, Y.; Yang, W.; Chen, D.; Guo, L. Synthesis, characterization, and biological application of size-controlled nanocrystalline NaYF4:Yb, Er infrared-to-visible up-conversion phosphors. Nano Lett. 2004, 4, 2191–2196. [Google Scholar] [CrossRef]
- Chen, Z.; Chen, H.; Hu, H.; Yu, M.; Li, F.; Zhang, Q.; Zhou, Z.; Yi, T.; Huang, C. Versatile synthesis strategy for carboxylic acid−functionalized upconverting nanophosphors as biological labels. J. Am. Chem. Soc. 2008, 130, 3023–3029. [Google Scholar] [CrossRef] [PubMed]
- Fujihara, S.; Kadota, Y.; Kimura, T. Role of organic additives in the sol-gel synthesis of porous CaF2 anti-reflective coatings. J. Sol-Gel Sci. Technol. 2002, 24, 147–154. [Google Scholar] [CrossRef]
- McKeever, S.W.S.; Brown, M.D.; Abbundi, R.J.; Chan, H.; Mathur, V.K. Characterization of optically active sites in CaF2: Ce, Mn from optical spectra. J. Appl. Phys. 1986, 60, 2505–2510. [Google Scholar] [CrossRef]
- Fukuda, Y. Thermoluminescence in sintered CaF2:Tb. J. Radiat. Res. 2002, 43, S67–S69. [Google Scholar] [CrossRef] [PubMed]
- Pote, S.S.; Joshi, C.P.; Moharil, S.V.; Muthal, P.L.; Dhopte, S.M. Luminescence of Ce3+ in Ca0.65 La0.35F2.35 host. J. Lumin. 2010, 130, 666–668. [Google Scholar] [CrossRef]
- Cazorla1, C.; Errandonea, D. Superionicity and polymorphism in calcium fluoride at high pressure. Phys. Rev. Lett. 2014, 113, 235902. [Google Scholar] [CrossRef] [PubMed]
- Sinclair, D.C.; West, A.R. Impedance and modulus spectroscopy of semiconducting BaTiO3 showing positive temperature coefficient of resistance. J. Appl. Phys. 1989, 66, 3850–3856. [Google Scholar] [CrossRef]
- Sinclair, D.C.; Adams, T.B.; Morrison, F.D.; West, A.R. CaCu3Ti4O12: One-step internal barrier layer capacitor. Appl. Phys. Lett. 2002, 80, 2153–2155. [Google Scholar] [CrossRef]
- Dutta, S.; Choudhary, R.N.P.; Sinha, P.K.; Thakur, A.K. Microstructural studies of (PbLa)(ZrTi)O3 ceramics using complex impedance spectroscopy. J. Appl. Phys. 2004, 96, 1607–1613. [Google Scholar] [CrossRef]
- Hsu, H.S.; Huang, J.C.A.; Chen, S.F.; Liu, C.P. Role of grain boundary and grain defects on ferromagnetism in Co : ZnO films. Appl. Phys. Lett. 2007, 90, 102506. [Google Scholar] [CrossRef]
- Dualeh, A.; Moehl, T.; Tetreault, N.; Teuscher, J.; Gao, P.; Nazeeruddin, M.K.; Gratzel, M. Impedance spectroscopic analysis of lead iodide perovskite-sensitized solid-state solar cells. ACS Nano 2013, 8, 362–373. [Google Scholar] [CrossRef] [PubMed]
- Huggins, R.A. Simple method to determine electronic and ionic components of the conductivity in mixed conductors: A review. Ionics 2002, 8, 300–313. [Google Scholar] [CrossRef]
- Teraoka, Y.; Zhang, H.; Okamoto, K.; Yamazoe, N. Mixed ionic-electronic conductivity of La1−xSrxCo1−yFeyO3−δ perovskite-type oxides. Mater. Res. Bull. 1988, 23, 51–58. [Google Scholar] [CrossRef]
- Riess, I. Measurements of electronic and ionic partial conductivities in mixed conductors, without the use of blocking electrodes. Solid State Ionics 1991, 44, 207–214. [Google Scholar] [CrossRef]
- Riess, I. Review of the limitation of the Hebb-Wagner polarization method for measuring partial conductivities in mixed ionic electronic conductors. Solid State Ion. 1996, 91, 221–232. [Google Scholar] [CrossRef]
- Adler, S.B.; Lane, J.; Steele, B. Electrode kinetics of porous mixed-conducting oxygen electrodes. J. Electrochem. Soc. 1996, 143, 3554–3564. [Google Scholar] [CrossRef]
- Riess, I. Mixed ionic–electronic conductors—Material properties and applications. Solid State Ion. 2003, 157, 1–17. [Google Scholar] [CrossRef]
- Cui, X.Y.; Hu, T.J.; Wang, J.S.; Zhang, J.K.; Zhao, R.; Li, X.F.; Yang, J.H.; Gao, C.X. Mixed conduction in BaF2 nanocrystals under high pressure. RSC Adv. 2017, 7, 12098–12102. [Google Scholar] [CrossRef]
- Cui, X.Y.; Hu, T.J.; Wang, J.S.; Zhang, J.K.; Li, X.F.; Yang, J.H.; Gao, C.X. High pressure impedance spectroscopy of SrF2 nanocrystals. High Press. Res. 2017, 37, 312–318. [Google Scholar] [CrossRef]
- Hu, T.J.; Cui, X.Y.; Wang, J.S.; Zhang, J.K.; Li, X.F.; Yang, J.H.; Gao, C.X. Transport properties of mixing conduction in CaF2 nanocrystals under high pressure. Chin. Phys. B 2018, 27, 016401. [Google Scholar] [CrossRef]
- Mao, H.K.; Bell, P.M. High-pressure physics: The 1-megabar mark on the ruby R1 static pressure scale. Science 1976, 191, 851–852. [Google Scholar] [CrossRef] [PubMed]
- Errandonea, D.; Muñoz, A.; Gonzalez-Platas, J. Comment on “High-pressure X-ray diffraction study of YBO3/Eu3+, GdBO3, and EuBO3: Pressure-induced amorphization in GdBO3” [J. Appl. Phys. 115, 043507 (2014)]. J. Appl. Phys. 2014, 115, 216101. [Google Scholar] [CrossRef]
- Errandonea, D.; Segura, A.; Martínez-García, D.; Muñoz-San Jose, V. Hall-effect and resistivity measurements in CdTe and ZnTe at high pressure: Electronic structure of impurities in the zinc-blende phase and the semimetallic or metallic character of the high-pressure phases. Phys. Rev. B 2009, 79, 125203. [Google Scholar] [CrossRef]
- Wang, J.S.; Hao, J.; Wang, Q.S.; Jin, Y.X.; Li, F.F.; Liu, B.; Li, Q.J.; Liu, B.B.; Cui, Q.L. Pressure-induced structural transition in CaF2 nanocrystals. Phys. Status Solidi B 2011, 248, 1115–1118. [Google Scholar] [CrossRef]
- Wang, Q.L.; Liu, C.L.; Gao, Y.; Ma, Y.Z.; Han, Y.H.; Gao, C.X. Mixed conduction and grain boundary effect in lithium niobate under high pressure. Appl. Phys. Lett. 2015, 106, 132902. [Google Scholar] [CrossRef]
Figure 1.
The completed microcircuit (left) on diamond anvil and the profile of our designed diamond anvil cell (DAC) (right).
Figure 1.
The completed microcircuit (left) on diamond anvil and the profile of our designed diamond anvil cell (DAC) (right).

Figure 2.
The TEM image and the size distribution histogram of 3 mol% Tb-doped CaF2 nanoparticles.
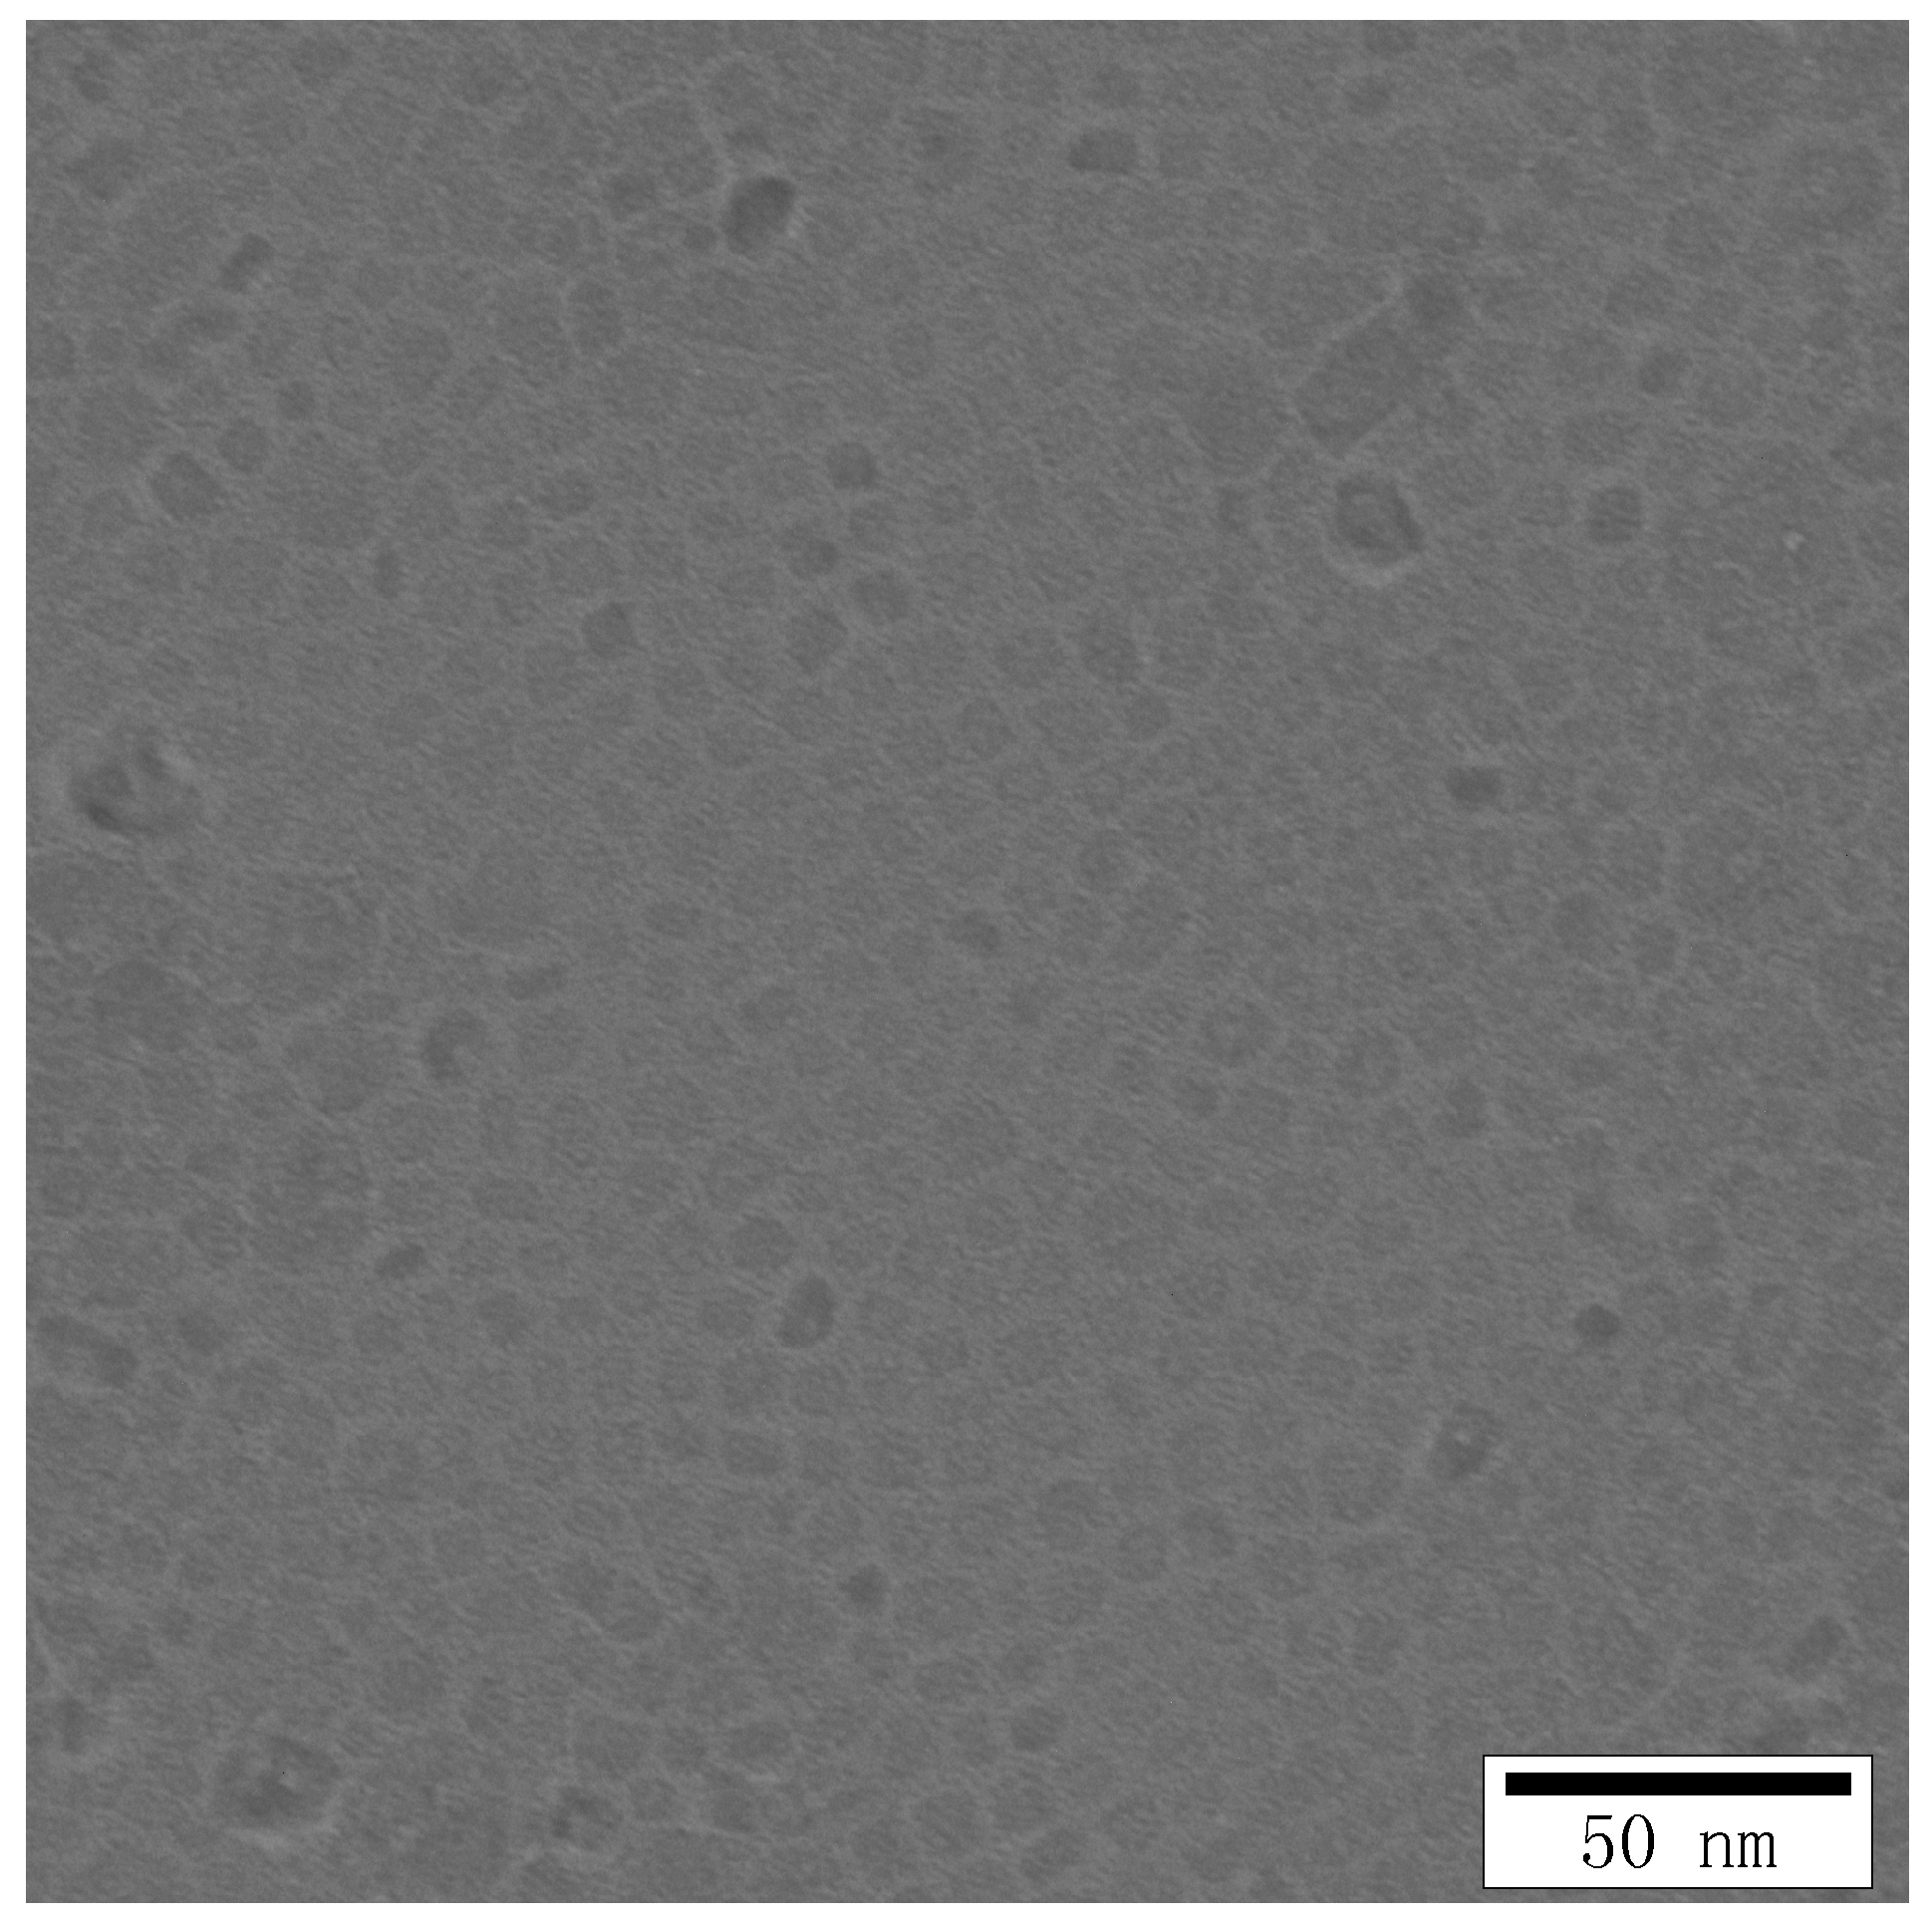
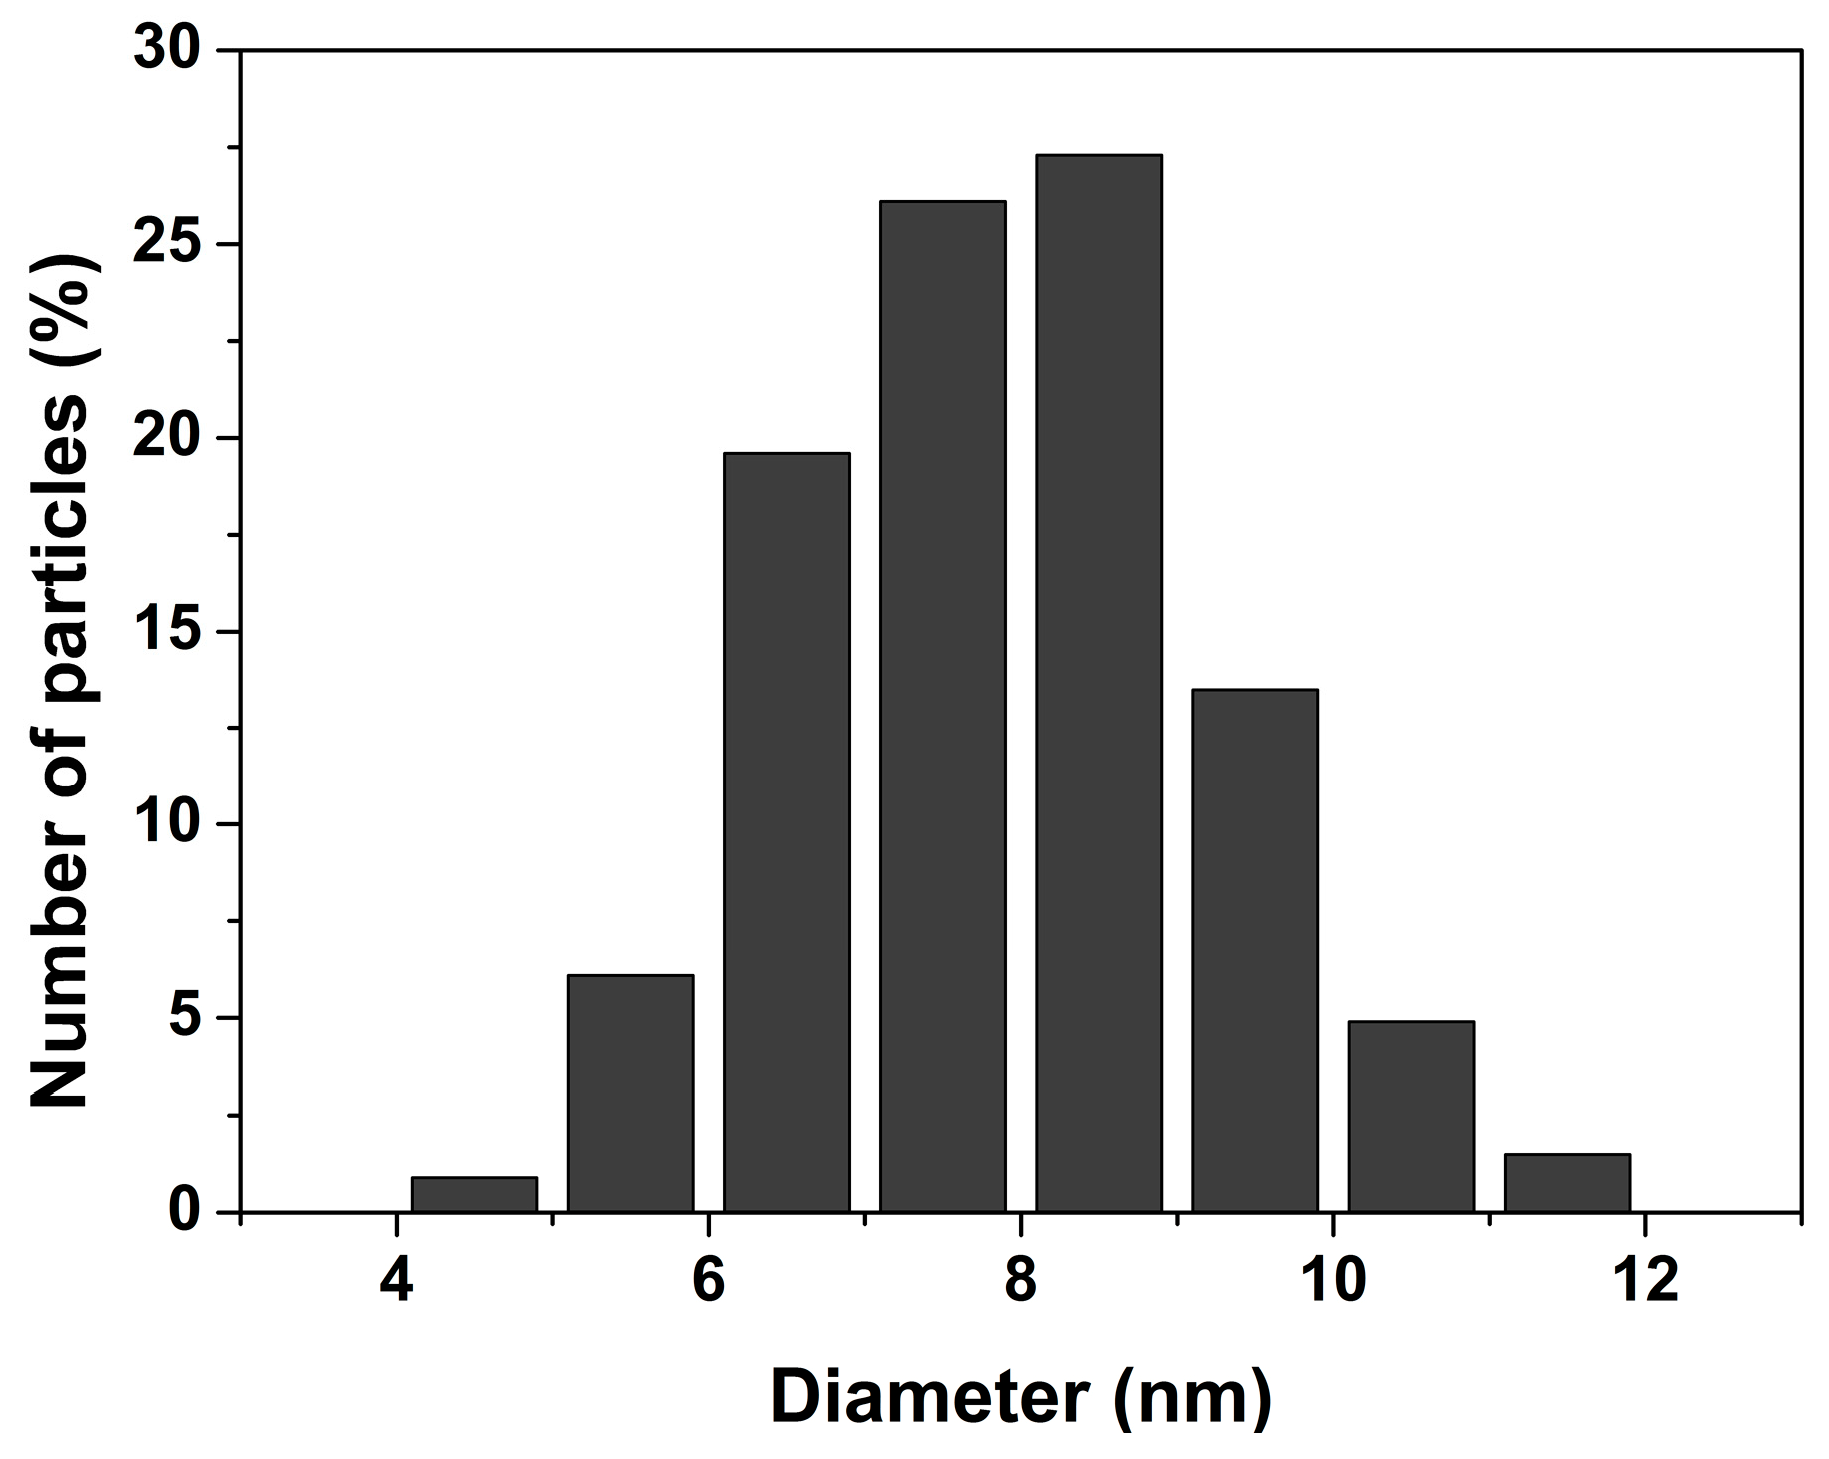
Figure 3.
The X-ray diffraction pattern of CaF2 nanoparticles with 3 mol% Tb concentrations at atmospheric pressure.
Figure 3.
The X-ray diffraction pattern of CaF2 nanoparticles with 3 mol% Tb concentrations at atmospheric pressure.

Figure 4.
The Nyquist impedance spectra under several pressures. The inset (a) shows the equivalent circuit model, Rb and Rgb are grain and grain boundary resistance, Cb and Cgb are grain and grain boundary capacitance, and Wi is the Warburg impedance. The inset (b) is the spectroscopy at 1.59 GPa, R1 and R2 are two intercepts on the real impedance axis.
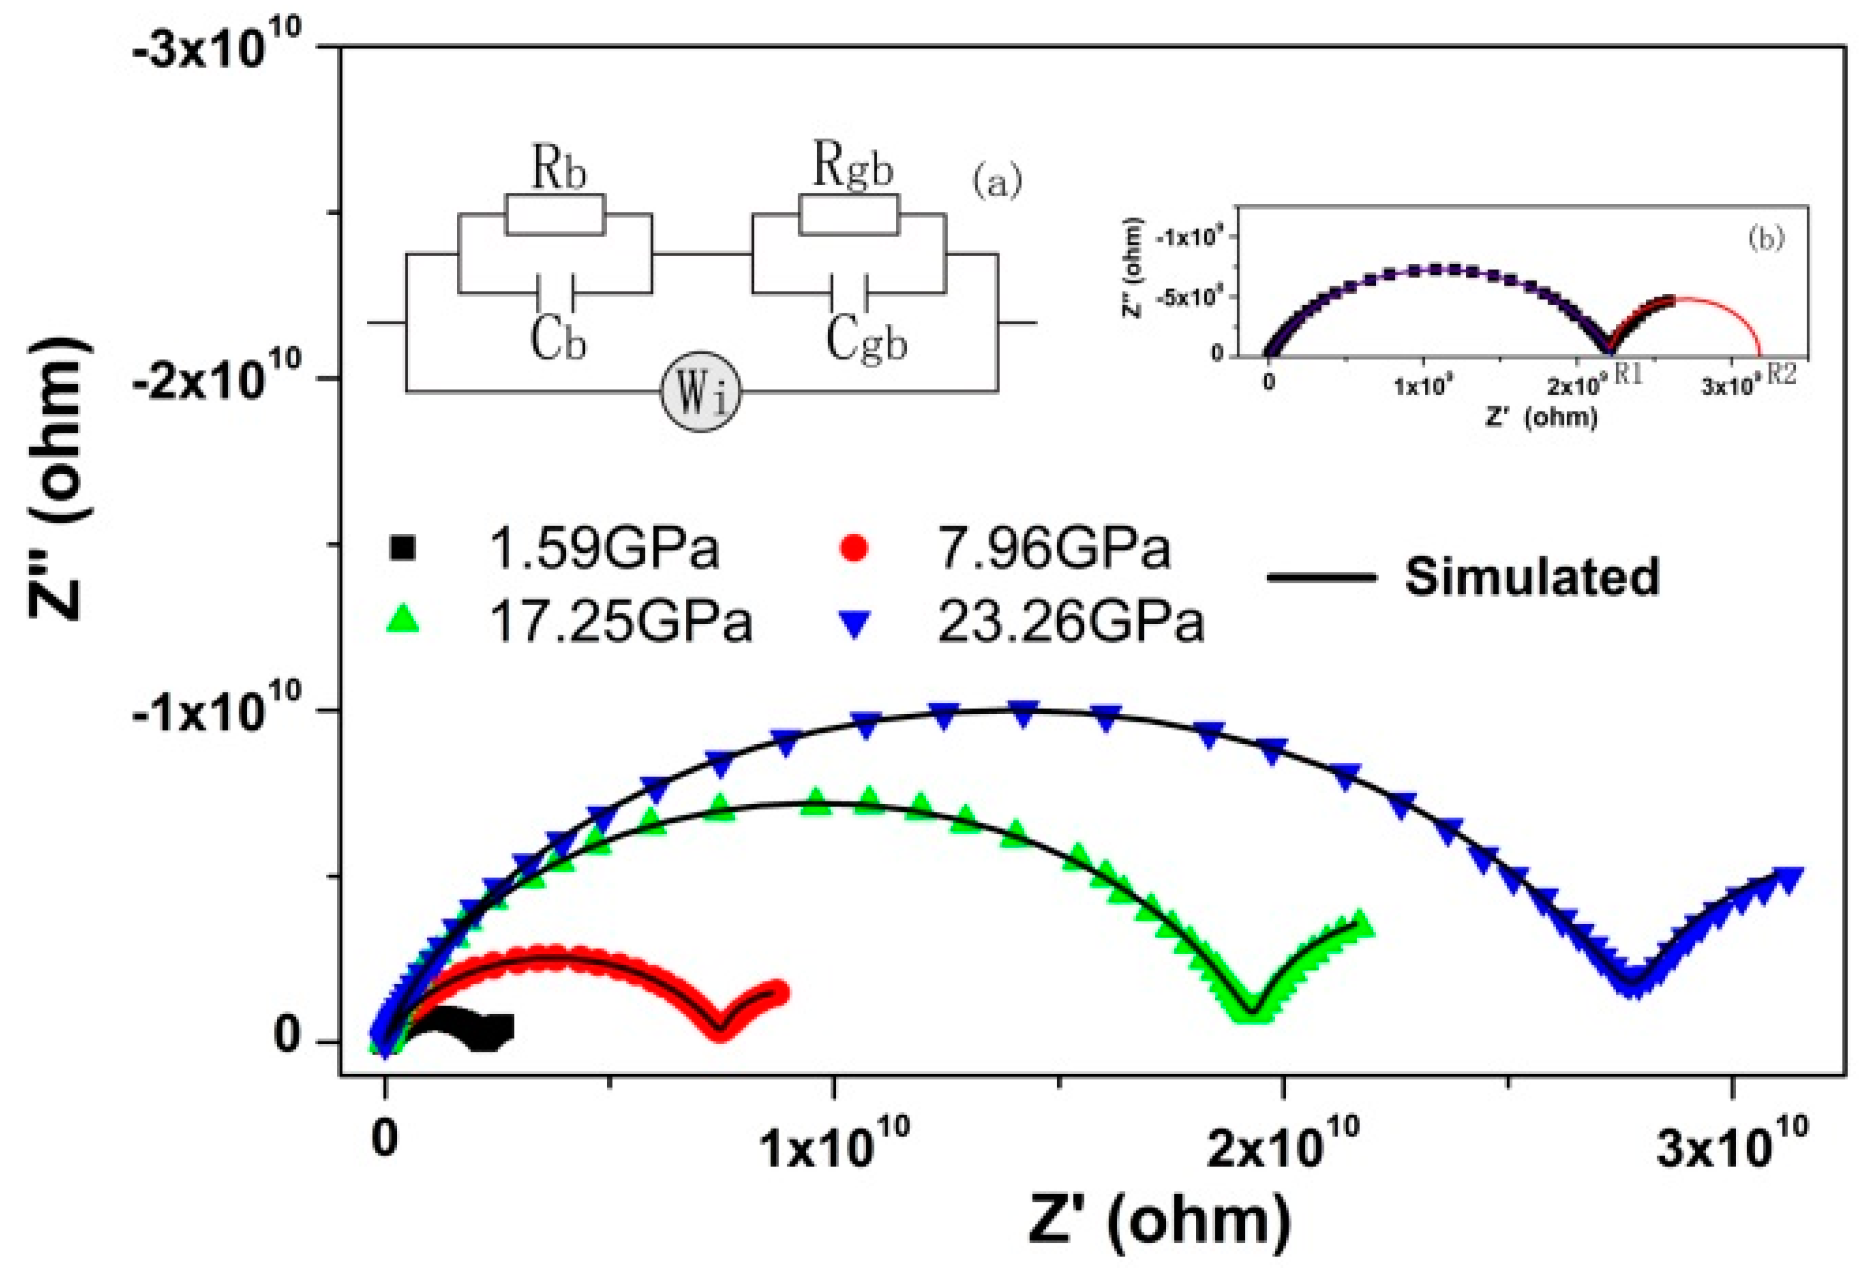
Figure 5.
The Z′~ω−1/2 curves at low frequencies under several pressures.

Figure 6.
(a) the diffusion coefficient, (b) the bulk resistance, (c) the grain boundary resistance, (d) the bulk relaxation frequency under high pressure. D0 represents the diffusion coefficient at 0 GPa.
Figure 6.
(a) the diffusion coefficient, (b) the bulk resistance, (c) the grain boundary resistance, (d) the bulk relaxation frequency under high pressure. D0 represents the diffusion coefficient at 0 GPa.
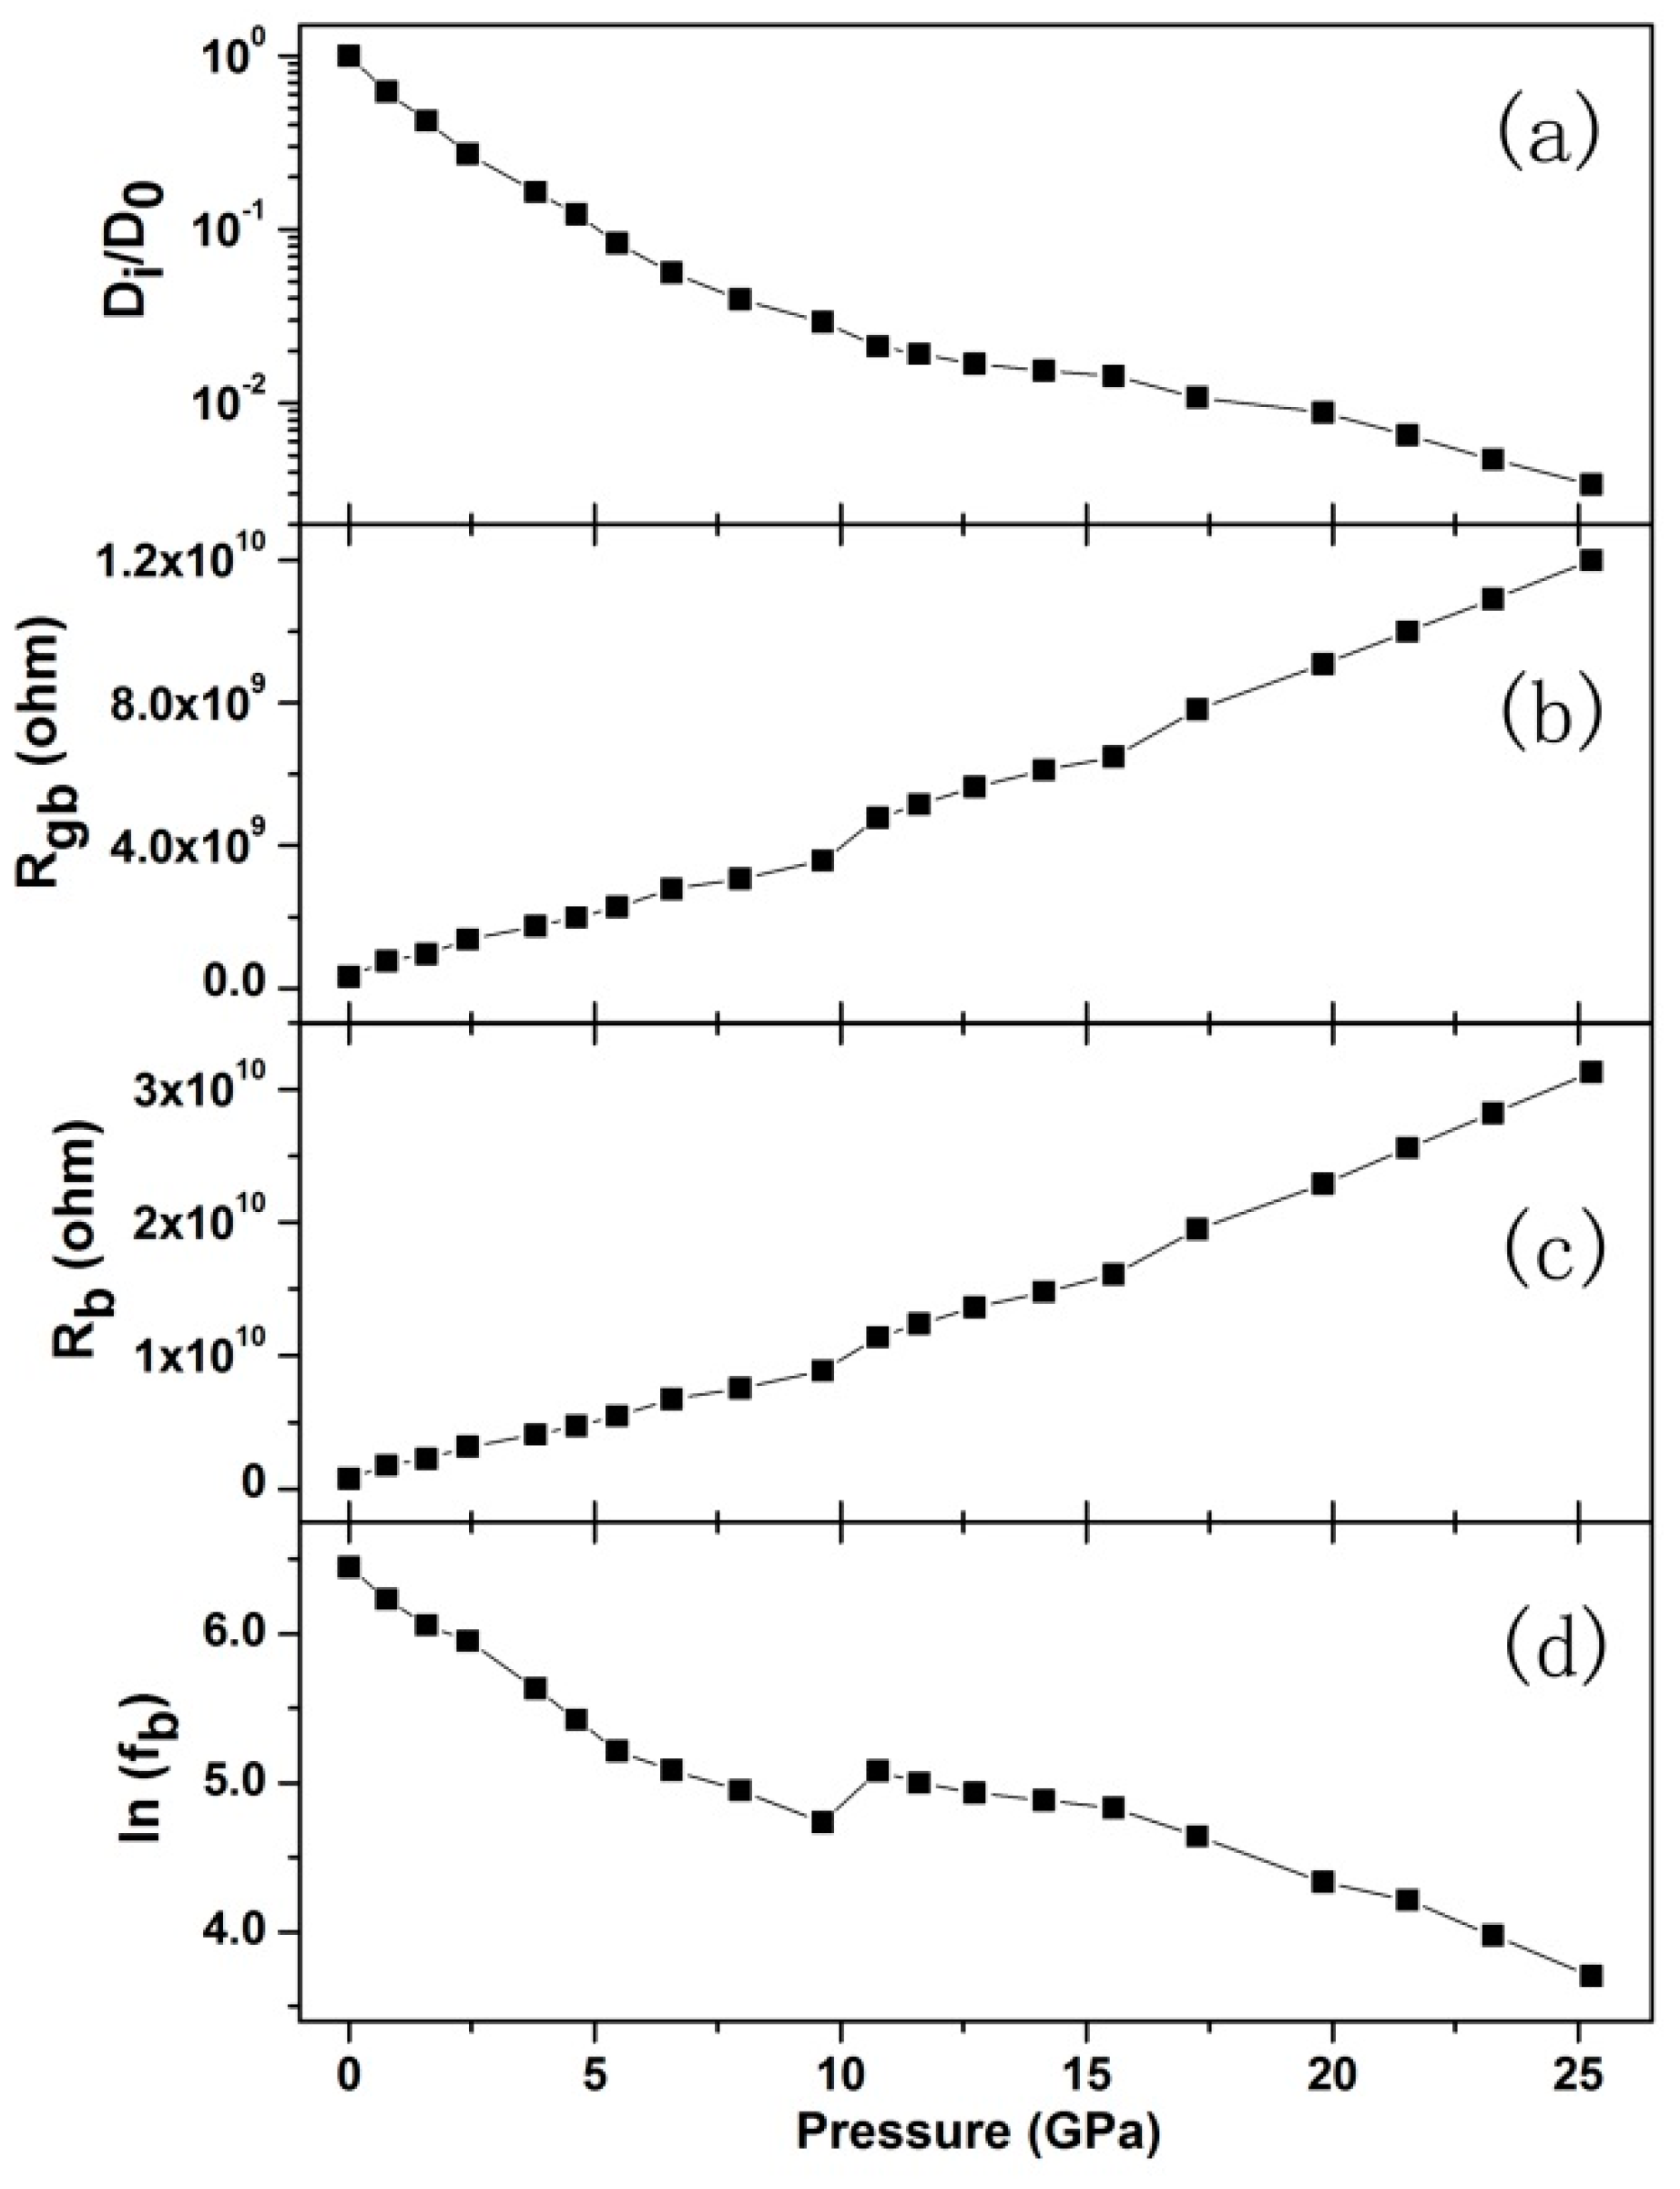
Figure 7.
ti and te under various pressures.

Figure 8.
The Rb/Rb0 and Rgb/Rgb0 of Tb-doped and un-doped CaF2 nanocrystals. Rb0 and Rgb0 represent bulk and grain boundary resistances at 0 GPa.
Figure 8.
The Rb/Rb0 and Rgb/Rgb0 of Tb-doped and un-doped CaF2 nanocrystals. Rb0 and Rgb0 represent bulk and grain boundary resistances at 0 GPa.

Table 1.
Pressure dependence of the grain activation energy of Tb-doped and un-doped CaF2 nanocrystals.
Table 1.
Pressure dependence of the grain activation energy of Tb-doped and un-doped CaF2 nanocrystals.
| Phase | dH/dp (meV/GPa) (Tb-dDoped) | dH/dp (meV/GPa) (Un-Doped) |
|---|---|---|
| Fm3m | 4.70 | 3.12 |
| Pnma | 2.97 | 1.44 |
© 2018 by the authors. Licensee MDPI, Basel, Switzerland. This article is an open access article distributed under the terms and conditions of the Creative Commons Attribution (CC BY) license (http://creativecommons.org/licenses/by/4.0/).
Share and Cite
MDPI and ACS Style
Hu, T.; Cui, X.; Wang, J.; Zhong, X.; Chen, Y.; Zhang, J.; Li, X.; Yang, J.; Gao, C. The Electrical Properties of Tb-Doped CaF2 Nanoparticles under High Pressure. Crystals 2018, 8, 98. https://doi.org/10.3390/cryst8020098
AMA Style
Hu T, Cui X, Wang J, Zhong X, Chen Y, Zhang J, Li X, Yang J, Gao C. The Electrical Properties of Tb-Doped CaF2 Nanoparticles under High Pressure. Crystals. 2018; 8(2):98. https://doi.org/10.3390/cryst8020098
Chicago/Turabian StyleHu, Tingjing, Xiaoyan Cui, Jingshu Wang, Xin Zhong, Yinzhu Chen, Junkai Zhang, Xuefei Li, Jinghai Yang, and Chunxiao Gao. 2018. "The Electrical Properties of Tb-Doped CaF2 Nanoparticles under High Pressure" Crystals 8, no. 2: 98. https://doi.org/10.3390/cryst8020098
Note that from the first issue of 2016, this journal uses article numbers instead of page numbers. See further details here.