Ferroelectric Relaxor Quantum Crystals

Schools of Chemistry and Physics, University of St. Andrews, St Andrews, KY16 9ST, UK
Crystals 2018, 8(4), 180; https://doi.org/10.3390/cryst8040180
Submission received: 27 February 2018
/
Revised: 17 April 2018
/
Accepted: 18 April 2018
/
Published: 21 April 2018
(This article belongs to the Special Issue Quantum Crystals)
Abstract
:A discussion is given of ferroelectrics (FEs) that have their Curie temperatures Tc very near absolute zero. These have differences in their dynamics in comparison with higher-temperature systems, since domain wall motion occurs via quantum mechanical tunneling and not by thermally activated diffusion. Emphasis in the present paper is on FEs that have relaxor characteristics. In such systems, the temperature at which the isothermal electric susceptibility ε(T,f) peaks is a strong function of frequency, and it decreases with decreasing frequency. This is due to glassy viscosity and is symbolic of non-equilibrium dynamics, usually described by a Vogel-Fulcher equation. It permits an extra dimension with which to examine the transitions. The second half of this paper reviews domain wall instabilities and asks about their presence in QCP ferroelectrics, which has not yet been reported and may be unobservable due to the absence of thermal diffusion of walls near T = 0; in this respect, we note that diffusion does exist in ferroelectric relaxors, even at T = 0, by virtue of their glassy, viscous dynamics.
1. Introduction
There are few simple stoichiometric ferroelectrics in which the Curie transition temperature from ferroelectric to paraelectric is very near absolute zero, but a few include potassium lithium tantalate (K3Li2Ta5O15) at Tc = 7 K, lead pyrochlore at Tc = 15.4 K, and O-18 strontium titanate (Tc = ca. 35 K); in addition, sometimes substitutional methods can lower the transition by hundreds of degrees to zero. Examples include hexaferrites [1,2,3,4,5,6,7,8,9,10], tris-sarcosine calcium chloride [11], and a few others. These systems are of general interest, but the interest rises with the degree of complexity, and one kind of additional complexity is provided by the glassy, viscous nature of some ferroelectrics. These systems also exhibit a peak in the isothermal electrical susceptibility (dielectric constant) with temperature, but the value of that temperature varies with frequency, decreasing tens or even hundreds of degrees with decreasing frequency. Typically, measurements are made via dielectric constant and loss data, or by resonant ultrasonic attenuation (RUS), and in the former case, the frequency range of interest varies from a few Hz to a few MHz. With decreasing frequency, the amplitude of the dielectric constant also increases; both this increase and the shift in response peak are typical of viscous materials, and a semi-empirical formula (Vogel-Fulcher Equation) is commonly used to fit the data. This equation has an attempt frequency f0 for restricted ionic jumps, an activation energy Ea, a high-temperature onset Tc (which coincides with a maximum in the real part of the dielectric constant), and a low-temperature freezing temperature Tf. Note that in the context of quantum critical points, Tc can be finite but Tf < 0, implying that there is a characteristic frequency at which the dielectric constant is maximal exactly at T = 0. There is no term yet in the literature for this frequency; we would suggest the term “zero-Kelvin frequency” or perhaps “QCP frequency”.
Most important in the present context is the argument by Tokura’s group that ferroelectric QCPs have no creep and no classical diffusion. This would appear to rule out domain instabilities such as wrinkling and folding in ferroelectric QCPs, based upon the models of Turing and Hohenberg. However, it is in this respect that relaxor QCPs are special: By definition, their ground states are glassy and viscous, and hence certainly permit some diffusion. The presence of a glassy ground state at T = 0 is remarkable in many ways.
Vogel-Fulcher: 𝑓 = 𝑓0 exp [−Ea/k(Tc − T𝑓)]
Here, f is the probe frequency; f0 is an attempt frequency (typically of order an optical phonon frequency); Tc is the temperature at which the dielectric constant peaks at high frequencies (typically 1 MHz); Tf is a freezing temperature at which the dielectric constant would peak at very low frequencies (dc); k is the Boltzmann constant; and Ea is an activation energy. In fitting data, the temperature at which the dielectric constant is maximum is usually graphed versus f.
The present author has recently co-authored a lengthy review on ferroelectric QCPs [12], and so readers are referred to it for a general discussion and comparison with the more frequently studied magnetic QCPs. In addition, a detailed study of KLT and lead pyrochlore relaxor QCPs has also been presented [13].
The basic physics idea for QCP transitions is:
- Classical phase transitions at normal temperatures: Spatial fluctuations of the order parameter are separable from temporal fluctuations.
- Quantum Critical Points: Because momentum p and position x do not commute, spatial and temporal fluctuations are mixed together.
Terminology: d + 1 dimensions (space and time).
2. Materials and Methods
The technique used in our work is dielectric constant measurements of single crystals, ceramic pellets, and thin films. These are standard techniques, but there are artifacts to be avoided [14].
3. Results
3.1. Hexaferrites
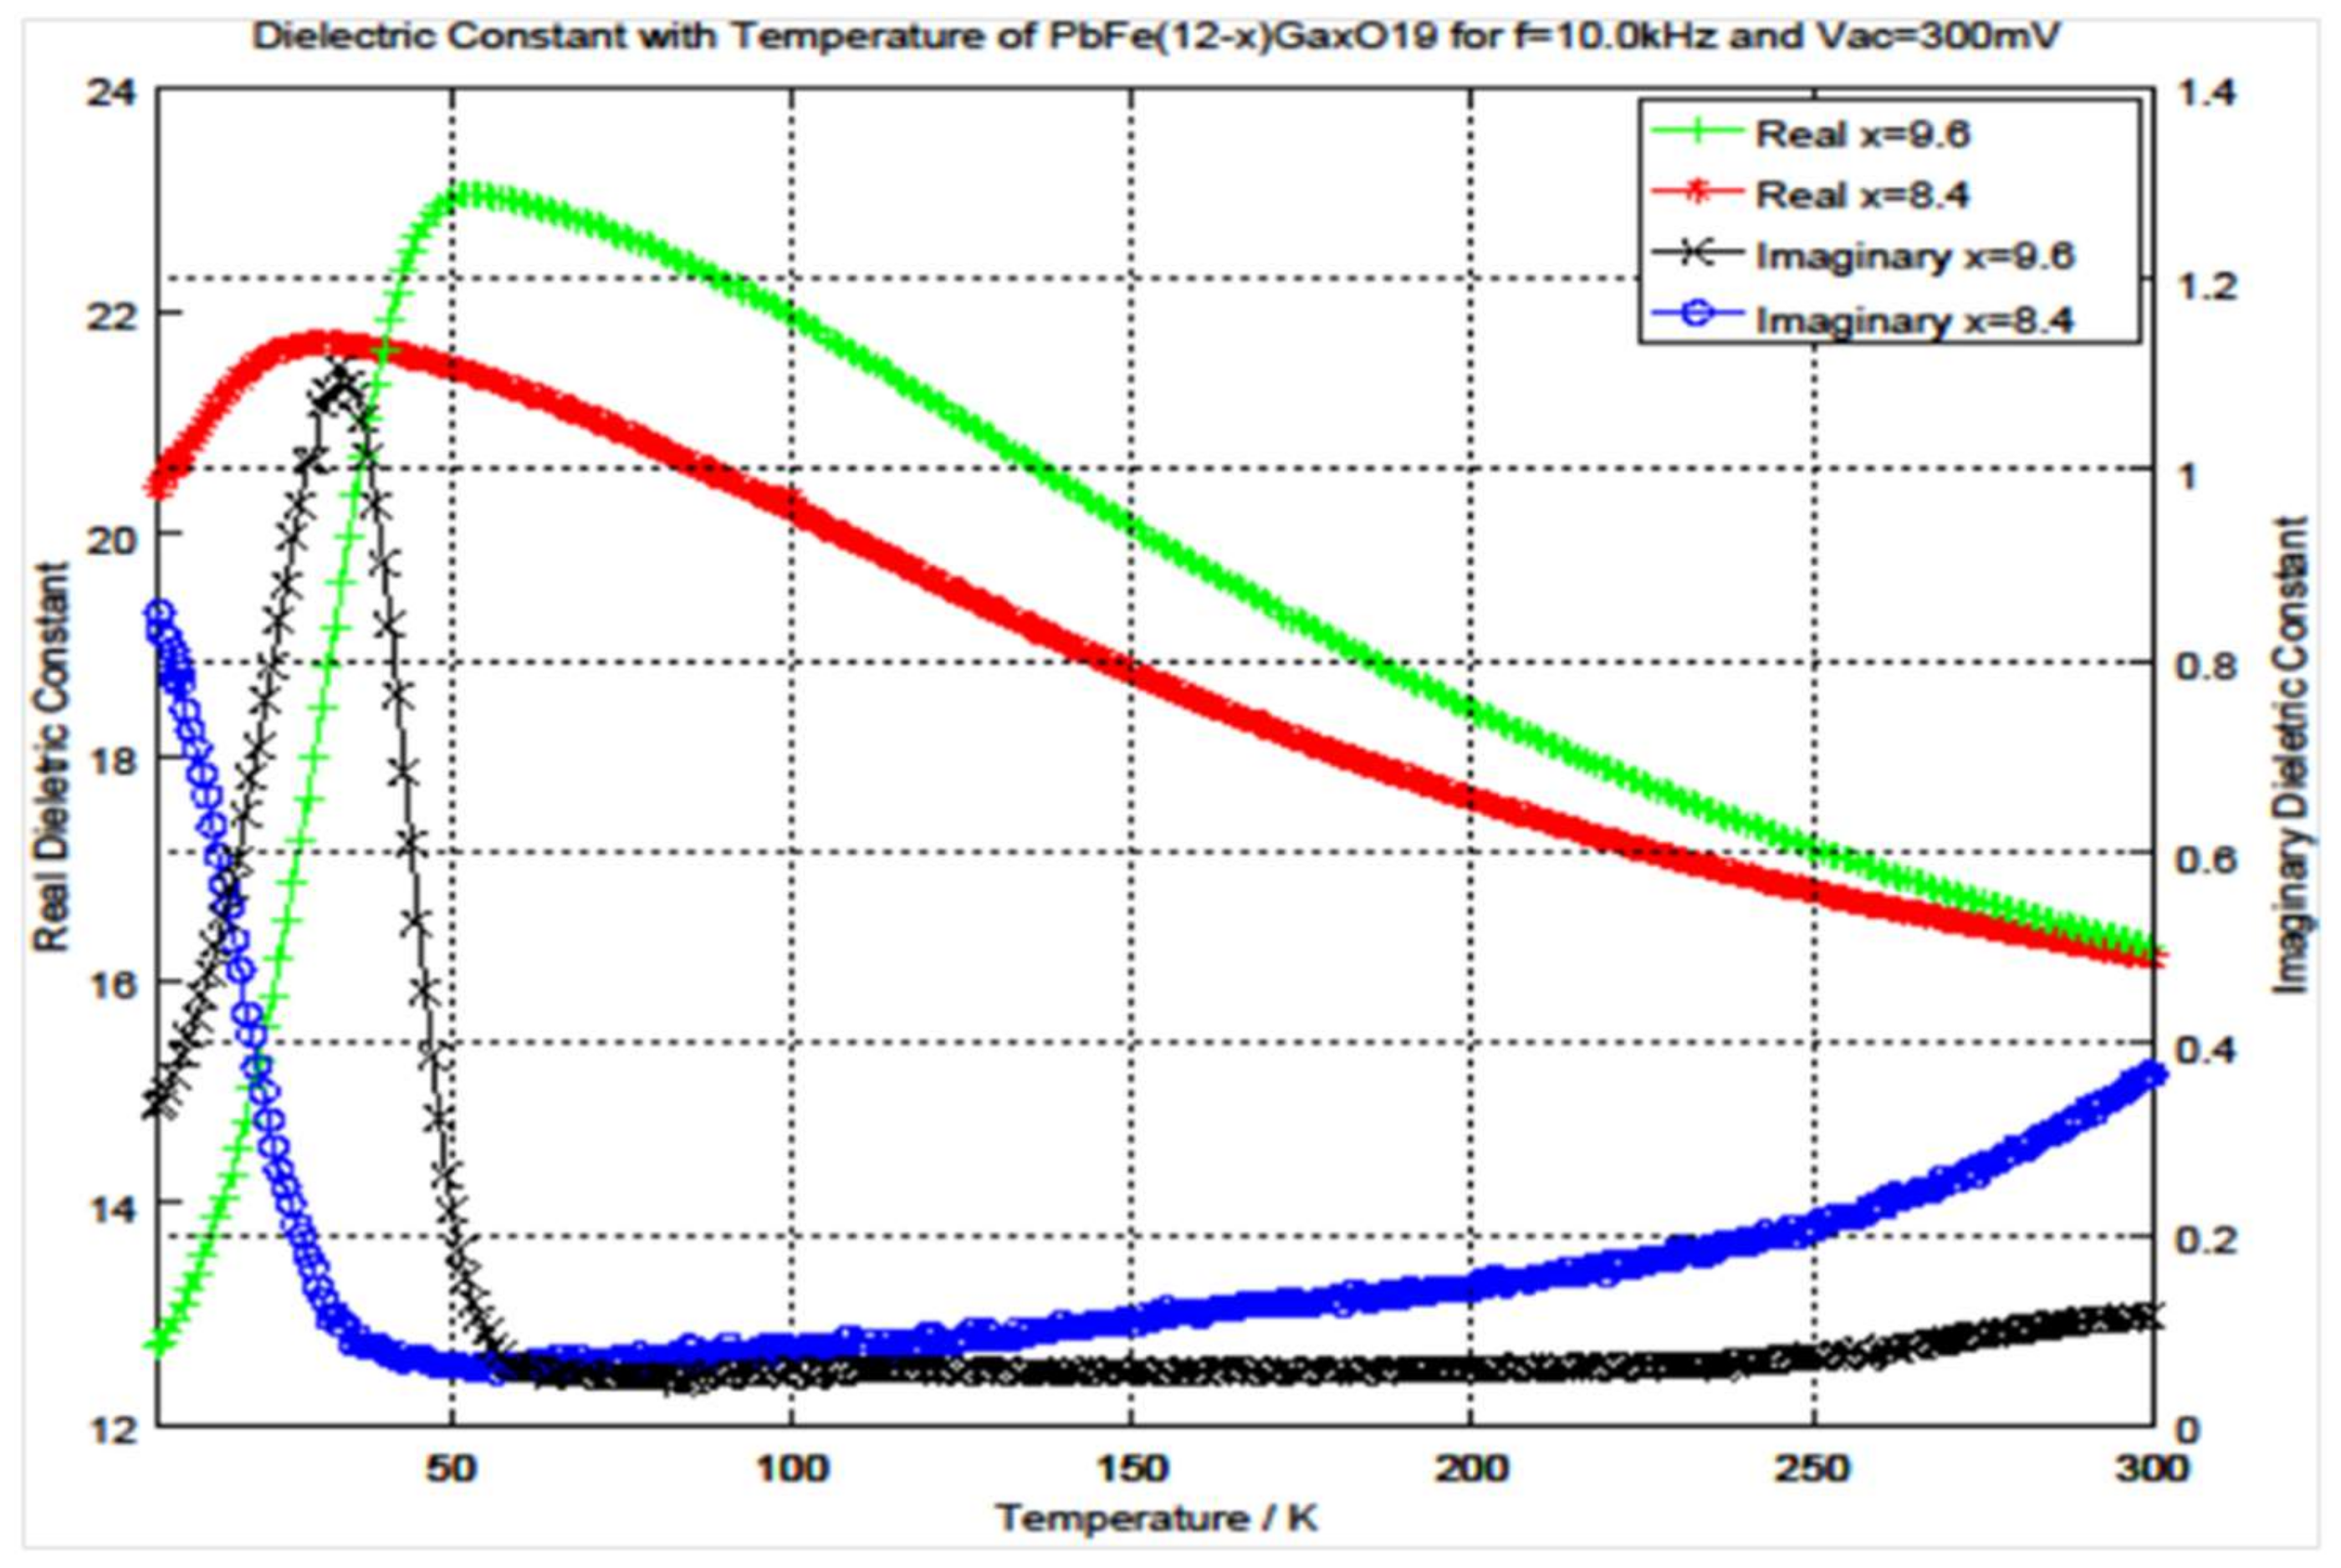
The hexaferrites come in three families, illustrated in Figure 1 [15]. Our interest has been in the M-type, particularly BaFe12O19, SrFe12O19, and PbFe12O19. Its dielectric constants versus temperature for two Ga-percentages are shown in Figure 2. Additionally, in Figure 3 we see how these change with applied frequency from 100 Hz to 1 MHz. The fitted curves are Vogel-Fulcher equations.
Additionally, Figure 4 shows that the dielectric constant varies as T-cubed in such a uniaxial system.
This exponent is different from the quadratic dependence observed in pseudocubic QCPs, seen in, for example, SrTiO3 or KTaO3) and was predicted by Khmelnitskii in 1970 [18]. It follows from the general equation
in which χ is the isothermal electric susceptibility and Ω is the phonon frequency, and the phonon dispersion with wave vector q is assumed to be
The key result is γ = (d + z − 2)/z, in which z = 1 is the exponent describing how Ωq behaves (linear acoustic phonon) for small q in ferroelectrics, and hence the behaviour of 1/χ is cubic (d = 4 for uniaxial ferroelectrics). By comparison, most magnetic insulators have the magnon frequency vary as q2 for small q, and hence z = 2.
3.2. Newest QCP Relaxor Work: K3Li2Ta5O15 (“KLT”) and Lead Pyrochlore.
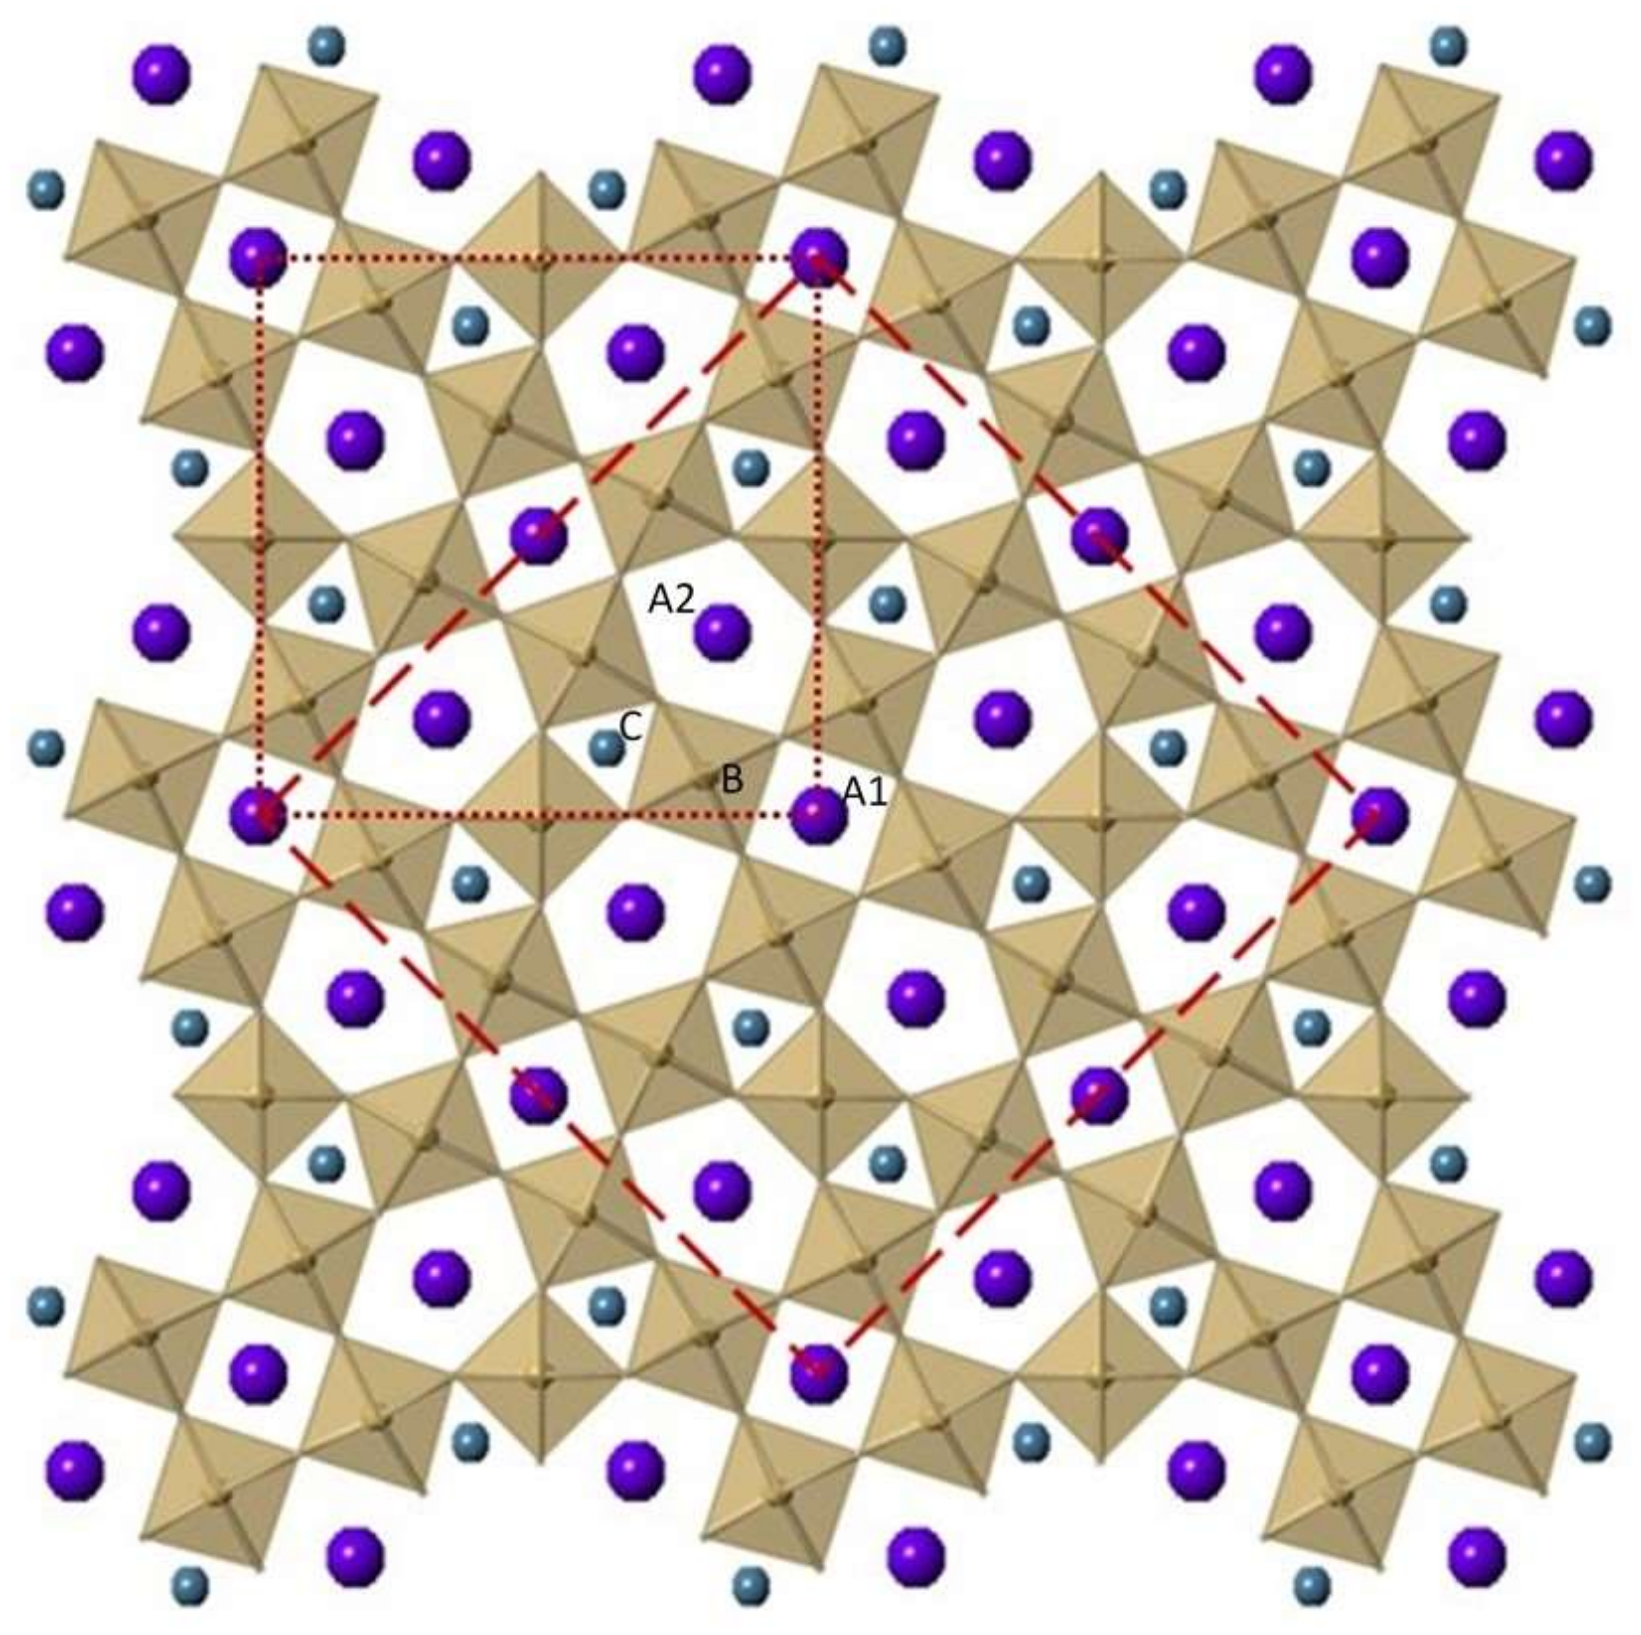
Potassium lithium tantalate is a so-called “stuffed” tungsten bronze, which means that its small triangular channels (c-sites) are occupied by Li (Figure 5). The figure illustrates both the tetragonal and orthorhombic primitive cells proposed and the triangular Li sites. KLT and its isomorphic niobate are the only tungsten bronzes in which this channel is occupied. It has a reported tetragonal-orthorhombic ferroelectric phase transition at Tc = 7 K, but this transition is not always manifest in different kinds of experiments. We show in the graphical abstract here that this is because the transition is that of a relaxor QCP. Hence, if measurements are made via resonant ultrasonic spectroscopy or dielectric studies in the 300 kHz regime, a phase transition is measured (up to T = 40 K), whereas if a dc technique is used, such as specific heat, no transition is observed in this temperature range [13].
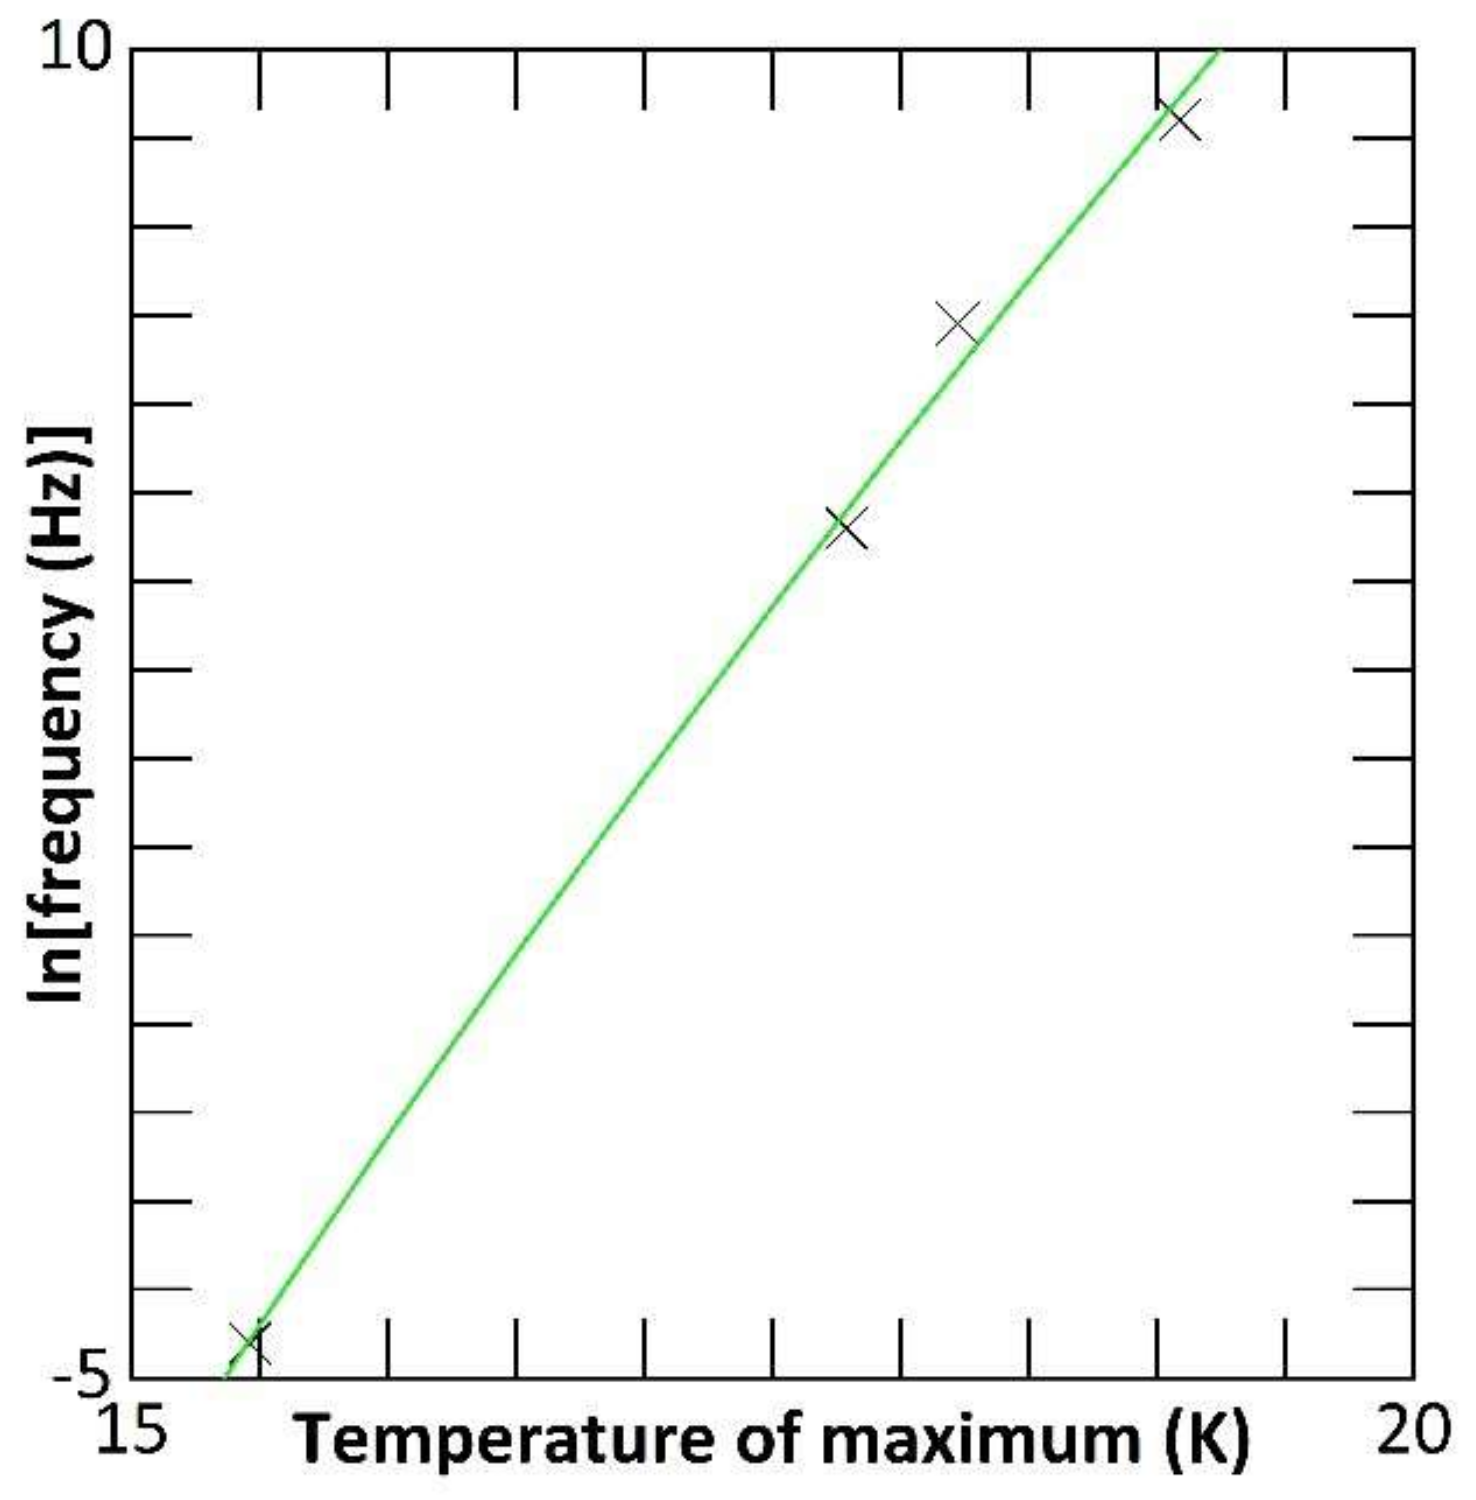
The situation in lead pyrochlore is rather more confusing. Many years ago a presumably ferroelectric transition was reported at Tc = 15.4 K [19,20]. However, subsequent work showed that this temperature marked a relaxation onset [21]. This was before the era of relaxor ferroelectrics, and so these authors assumed that this is not a structural phase transition but merely the relaxation of a point defect. Indeed, the polarization measured is small (nC/cm2 rather than μC/cm2). However, a hint that the anomaly is relaxor ferroelectricity comes from the rarely cited high pressure work of Jayaraman et al. [22], who found a phase transition at modest pressure and ambient temperature in a rare lead pyrochlore single crystal.
4. Discussion
Absence of Thermal Diffusion of Domain Walls in QCPs: Absence of Turing Patterns in Ferroelectric Domains?
Having presented the basic ideas about QCP ferroelectrics and, especially, QCP relaxors, let us turn to predictions of very specific differences in relaxor QCPs compared with other ferroelectric QCPs. The case we shall consider is nonlinear domain processes, including folding, wrinkling, creasing, and period doubling, a subject of current interest [23,24,25]. In particular, we show below that these instabilities arise from diffusion of domain walls, but Tokura’s group has recently established that there is no thermal diffusion of domain walls for QCPs systems near T = 0 (only tunnelling, with wall tunnelling mass ca. 1 m (proton) = ca. 2000 m (e) [26,27]).
There are reasons to believe that the domain dynamics of ferroelectric crystals may be very different for QCP systems. This is because many interesting domain properties, such as wrinkling, folding, and period doubling, rely of diffusion, whereas domain wall motion at very low temperatures arises instead from quantum tunneling, and thermally activated creep plays a negligible role.
Therefore, in the section below we briefly review these domain instabilities and comment on how they might differ or be absent in QCPs. We hope that this will stimulate researchers to look for such domain patterns in QCP ferroelectrics at cryogenic temperatures, which thus far have not been reported.
We show explicitly that the domain patterns in ferroelastic/ferroelectric crystals are those predicted by the Turing pattern model, with four basic structures: Chevron boundaries (with or without domain width change), dislocation zipping and unzipping (with velocities measured), bull’s eye circular patterns, and spiral patterns. These all can be described by reaction diffusion equations, but the terms required in a Landau-Ginzburg approach differ, with, for example, complex coefficients required for spiral patterns and real coefficients for chevron patterns. There is a close analogy between spiral domains and Zhabotinskii-Belousov patterns, and between bull’s eye circular patterns and Rayleigh-Bernard instabilities or Taylor-Couette instabilities with rotating inner cylinders, but not with each other. The evolution of these patterns with increasing strain (e.g., wrinkling/folding or folding/period-doubling) is well described by the model of Wang and Zhao, but the question of whether there is a separate rippling-to-wrinkling transition remains moot. Because these processes require diffusion, they should be absent (or qualitatively different) near Quantum Critical points.
Alan Turing is perhaps best known for his work in solving the Enigma code in the 1940s and for his pioneering work on artificial intelligence, but he was also a superb theoretical biologist. Among his important contributions was the development of reaction-diffusion models later used to explain patterning in chemical reactions, including the famous Zhabotinskii-Belousov reaction [28].
The idea that diffusion would destabilize a uniform distribution of atoms or molecules in nature is somewhat paradoxical and counter-intuitive, because diffusion usually stabilizes things. However, simple reaction-diffusion equations predict many observed patterns in chemistry and biology.
Starting with an equation of form
for two components
du/dt = f(u) + D ∇2u
du1/dt = f1(u1,u2) + D1 ∇2u1
du2/dt = f2(u1,u2) + D2 ∇2u2
It can be shown that there is a threshold for a static pattern instability for a certain ratio D1 > D2. Here, one component u1 is termed an activator and the other an inhibitor. In fact, the static pattern predicted by this approach, termed type I-s (s for static) [29,30], is rarely observed, because most chemical reactions involve diffusion coefficients D1 and D2 that are close in magnitude; however, specific reagents have been studied in a successful attempt to produce such patterns.
Although these static patterns are not common in nature, the non-static oscillatory patterns are. These are often labelled as type III-o (o for oscillatory) in the Turing scheme, which separates instabilities into those that are static in both space and time (s), those that are static in space but oscillate in time (I-o), and those that oscillate in both space and time (III-o). The spiral domain instabilities, like the Zhabotinskii-Belousov instability, oscillate in both space and time.
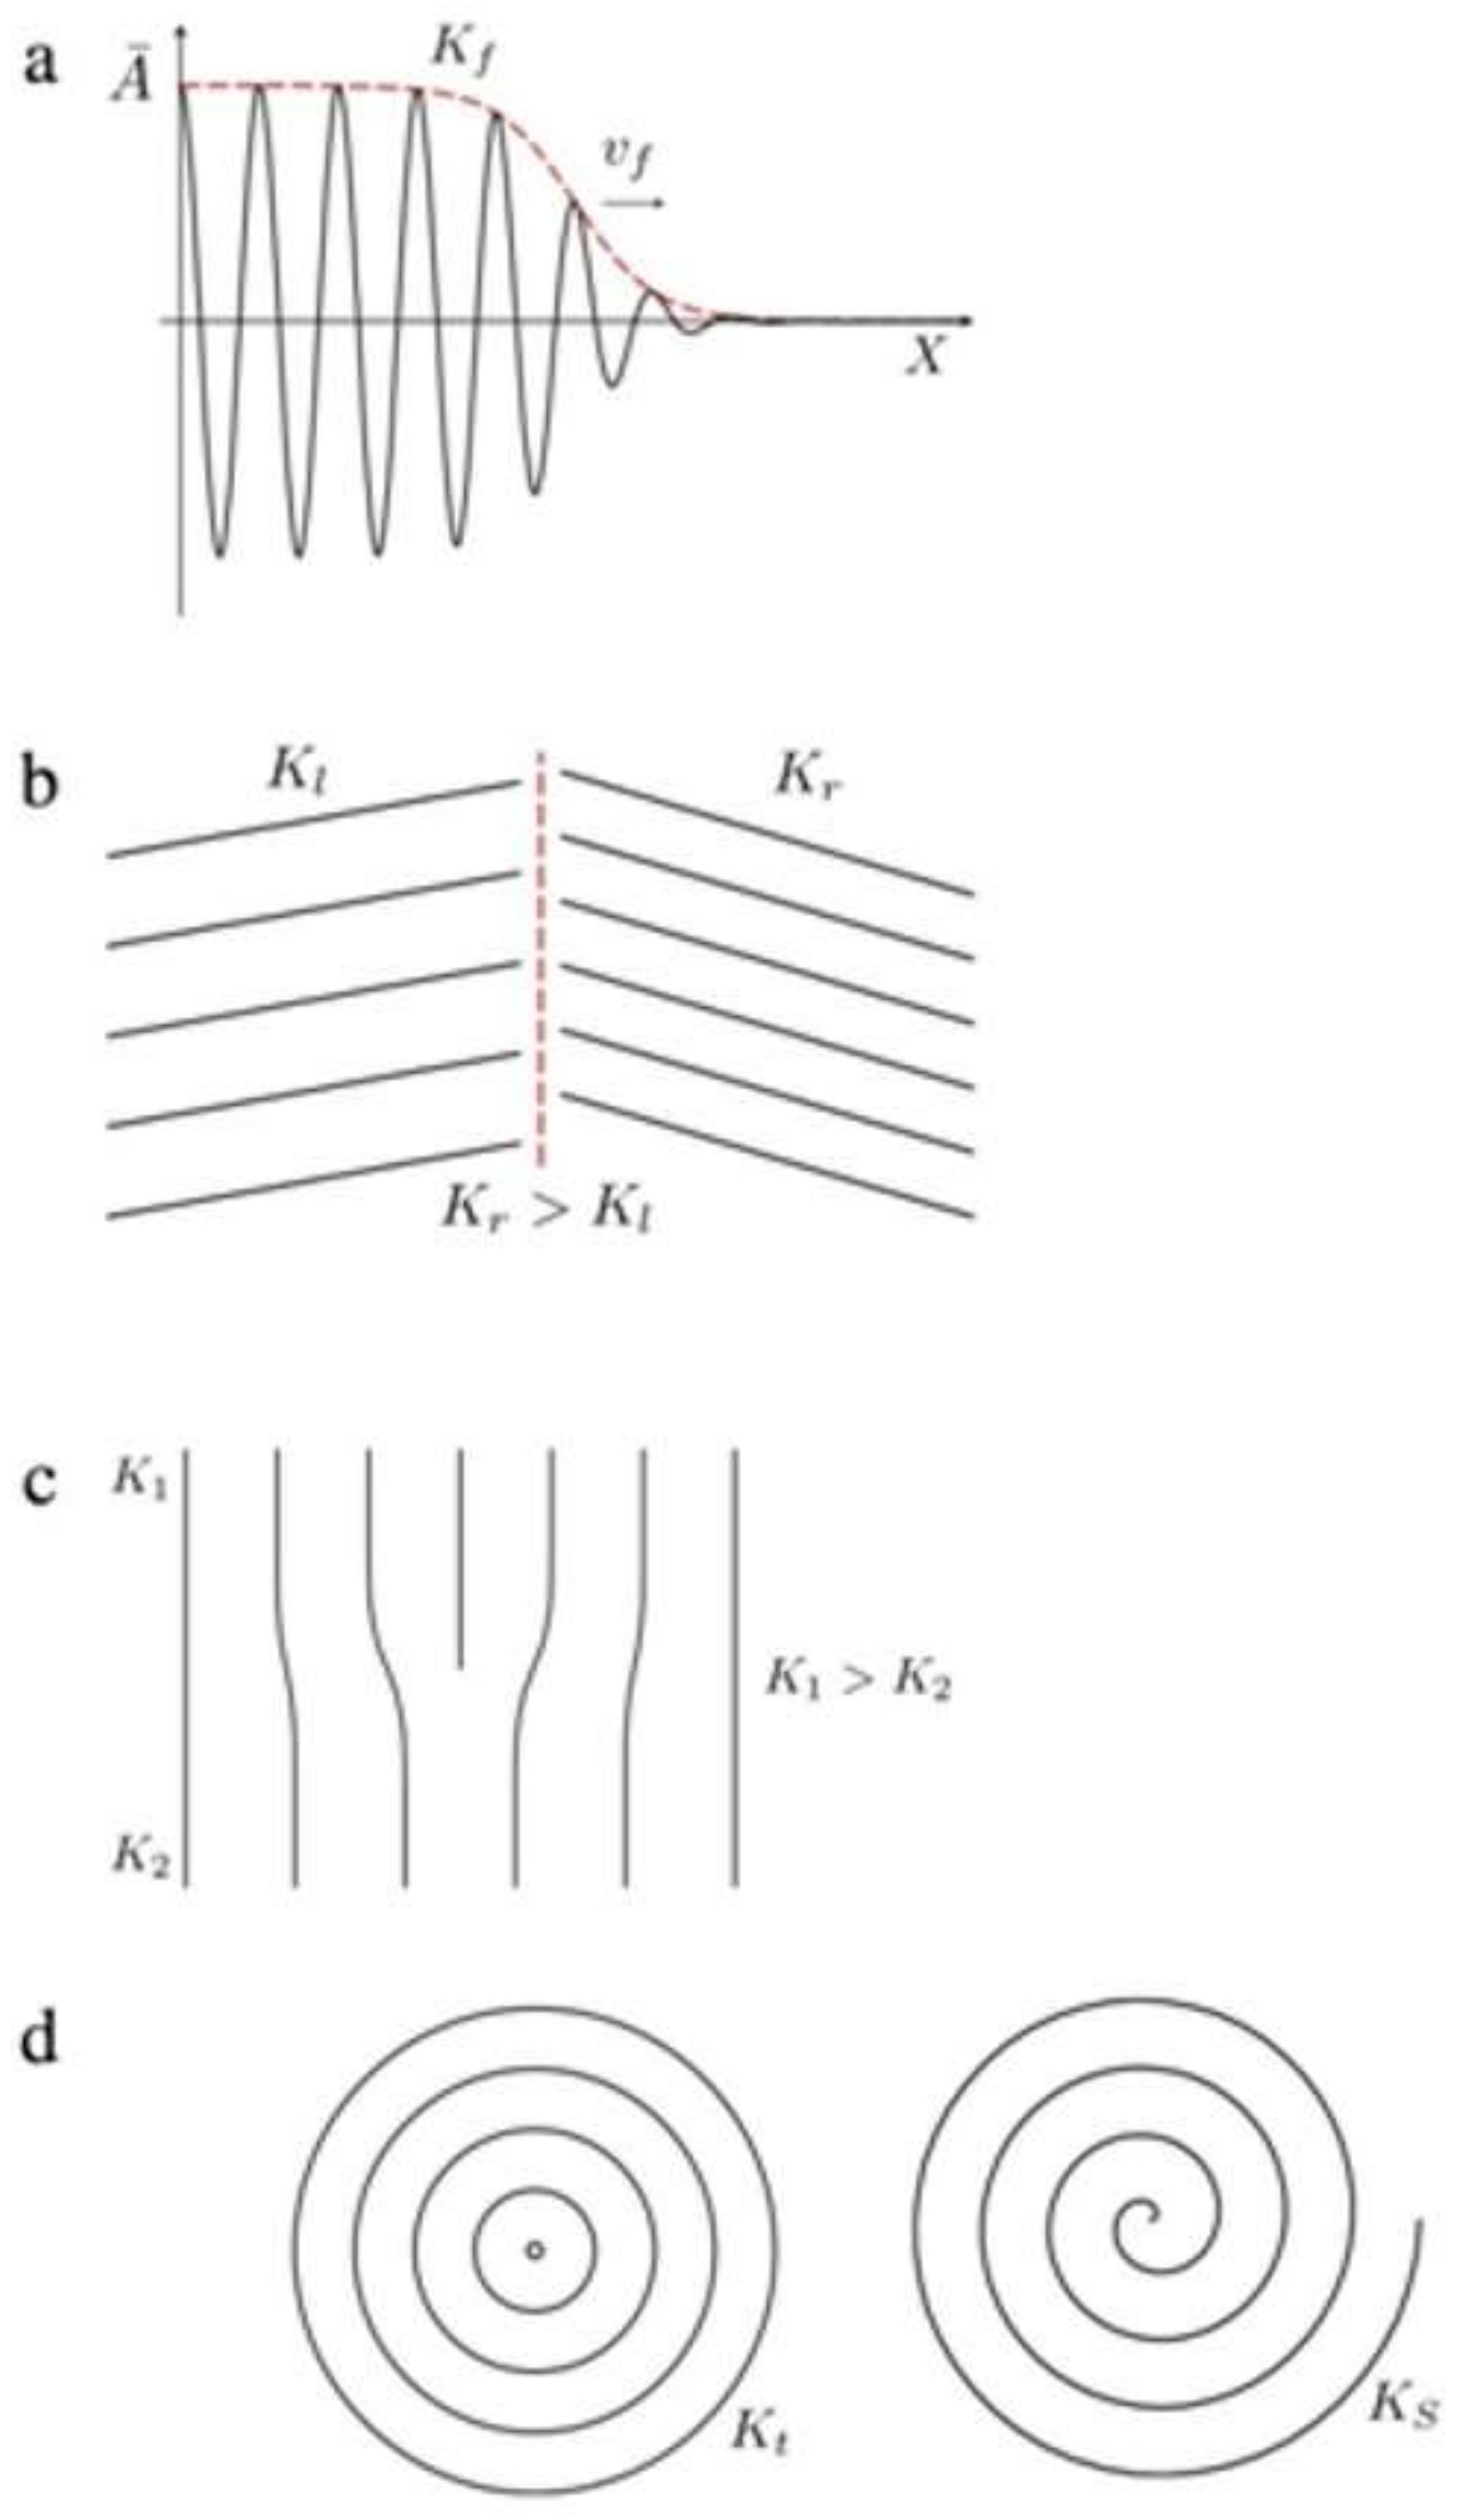
There are a total of four patterns predicted for domain instabilities (shown below from Hohenbrg and Krekhov, Figure 7,), and we have recently illustrated all four experimentally [31]. Note that the chevron pattern (next to top panel) can maintain domain width on both sides of the reflection plane or change width; this width change can be an integer ratio (doubling, tripling…), but it can be a non-integer ratio also, resulting in incommensurate domain structures. Of these four patterns, the chevron and dislocation patters are described by Hohenberg as arising from Turing static instabilities, meaning static in both space and time; however, recent unpublished work by A. Hershovitz and Y. Ivry measure the zipping and unzipping velocity of the dislocation mechanism, so in that sense they are not truly static.
The bull’s eye pattern (Figure 7d and Figure 8) is analogous to the Taylor-Couette instability with rotating central cylinder [32], and the spiral pattern is related to the Zhabotinskii-Belousov instability [33,34], but oddly enough, the bull’s eye and spiral patterns are not related to each other. These two instabilities are described as non-static by Hohenberg et al. and are termed oscillatory in the Turing descriptions (oscillatory-I and oscillatory-III, respectively); the bull’s eye is static in space and oscillatory in time, and the spiral is oscillatory in both space and time. In the context of quantum critical systems, the latter two are therefore more dependent upon diffusion and hence less likely than chevrons or dislocation twinning dislocations to arise at cryogenic temperatures. A rather complete description of circular instabilities, which resemble first-order Bessel functions and patterns of vibration on a drum head, has been given by Baudry et al. [35,36,37].
These circular and spiral patterns do evolve with time initially after they are formed, Figure 9 and Figure 10. Figure 9 below shows in-plane patterns modelled from such data [38]. There is a Yin-and-Yan geometry emerging. As time evolves, this pattern rotates clockwise or counterclockwise.
Note that the oscillatory instabilities can also occur in the context of faceting of ferroelectric nano-crystals [40,41,42]. These references illustrate some data for a PZT disc ca. 10 nm in diameter in a TEM beam, monitored during beam exposure time of a few seconds. Note the domain wall realignment and the oscillatory faceting and de-faceting. The latter is modelled in Ref. [42,43,44]. Unlike the thermally activated creep processes, these faceting rearrangements are electric-field driven and hence are expected to persist in QCP cryogenic systems. The measured velocities are typically 1 nm/s.
This faceting can be more complex, with various high-symmetry polygonal structures observed in ferroelectrics of crystallographic low (C2) symmetry, as shown in Figure 11; Lukyanchuk et al. give a complete model for this phenomenon [45].
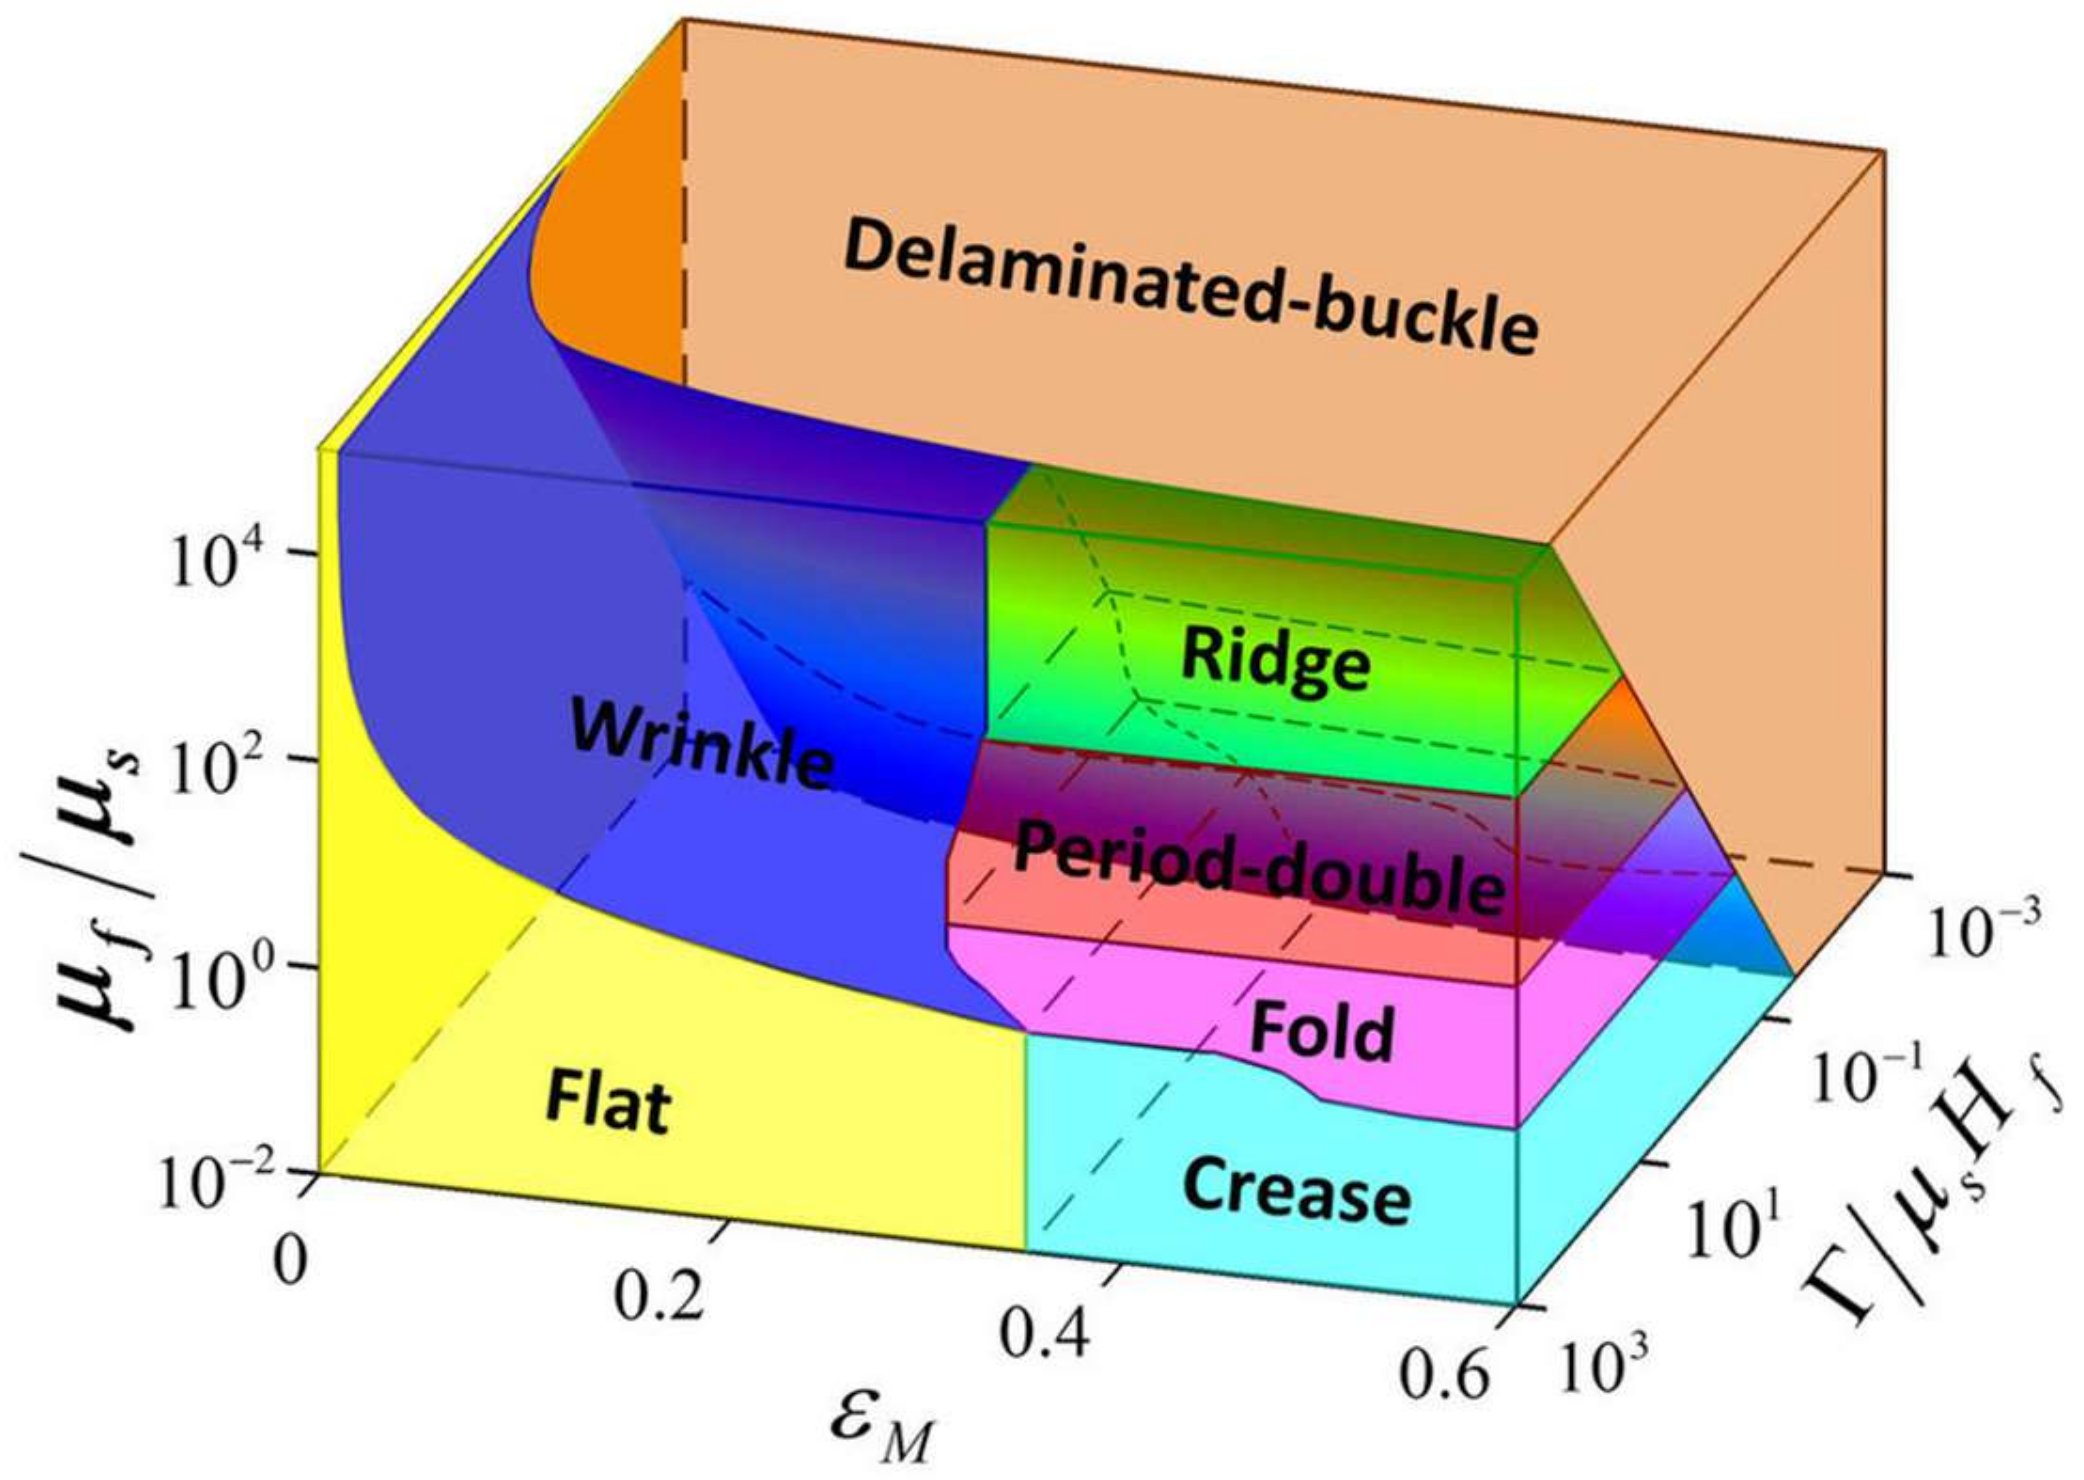
The following question remains unanswered: Although most investigators agree that there is a well-defined wrinkling-to-folding phase transition (Wang and Zhao [46], Figure 12; Metaxas et al. [47]), some recent researchers have inferred the existence of a preliminary precursor ripple-to-wrinkle transition [48]—How do these nonlinear phenomena behave at cryogenic temperatures in QCP ferroelectrics, where the domain walls move slowly via quantum mechanical tunneling and not thermally activated diffusion?
In the previous study, we illustrated such wrinkles (first found by Gruverman [49,50] in lead germanate domain walls in his 1990 thesis (Univ. Ekaterinburg)), measured their velocities, and related them to capillary waves [44,45].
The extension of the present work is as follows.
The present interest is in extending this work from single nonlinear domain instabilities (Figure 7) to arrays of vortex structures [39,40,51]. In addition, the existing theory is limited to two-dimensional structures, and it would be of interest to extend the modelling, for example, from flat [2D] cycloids to low-aspect ratio [3D] helices [52,53]. Note that helices have handedness (left-handed or right-handed), whereas cycloids with clockwise phase shifts of Θ degrees are topologically equivalent to counter-clockwise shifts of 360-Θ degrees. Very recently, the non-planar helical characteristics of vortex arrays have been demonstrated; hence, they are not cycloids [52].
5. Conclusions
Ferroelectric crystals with Curie temperatures very near T = 0 are fascinating new examples of quantum crystals. Their domains move via quantum tunnelling rather than thermally activated creep; therefore, they lack the diffusivity requisite for Turing-type instabilities (folding, period doubling, wrinkling…). They also have a wider range of critical upper and lower dimensionalities than magnets, arising from the fact that their unstable Goldstone bosons are acoustic modes with energies linear in wave vector q, in contrast to magnons and their quadratic q-dependence. In the special case of relaxor ferroelectric QCPs, the relaxor characteristic arises from a glassy viscosity and give researchers an extra dimension over which to probe dynamics, most easily in the case of isothermal electric susceptibility (dielectric constant ε(T,f)), whose peak can be tuned exactly through T = 0 in the 10 Hz to 1 MHz range of applied ac probe voltages.
Now, let us remind ourselves of Tokura’s argument that ferroelectric QCPs have no creep and no classical diffusion. This would appear to rule out domain instabilities such as wrinkling and folding in ferroelectric QCPs, based upon the models of Turing and, later, by Hohenberg et al. However, this is, in this respect, why relaxor QCPs are special: their ground states are glassy and viscous and hence certainly permit some diffusion. The presence of a glassy ground state at T = 0 is remarkable in many ways, and certainly relaxors are not in true thermal equilibrium.
An obvious extension is to magnetoelectric QCPs, and some work on the BaFe12O19 hexaferrite family has already been reported [1,2,3,4,5,6,7,8,9,10,54,55,56,57,58,59,60,61]. This material is very popular, because it is the usual material in magnetic-stripe credit cards, with >$1 billion/year in sales as a magnetic compound [60,61].
An alternative approach to the general problem of domain wall instabilities would be to look for the analogues of other known variants in such things as Taylor-Couette flow, which has at least five known instabilities [62,63], not just the one (“bull’s eye”) mentioned here (one of these is a toroid, which is similar to that described in Figure 8a and Figure 10 above).
Acknowledgments
Work supported by EPSRC grant EP/P024637/1.
Conflicts of Interest
The author declares no conflict of interest.
References
- Rowley, S.E.; Chair, Y.-S.; Shen, S.-P.; Sun, Y.; Jones, A.T.; Watts, B.E.; Scott, J.F. Uniaxial ferroelectric quantum criticality in multiferroic hexaferrites BaFe12O19 and SrFe12O19. Sci. Rep. 2016, 6, 25724. [Google Scholar] [CrossRef] [PubMed] [Green Version]
- Hilczer, A.; Bartlomiej, A.; Markiewicz, E.; Kowalska, K.; Pietraszko, A. Effect of thermal treatment on magnetic and dielectric response of SrM hexaferrites obtained by hydrothermal synthesis. Phase Trans. 2014, 87, 938–952. [Google Scholar] [CrossRef]
- Brixner, L.H. Preparation of the ferrites BaFe12O19 and SrFe12O19 in transparent form. J. Am. Chem. Soc. 1959, 81, 3841–3843. [Google Scholar] [CrossRef]
- Townes, W.D.; Fang, J.H.; Perrotta, A.J. Crystal structure and refinement of ferrimagnetic barium ferrite BaFe12O19. Z. Kristallogr. Kristallgeom. Kristallphys. 1967, 125, 437–445. [Google Scholar] [CrossRef]
- Ganapathi, L.; Gopalakrishnan, J.; Rao, C.N. Barium hexaferrite (M-phase) exhibiting superstructure. Mater. Res. Bull. 1984, 19, 669–672. [Google Scholar] [CrossRef]
- Hien, N.T.M.N.T.; Han, K.; Chen, X.-B.; Sur, J.C.; Yang, I.S. Raman studies of spin-phonon coupling in hexagonal BaFe12O19, A Raman Study of the Origin of Oxygen Defects in Hexagonal Manganite Thin Films. Chin. Phys. Lett. 2012, 29, 126103. [Google Scholar]
- Chen, X.B.; Hien, N.T.M.; Han, K.; Sur, J.C.; Sung, N.H.; Cho, B.K.; Yang, I.S. Raman studies of spin-phonon coupling in hexagonal BaFe12O19. J. Appl. Phys. 2013, 114, 013912. [Google Scholar] [CrossRef]
- Muller, J.; Collomb, A. A new representation of the bipyramidal site in the SrFe12O19 M-type hexagonal ferrite between 4.6 K and 295 K. J. Magn. Magn. Mater. 1992, 103, 194–203. [Google Scholar] [CrossRef]
- Fontcuberta, J.; Obradors, X. Dynamics of the bipyramidal ions in SrFe12O19 studied by Mossbauer-spectroscopy. J. Phys. C 1988, 21, 2335–2345. [Google Scholar] [CrossRef]
- Obradors, X.; Collomb, A.; Permet, M. X-ray-analysis of the structural and dynamic properties of BaFe12O19 hexagonal ferrite at room-temperature. J. Solid State Chem. 1985, 56, 171–181. [Google Scholar] [CrossRef]
- Lashley, J.C.; Munns, J.H.D.J.H.; Echizen, M.; Ali, M.N.; Rowley, S.E.; Scott, J.F. Phase transitions in the brominated ferroelectric tris-sarcosine calcium chloride (TSCC). Adv. Mater. 2014, 26, 3860–3866. [Google Scholar] [CrossRef] [PubMed]
- Chandra, P.; Lonzarich, G.G.; Rowley, S.E.; Scott, J.F. Prospects and Applications near Ferroelectric Quantum Phase Transitions. Rep. Prog. Phys. 2017, 80, 11250. [Google Scholar] [CrossRef] [PubMed]
- Smith, R.M.; Gardner, J.; Morrison, F.D.; Rowley, S.E.; Ferraz, C.; Carpenter, M.A.; Chen, J.; Hodkinson, J.; Dutton, S.E.; Scott, J.F. Quantum Critical Points in Ferroelectric Relaxors: Stuffed Tungsten Bronze K3Li2Ta5O15 and Lead Pyrochlore (Pb2Nb2O7). arXiv, 2018; arXiv:1802.09827. Available online: https://arxiv.org/abs/1802.09827(accessed on 17 April 2018).
- Scott, J.F. Ferroelectrics go bananas. J. Cond. Mater. 2008, 20, 021001. [Google Scholar] [CrossRef]
- Kitagawa, Y.; Hiraoka, Y.; Honda, T.; Ishikura, T.; Nakamura, H.; Kimura, T. Low-field magnetoelectric effect at room temperature. Nat. Mater. 2010, 9, 797–802. [Google Scholar] [CrossRef] [PubMed]
- Chien, C.L.; Liou, S.H.; Xiao, G.; Gatzke, M.A. Magnetic Percolation in New Crystalline FCC Fe-Cu Alloys. MRS Online Proc. 1986, 80, 395–397. [Google Scholar] [CrossRef]
- Lorenz, C.D.; May, R.; Ziff, R.M. Similarity of Percolation Thresholds on the HCP and FCC Lattice. J. Stat. Phys. 2000, 98, 961–970. [Google Scholar] [CrossRef]
- Khmelnitskii, D.E.; Schneerson, V.L. Displacive-type phase transition in crystals at low temperatures. Fiz. Tverd. Tela 1971, 13, 832–841. [Google Scholar]
- Hulm, J.K. Low-Temperature Dielectric Properties of Cadmium and Lead Niobates. Phys. Rev. 1953, 92, 504. [Google Scholar] [CrossRef]
- Shirane, G.; Pepinsky, P.R. Dielectric Properties and Phase Transitions of Cd2Nb2O7 and Pb2Nb2O7. Phys. Rev. 1953, 92, 504. [Google Scholar] [CrossRef]
- Siegwarth, J.D.; Lawless, W.M.; Morrow, J.D. Dielectric and thermal properties of Pb2Nb2O7 at low temperature. J. Appl. Phys. 1976, 47, 3789–3792. [Google Scholar] [CrossRef]
- Jayaraman, A.; Kourouklis, G.A.; Cooper, A.S.; Espinosa, G.P. High-pressure Raman and optical absorption studies on lead pyroniobate (Pb2Nb2O7) and pressure-induced phase transitions. J. Phys. Chem. 1990, 94, 1091–1094. [Google Scholar] [CrossRef]
- Scott, J.F.; Evans, D.M.; Katiyar, R.S.; McQuaid, R.G.P.; Gregg, J.M. Nonequilibrium ferroelectric-ferroelastic 10 nm nanodomains: wrinkles, period-doubling, and power-law relaxation. J. Phys. Condens. Matter. 2017, 29, 304001. [Google Scholar] [CrossRef] [PubMed]
- Kieth, J.B.; Hatch, D.M. Mesoscopic domain average engineering simulations of ferroelectric perovskites compared with multidomain group theoretical predictions. J. Appl. Phys. 2006, 100, 033526. [Google Scholar] [CrossRef]
- Fousek, J.; Litvin, D.B.; Cross, L.E. Domain geometry engineering and domain average engineering of ferroics. J. Phys. Cond. Mater. 2000, 13, L33. [Google Scholar] [CrossRef]
- Kagawa, F.; Horiuchi, S.; Tokura, Y. Quantum Phenomena Emerging Near a Ferroelectric Critical Point in a Donor–Acceptor Organic Charge-Transfer Complex. Crystals 2017, 7, 196. [Google Scholar] [CrossRef]
- Kagawa, F.; Minami, N.; Horiuchi, S.; Tokura, Y. Athermal domain-wall creep near a ferroelectric quantum critical point. Nat. Commun. 2016, 7, 10675. [Google Scholar] [CrossRef] [PubMed]
- Turing, A.M. The Chemical Basis of Morphogenesism. Philos. Trans. R. Soc. B 1952, 23, 37–72. [Google Scholar] [CrossRef]
- Cross, M.C.; Hohenberg, P.C.C. Pattern formation outside of equilibrium. Rev. Mod. Phys. 1993, 65, 851–1112. [Google Scholar] [CrossRef]
- Hohenberg, P.C.; Krechkov, A.P. An introduction to the Ginzburg–Landau theory of phase transitions and nonequilibrium patterns. Phys. Rep. 2015, 572, 1–42. [Google Scholar] [CrossRef]
- Scott, J.F.; Hershkovitz, A.; Ivry, Y.; Lu, H.D.; Gruverman, A.; Gregg, J.M. Superdomain Dynamics in Ferroelectric-Ferroelastic Films: Switching, Jamming, and Relaxation. Appl. Phys. Rev. 2017, 4, 041104. [Google Scholar] [CrossRef]
- Taylor, G.I. Stability of a viscous liquid contained between two rotating cylinders. Philos. Trans. R. Soc. 1923, 223, 289–343. [Google Scholar] [CrossRef]
- Belousov, B.P. Periodically acting reaction and its mechanism. Collect. Abstr. Radiat. Med. 1959, 147, 145. [Google Scholar]
- Zhabotinskii, A.M. The periodic process of oxidation of alanic acid solution. Biophysics 1964, 9, 306–311. [Google Scholar]
- Baudry, L.; Luk’yanchuk, I.; Scott, J.F. Polarization vortex domains induced by switching electric field in ferroelectric films with circular electrodes. Phys. Rev. B 2014, 90, 024102. [Google Scholar] [CrossRef]
- Baudry, L.; Luk’yanchuk, I.A.; Razumnaya, A. Dynamics of field-induced polarization reversal in thin strained perovskite ferroelectric films with -oriented polarization. Phys. Rev. B 2015, 91, 144110. [Google Scholar] [CrossRef]
- Baudry, L.; Lukyanchuk, I.; Vinokur, V.M. Ferroelectric symmetry-protected multibit memory cell. Sci. Rep. 2017, 7, 42196. [Google Scholar] [CrossRef] [PubMed]
- Gruverman, A.; Wu, D.; Fan, H.J.; Vrejou, I.; Alexe, M.; Harrison, R.J.; Scott, J.F. Vortex Ferroelectric Domains. J. Phys. Cond. Mater. 2008, 20, 342201. [Google Scholar] [CrossRef]
- Yadav, A.K.; Nelson, C.T.; Hsu, S.L.; Hong, Z.; Clarkson, J.D.; Schlepütz, C.M.; Damodaran, A.R.; Shafer, P.; Arenholz, E.; Dedon, L.R.; et al. Observation of Polar Vortices in Oxide Superlattices. Nature 2016, 530, 198–201. [Google Scholar] [CrossRef] [PubMed]
- Hong, Z.-J.; Damodaran, A.R.; Xue, F.; Hsu, S.-L.; Britson, J.; Yadav, A.K.; Nelson, C.T.; Wang, J.-J.; Scott, J.F.; Martin, L.W.; et al. Stabilitity of Polar Vortex Lattice in Ferroelectric Superlattices. Nano Lett. 2017, 17, 2246–2252. [Google Scholar] [CrossRef] [PubMed]
- Ahluwalia, R.; Ng, N.; Schilling, A.; McQuaid, R.; Srolovitz, D.J.; Evans, D.M.; Gregg, J.M.; Scott, J.F. Manipulating Ferroelectric Domains in Nano-Structures under Electron Beams. Phys. Rev. Lett. 2013, 111, 165702. [Google Scholar] [CrossRef] [PubMed]
- Scott, J.F.; Kumar, A. Faceting oscillations in nano-ferroelectrics. Appl. Phys. Lett. 2014, 105, 052902. [Google Scholar] [CrossRef]
- Ng, N.; Ahluwalia, R.; Kumar, A.; Srolovitz, D.J.; Chandra, P.; Scott, J.F. Electron-beam driven relaxation oscillations in ferroelectric nanodisks. Appl. Phys. Lett. 2015, 107, 152902. [Google Scholar] [CrossRef] [Green Version]
- Naumov, I.; Fu, X. Vortex-to-Polarization Phase Transformation Path in Ferroelectric Pb(ZrTi)O3 Nanoparticles. Phys. Rev. Lett. 2007, 98, 077603. [Google Scholar] [CrossRef] [PubMed]
- Lukyanchuk, I.; Sharma, P.; Nakajima, T.; Okamura, S.; Scott, J.F.; Gruverman, A. High-Symmetry Polarization Domains in Low-Symmetry Ferroelectrics. Nano Lett. 2014, 14, 6931–6935. [Google Scholar] [CrossRef] [PubMed]
- Wang, Q.; Zhao, X. A three-dimensional phase diagram of growth-induced surface instabilities. Sci. Rep. 2015, 5, 8887. [Google Scholar] [CrossRef] [PubMed]
- Metaxas, P.J.; Jamet, J.P.; Mougin, A.; Cormier, M.; Ferre, J.; Baltz, V.; Rodmacq, B.; Dieny, B.; Stamps, R.L. Creep and Flow Regimes of Magnetic Domain-Wall Motion in Ultrathin Pt/Co/Pt Films with Perpendicular Anisotropy. Phys. Rev. Lett. 2008, 99, 217208. [Google Scholar] [CrossRef] [PubMed]
- Deng, S.; Berry, V. Wrinkled, rippled and crumpled graphene: An overview of formation mechanism, electronic properties, and applications. Mater. Today 2016, 19, 197–212. [Google Scholar] [CrossRef]
- Gruverman, A.; Dawber, M.; Gruverman, A.; Scott, J.F. Skyrmion model of nano-domain nucleation in ferroelectrics and ferromagnets. J. Phys. Cond. Mater. 2006, 18, L71–L79. [Google Scholar]
- Scott, J.F. Domain wall kinetics: Nano-domain nucleation in lead germanate and Tilley-Zeks theory for PVDF. Ferroelectrics 2003, 91, 205–215. [Google Scholar] [CrossRef]
- Shafer, P.; García-Fernández, P.; Aguado-Puente, P.; Damodaran, A.R.; Yadav, A.K.; Nelson, C.T.; Hsu, S.-L.; Wojdeł, J.C.; Íñiguez, J.; Martin, L.W.; et al. Emergent chirality in the electric polarization texture of titanate superlattices. Proc. Natl. Acad. Sci. USA 2018, 115, 915–920. [Google Scholar] [CrossRef] [PubMed]
- Shen, S.P.; Wu, J.-C.; Song, J.-D.; Sun, X.-F.; Yang, Y.-F.; Chai, Y.-S.; Shang, D.-S.; Wang, S.-G.; Scott, J.F.; Sun, Y. Quantum electric-dipole liquid on a triangular lattice. Nat. Commun. 2016, 7, 10569. [Google Scholar] [CrossRef] [PubMed] [Green Version]
- Tang, Y.L.; Zhu, Y.L.; Ma, X.L.; Borisevich, A.Y.; Morozovska, A.N.; Eliseev, E.A.; Wang, W.Y.; Wang, Y.J.; Xu, Y.B.; Zhang, Z.D.; et al. Observation of a periodic array of flux-closure quadrants in strained ferroelectric PbTiO3 films. Science 2015, 348, 547–551. [Google Scholar] [CrossRef] [PubMed]
- Cao, H.B.; Zhao, Z.Y.; Lee, M.; Choi, E.S.; McGuire, M.A.; Sales, B.C.; Zhou, H.D.; Yan, J.-Q.; Mandrus, D.G. High pressure floating zone growth and structural properties of ferrimagnetic quantum paraelectric BaFe12O19. APL Mater. 2015, 3, 062512. [Google Scholar] [CrossRef]
- Albanese, G.; Watts, B.E.; Leccabue, F.; Castañón, D. Mossbauer and magnetic studies of PbFe12−xCrxO19 hexaferrites. J. Magn. Magn. Mater. 1998, 184, 337–343. [Google Scholar] [CrossRef]
- Diaz-Castanan, S.; Sánchez, L.J.L.; Estevez-Rams, E.; Leccabue, F.; Watts, B.E. Magnetic structural properties of PbFe12O19 hexaferrite powders prepared by decomposition of hydroxide-carbonate and metal-organic precipitates. J. Magn. Magn. Mater. 1998, 185, 194–198. [Google Scholar] [CrossRef]
- Diaz, S.; Sánchez, J.L.; Watts, B.E.; Leccabue, F.; Panizzieri, R. Magnetic properties of polycrystalline BaFe12O19 thin films prepared from metallorganic decomposition on ZrO2-coated Si substrates. J. Magn. Magn. Mater. 1995, 151, 173–177. [Google Scholar] [CrossRef]
- Mikheykin, S.; Zhukova, E.S.; Torgashev, V.I.; Razumnaya, A.G.; Yuzyuk, Y.I.; Gorshunov, B.P.; Prokhorov, A.S.; Sashin, A.E.; Bush, A.A.; Dressel, M. Lattice anharmonicity and polar soft mode in ferrimagnetic M-type hexaferrite BaFe12O19 single crystal. Eur. J. Phys. B 2014, 87, 232. [Google Scholar] [CrossRef]
- Fang, C.M.; Kools, F.; Metselaar, E.; de With, G.; de Groot, R.A. Magnetic and electronic properties of strontium hexaferrite SrFe12O19 from first-principles calculations. J. Phys. Cond. Mater. 2003, 15, 6229–6237. [Google Scholar] [CrossRef]
- Pullar, R.C. Hexagonal ferrites: A review of the synthesis, properties and applications of hexaferrite ceramics. Prog. Mater. Sci. 2012, 57, 1191–1334. [Google Scholar] [CrossRef]
- Pullar, R.C. Multiferroic and Magnetoelectric Hexagonal Ferrites. In Mesoscopic Phenomena in Multifunctional Materials: Synthesis, Characterization, Modelling and Applications; Saxena, A., Planes, A., Eds.; Springer Series in Materials Science; Springer: Heidelberg, Germany, 2014; Volume 198. [Google Scholar]
- Altmeyer, S.; Hoffmann, C.; Lücke, M. Islands of instability for growth of spiral vortices in the Taylor-Couette system with and without axial through flow. Phys. Rev. E 2011, 84, 046308. [Google Scholar] [CrossRef] [PubMed]
- Chomaz, J.-M. Global instabilities in spatially developing flows: Non-normality and nonlinearity. Annu. Rev. Fluid Mech. 2005, 37, 357–392. [Google Scholar] [CrossRef]
Figure 1.
Structure of hexaferrites: left to right—M-type; Y-type; Z-type [15]. Reprinted by permission from Springer/Nature [Nature Materials]; low-field magnetoelectric effect at room temperature by Kitagawa et al., [Copyright] (2010).
Figure 1.
Structure of hexaferrites: left to right—M-type; Y-type; Z-type [15]. Reprinted by permission from Springer/Nature [Nature Materials]; low-field magnetoelectric effect at room temperature by Kitagawa et al., [Copyright] (2010).
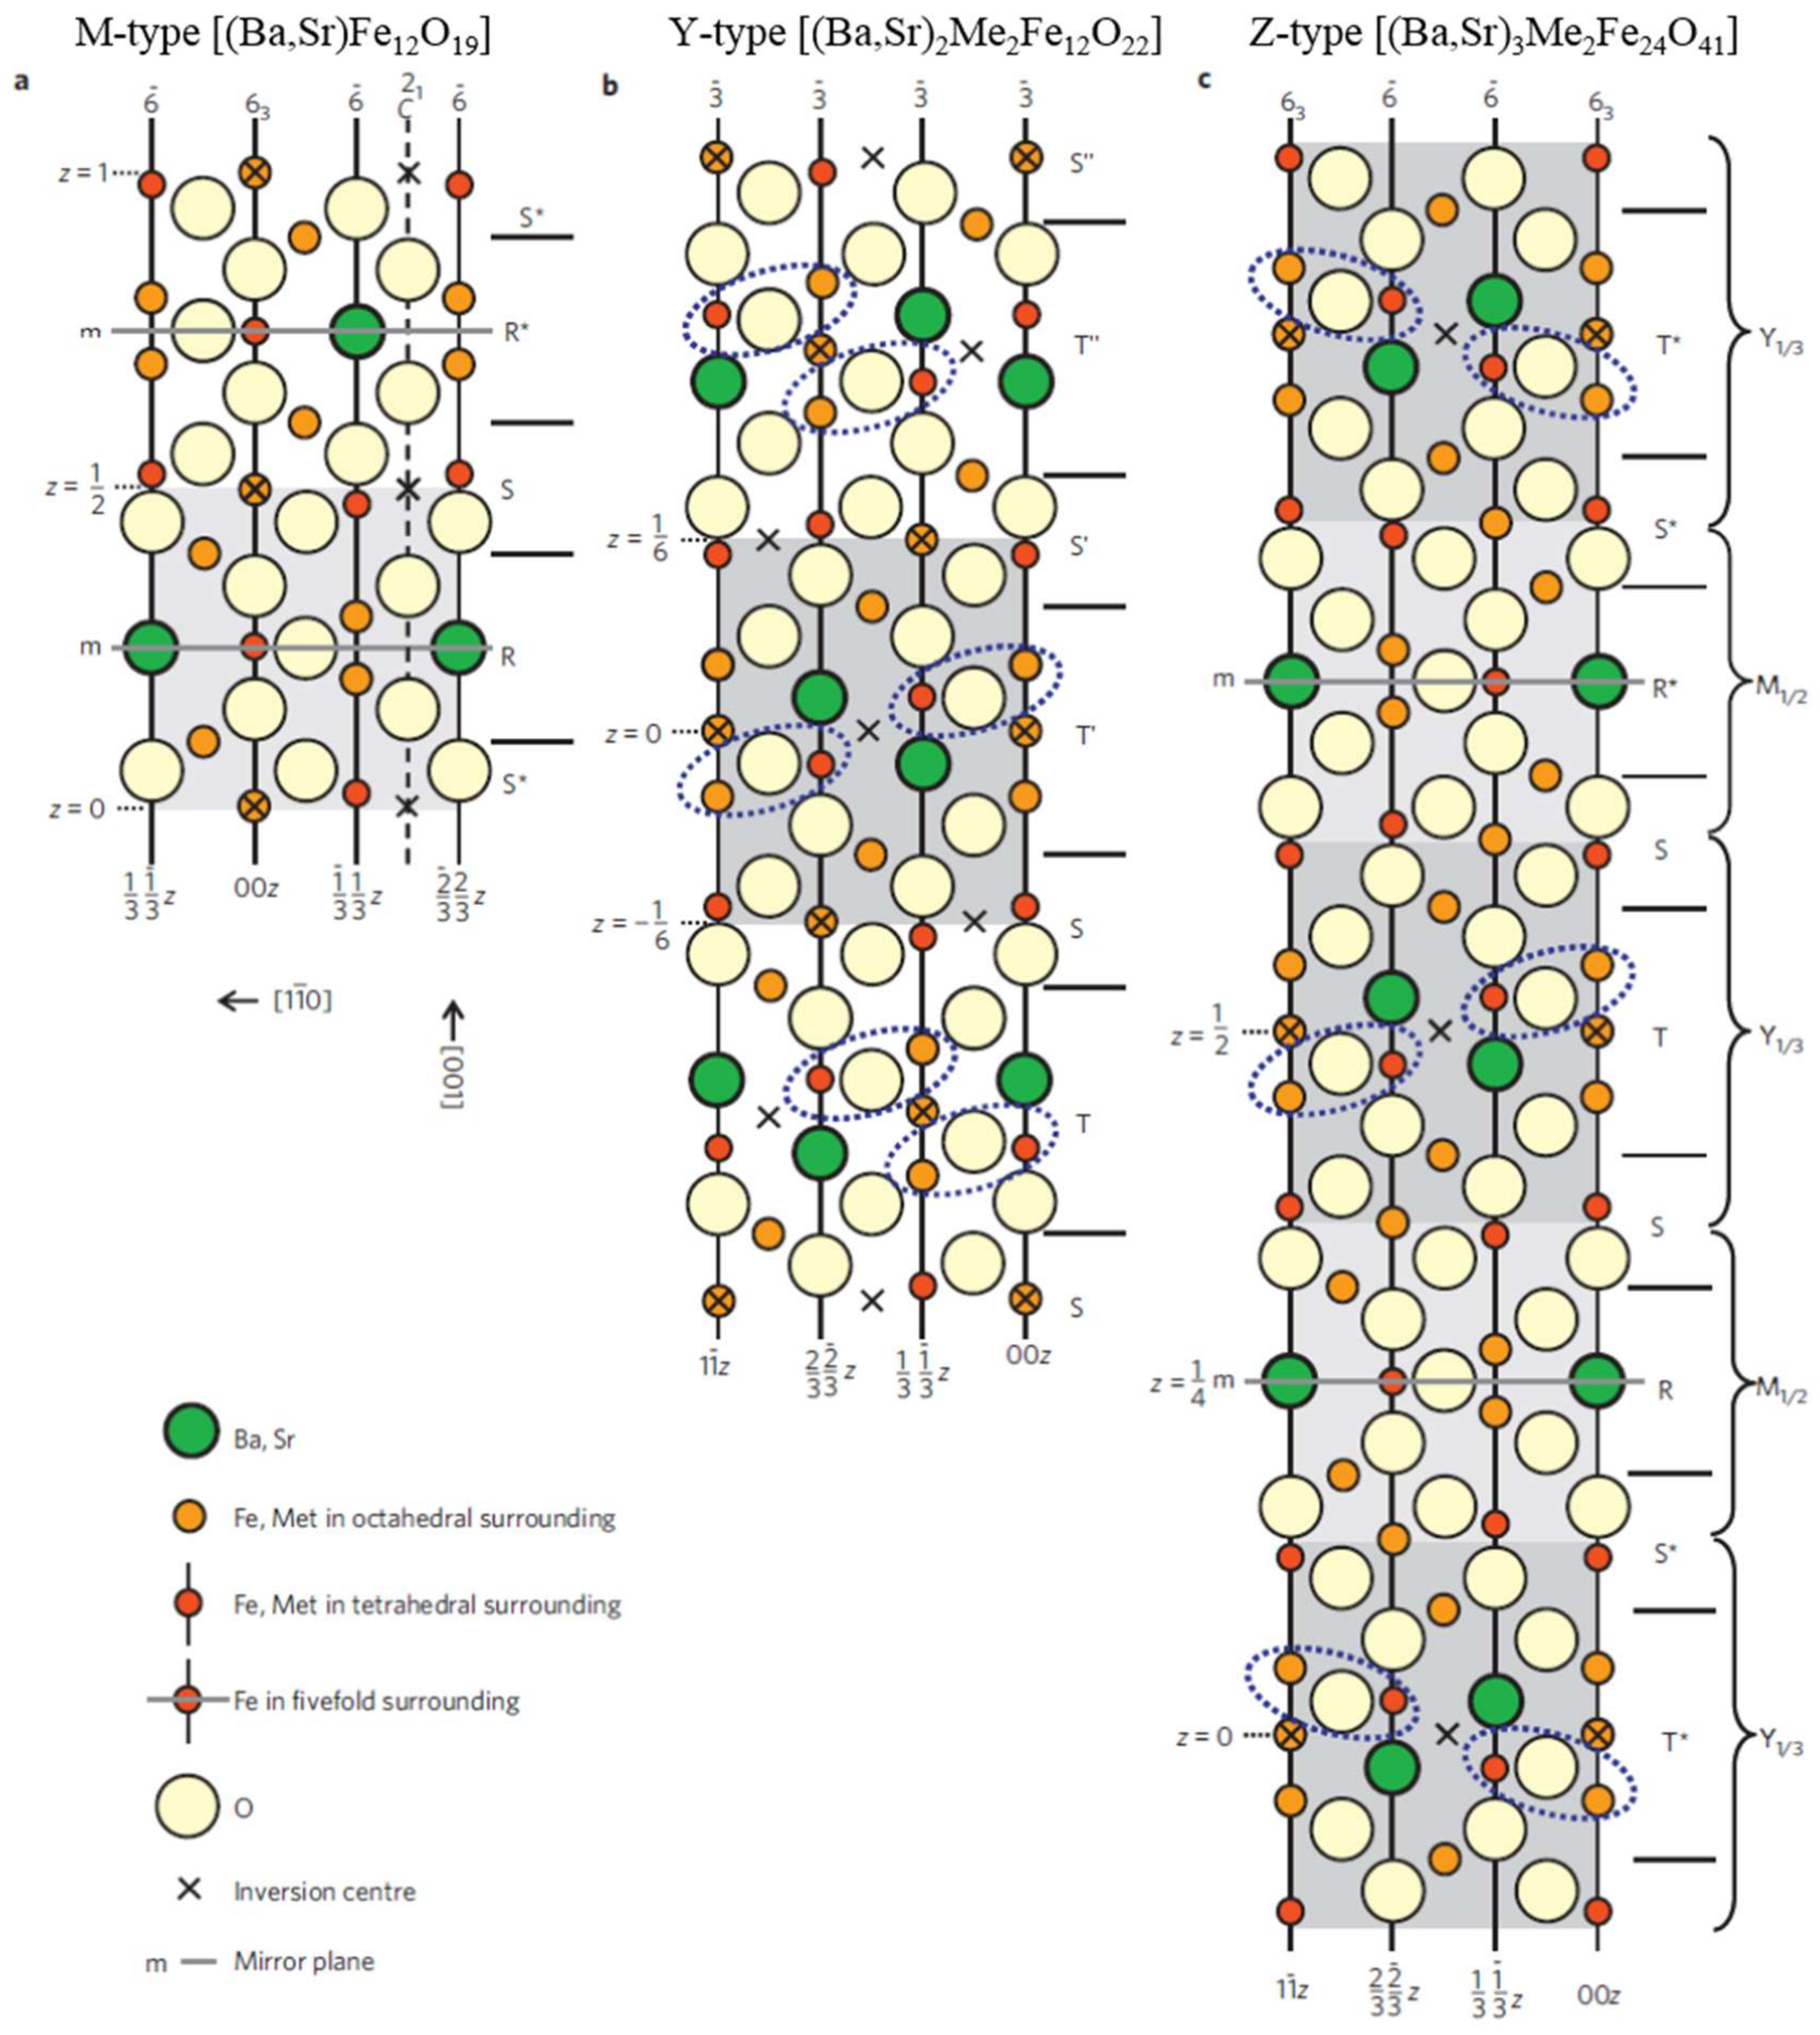
Figure 2.
Real and imaginary parts of the dielectric constant for Ga-substituted PbFe12O19. The dependence of Tc upon the percentage x of Ga substituted for Fe varies experimentally as Tc = A(x−xc)2/3, which is in agreement with the theoretical value [16] of 0.63 for a similar fcc structure (the percolation value for the exact PbFe12O19 structure has not been published); however, Lorenz et al. suggest that it is the same as for fcc: [17]. The value xc has also been calculated and is in agreement with theory.

Figure 3.
Real part of the dielectric constant for the two Ga-substituted lead hexaferrites shown in Figure 2. The solid curves are fits to Vogel-Fulcher equations.
Figure 3.
Real part of the dielectric constant for the two Ga-substituted lead hexaferrites shown in Figure 2. The solid curves are fits to Vogel-Fulcher equations.
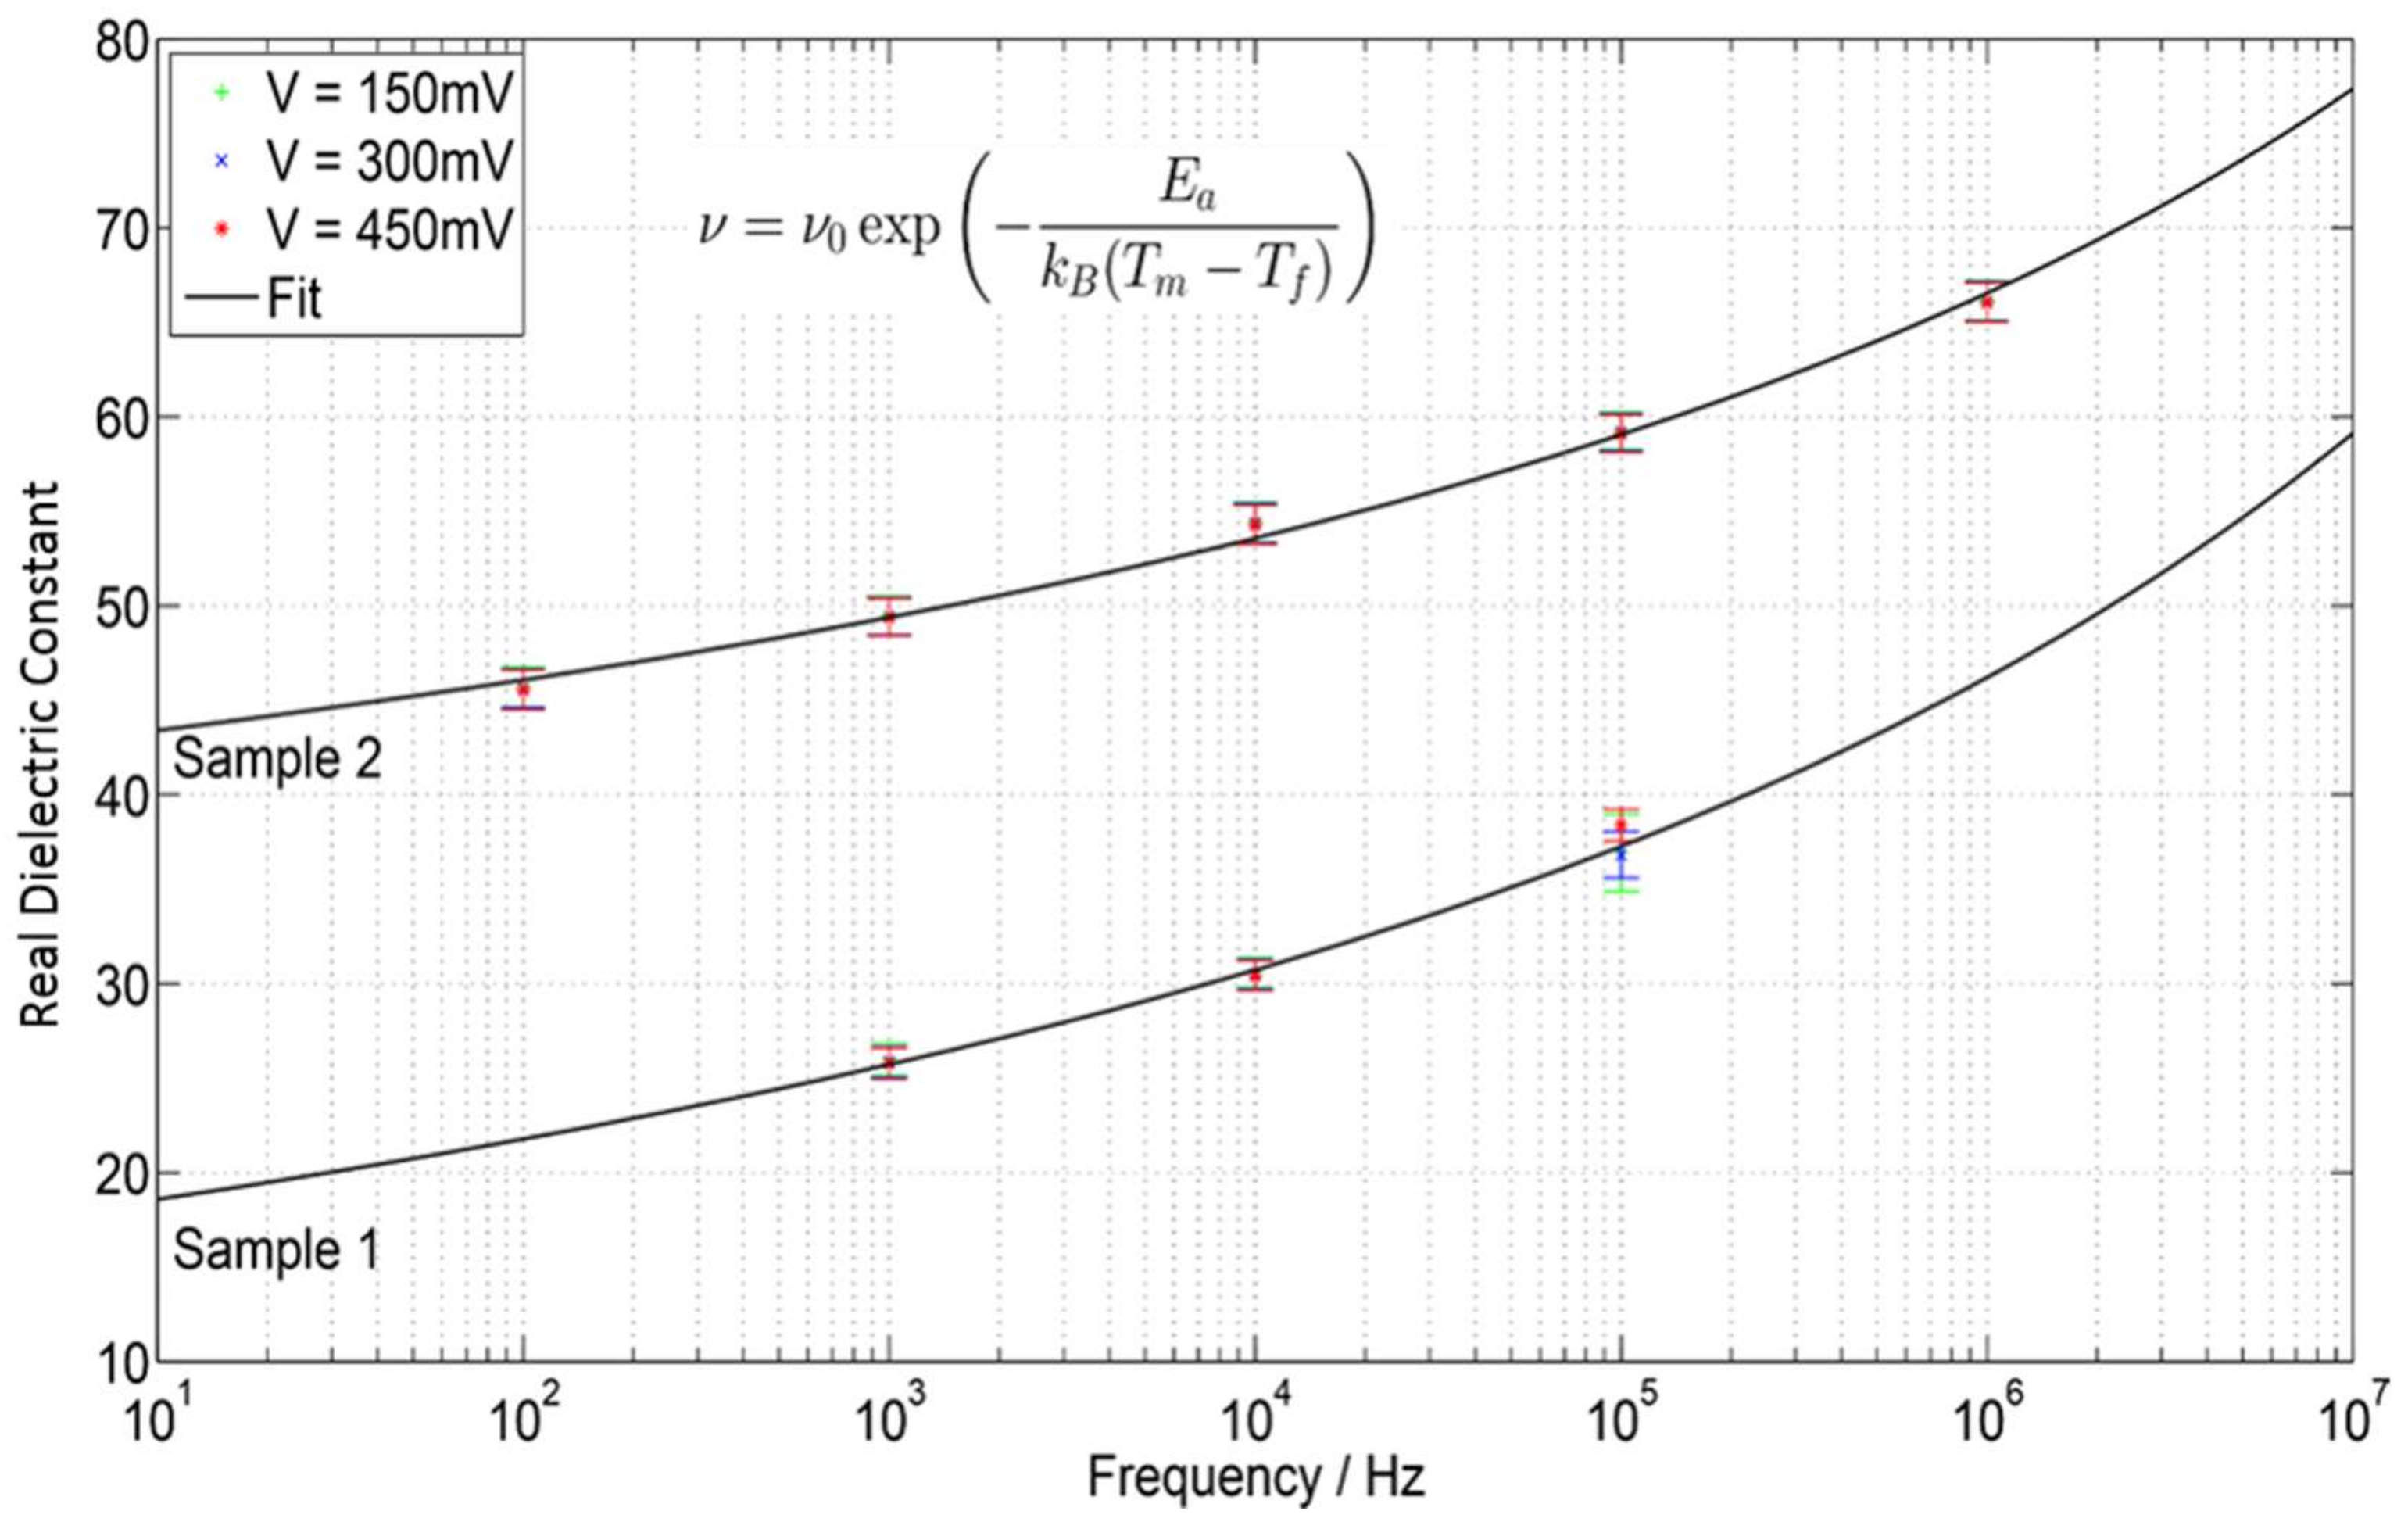
Figure 4.
Dielectric constant T-cubed dependence in BaFe12O19.
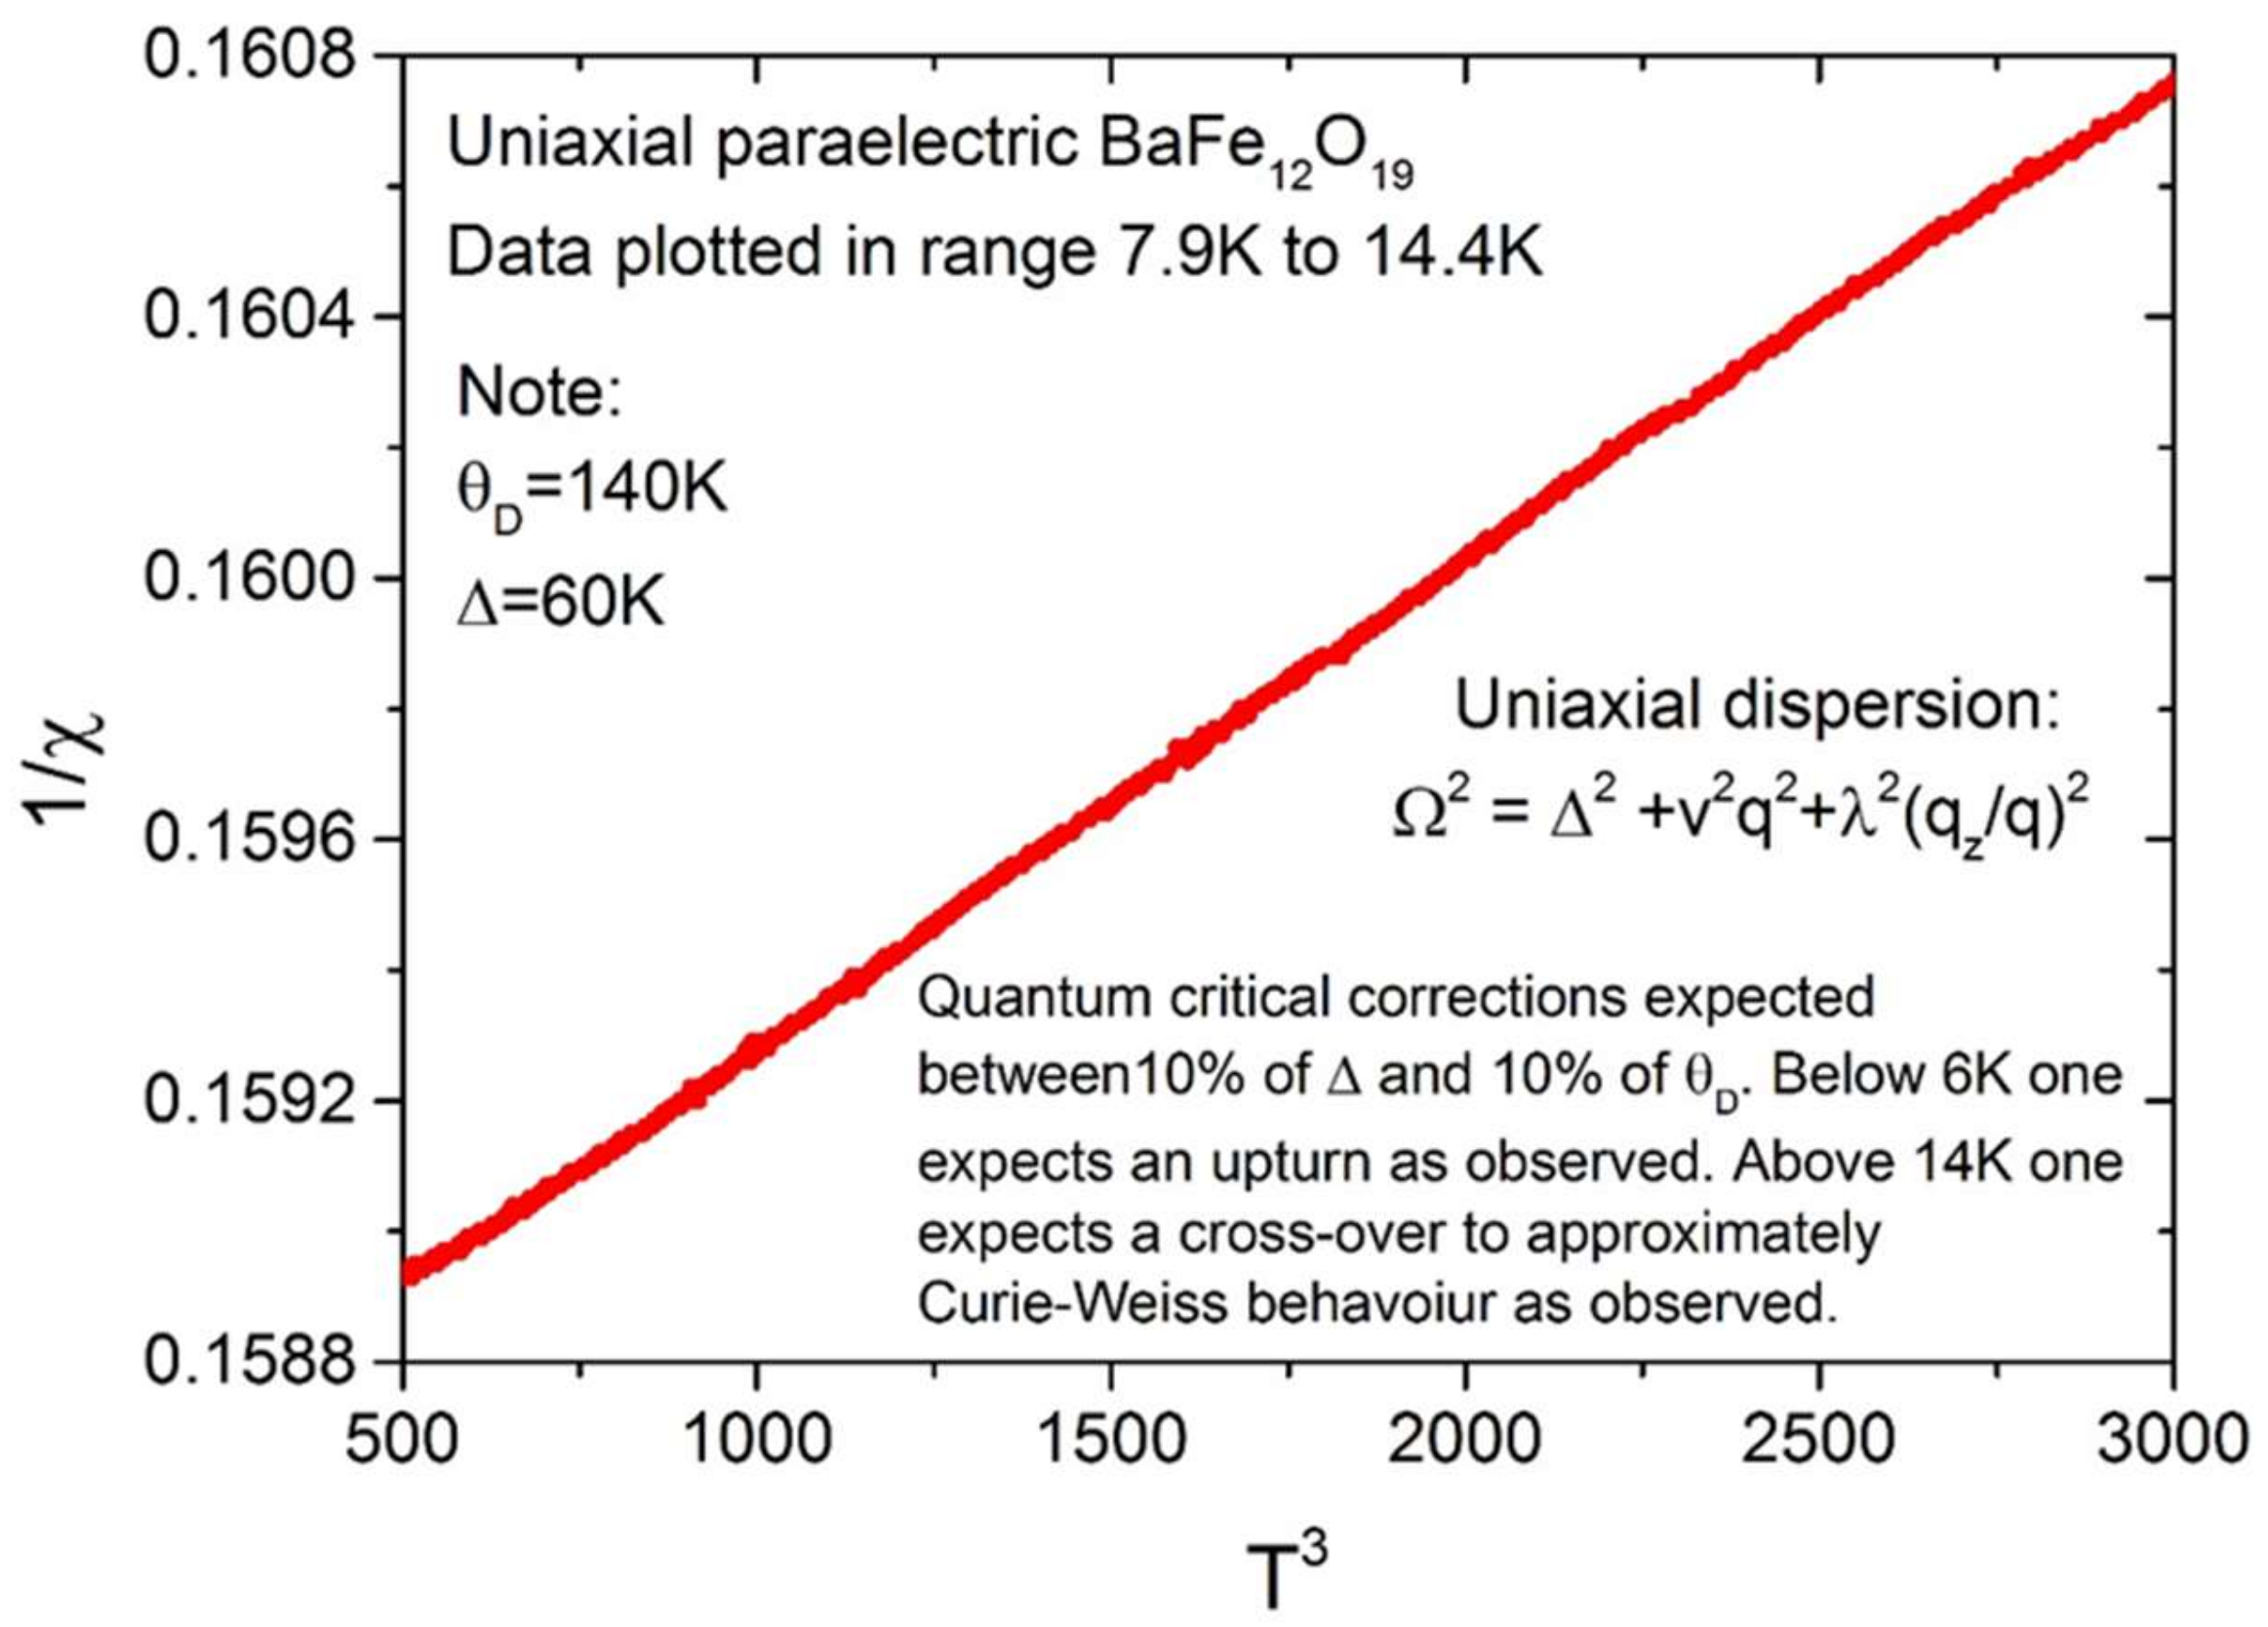
Figure 5.
Tetragonal tungsten bronze (TTB) structure with tetragonal and orthorhombic unit cells indicated by dotted and dashed lines.
Figure 5.
Tetragonal tungsten bronze (TTB) structure with tetragonal and orthorhombic unit cells indicated by dotted and dashed lines.

Figure 6.
Vogel-Fulcher fit for lead niobate pyrochlore. Temperature values of maxima determined from dielectric data of Siegwarth et al. [21].
Figure 6.
Vogel-Fulcher fit for lead niobate pyrochlore. Temperature values of maxima determined from dielectric data of Siegwarth et al. [21].

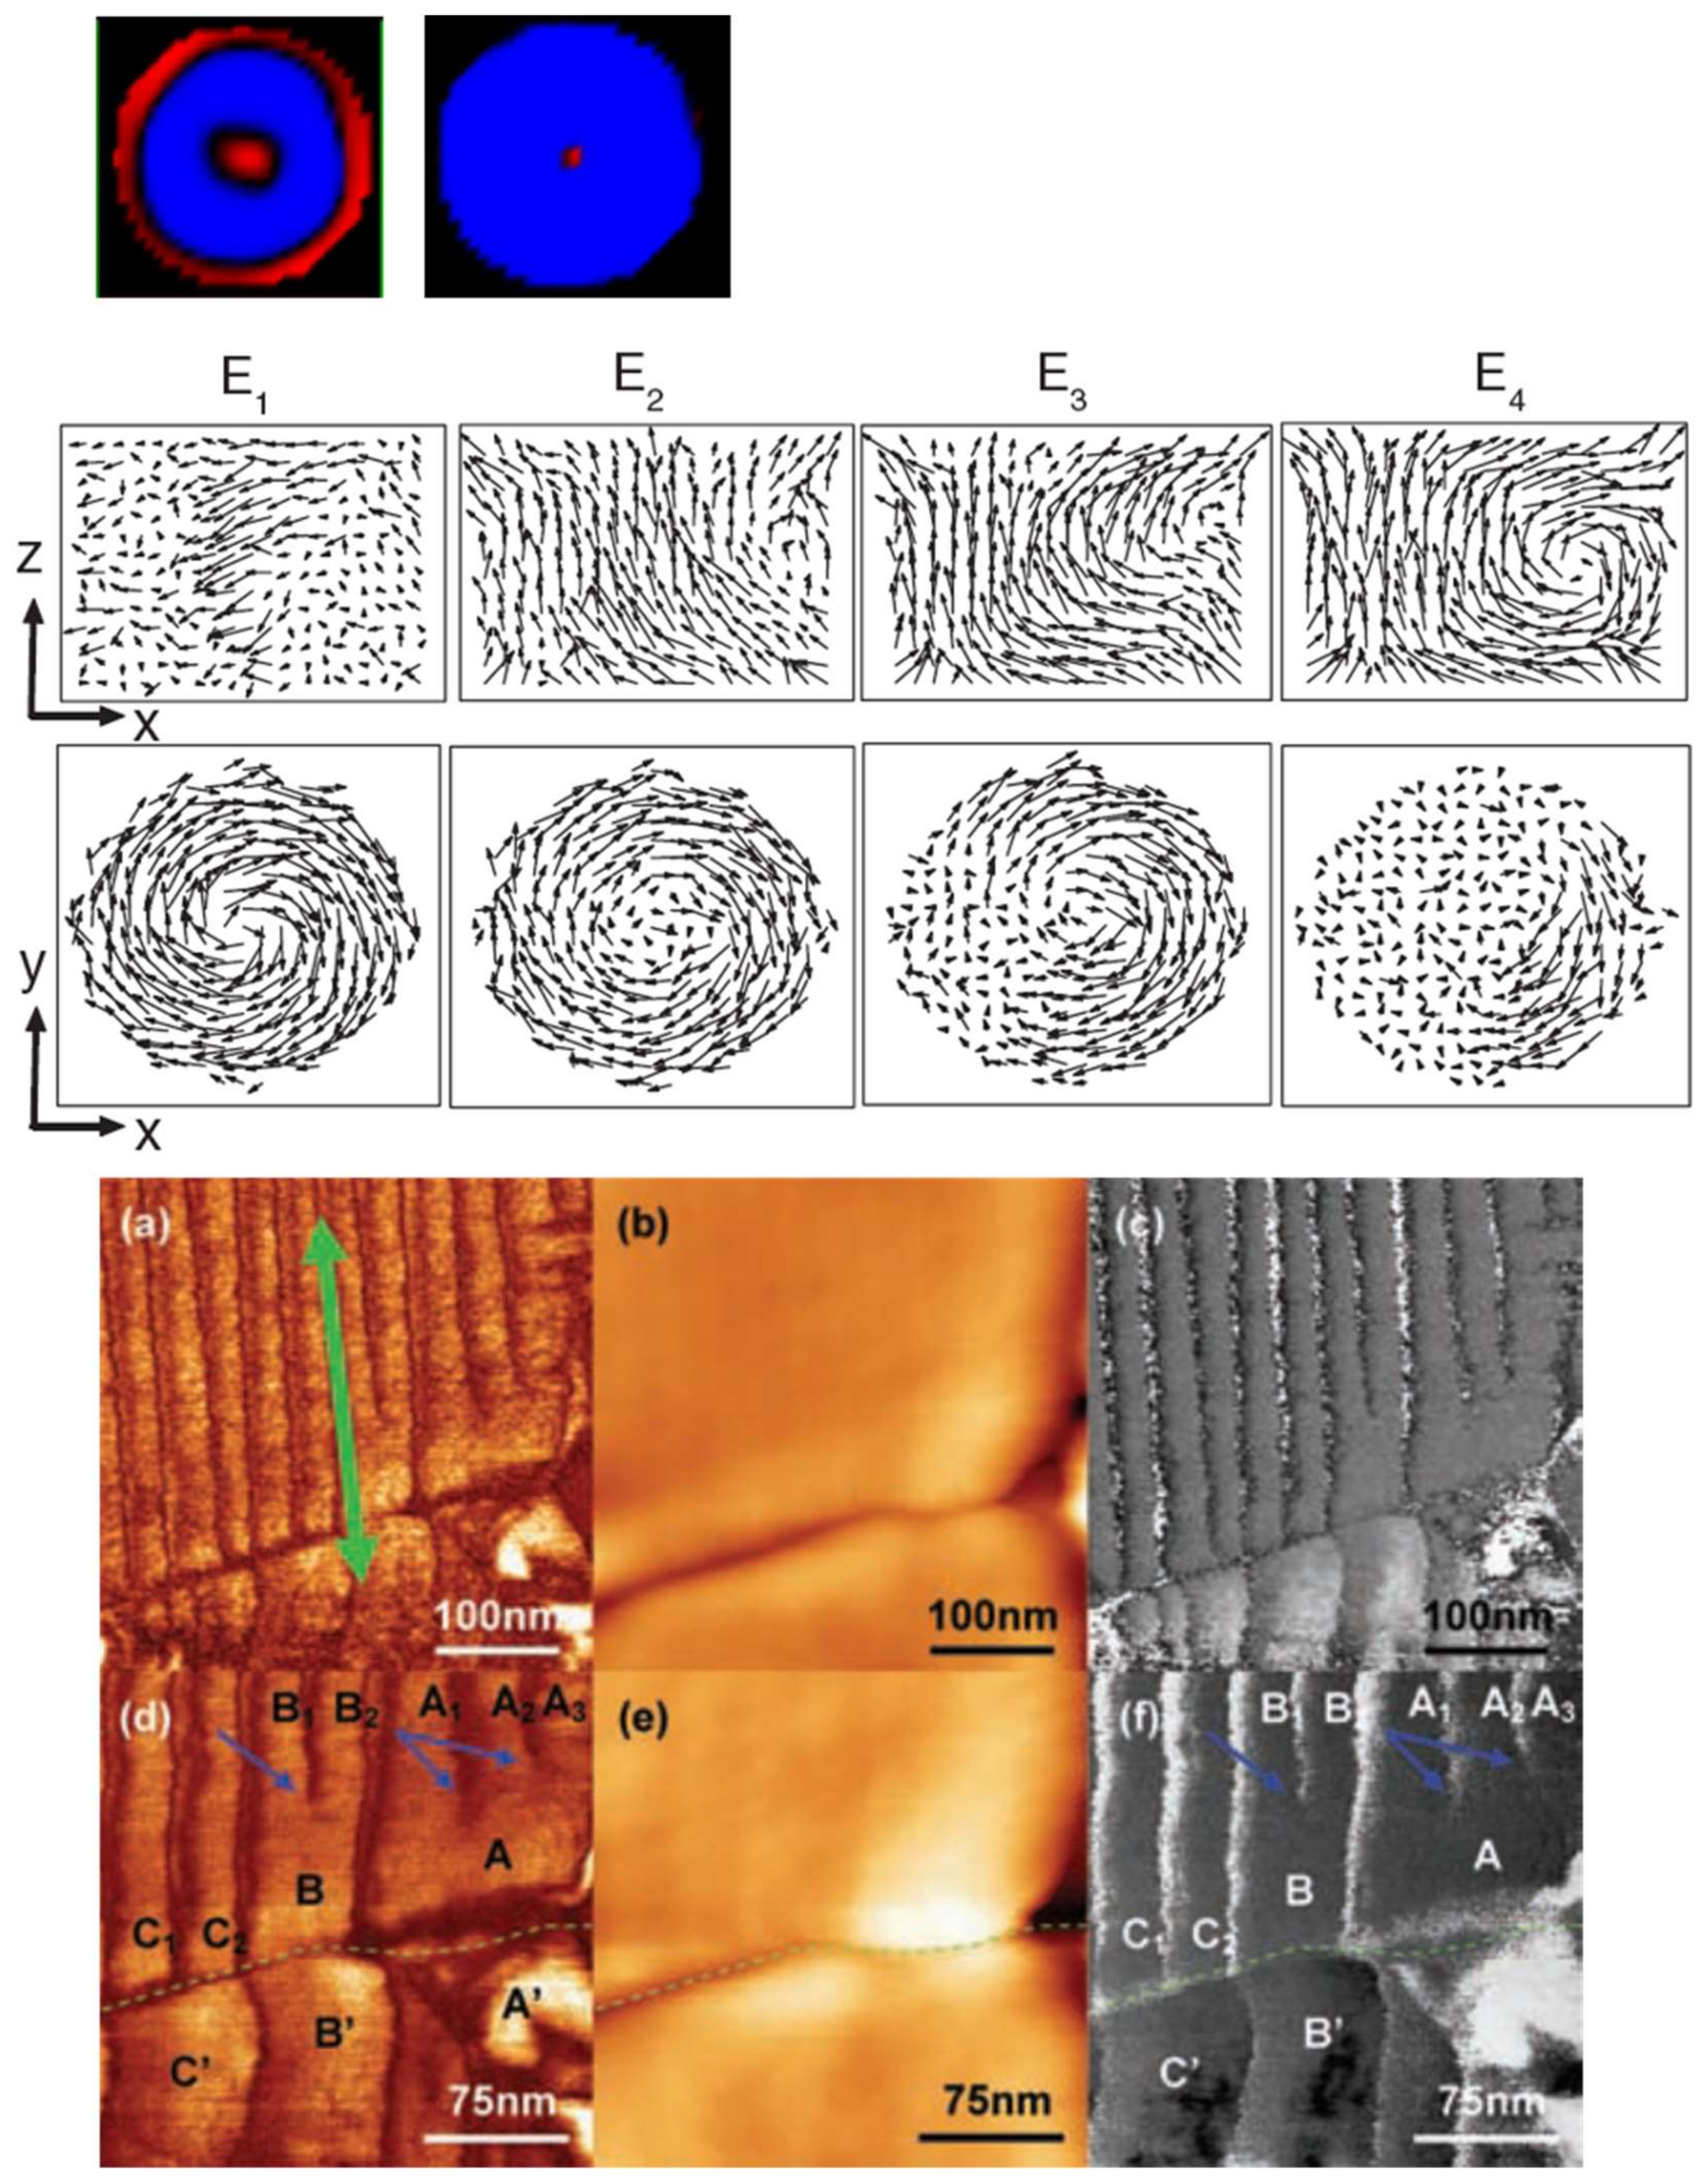
Figure 7.
Theoretical domain instability patterns with wavevector K, from Hohenberg and Krekhov [30]. Reprinted from 30. Hohenberg P. C. and Krechkov A. P., An introduction to the Ginzburg–Landau theory of phase transitions and nonequilibrium patterns, Phys. Rpts. 2015, 572, 1–42 (2015)., Copyright (2015), with permission from Elsevier Copyright (2015), with permission from Elsevier.

Figure 8.
(Top) bull’s eye patterns in PZT [32]; (Center) spiral domains [39]; (Bottom) dislocation twinning instabilities visible in panels a,c,d,f.

Figure 9.
Models of polarization pattern evolution with time after the field E is applied. Arrows (a–c) and cones (d) denote direction of polarization P. Note that unlike the case in (a–c), it is obvious that P is not confined to the plane in (d). These simulations were done [38] by H. J. Fan in 2008, perhaps ahead of their time; most interest in spatial spiral patterns developed almost a decade later [39].
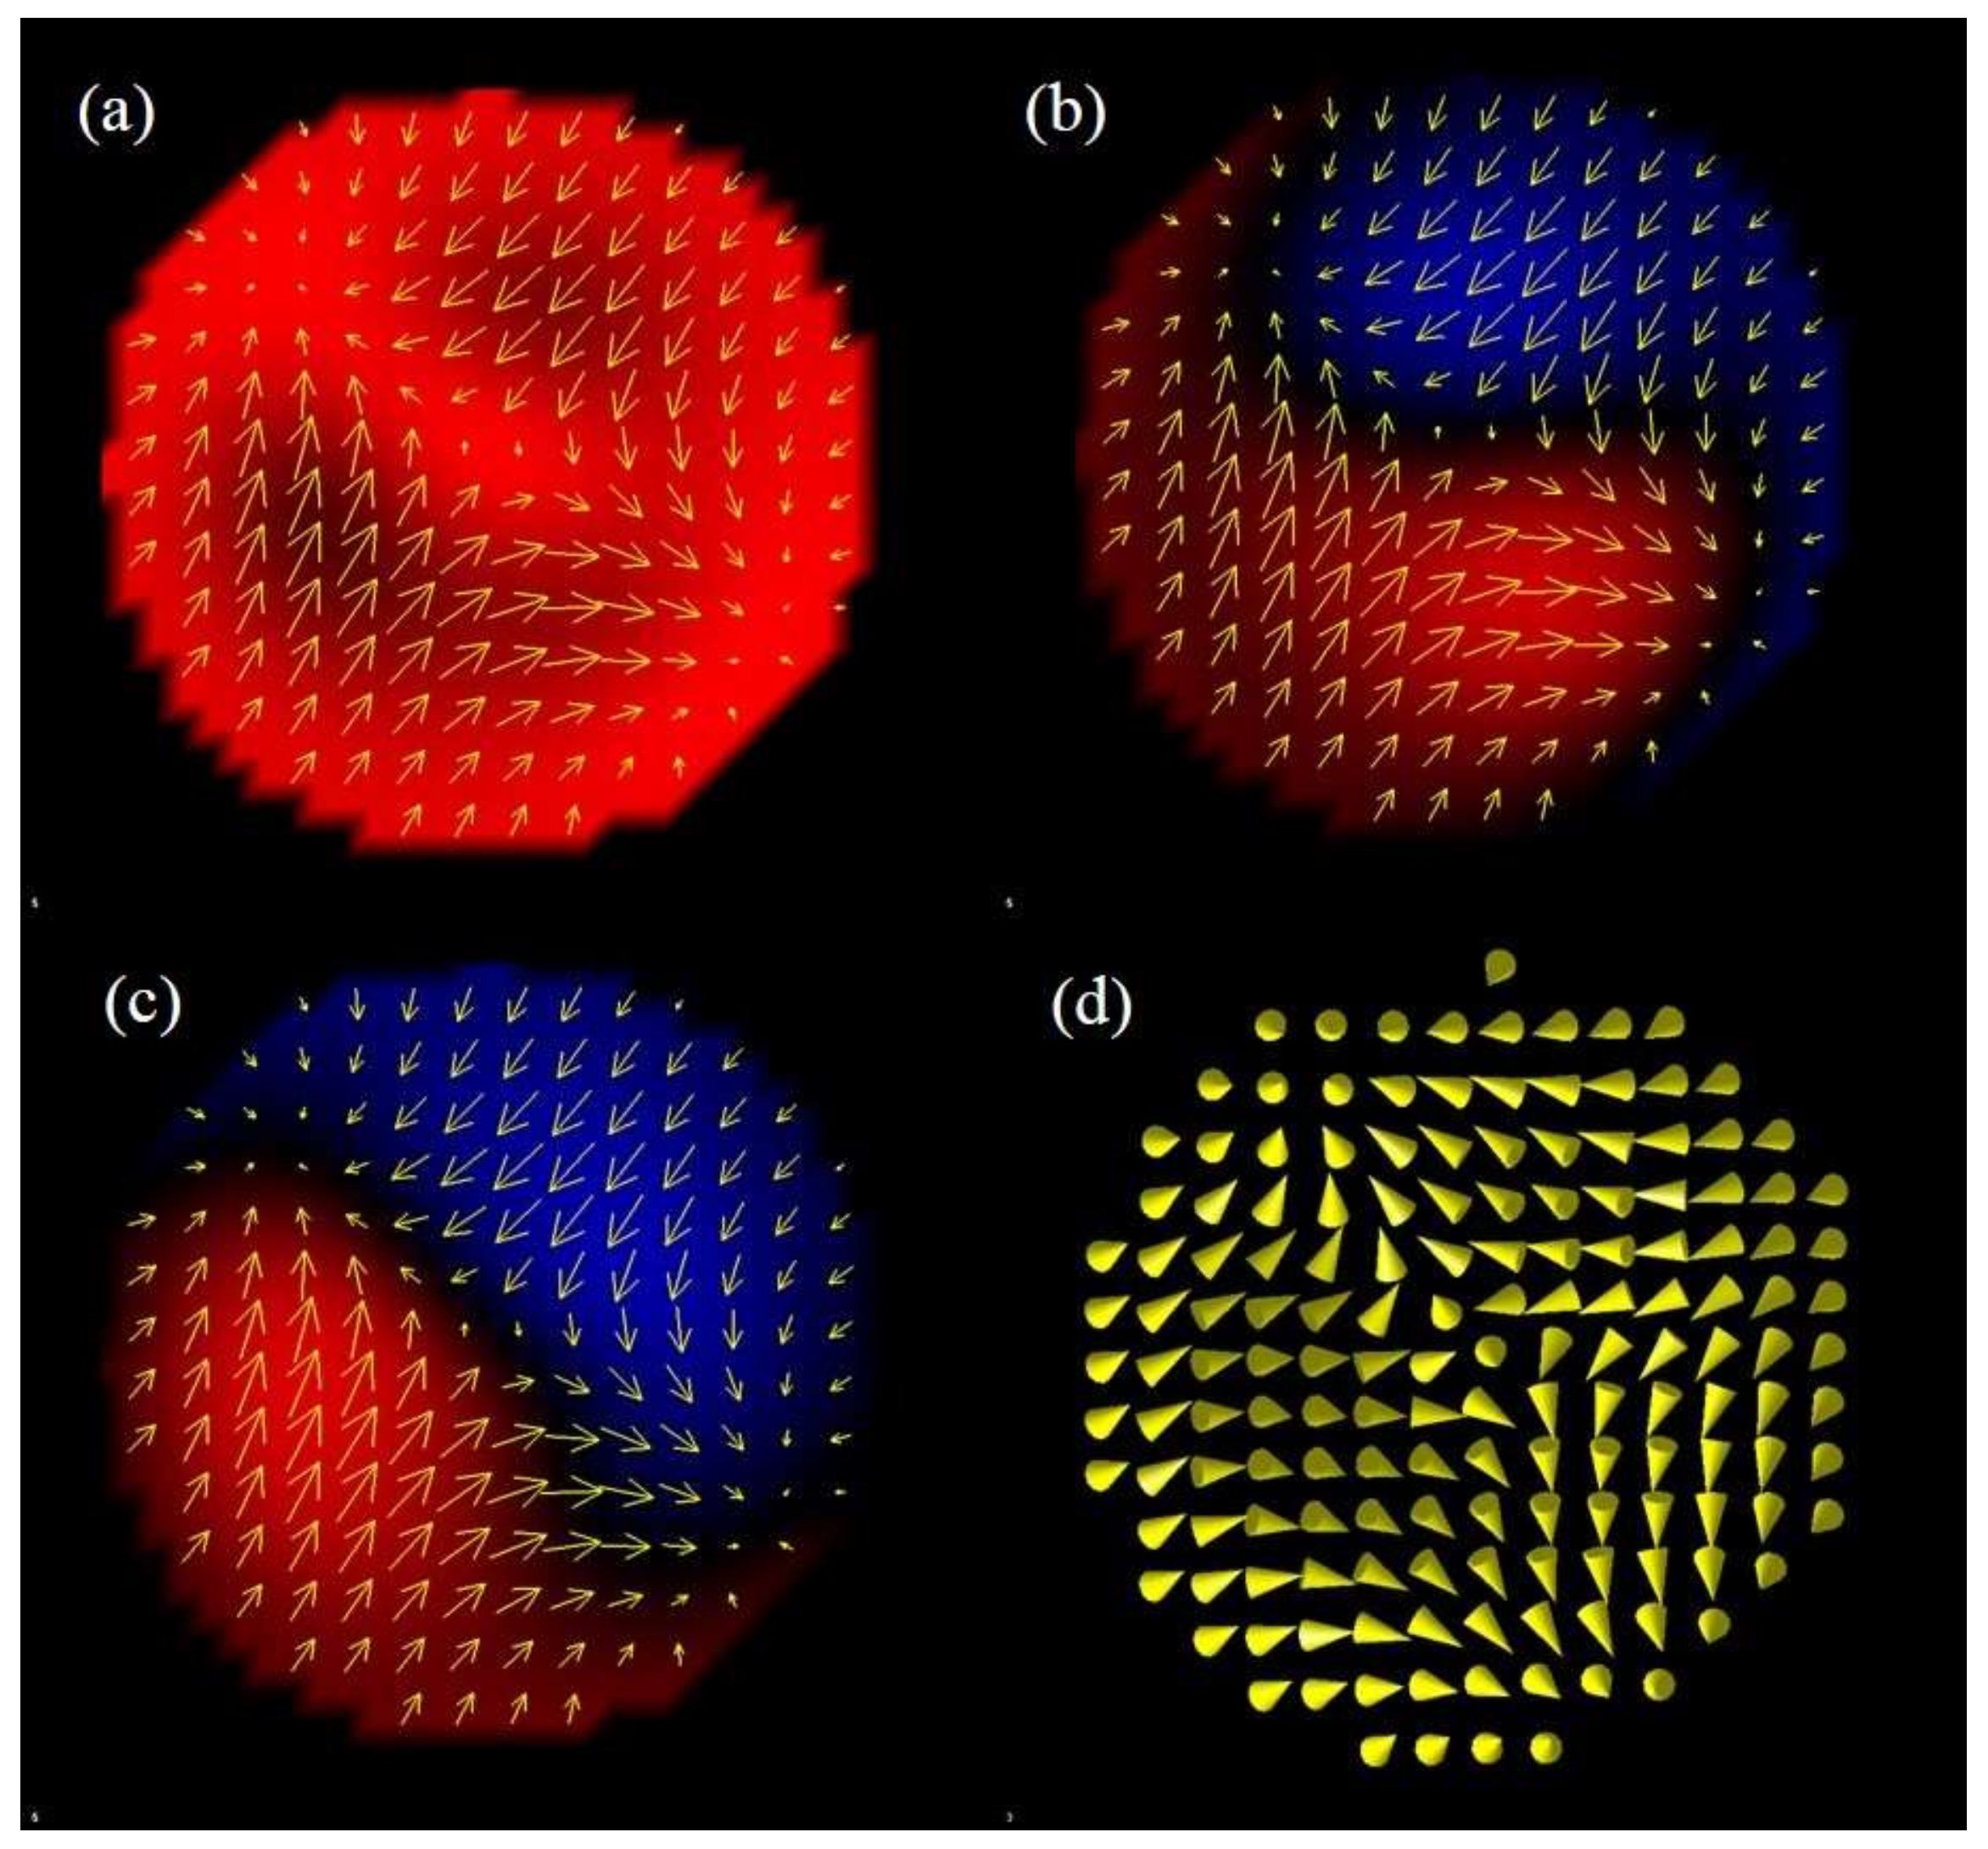
Figure 10.
This figure shows the result of calculations for the rotations observed within the domain patterns in Figure 9. There are size limits that permit polarization switching, typically between 12 and 15 nm. These size limits may be compared with those in the more recently discovered vortex arrays [39,40]. The size limits remind us that the circular boundary conditions of our disc-shaped ferroelectric films are very important, and the bull’s eye spatial patterns (Figure 7d and Figure 8a) approximate first-order Bessel functions (standing waves on a drum head [35,36,37]).
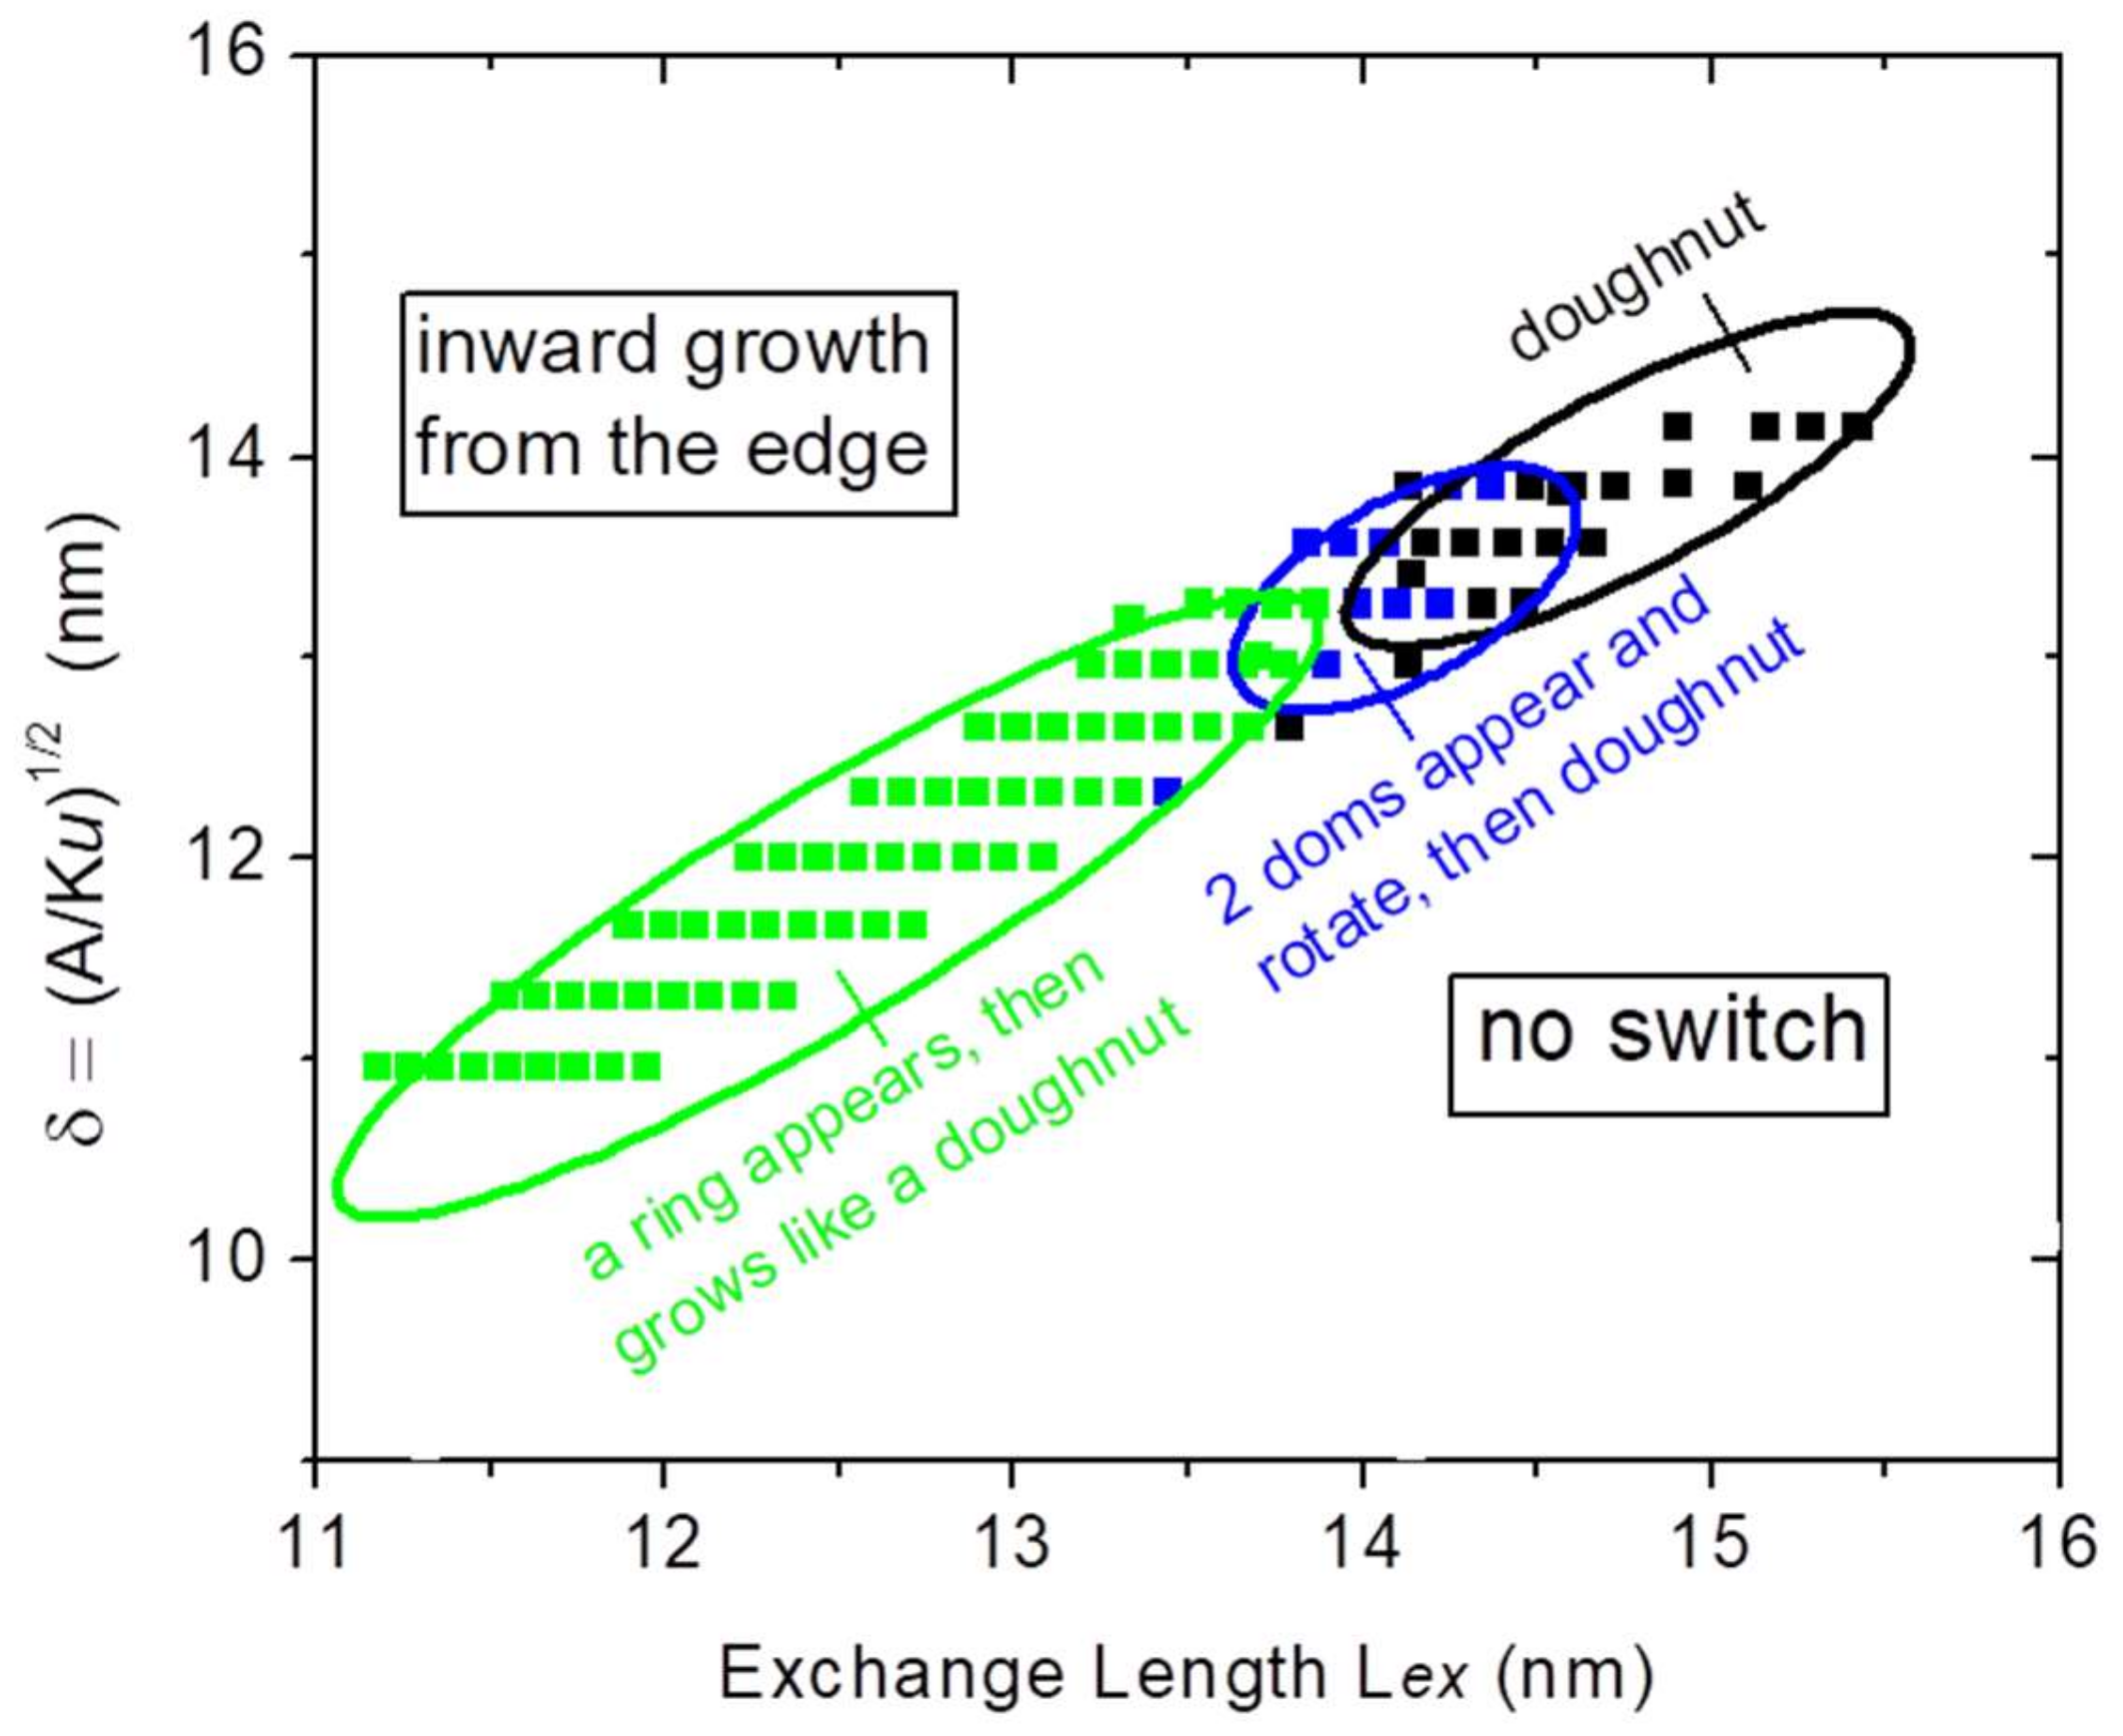
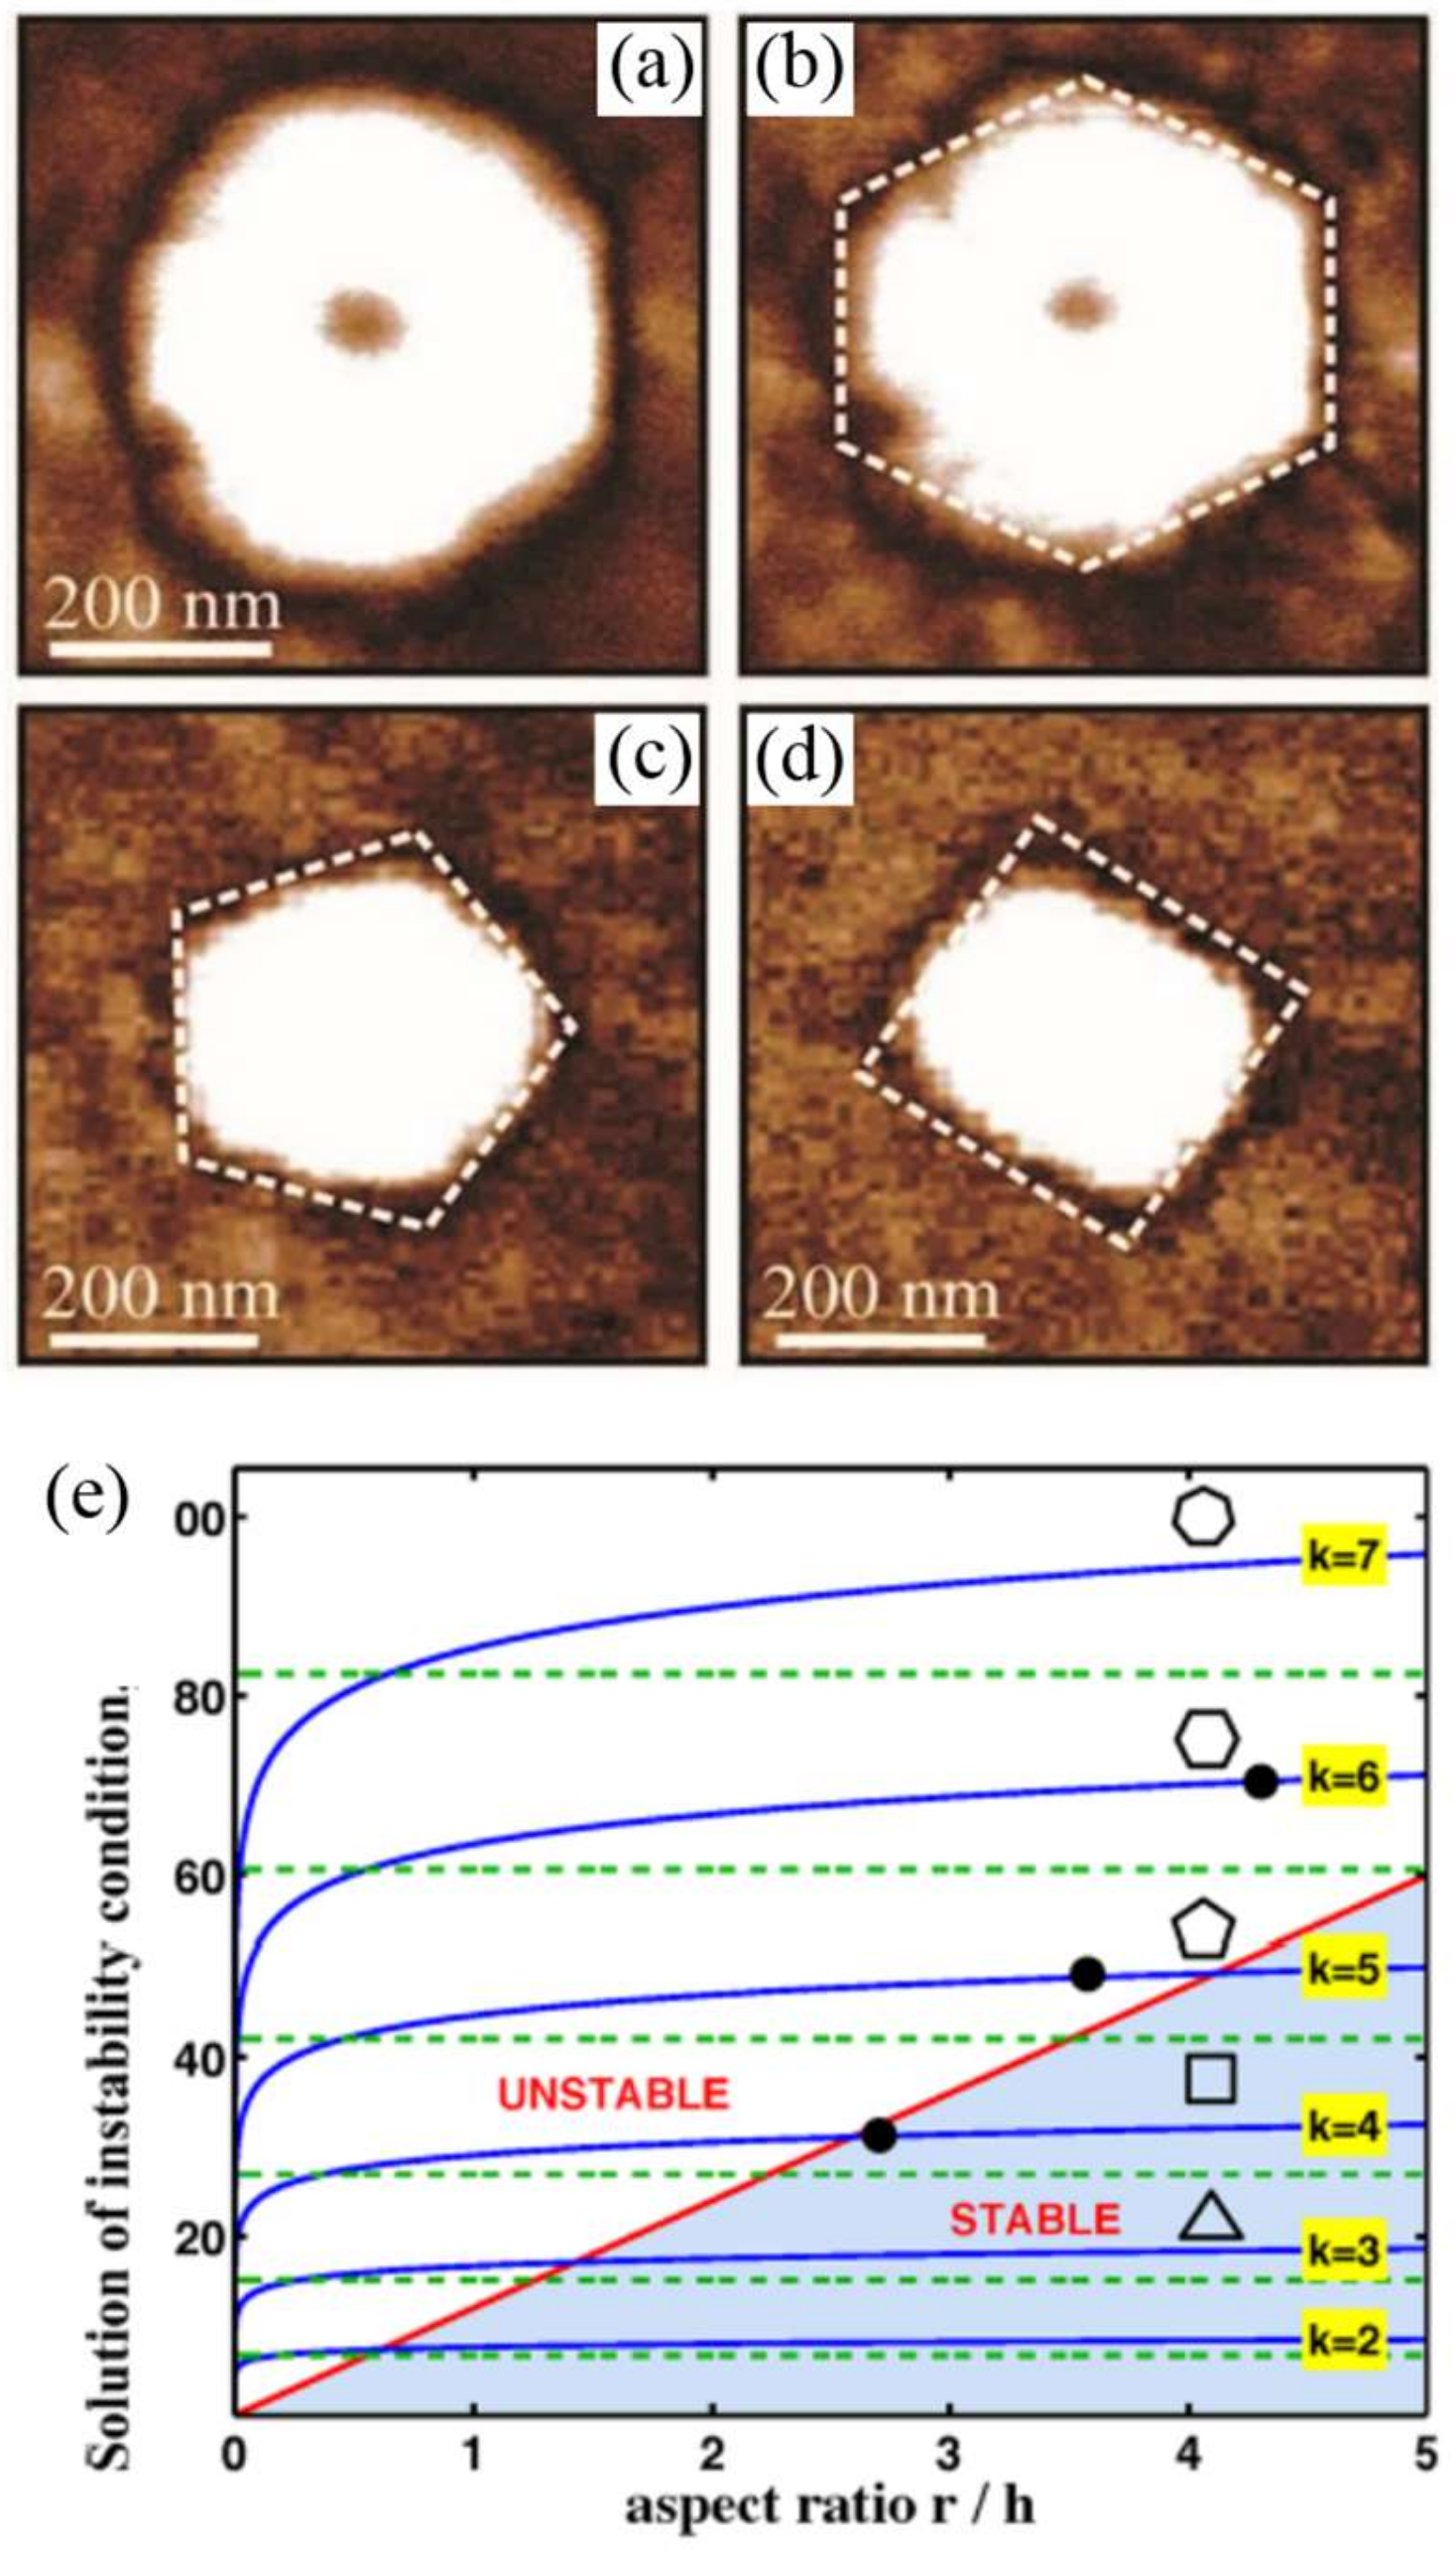
Figure 11.
(a–d) Rectangular, pentagonal, and hexagonal domain faceting in a ferroelectric with only twofold lattice symmetry (Lukyanchuk et al. [45]). (e) Sides of polygonal faceting versus aspect ratio for a thin ferroelectric film [45]. This kind of faceting rearrangement is driven by strain, not thermal fluctuations, and hence does not vanish at T = 0.

Figure 12.
Phase diagram for thin surface layer (Wang and Zhao [46]). The ratio of moduli for the surface layer (e.g., domain wall in the present context) to that of the bulk is graphed versus strain (abscissa) and a thickness parameter (depth). Note that for most interesting phenomena, the surface layer must be stiffer than the substrate (ordinate modulus ratio >1); otherwise, the surface layer simply slides around without wrinkling or folding. Note also that the folding and period doubling regimes can be entered from the flat state via several trajectories in phase space, including stress εM or increased surface domain wall (film) rigidity μf. Reproduced from Wang and Zhao [46] under the terms of the Creative Commons CC BY licence (https://creativecommons.org/licenses/by/4.0/legalcode) Copyright © 2015, Springer Nature.
© 2018 by the author. Licensee MDPI, Basel, Switzerland. This article is an open access article distributed under the terms and conditions of the Creative Commons Attribution (CC BY) license (http://creativecommons.org/licenses/by/4.0/).
Share and Cite
MDPI and ACS Style
Scott, J.F. Ferroelectric Relaxor Quantum Crystals. Crystals 2018, 8, 180. https://doi.org/10.3390/cryst8040180
AMA Style
Scott JF. Ferroelectric Relaxor Quantum Crystals. Crystals. 2018; 8(4):180. https://doi.org/10.3390/cryst8040180
Chicago/Turabian StyleScott, J. F. 2018. "Ferroelectric Relaxor Quantum Crystals" Crystals 8, no. 4: 180. https://doi.org/10.3390/cryst8040180
Note that from the first issue of 2016, this journal uses article numbers instead of page numbers. See further details here.