Influence of Doping Tb on the Mechanical Properties and Martensitic Transformation of Ni-Mn-Sn Magnetic Shape Memory Alloys


1
School of Science, Harbin University of Science and Technology, Harbin 150080, China
2
School of Materials Science and Engineering, Harbin University of Science and Technology, Harbin 150080, China
*
Author to whom correspondence should be addressed.
Crystals 2018, 8(6), 247; https://doi.org/10.3390/cryst8060247
Submission received: 17 May 2018
/
Revised: 4 June 2018
/
Accepted: 5 June 2018
/
Published: 11 June 2018
Abstract
:Brittleness and low working temperature are two key factors that restrict the application of Ni-Mn-Sn alloys. Element doping is an effective means to improve performance of materials. In present paper, martensitic transformation (MT) and mechanical properties of Ni48Mn39Sn13−xTbx (x = 0, 0.5, 1, 2, and 5 at.%) alloys are investigated. It is found that the Tb addition refines significantly the grains and causes the formation of a Tb-rich phase. All the samples undergo the martensitic transformation from parent phase to martensite. And the martensitic transformation characteristic temperatures increase remarkably from −60.7 °C for x = 0 to 364.1 °C for x = 5. The appropriate amount of Tb addition in Ni48Mn39Sn13−xTbx (x = 0, 0.5, 1, 2, and 5 at.%) alloys significantly enhances the compressive strength and improves the ductility, which can be ascribed to the grain refinement. The compressive stress of 571.8 MPa and strain 22.0% are obtained in the Ni48Mn39Sn11Tb2 alloy. Then the mechanical properties decrease with the further increased Tb content. Simultaneous improving of martensitic transformation temperature and mechanical properties in Ni-Mn-Sn magnetic alloy are achieved by Tb doping.
1. Introduction
Compared to traditional shape memory alloys (SMAs), ferromagnetic shape memory alloys (FSMAs) can produce force and deformations by applying a magnetic field. Owing to the strong coupling between structure and magnetism, the ferromagnetic shape memory alloys (FSMAs) have attracted considerable attention [1,2,3,4,5,6,7,8,9,10]. As a typical magneto-structurally coupled ferromagnetic shape memory alloy (FSMAs), Ni-Mn-Sn alloys undergo a magnetic-field-induced reverse martensitic transformation from antiferromagnetic martensite to ferromagnetic austenite. On this basis, Ni-Mn-Sn FSMAs exhibit rich multifunctional properties, such as the magnetic field induced shape memory effect, giant magnetoresistance [11,12], magnetocaloric effect (MCE) [13,14], and the elastocaloric effect (eCE) [15].
The MCE is a magneto-thermodynamic phenomenon in which a temperature change of a suitable material is caused by exposing the material to a changing magnetic field [13,16,17,18,19,20,21,22]. Magnetic refrigeration is a new cooling technology utilizing the MCE. In comparison, based on the elastocaloric effect, similar caloric effects are demonstrated by application of mechanical stress. And these materials with the elastocaloric effect have recently attracted tremendous attention due to the large available latent heat and large adiabatic temperature changes. Either based on the MCE or eCE, the materials all show the largest potential to replace the traditional vapor-compression technologies due to the zero-production of ozone-depleting or greenhouse gases. Quite recently, a large temperature change of 4 K was found during compressing the sample of Ni45Mn44Sn11 with a small transformation strain of 1.3% at 291.5 K [23]. All of these indicate that, as a typical multiferroic material with a large magnetoelastic effect or elastocaloric effect, Ni-Mn-Sn FSMAs are regarded as having potential for environmentally-friendly solid-state refrigeration materials.
Because the alloys with poor mechanical properties normally crack under repeated stress cycling, the cooling life is reduced. The real utilization of magnetocaloric materials and elastocaloric materials both demand good mechanical properties. Unfortunately, now, the main drawback of existing Ni-Mn-Sn alloys is its nature of high brittleness and poor mechanical properties. Therefore, it is urgent to solve the brittleness problem. Additionally, due to the coupling of the martensitic transformation and ferromagnetic transition, the existing Ni-Mn-Sn FSMAs show a lower working temperature. Now, only very few studies have been performed in order to increase the working temperature of these FSMAs, which is also one of the principal requirements for the practical application.
Many efforts have been put forward on the improvement of the mechanical properties of other Ni-Mn based alloys, including the element substitution and the secondary phase inclusion [24,25,26,27,28]. As previously reported, the addition of rare earth elements such as Sm, Tb, Dy, Nd, and Y, enhances the ductility of Ni-Mn-Ga alloys [29]. Moreover, we all know that the largest MCEs to date have been observed in Gd5Si2Ge2, which are currently based on rare earth materials [30]. So, rare earth element addition may play a positive role in solid-state refrigeration. Meanwhile, some researchers have reported that rare earth element addition could improve the martensitic transformation temperature. Therefore, it can be anticipated that doping a suitable rare earth element into Ni-Mn-Sn FSMAs may simultaneously tune the mechanical properties and martensitic transformation temperature. There is still a lack of knowledge and information about the rare earth element Tb addition in Ni-Mn-Sn FSMAs. In this paper, we anticipate that Tb addition in Ni-Mn-Sn alloys will have an amazing effect on the mechanical properties and martensitic transformation behavior. Finally, the results show that the martensitic transformation characteristic temperatures increase remarkably with the increase in Tb content. The compressive stress increases from 74.3 MPa to 571.8 MPa and the compressive strain increase form 9.2% to 22.0% with increasing Tb content from 0 at.% to 2 at.%.
2. Materials and Methods
The nominal composition of the alloy Ni48Mn39Sn13−xTbx (x = 0, 0.5, 1, 2, and 5 at.%) were prepared with high purity elements nickel, manganese, stannum, and Terbium, with a purity levels of 99.99%, 99.95%, 99.99%, and 99.9%, respectively, by melting six times in a non-consumed vacuum arc furnace under argon atmosphere. In this paper, the nominal composition of the Ni48Mn39Sn13−xTbx (x = 0, 0.5, 1, 2, and 5) alloys are marked as Tb0, Tb0.5, Tb1, Tb2, and Tb5. The six re-melts were to ensure a uniform alloy composition. The cast samples were sealed in quartz tubes under a pressure of 10−3 Pa, then annealed at 1123 K for 24 h, and then quenched in ice water for homogeneity.
The microstructure of the alloys at room temperature was examined using an Olympus metallographic microscope and scanning electron microscopy (SEM, TESCAN VEGA3-SBH) equipped with energy dispersive X-ray spectroscopy (EDS). The samples were etched using 4% picric acid. The crystal structure at room temperature was determined by X-ray diffraction (XRD, Rigaku D/max-Rb with Cu Kα radiation). The transformation temperatures were determined by differential scanning calorimetry (DSC) measurements with the TA-2920. The heating and cooling rates were 20 K/min. The compression tests were performed at room temperature on an Instron 5569 testing system at a crosshead displacement speed of 0.1 mm/min, and the size of the sample was 3 mm × 3 mm × 5 mm. Fractography was observed by SEM to study the dominant fracture behavior in this alloy system.
3. Results and Discussion
3.1. Structure
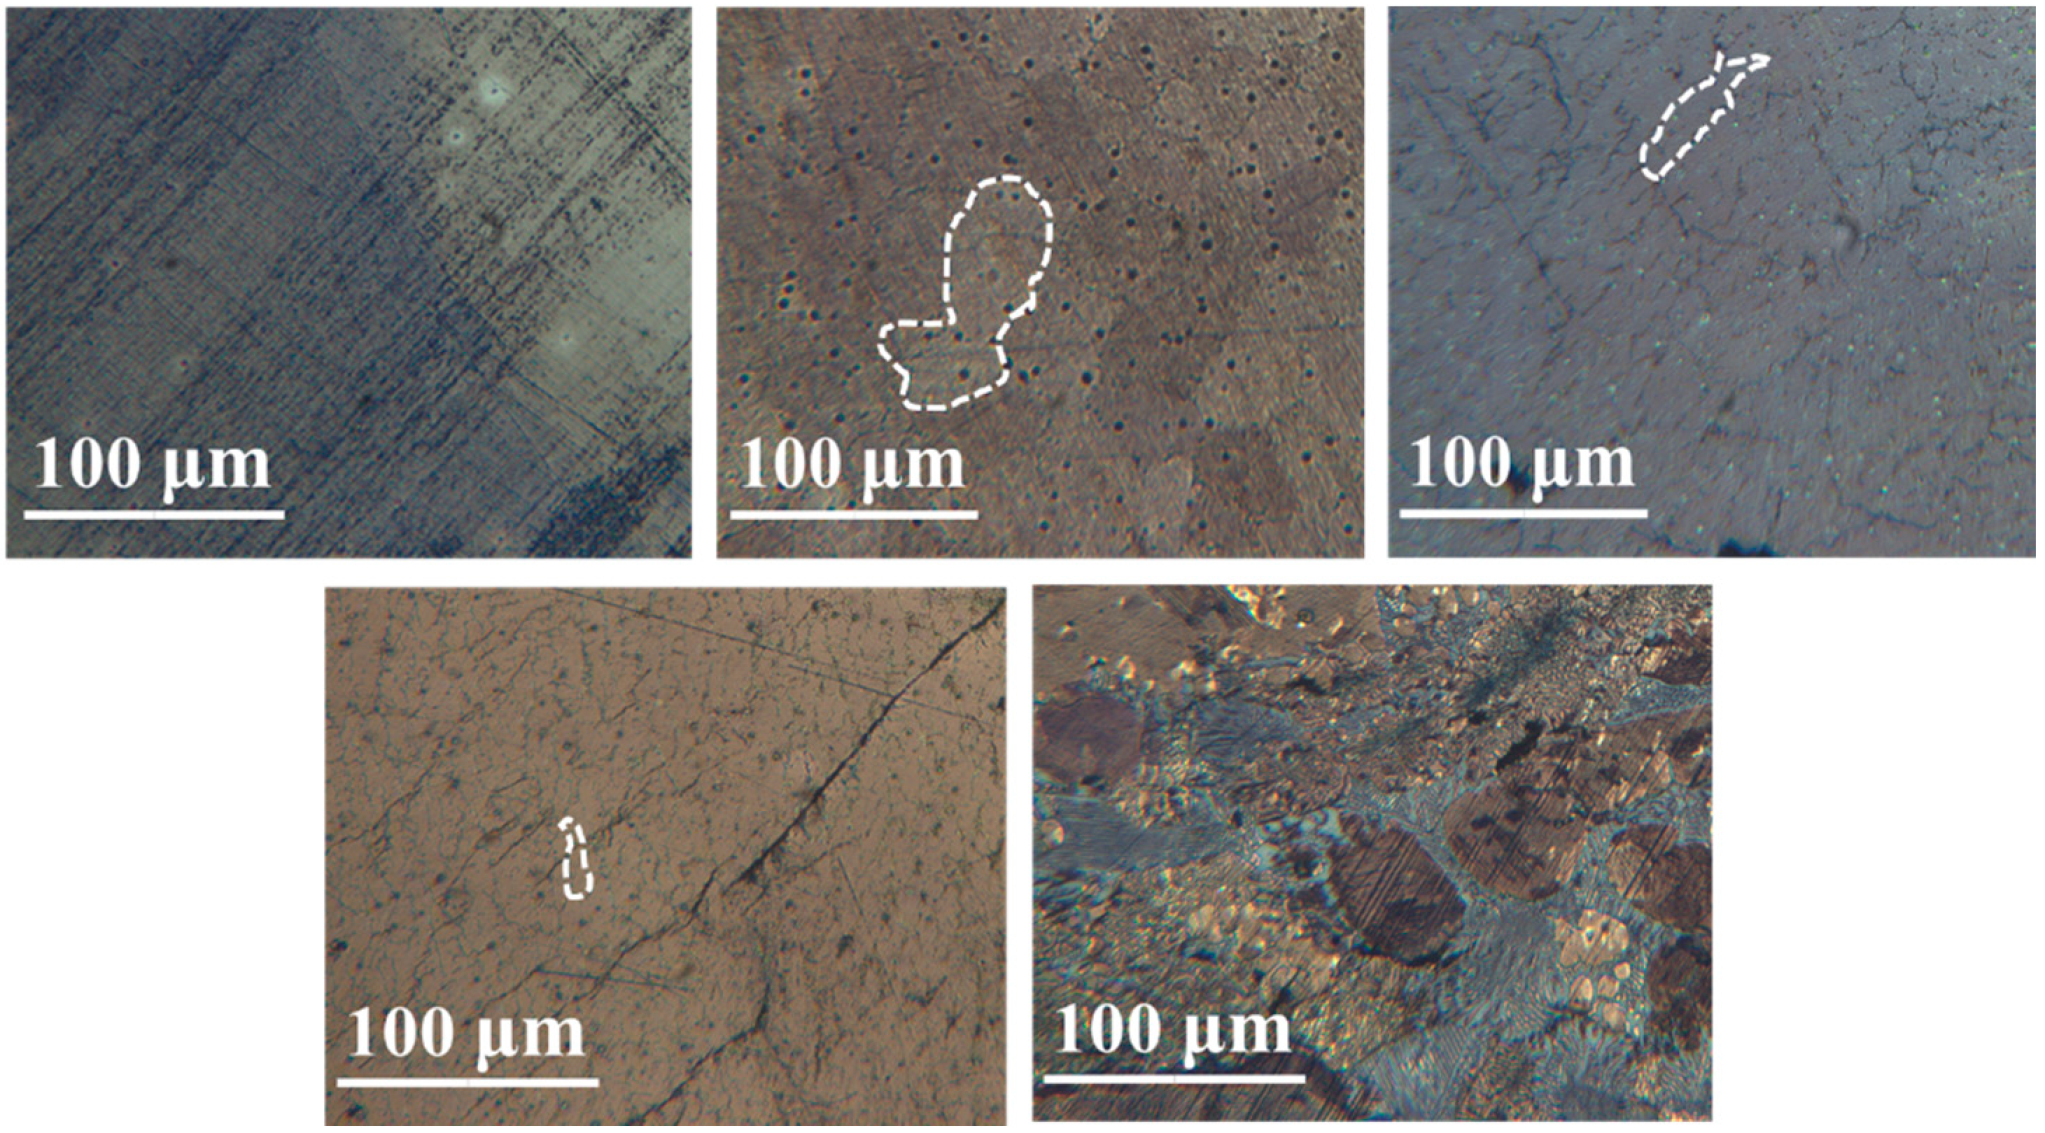
Figure 1 shows the optical micrographs of solution-treated Ni48Mn39Sn13−xTbx (x = 0, 0.5, 1, 2, and 5) alloys at room temperature. Evidently, it can be seen that the grain size of Ni48Mn39Sn13 alloy decreased with an increase in Tb content. From Figure 1a we can find that the microstructure of Ni48Mn39Sn13 alloy without Tb addition consisted of coarser equiaxed grains, and the grain size was approximately 160 μm. The grain size of the Ni48Mn39Sn13−xTbx (x = 0, 0.5, 1, 2, and 5) alloys was reduced significantly by Tb addition. In the optical micrographs, the grains were marked by white dashed lines approximately. When the content of Tb addition was 2 at.%, the average grain size was reduced to 10 μm. These results were consistent with those obtained in the previous investigations when adding rare earth elements into the single martensite Ni-Mn-Ga alloys [31]. In addition, with the addition of Tb, the second phase appeared and distributed sporadically. With the further addition of Tb, the second phase increased and distributed along the grain boundaries. A network-like distribution and local enrichment of the second phase were also observed in the Ni48Mn39Sn11Tb2 alloy, as shown in Figure 1d. As to the Ni48Mn39Sn8Tb5 alloy, when the content of Tb further increased to 5 at.%, the optical micrograph showed the significantly different microstructure with other alloys. With excessive Tb addition, the amount of the second phase increased abundantly, and more and more Tb-rich phase enriched. And the distribution of the second phase was not uniform. Such that the matrix was segregated into many small islands. In this case, the grain boundaries were different and blurry, just as shown in Figure 1e.
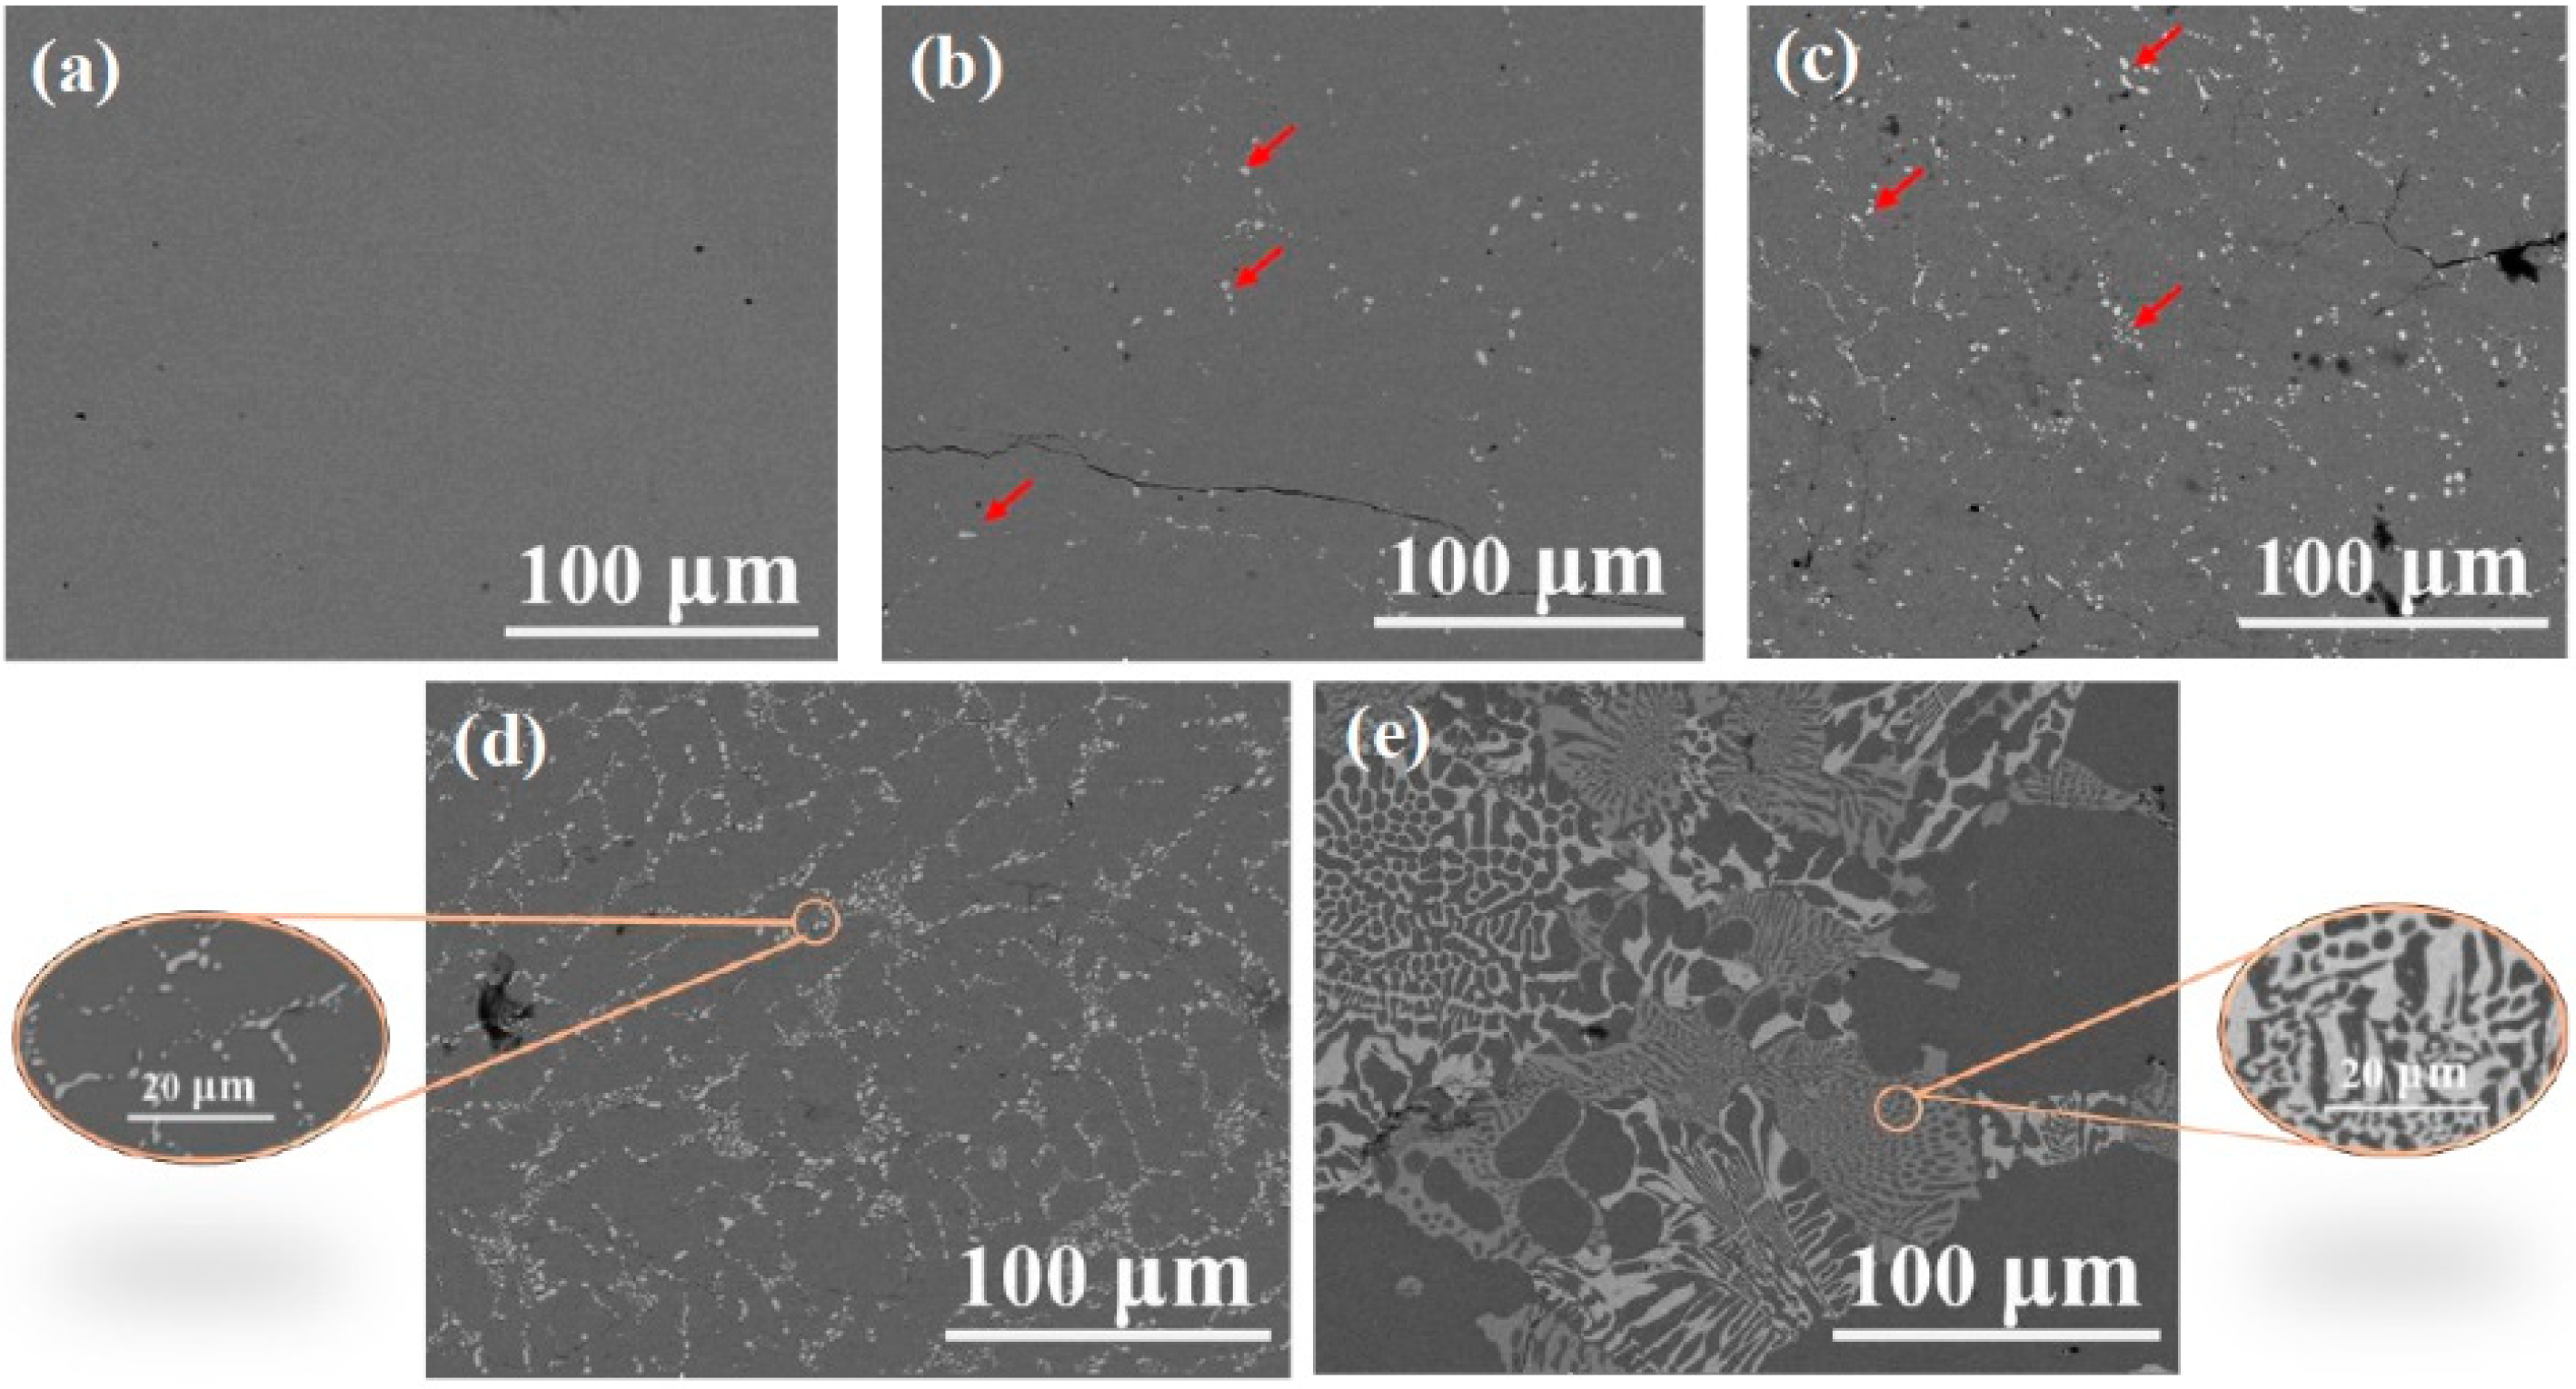
In order to ascertain the possibility of the second phase segregation in the present samples, detailed microstructural studies have been carried out by using SEM. Figure 2 shows the backscattered electron images of Ni48Mn39Sn13−xTbx (x = 0, 0.5, 1, 2, and 5) alloys. It can be seen that a segregation occurred at the grain boundaries. This was consistent with the results of the optical micrographs. Different as compared to the alloy without Tb addition shown in Figure 2a, the other micrographs show a dual-phase microstructure with the black matrix and the white second phase. Apparently, rare earth element Tb addition changed the microstructure of Ni48Mn39Sn13 alloy. Ni48Mn39Sn13 alloy showed the structure with single phase. The white second phase was observed in all of the samples with Tb addition. As the Tb content increased gradually, the size, quantity and distribution of the second phase were different. When the content of Tb was 0.5 at.%, some small granular second phases distributed sporadically in the matrix, as indicated by the arrows shown in the Figure 2b. When the content of Tb was 1 at.%, the second phase increases and the volume fraction increased gradually, then tended to distribute along the grain boundaries, as shown by the arrows in Figure 2c. When the content of Tb increased to 2 at.%, the second phases along the grain boundaries began to connect to each other, then distributed like network and enriched locally. It is worth noting that the structure was completely different with the other alloys with Tb addition, as shown in the magnification of region in Figure 2e. From the magnification of region, the Ni48Mn39Sn8Tb5 alloy was consistent with the black matrix and second phase, which showed a eutectic structure like “chrysanthemum”. The second phase were lamellar in the grains, whereas those along the grain boundaries were irregular and had a larger size than those in the grains.
In order to further investigate the detailed composition of the second phase, the composition of matrix and second phase of the Ni48Mn39Sn13−xTbx (x = 0, 0.5, 1, 2, and 5) alloys are listed in Table 1. Each of these data is the average of five collection points. From the Table 1, it is found that the second phase (white areas) consisted of the elements Ni, Mn, Sn, and Tb. Compared to the composition of the matrix, the Tb content and Sn content of the second phase was higher, and the Ni content decreased slightly, while the Mn content was lower. Moreover, it was found that Tb addition had an obvious effect on the composition of the matrix. The nominal composition of these alloys was Ni48Mn39Sn13−xTbx (x = 0, 0.5, 1, 2, and 5), namely the content of Ni and Mn remained unchanged. While the EDS results show that the Mn content of matrix increased with the Tb addition, which was up to 43.78 at.% in the Ni48Mn39Sn8Tb5 alloy from 39.12 at.% in Ni48Mn39Sn12.5Tb0.5 alloy. Because the martensitic transformation temperature is sensitive to the composition of the alloy, this change will have a significant effect on the martensitic transformation behavior and mechanical properties of these alloys. It will be discussed in the next parts. Compared with the Tb content of the matrix and the second phase, the solubility of rare earth element Tb in the matrix was less than 0.2%, while the solubility of rare earth element Tb in the second phase was very high in the range from 11.31 at.% to 14.18 at.%. Through these results, we recognize that the second phase was Tb-rich phase. As we all know, the atom sizes of Ni, Mn and Sn are 0.124 nm, 0.129 nm and 0.158 nm, respectively, while the atom size of Tb is 0.178 nm. We recognize that the low solubility of rare earth element Tb in the matrix may be attributed to the large atom size of Tb.
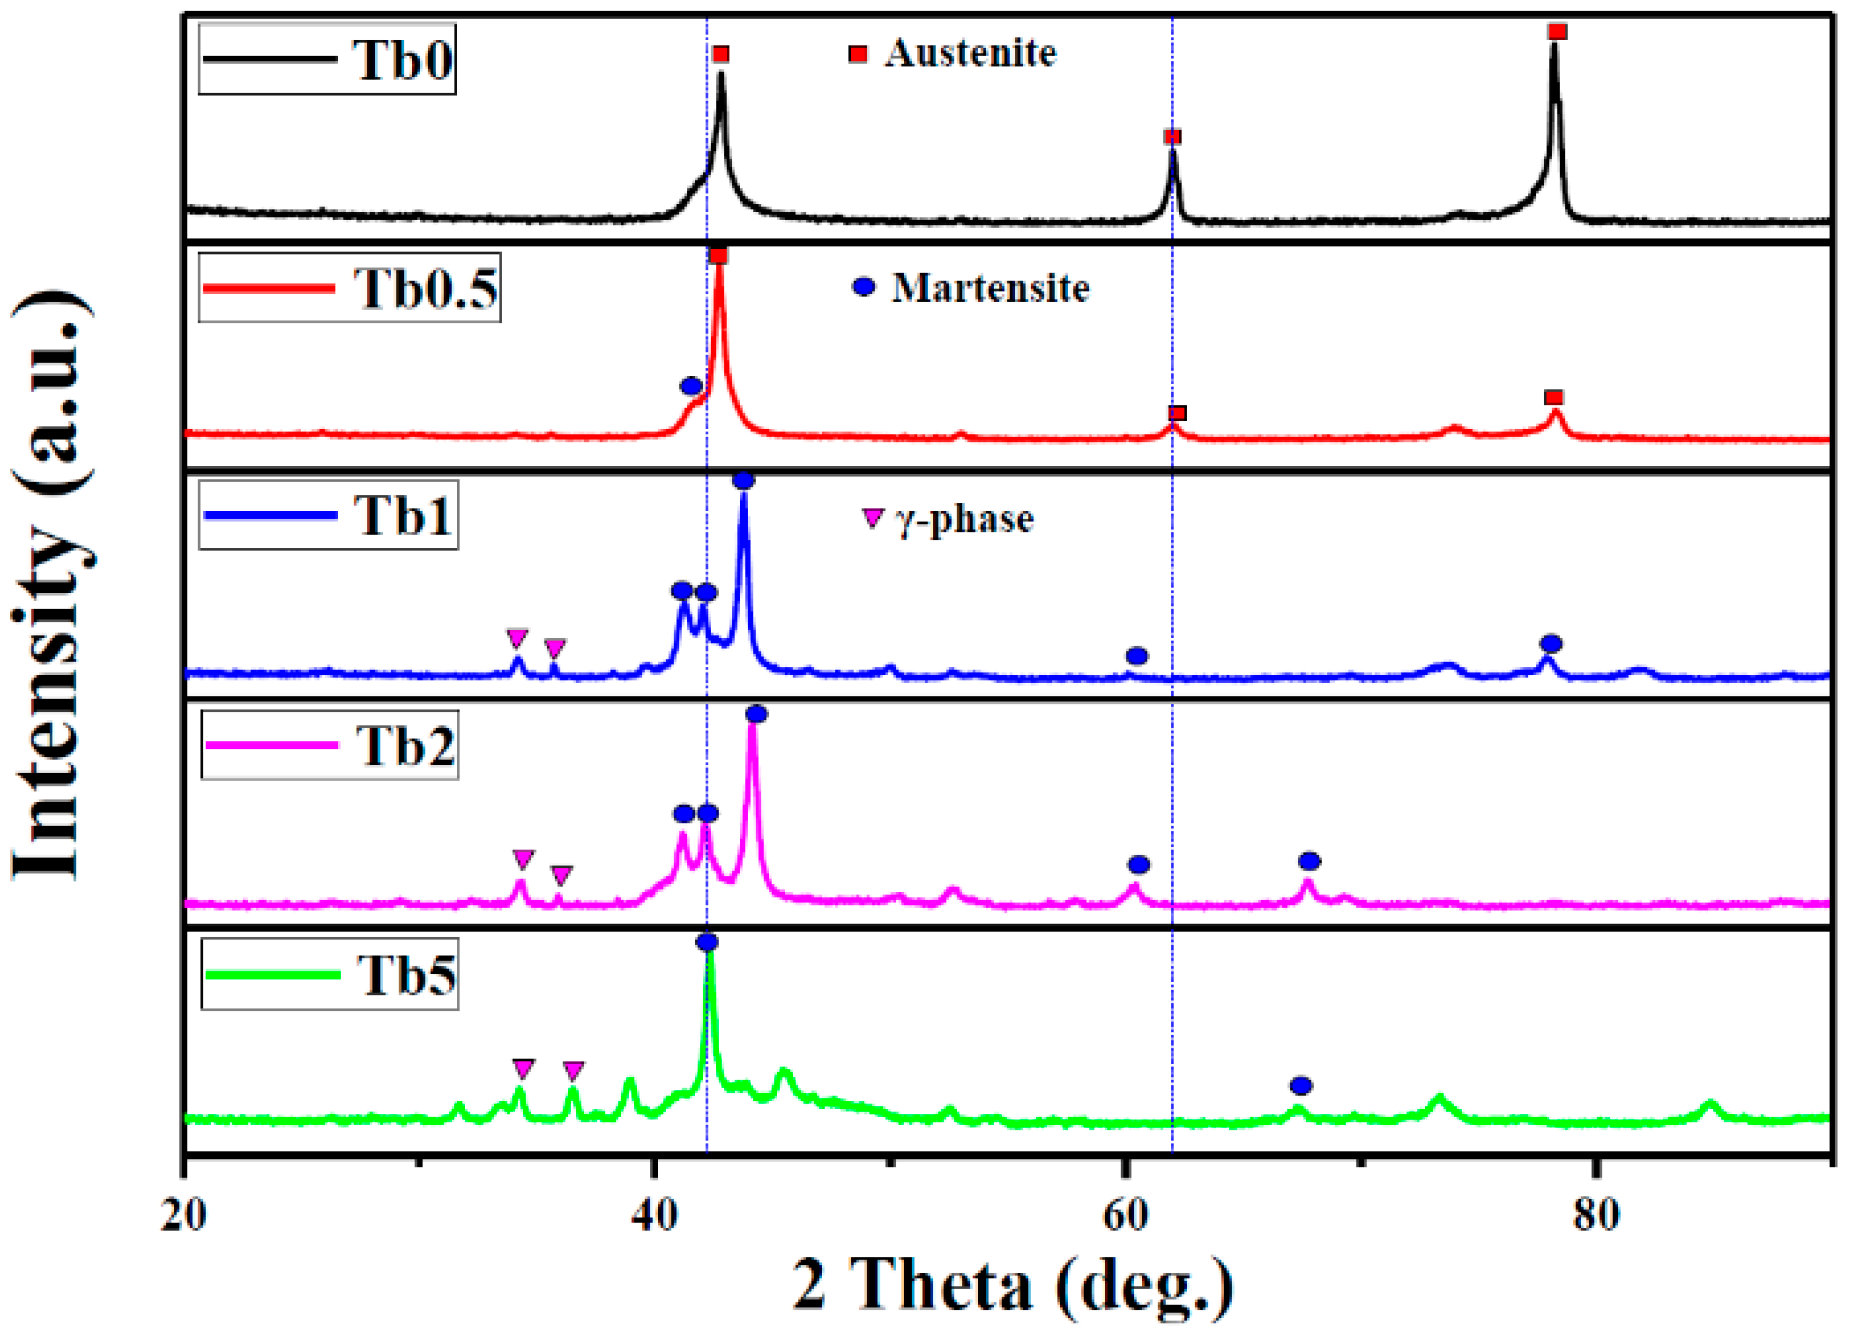
To further confirm the structure of the alloys and the second phase, X-ray diffraction patterns of Ni48Mn39Sn13−xTbx (x = 0, 0.5, 1, 2, and 5) alloys at room temperature are shown in Figure 3. Compared with the reflection of Ni-Mn-Sn alloys reported by Krenke et al., the main reflection peaks corresponding to the cubic austenite were marked by the red squares [32]. The main reflection peaks corresponding to the martensite were marked by the blue circles, and some extra reflection peaks corresponding to the γ-phase are marked by the pink triangles. From the XRD patterns, the typical diffraction peaks from austenite can be clearly seen in the Tb0 and Tb0.5 samples. They show the single austenite crystal structure, which can be indexed by the L21 structure. Because the martensitic transformation temperature was below the room temperature, these two samples all showed the austenite crystal structure at room temperature. As to the details of the martensitic transformation temperature, we will discuss them in the next parts later. A small difference with the Tb0 sample, a weak γ-phase peak appeared. With the further increase of Tb content, when the content of Tb was 1 at.%, the Ni48Mn39Sn12Tb1 alloy showed a more complicated case, exhibiting a mixed structure of the cubic austenite phase, orthorhombic martensite phase, and the γ-phase. The Ni48Mn39Sn11Tb2 alloy presented a two-phase structure, with the γ-phase and the orthorhombic martensite phase. When the Tb content increased to 5 at.%, the peaks of martensite phase became weak, while the peaks of the γ-phase became stronger. The SEM observation mentioned above indicates that the amount of Tb-rich phase in the Ni48Mn39Sn8Tb5 alloy was greater than that in the other alloys. Thus, it is speculated that these unknown peaks may be from the Tb-rich phase.
3.2. Martensitic Transformation
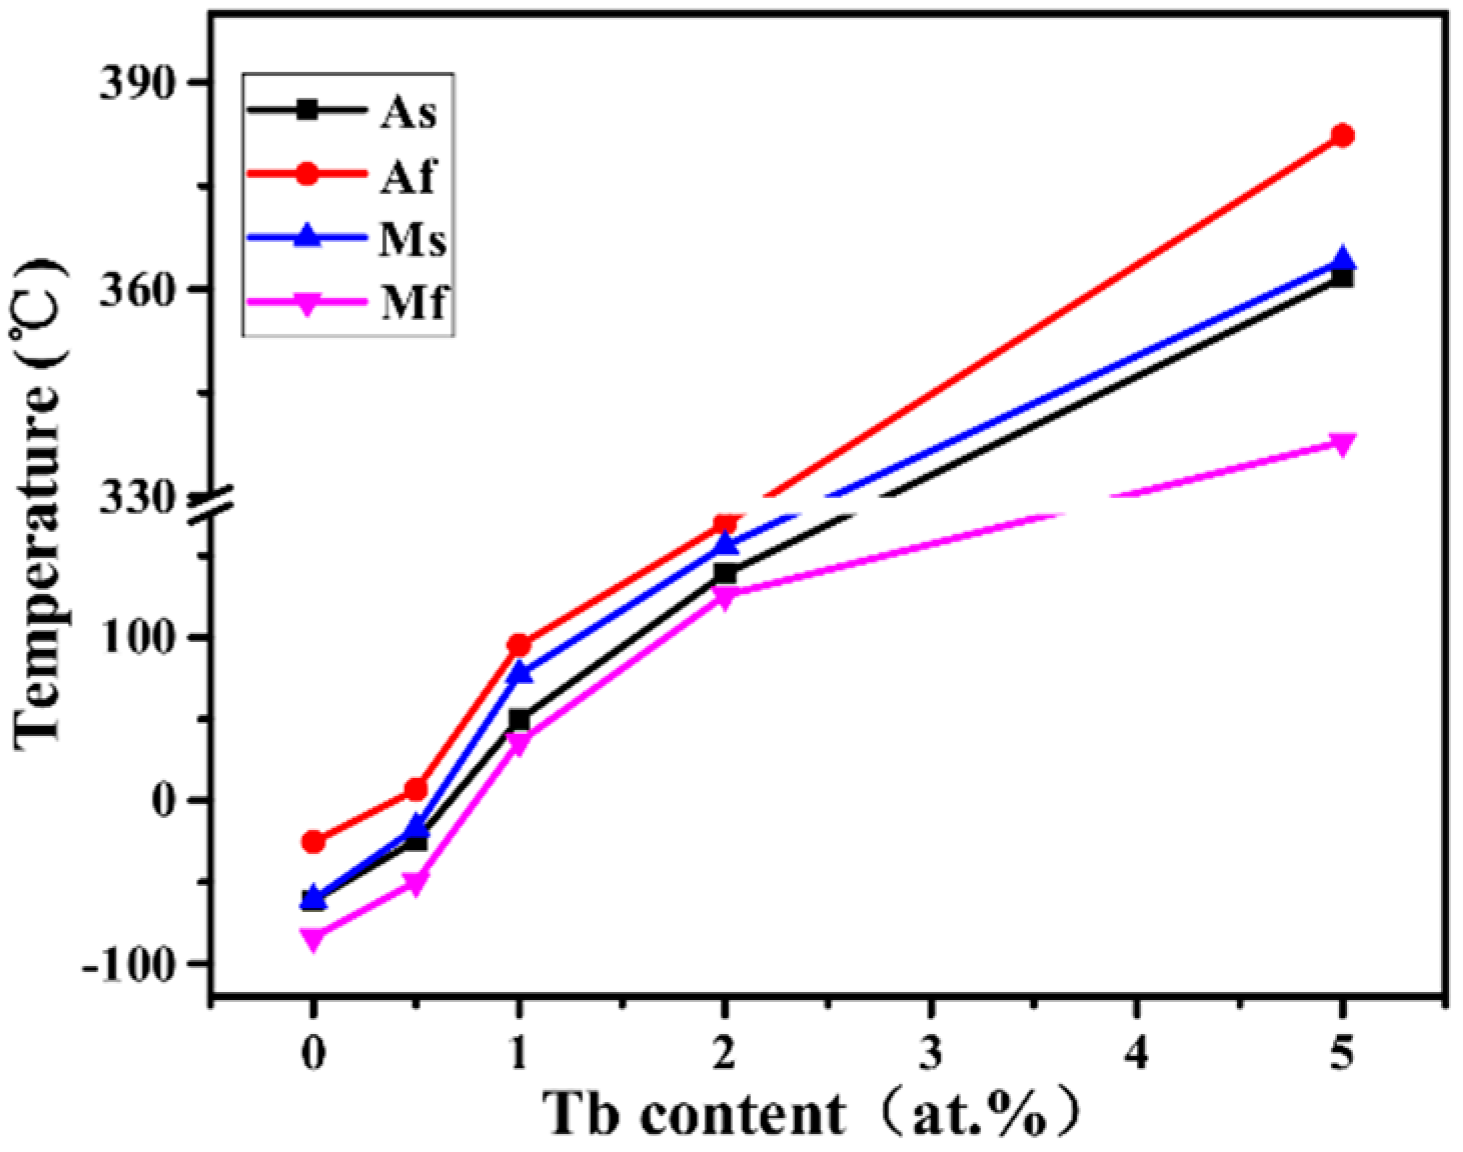
Figure 4 shows the DSC curves of the Ni48Mn39Sn13−xTbx (x = 0, 0.5, 1, 2, and 5) alloys. The martensitic transformation was detected over the whole composition range, as evidenced by the endothermic and exothermic peaks observed upon the heating and cooling cycles respectively. Table 2 lists the martensitic transformation starting and finishing temperatures (Ms, Mf), and the austenite starting and finishing temperature (As, Af). The transformation temperatures were taken as the intersection point of two baselines, as shown in Figure 4. The typical DSC curves in the Ni48Mn39Sn13 alloy and Ni48Mn39Sn12.5Tb0.5 alloy exhibited the exothermic peak on cooling and the endothermic peak during heating, corresponding to the martensitic and reverse transformations, respectively. It is worth noting that a pair of step-like peaks appeared at the same temperature, as shown in the black arrows. We recognize these temperatures were the Curie temperatures of the alloys. We find that small amount of Tb addition did not change the curie temperature. This result was consistent with the previous research [32]. In contrast, the peaks corresponding to the Curie temperature could not be detected when the Tb content was above 1 at.%. It is mainly due to the reverse martensitic transformation temperature being higher than the room temperature. What is more interesting, except for the main peaks, we found that another peak appeared behind them, as indicated by the red circles in the Figure 4. Combined with the analysis mentioned above, with excessive Tb addition, the amount of the second phase increased abundantly, and more and more of the Tb-rich phase was enriched. These unknown peaks may indicate the phase-transition temperatures of the Tb-rich phase. In the present paper, we are not going to explain this in further detail, and we will investigate this phenomenon in future research. In order to observe the changing tendency of the characteristic temperatures, the composition as a function of Ms, Mf, As and Af are plotted in Figure 5. Evidently, it was found that the martensitic transformation characteristic temperatures increased almost linearly with increasing Tb content. The martensitic transformation start temperature, Ms, increased from −60.7 °C for x = 0 to 364.1 °C for x = 5. We all know that the martensitic transformation temperature Ms is sensitive to the composition of alloys. Therefore, the main reason that Tb addition changed the Ms was the change of composition. As above analysis in Table 1, the solubility of Tb in the matrix was found to be very low. The insoluble Tb element segregated mainly at the grain boundaries and formed the Tb-rich phase. The EDS results also showed that the composition of the matrix was changed by the existence of the Tb-rich phase. With the increasing of Tb content, the content of Mn in the matrix increased gradually from 38.58 at.% for x = 0 to 43.78 at.% for x = 5. Whereas the decrease of Sn content occurred due to the substitution of Tb for Sn. At the same time, the content of Ni was almost kept constant. Consequently, the ratio of Mn and Sn increased as the content of Ni was approximately unchanged, which account for the increase of martensitic transformation temperature. This was accordance with the results obtained by Jiang et al. [33]. To verify this, first principles calculations are needed. However, due to the low solubility of Tb element, the Tb ions cannot enter into the lattice of the matrix. It is unreasonable to simulate the Sn atoms being replaced by Tb atoms. Nevertheless, the composition of the matrix was changed, based on adjusting the ratio of the atoms in each unit cell, we may reveal the influence of martensitic transformation behavior. This work will be completed in our future research.
3.3. Mechanical Properties
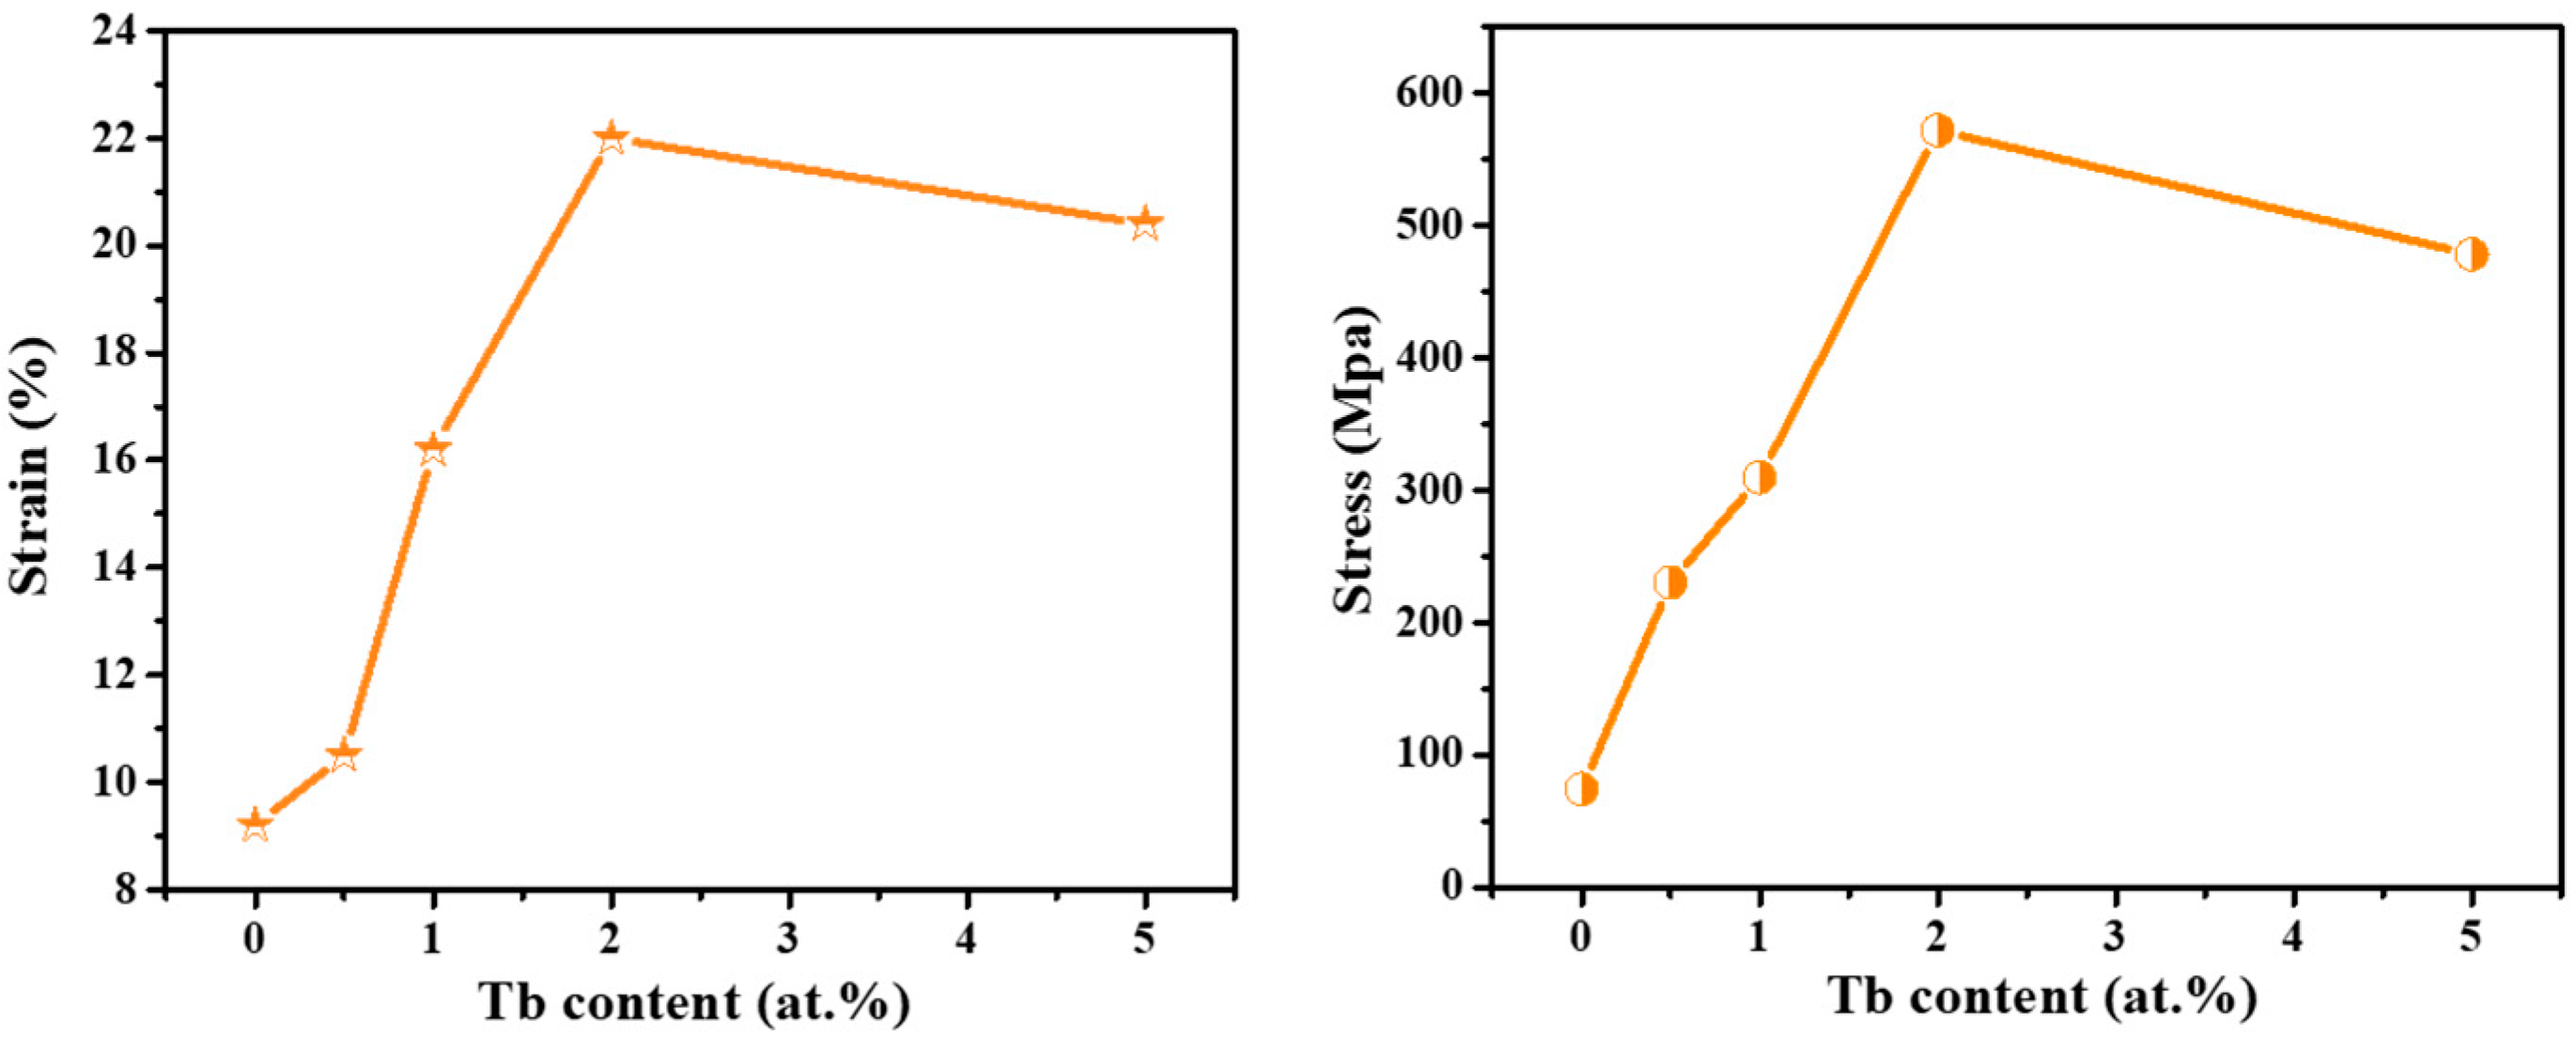
Good mechanical properties play an important role in the practical application of Ni-Mn-Sn FSMAs. In order to obtain the strength and ductility behavior of the Ni48Mn39Sn13−xTbx (x = 0, 0.5, 1, 2, and 5) alloys, the compressive mechanical properties were tested for the alloys. The alloys were loaded at room temperature until failure in compression. Figure 6 shows the representative compressive stress–strain curves. The effect of rare earth element Tb content on the compressive strength and the compressive strain of Ni48Mn39Sn13−xTbx (x = 0, 0.5, 1, 2, and 5) alloys are plotted in Figure 7. As can be seen, without Tb addition, the Ni48Mn39Sn13 alloy had the worse failure stress and strain among the tested alloys. The detected compressive stress and strain were ~74.3 MPa and ~9.2% separately. In Figure 7, it can be seen that both the compressive stress and strain had a strong dependence upon the Tb content. In addition to the Ni48Mn39Sn8Tb5 alloy, the compressive stress and strain of all the other samples increased nearly linearly as Tb content increased. When Tb content was increased to 2 at.%, the compressive strain was evidently increased to 22.0%, and the compressive stress was significantly improved to 571.8 MPa. As to the Ni48Mn39Sn8Tb5 alloy, when the content of Tb further increased to 5 at.%, the compressive stress and strain decreased slightly compared with that of Ni48Mn39Sn11Tb2 alloy. But the mechanical property of Ni48Mn39Sn11Tb2 alloy was still much better than that of alloy without Tb addition. The best comprehensive mechanical property was effectively hindering the movement of dislocations and the propagation of cracks, which was the reason for the enhancement of the compressive strength and strain. As mentioned before, the grain size of the Ni48Mn39Sn13−xTbx (x = 0, 0.5, 1, 2, and 5) alloys decreased with increases of Tb content. It appears that the refinement of grain size had a beneficial effect on the strength and ductility of the alloys. Moreover, the size and distribution of Tb-rich phase played an important role in the improvement of mechanical properties. With increasing Tb addition, the Tb-rich phase grew and tended to distribute along the grain boundaries. The existence of Tb-rich phase at the grain boundaries effectively hindered the movement of dislocation and the propagation of cracks, which was also the key to improving the mechanical properties of alloys. Some researchers have found that a large amount of Re(Ni,Mn)4Ga phases can improve the compressive ductility and strength of single phase martensitic Ni50Mn29Ga21 alloys [24,26]. However, here we found that a large number of Tb-rich phases played a negative role in the ductility improvement in two-phase Ni-Mn-Sn-Tb alloys. It was confirmed that the Re-rich phase is a hard-brittle phase, which might fracture earlier than the matrix in the deformation process and form a large number of defects, leading to a drop in mechanical performance [34]. This might be the reason why the alloys showed the drop in mechanical performance when the Tb addition was 5 at.%. All these above clearly indicated that the proper amount of Tb addition significantly improved the compressive strength and enhanced the ductility of the alloys.
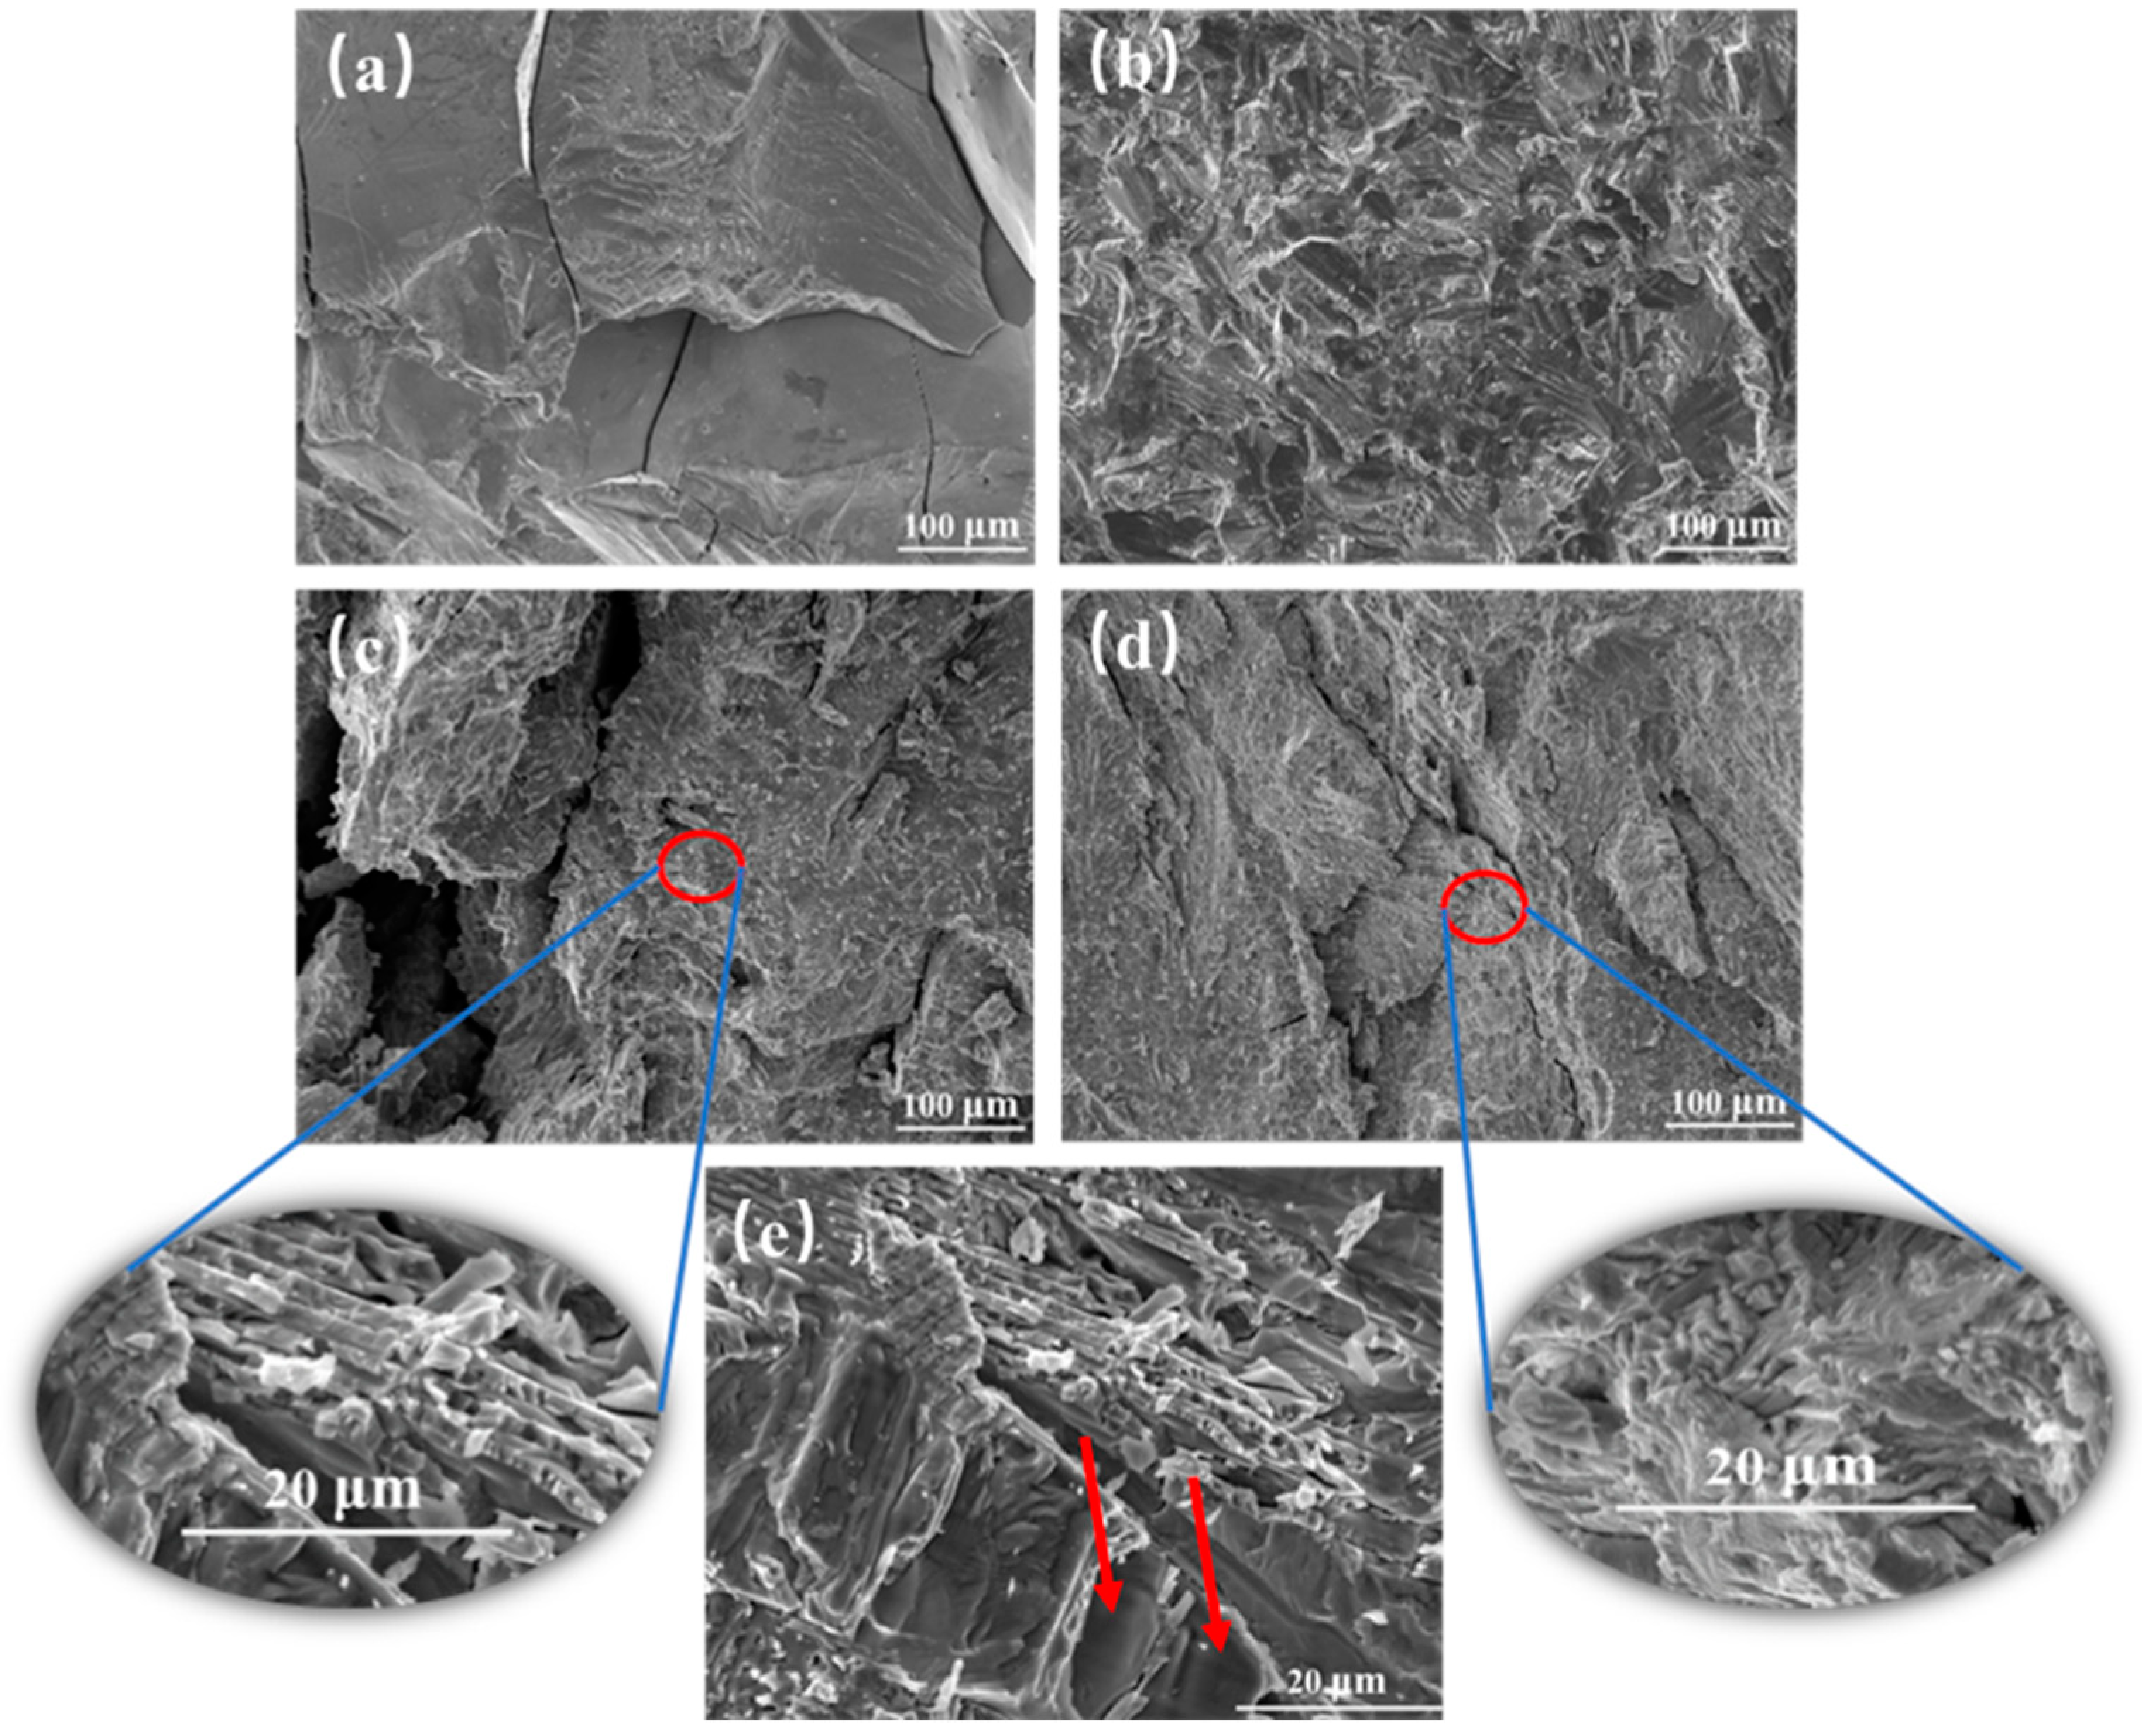
In order to further clarify the fracture mechanism, the fracture morphologies of Ni48Mn39Sn13−xTbx (x = 0, 0.5, 1, 2, and 5) alloys after compressing were observed, as shown in Figure 8. With the addition of Tb, the compactness of alloys was increased, which can be seen intuitively in Figure 8a–d. It was consistent with the above that Tb can refine the grain size. Figure 8a shows the fractograph of the alloy without Tb addition. The fracture surface was smooth and the edge was clear. It shows the typical brittle fracture along the grain boundaries. Due to the binding strength of the coarse grains were weak, the fracture originated from the grain boundary separation. The coarse grains and the intergranular fracture show the poor mechanical properties of the Ni48Mn39Sn13 alloy, which was consistent with the results of the compressive stress-strain curves shown in Figure 6. For the Ni48Mn39Sn12.5Tb0.5 alloy, transgranular cracks with tearing edges were observed as shown in the Figure 8b. It shows characteristics of ductile transgranular fracture and plastic deformation occurred before fracturing. With the further addition of Tb, lots of dimples with tearing ridges appeared, and the alloys exhibited cleavage fracture, as shown in the Figure 8c,d. The type of fracture changeed from intergranular fracture to transgranular fracture. Different to the alloy without Tb addition, in Ni48Mn39Sn11Tb2 alloy, the fracture occurred within the grain, then the fracture grew past the grain boundary. This indicates that Tb addition strengthened the grain boundary. From the before mentioned microstructures of Ni48Mn39Sn13−xTbx (x = 0, 0.5, 1, 2, and 5) alloys, it was shown that the grain size of Ni48Mn39Sn11Tb2 alloy was significantly reduced. More energy was needed when the fracture grew, because the crack propagation had to change direction several times to move through the grain boundary. This led directly to the difficulty in the formation and propagation of the fracture. Therefore, we recognize that grain refinement was the main reason for the alloy’s plasticity enhancement. In addition, the alloy contained some Tb-rich phase, which distributed along the grain boundaries discontinuously. When plastic deformation occurred, the cracks grown along the grain boundaries were retarded by the Tb-rich phase. These two reasons mentioned above, improved the mechanical properties of the Ni48Mn39Sn11Tb2 alloy. As to the Ni48Mn39Sn8Tb5 alloy, it showed a distinct difference with others, as shown in Figure 8e. It can be seen that the second phases with large size were torn off from the matrix, as shown with arrows in Figure 8e. For higher volumes of Tb-rich phase, the hard-brittle phase distributed like network along the grain boundaries and enriched locally. This led to the continuity of the matrix being destroyed. With excessive Tb addition, more and more Tb-rich phases were enriched. When plastic deformation occurred, the cracks generated preferentially and propagated rapidly along the phase boundary of the matrix and Tb-rich phase. It resulted in the increase in the brittleness.
4. Conclusions
In the present work, the martensitic transformation behaviors, microstructure, and mechanical properties of solution-treated Ni48Mn39Sn13−xTbx (x = 0, 0.5, 1, 2, and 5 at.%) alloys were investigated. The obtained results are as follows:
- The results show that Tb addition refines significantly the grains and causes the formation of a Tb-rich phase. With the increase in Tb content, the Tb-rich phase became larger and tended to distribute along the grain boundaries.
- Martensitic transformation was observed in all Ni48Mn39Sn13−xTbx (x = 0, 0.5, 1, 2, and 5 at.%) alloys. The martensitic transformation temperatures increased remarkably with the increase in Tb content. The martensitic transformation start temperature Ms increased from −60.7 °C for x = 0 to 364.1 °C for x = 5.
- The appropriate amount (2 at.%) of Tb addition in Ni48Mn39Sn13−xTbx (x = 0, 0.5, 1, 2, and 5 at.%) alloys significantly enhanced the compressive strength and improved the ductility, which can be ascribed to the grain refinement. The compressive stress and strain increased, firstly with increasing Tb content up to 2 at.%, and then decreased with the further increased Tb content. The compressive stress increased from 74.3 MPa to 571.8 MPa and the compressive strain increased from 9.2% to 22.0% with increasing Tb content from 0 at.% to 2 at.%.
- When the content of Tb addition was less 2 at.%, the fracture type changed from intergranular fracture to transgranular fracture with increasing Tb content, which was due to strengthening of the grain boundary with increasing Tb content. However, when the amount exceeded 2 at.%, the large amount of Tb-rich phase, hard-brittle phase, had a negative effect on the mechanical properties.
Author Contributions
K.Z. conceived and designed the experiments; X.T., K.Z. and C.T. performed the experiments; C.T., E.G. analyzed the data; K.Z., C.T. and X.T. wrote the paper.
Acknowledgments
The authors acknowledge the support of National Natural Science Foundation of China (Grant Nos. 51471064 and 51301054); and Program for Youth Academic Backbone in Heilongjiang Provincial University (Grant No.1251G022); and Scientific Research Fund of Heilongjiang Provincial Education Department (No: 12541138).
Conflicts of Interest
The authors declare no conflicts of interest.
References
- Ullakko, K.; Huang, J.K.; Kantner, C.; O’Handley, R.C.; Kokorin, V.V. Large Magnetic-Field-Induced Strain in Ni2MnGa. Appl. Phys. Lett. 1996, 69, 1966–1968. [Google Scholar] [CrossRef]
- Sutou, Y.; Imano, Y.; Koeda, N.; Omori, T.; Kainuma, R.; Ishida, K.; Oikawa, K. Magnetic and martensitic transformations of NiMnX(X = In,Sn,Sb) ferromagnetic shape memory alloys. Appl. Phys. Lett. 2004, 85, 4358–4360. [Google Scholar] [CrossRef]
- Murray, S.J.; Marioni, M.; Allen, S.M.; O’Handley, R.C.; Lograsso, T.A. 6% magnetic-field-induced strain by twin-boundary motion in ferromagnetic Ni–Mn–Ga. Appl. Phys. Lett. 2000, 77, 886–888. [Google Scholar] [CrossRef]
- Kainuma, R.; Imano, Y.; Ito, W.; Sutou, Y.; Morito, H.; Okamoto, S.; Kitakami, O.; Oikawa, K.; Fujita, A.; Kanomata, T.; et al. Magnetic-field-induced shape recovery by reverse phase transformation. Nature 2006, 439, 957–960. [Google Scholar] [CrossRef] [PubMed]
- Sozinov, A.; Soroka, A.; Lanska, N.; Rameš, M.; Straka, L.; Ullakko, K. Temperature dependence of twinning and magnetic stresses in Ni46Mn24Ga22Co4Cu4 alloy with giant 12% magnetic field-induced strain. Scr. Mater. 2017, 131, 33–36. [Google Scholar] [CrossRef]
- Sozinov, A.; Likhachev, A.A.; Lanska, N.; Ullakko, K. 10% magnetic-field-induced strain in Ni-Mn-Ga seven-layered martensite. Appl. Phys. Lett. 2002, 80, 1746–1748. [Google Scholar] [CrossRef]
- Karaca, H.E.; Karaman, I.; Basaran, B.; Chumlyakov, Y.J.; Maier, H.J. Magnetic field and stress induced martensite reorientation in NiMnGa ferromagnetic shape memory alloy single crystals. Acta Mater. 2006, 54, 233–245. [Google Scholar] [CrossRef]
- Karaca, H.E.; Karaman, I.; Basaran, B.; Ren, Y.; Chumlyakov, Y.I.; Maier, H.J. Magnetic Field-Induced Phase Transformation in NiMnCoIn Magnetic Shape-Memory Alloys—A New Actuation Mechanism with Large Work Output. Adv. Funct. Mater. 2009, 19, 983–998. [Google Scholar] [CrossRef]
- Soroka, A.; Sozinov, A.; Lanska, N.; Rameš, M.; Straka, L.; Ullakko, K. Composition and temperature dependence of twinning stress in non-modulated martensite of Ni-Mn-Ga-Co-Cu magnetic shape memory alloys. Scr. Mater. 2018, 144, 52–55. [Google Scholar] [CrossRef]
- Bischoff, A.J.; Mayr, S.G. Acoustic emissions associated with stress-induced twin boundary mobility in Fe7Pd3 ferromagnetic shape memory alloys. Scr. Mater. 2017, 139, 162–165. [Google Scholar] [CrossRef]
- Xuan, H.C.; Deng, Y.; Wang, D.H.; Zhang, C.L.; Han, Z.D.; Du, Y.W. Effect of annealing on the martensitic transformation and magnetoresistance in Ni–Mn–Sn ribbons. J. Phys. D Appl. Phys. 2008, 41, 215002. [Google Scholar] [CrossRef]
- Chatterjee, S.; Giri, S.; Majumdar, S.; De, S.K. Giant magnetoresistance and large inverse magnetocaloric effect in Ni2Mn1.36Sn0.64 alloy. J. Phys. D Appl. Phys. 2009, 42, 065001. [Google Scholar] [CrossRef]
- Krenke, T.; Duman, E.; Acet, M.; Wassermann, E.F.; Moya, X.; Manosa, L.; Planes, A. Inverse magnetocaloric effect in ferromagnetic Ni-Mn-Sn magnetic alloys. Nat. Mater. 2005, 4, 450–454. [Google Scholar] [CrossRef] [PubMed]
- Liu, J.; Gottschall, T.; Skokov, K.P.; Moore, J.D.; Gutfleisch, O. Giant magnetocaloric effect driven by structural transitions. Nat. Mater. 2012, 11, 620–626. [Google Scholar] [CrossRef] [PubMed]
- Castillo-Villa, P.O.; Manosaet, L.; Planes, A.; Frontera, C. Elastocaloric and magnetocaloric effects in Ni-Mn-Sn (Cu) shape-memory alloy. Appl. Phys. 2013, 113, 053506. [Google Scholar] [CrossRef]
- Pecharsky, V.K.; Gschneidner, K.A.G., Jr. Giant magnetocaloric effect in Gd5(Si2Ge2). Phys. Rev. Lett. 1997, 78, 4494–4497. [Google Scholar] [CrossRef]
- Tegus, O.; Brück, E.; Buschow, K.H.J.; Boer, F.R.D. Transition-metal-based magnetic refrigerants for room-temperature applications. Nature 2002, 415, 150–152. [Google Scholar] [CrossRef] [PubMed]
- Franco, V.; Conde, A. Magnetic refrigerants with continuous phase transitions: Amorphous and nanostructured materials. Scr. Mater. 2012, 67, 594–599. [Google Scholar] [CrossRef]
- Moya, X.; Kar-Narayan, S.; Mathur, N.D. Caloric materials near ferroic phase transitions. Nat. Mater. 2014, 13, 439–450. [Google Scholar] [CrossRef] [PubMed]
- Sandeman, K.G. Magnetocaloric materials: The search for new systems. Scr. Mater. 2012, 67, 566–571. [Google Scholar] [CrossRef] [Green Version]
- Caron, L.; Ou, Z.Q.; Nguyen, T.T.; Cam Thanh, D.T.; Tegus, O.; Brück, E. On the determination of the magnetic entropy change in materials with first-order transitions. J. Magn. Magn. Mater. 2009, 321, 3559–3566. [Google Scholar] [CrossRef]
- Shen, B.G.; Sun, J.R.; Hu, F.X.; Zhang, H.W.; Cheng, Z.H. Recent progress in exploring magnetocaloric materials. Adv. Mater. 2009, 21, 4545–4564. [Google Scholar] [CrossRef]
- Sun, W.; Liu, J.; Zhao, D.; Zhang, M. Directional solidification and elastocaloric effect in a Ni45Mn44Sn11 magnetic shape memory alloy. J. Phys. D Appl. Phys. 2017, 50, 444001. [Google Scholar] [CrossRef]
- Cai, W.; Gao, L.; Liu, A.L.; Sui, J.H.; Gao, Z.Y. Martensitic transformation and mechanical properties of Ni–Mn–Ga–Y ferromagnetic shape memory alloys. Scr. Mater. 2007, 57, 659–662. [Google Scholar] [CrossRef]
- Singh, R.K.; Raja, M.M.; Mathur, R.P.; Shamsuddin, M. Studies on ferromagnetic shape memory Ni–Mn–Ga alloys with Fe and rare-earths additives. J. Alloys Compd. 2010, 506, 73–76. [Google Scholar] [CrossRef]
- Zhang, X.; Sui, J.H.; Yu, Z.L.; Cai, W. Structure and shape memory effect in a Ni54Mn25Ga20Gd1 alloy with a high transformation temperature. J. Alloys Compd. 2011, 31, 8032–8037. [Google Scholar] [CrossRef]
- Tsuchiya, K.; Tsutsumi, A.; Ohtsuka, H.; Umemoto, M. Modification of Ni–Mn–Ga ferromagnetic shape memory alloy by addition of rare earth elements. Mater. Sci. Eng. A 2004, 378, 370–376. [Google Scholar] [CrossRef]
- Tan, C.L.; Zhang, K.; Tian, X.; Cai, W. Effect of Gd addition on microstructure, martensitic transformation and mechanical properties of Ni50Mn36Sn14, ferromagnetic shape memory alloy. J. Alloys Compd. 2016, 692, 288–293. [Google Scholar] [CrossRef]
- Shen, Q.; Zhao, D.; Sun, W.; Li, Y.; Liu, J. The effect of Tb on elastocaloric and mechanical properties of Ni-Mn-In-Tb alloys. J. Alloys Compd. 2017, 696, 538–542. [Google Scholar] [CrossRef]
- Yuce, S.; Barrio, M.; Emre, B.; Stern-Taulats, E.; Planes, A.; Tamarit, J.L.; Mudryk, Y.; Gschneidner, K.A., Jr.; Pecharsky, V.K.; Mañosa, L. Barocaloric effect in the magnetocaloric prototype Gd5Si2Ge2. Appl. Phys. Lett. 2012, 101, 071906. [Google Scholar] [CrossRef]
- Wroblewski, R.; Leonowicz, M.; Zhao, Z.; Liping, J. Structure and properties of Ni–Mn–Ga magnetic shape memory alloys containing minor addition of terbium. J. Magn. Magn. Mater. 2007, 316, e595–e598. [Google Scholar] [CrossRef]
- Planes, A.; Manosaet, L.; Acet, M. Magnetocaloric effect and its relation to shape-memory properties in ferromagnetic Heusler alloys. J. Phys. Condens. Matter 2009, 21, 1425–1438. [Google Scholar] [CrossRef] [PubMed]
- Jiang, C.B.; Muhammad, Y.; Deng, L.F.; Wu, W.; Xu, H.B. Composition dependence on the martensitic structures of the Mn-rich NiMnGa alloys. Acta Mater. 2004, 52, 2779–2785. [Google Scholar] [CrossRef]
- Zhang, X.; Sui, J.H.; Zheng, X.H.; Yang, Z.Y.; Cai, W. Effects of Gd doping on Ni54Mn25Ga21 high-temperature shape memory alloy. Mater. Sci. Eng. 2014, 597, 178–182. [Google Scholar] [CrossRef]
Figure 1.
Optical micrographs of solution treated Ni48Mn39Sn13-xTbx alloys (a) x = 0; (b) x = 0.5; (c) x = 1; (d) x = 2; (e) x = 5.
Figure 1.
Optical micrographs of solution treated Ni48Mn39Sn13-xTbx alloys (a) x = 0; (b) x = 0.5; (c) x = 1; (d) x = 2; (e) x = 5.

Figure 2.
Backscattered electron images of Ni48Mn39Sn13−xTbx alloys (a) x = 0; (b) x = 0.5; (c) x = 1; (d) x = 2; (e) x = 5.
Figure 2.
Backscattered electron images of Ni48Mn39Sn13−xTbx alloys (a) x = 0; (b) x = 0.5; (c) x = 1; (d) x = 2; (e) x = 5.

Figure 3.
X-ray diffraction patterns of Ni48Mn39Sn13−xTbx alloys.

Figure 4.
DSC curves of the Ni48Mn39Sn13−xTbx alloys.
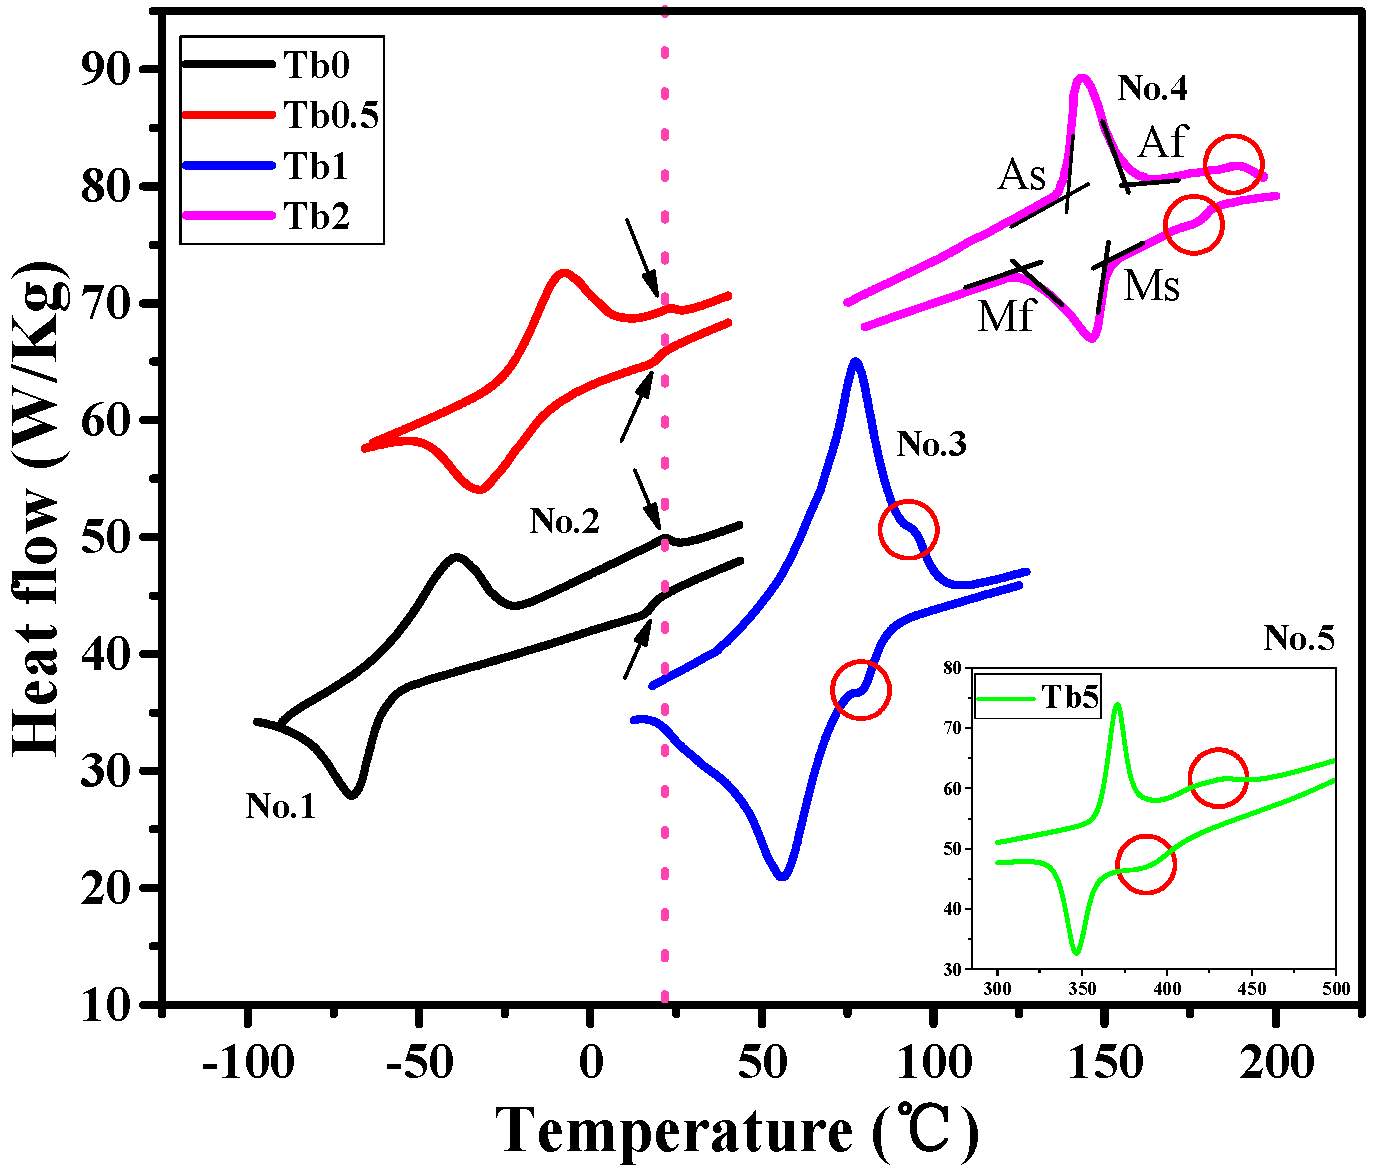
Figure 5.
The effect of Tb content on the phase transformation temperatures of Ni48Mn39Sn13−xTbx (x = 0, 0.5, 1, 2, 5) alloys.
Figure 5.
The effect of Tb content on the phase transformation temperatures of Ni48Mn39Sn13−xTbx (x = 0, 0.5, 1, 2, 5) alloys.

Figure 6.
The compressive stress-strain curves of Ni48Mn39Sn13−xTbx alloys.
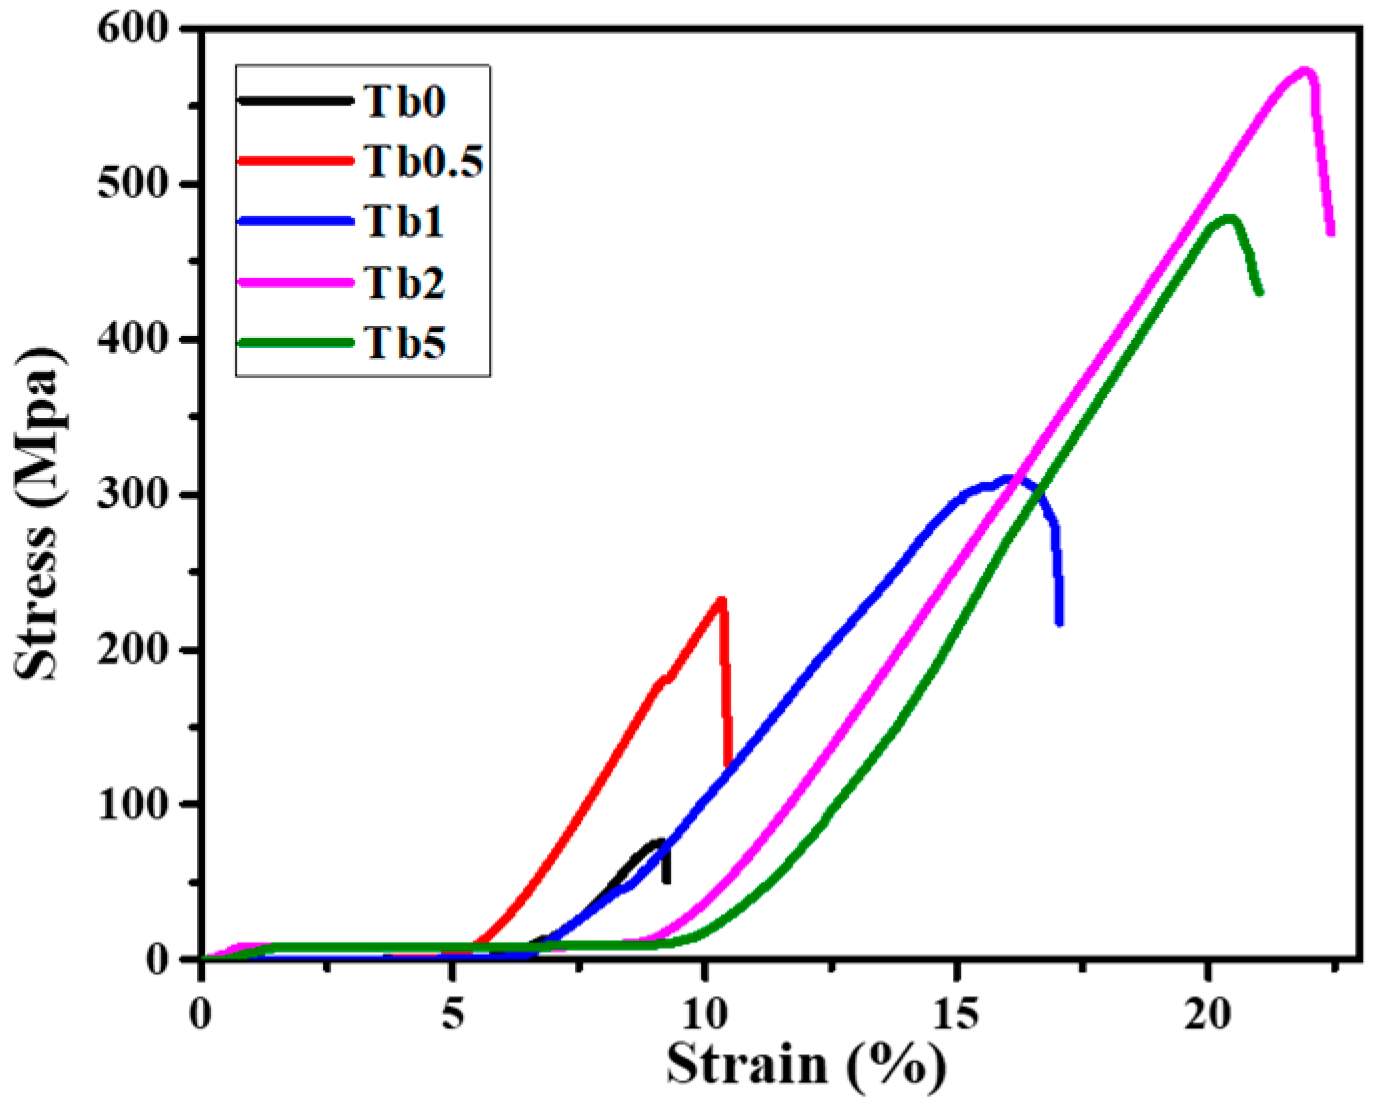
Figure 7.
The effect of Tb content on the compressive strength and the compressive strain of Ni48Mn39Sn13−xTbx alloys.
Figure 7.
The effect of Tb content on the compressive strength and the compressive strain of Ni48Mn39Sn13−xTbx alloys.

Figure 8.
SEM fractographs of Ni48Mn39Sn13−xTbx alloys (a) x = 0; (b) x = 0.5; (c) x = 1; (d) x = 2; (e) x = 5.
Figure 8.
SEM fractographs of Ni48Mn39Sn13−xTbx alloys (a) x = 0; (b) x = 0.5; (c) x = 1; (d) x = 2; (e) x = 5.


Table 1.
The EDS results of Ni48Mn39Sn13−xTbx (at.%).
| Phase | x | Ni | Mn | Sn | Tb |
|---|---|---|---|---|---|
| Matrix | 0 | 47.92 | 38.78 | 13.30 | 0.00 |
| 0.5 | 48.32 | 39.12 | 12.39 | 0.17 | |
| 1 | 48.25 | 40.82 | 10.75 | 0.18 | |
| 2 | 48.78 | 41.47 | 9.58 | 0.17 | |
| 5 | 49.87 | 43.68 | 6.26 | 0.19 | |
| Second phase | 0.5 | 44.78 | 24.03 | 20.88 | 10.31 |
| 1 | 41.85 | 23.70 | 23.27 | 11.18 | |
| 2 | 42.12 | 22.73 | 22.33 | 12.82 | |
| 5 | 41.54 | 21.82 | 22.18 | 14.46 |
Table 2.
The characteristic temperatures of Ni48Mn39Sn13−xTbx alloys (x = 0, 0.5, 1, 2, 5 at. %) denoted as Ms, Mf, As and Af, respectively.
Table 2.
The characteristic temperatures of Ni48Mn39Sn13−xTbx alloys (x = 0, 0.5, 1, 2, 5 at. %) denoted as Ms, Mf, As and Af, respectively.
| Composition | Ms (°C) | Mf (°C) | As (°C) | Af (°C) |
|---|---|---|---|---|
| Ni48Mn39Sn13 | −60.7 | −83.7 | −61.2 | −25.4 |
| Ni48Mn39Sn12.5Tb0.5 | −16.8 | −49.8 | −24.5 | 6.7 |
| Ni48Mn39Sn12Tb1 | 77.4 | 36 | 49.8 | 42.0 |
| Ni48Mn39Sn11Tb2 | 149.7 | 125.8 | 138.9 | 169.7 |
| Ni48Mn39Sn8Tb5 | 364.1 | 337.9 | 361.7 | 382.3 |
© 2018 by the authors. Licensee MDPI, Basel, Switzerland. This article is an open access article distributed under the terms and conditions of the Creative Commons Attribution (CC BY) license (http://creativecommons.org/licenses/by/4.0/).
Share and Cite
MDPI and ACS Style
Tian, X.; Zhang, K.; Tan, C.; Guo, E. Influence of Doping Tb on the Mechanical Properties and Martensitic Transformation of Ni-Mn-Sn Magnetic Shape Memory Alloys. Crystals 2018, 8, 247. https://doi.org/10.3390/cryst8060247
AMA Style
Tian X, Zhang K, Tan C, Guo E. Influence of Doping Tb on the Mechanical Properties and Martensitic Transformation of Ni-Mn-Sn Magnetic Shape Memory Alloys. Crystals. 2018; 8(6):247. https://doi.org/10.3390/cryst8060247
Chicago/Turabian StyleTian, Xiaohua, Kun Zhang, Changlong Tan, and Erjun Guo. 2018. "Influence of Doping Tb on the Mechanical Properties and Martensitic Transformation of Ni-Mn-Sn Magnetic Shape Memory Alloys" Crystals 8, no. 6: 247. https://doi.org/10.3390/cryst8060247
Note that from the first issue of 2016, this journal uses article numbers instead of page numbers. See further details here.