Article

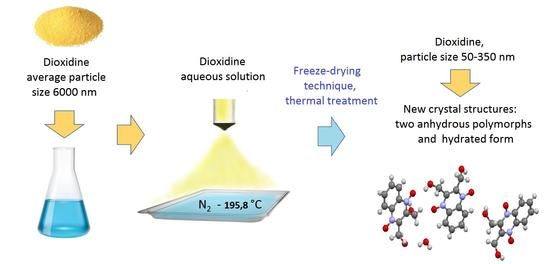
Cryochemically Obtained Nanoforms of Antimicrobial Drug Substance Dioxidine and Their Physico-chemical and Structural Properties

by
Tatyana I. Shabatina
1,2,*,
Olga I. Vernaya
1,
Vladimir P. Shabatin
1,
Iuliia V. Evseeva
1,2,
Michail Ya Melnikov
1,
Andrew N. Fitch
3 and
Vladimir V. Chernyshev
1,4
1
Department of Chemistry, M.V. Lomonosov Moscow State University, Leninskie Gori build. 1/3, Moscow 119991, Russia
2
Bauman Moscow State Technical University, 2nd Bauman Str. 5, Moscow 105905, Russia
3
European Synchrotron Radiation Faculty, B.P. 220, 38043 Grenoble CEDEX, France
4
Frumkin Institute of Physical Chemistry and Electrochemistry RAS, Leninskii prospect 31, Moscow 119071, Russia
*
Author to whom correspondence should be addressed.
Crystals 2018, 8(7), 298; https://doi.org/10.3390/cryst8070298
Submission received: 1 June 2018 / Revised: 3 July 2018 / Accepted: 17 July 2018 / Published: 19 July 2018
(This article belongs to the Section Crystal Engineering)

Abstract

:
Nanoforms of the antimicrobial drug substance 2,3-bis-(hydroxymethyl) quinoxaline-N,N′-dioxide with particles sizes between 50 and 300 nm were obtained by cryochemical modification of the initial pharmaceutical substance using a freeze-drying technique and were characterized by different physicochemical methods (FTIR, UV-Vis, 1H-NMR, DSC, TG and X-ray diffraction) and transmission electron microscopy (TEM). The data obtained from FTIR- and UV–Vis-spectroscopy confirmed the unaltered chemical structure of dioxidine molecules due to the cryochemical modification method. At the same time, X-ray diffraction and thermal analysis data show the change of the crystal structure compared to the parameters of the initial pharmaceutical dioxidine substance. A higher dissolution rate was revealed for cryomodified dioxidine nanoforms. The existence of three polymorphic crystal phases was established for cryomodified dioxidine samples possessed by some thermal activation processes: two anhydrous polymorphic phases, triclinic (T) and monoclinic (M), and one hydrated form (H).

Graphical Abstract

1. Introduction

Development of a new commercial medicine is time-consuming and expensive, and the majority of costs are caused by pre-clinical and clinical research. Health safety of a new drug is one of the top priorities, implying the need for investigation of toxicity, optimal and maximal doses, and side effects that would manifest over decades and even generations. In that respect, obtaining new medications from effectiveness-proven components can reduce the research costs compared to investments into the development of novel drugs from scratch. The techniques of such drug renovation include combination of active pharmaceutical ingredients (API) from different medicines, reduction of ingredient particle size [1,2,3,4,5,6], amorphisation [7,8,9,10], co-crystal formation [1,11,12], self-emulsification [13], pH-modification [14] and complexation [15].
Particle diminution (micronization, nanonization or nanocrystallization) is a powerful approach that can increase the dissolution rate and saturation solubility, subsequently improving the bioavailability of drugs. It may also enhance the skin penetration ability of drugs and decrease systemic side effects [2,5]. Drug nanocrystals can be used for carrier-free colloidal drug delivery systems. According to the definition [2], the drug nanocrystals can be considered as species containing 100% drug substance with particle sizes ranging from 50 to 1000 nm. A stabilizing agent could be located only on their surface.
Nanocrystals of drugs can be created by ‘‘top-down’’ or ‘‘bottom-up’’ approaches, or combinations of the two [5,16]. The “top-down” route refers to the breaking down of larger particles by milling or homogenization, while the “bottom-up” processes imply assembling and controlling of precipitations at nanometer scale. Currently, a number of nanosized dosage forms are presented in the pharmaceutical market. Rapamune® (Sirolimus), Emend® (Aprepitant), Tricor® (Fenofibrate), Megace ES® (Megestrol acetate), Avinza® (Morphine sulfate), Focalin®XR (Dexmethyl-phenidate HCl), Ritalin® LA (Methylphenidate HCl), Zanaflex Capsules™ (Tizanidine HCl) are being obtained using “top-down” technique—wet milling, whereas Triglide® (Fenofibrate) is being produced by the “bottom-up” high-pressure homogenization method [2,5].
Many API solids can exist in more than one crystalline phase—polymorphs. They may form solvates—crystal forms including solvents. If the solvent is water, such forms are called hydrates. APIs can also be amorphous and not possess a distinguishable lattice. All these forms have the same chemical composition, but different solid-state structure, and therefore they may exhibit different physical properties (compatibility, apparent solubility, dissolution rate), solid state chemistry (reactivity), stability and bioavailability.
In order to produce new crystal forms, some special experimental techniques can be used, such as re-crystallization from a single or mixed solvents [8,17,18] using supercritical fluids [19,20], cryochemical sublimation of frozen solutions (freeze drying technique) [21,22,23,24], thermal activation of the solid substrates [9], crystallization from the melt [9], condensation from gas phase using inert gas carrier on the cooled supports [25,26]. It was shown recently that cryochemical treatment can be used in order to obtain new nanoforms of some pharmaceutical substances with nanosized particles and modified crystal structure [22,24,25,27,28,29].
The aim of this work is to develop cryochemical modification methods and to produce new cryochemical forms of drug substance dioxidine, 2,3-bis-(hydroxymethyl)-quinoxaline-N,N′-dioxide, possessing nanosized particles and modified crystal structure and high dissolution rate in comparison to the initial pharmaceutical substance. Dioxidine is well known antimicrobial substance used for therapy treatment of superlative infections due to inhibition of growth of many of gram-positive and gram-negative bacteria [30,31]. The therapeutic effect of this substance is based on the termination of DNA biosynthesis of microbial cells due to the deep disturbance of its nucleotide structure even by presence of sub-inhibiting concentrations.

2. Materials and Methods

2.1. Materials

Dioxidine substance produced by Mir-Pharma (Moscow, Russia) (98.9%) was used without further purification.

2.2. Samples Preparation

Cryomodified dioxidine: 4% dioxidine aqueous solution was heated to 50 °C, injected through a pneumatic nozzle into liquid nitrogen and freeze dried for 24 h. In order to obtain and solve the structure of pure crystal forms we carried out thermal treatment of cryomodified dioxidine substance by three different procedures.
Thermally activated cryodioxidine samples:
Sample 1: (D (50)-40-2 h): Cryomodified dioxidine was heated at 40 °C for 2 h, contains mainly H-crystal phase with small addition of M-phase (less than 25%)
Sample 2: (D (50)-120-80 s): Cryomodified dioxidine was heated at 120 °C for 80 s contains three different crystal forms M (>30%), Н and Т (>60%).
Sample 3: (D (50)-120-8 h): Cryomodified dioxidine was heated at 120 °C for 8 h, contains only T crystal form.
where T—anhydrous triclinic crystal polymorph phase, М—anhydrous monoclinic crystal polymorph phase, Н—hydrated crystal form.

2.3. Characterization Techniques

2.3.1. UV-visible

UV-visible absorption double beam spectrophotometer “Jasco V-770” (JASCO Corporation, Tokyo, Japan) in the range of 300–600 nm at room temperature was used to scrutinize the spectra of different forms of dioxidine in aqueous solutions and for spectrophotometric determination of dioxidine concentrations.

2.3.2. 1H-NMR

Determination of the chemical shifts of the initial and cryochemically modified substances were held in the saturated solutions in D2O using high resolution NMR-spectrometer of VXR-400 “VARIAN” (VARIAN Inc. Agielent Technologies, Santa Clara, CA, USA).

2.3.3. FTIR Spectra

FTIR spectra of samples were recorded in KBr discs between 4000 and 400 cm−1 using spectrometer Bruker Tensor II (Bruker GmbH, Mannheim, Germany).

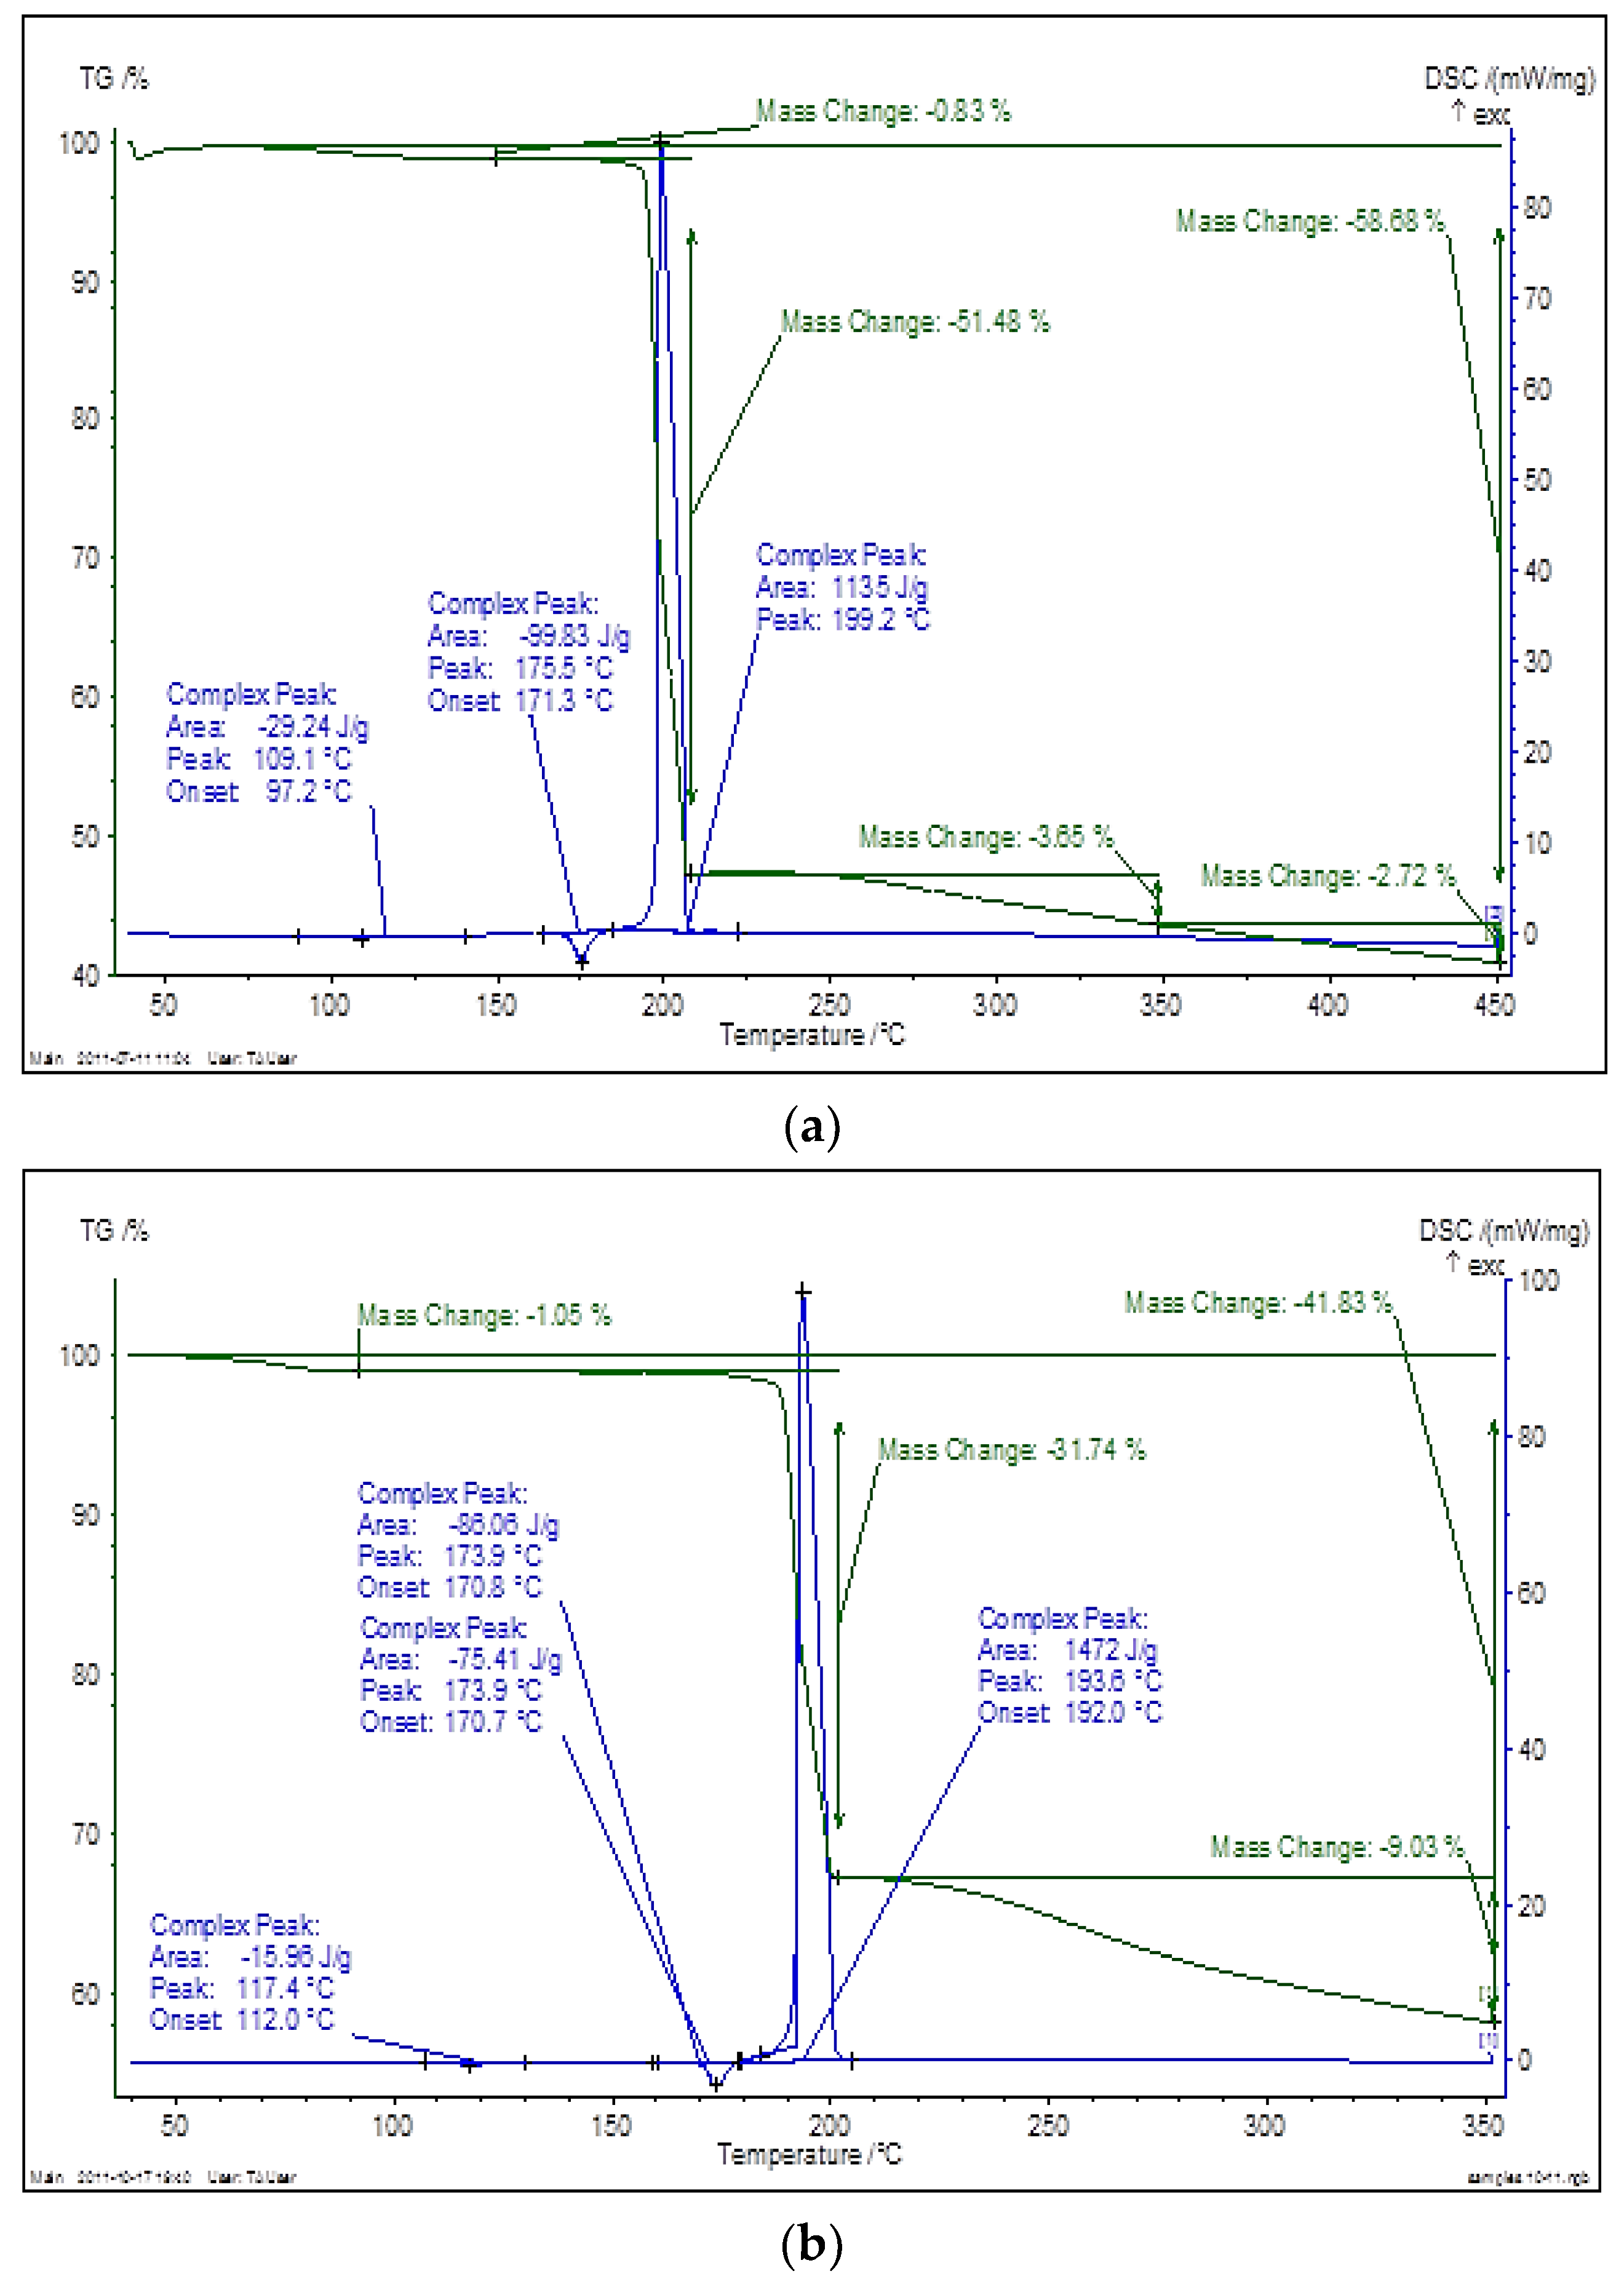
2.3.4. Thermoanalytical Investigations

Thermoanalytical investigations (thermogravimetry-TG and differential scanning calorimetry-DSC) were performed on Thermoanalyzer STA 449 C Jupiter, NETZSCH (NETZSCH GmbH, Selb Germany), using argon flow and samples heating rate of 10 K/min.

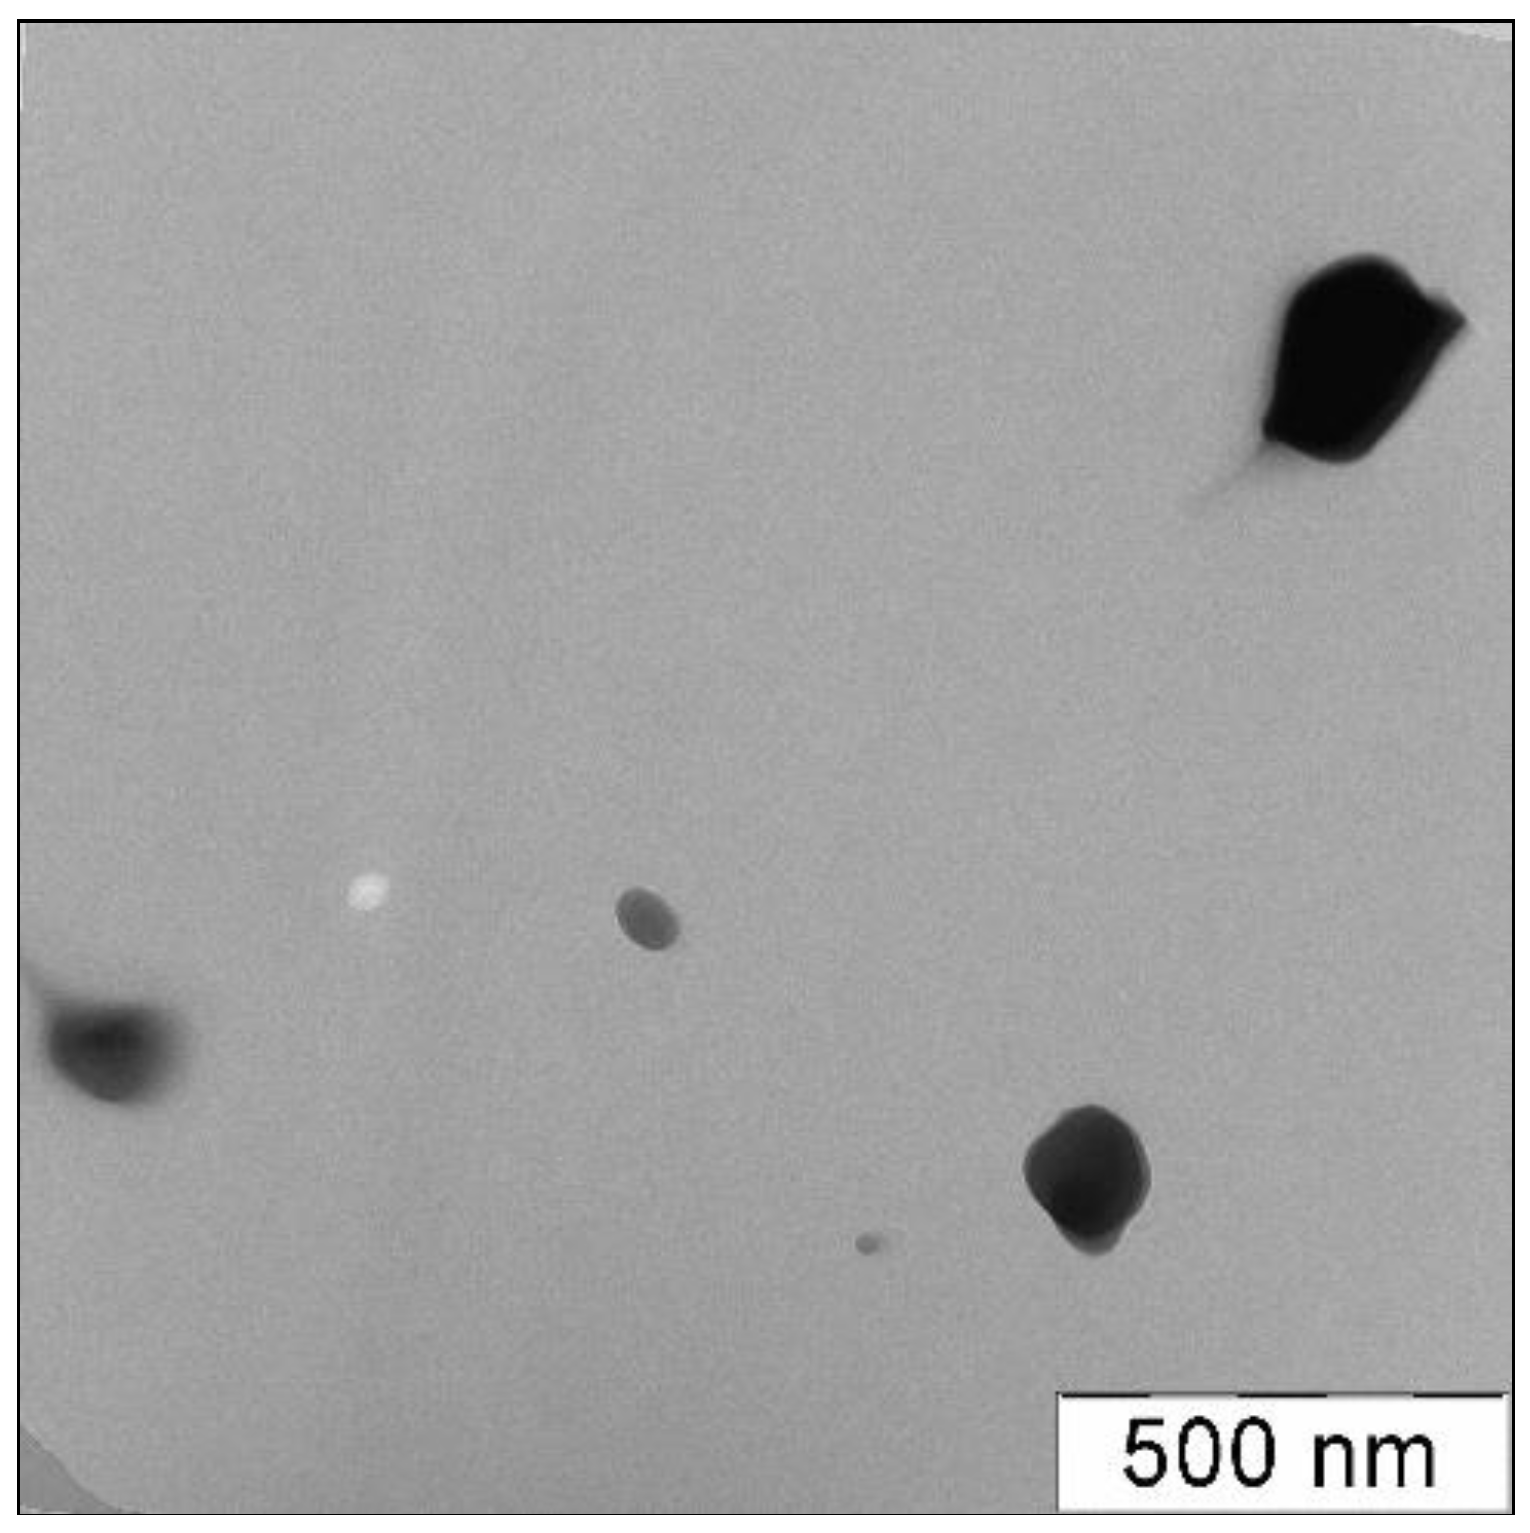
2.3.5. Transmission Electron Microscopy

Transmission electron microscopy (TEM) images were recorded using microscope LEO 912 AB Omega ZEISS (ZEISS, Oberkochen, Germany) with electrons accelerating voltage 100–200 kV.

2.3.6. BET-surface Area Measurements

The BET surface area (S) of samples was defined using the surface analyzer assembled on the basis of gas-chromatograph Chrom 5. Average dioxidine particle diameters (d) of the samples were calculated as d = 6/ρ S, where ρ is a density of dioxidine substance.

2.3.7. X-ray Powder Diffraction

X-ray powder diffraction measurements were carried out at 250 K at beam line ID22 of the European Synchrotron Radiation Facility (ESRF, Grenoble, France). The instrument is equipped with a cryogenically cooled, double-crystal Si 111 monochromator and Si 111 analyzers. The powder was loaded into a 1-mm-diameter borosilicate thin-walled glass capillary, which was rotated during measurements at a rate of 1200 rpm to improve the powder averaging. Calibration of the instrument and refinement of the X-ray wavelength (= 0.399996(3) Å) were performed via NIST silicon standard 640c (see Table 1 for data collection details).

2.3.8. Indexing

Unit-cell dimensions were determined using three indexing programs: TREOR90 [32], ITO [33], and AUTOX [34,35]. Indexing of M was possible after removing the peaks of T and H forms from the three-phases pattern of the sample 2. Space groups for all phases were assigned taking into account the systematic extinctions. The unit-cell parameters and space groups were tested further with the use of the Pawley fit [36] and confirmed by crystal structure solution.

2.3.9. Structure Determination

All crystal structures were solved with the use of simulated annealing technique [37]. For T and H, the low-angle part of powder pattern was used in simulated annealing runs, while for M, the search for the solution was based on the set of 150 low-angle Xobs values [38] extracted from three-phase powder pattern after a Pawley fit with the program MRIA [39]. The model of dioxidine molecule used in a direct space search without H atoms was taken from the literature [40].

2.3.10. Structure Refinement

The solutions were refined with the program MRIA via a multi-phase bond-restrained Rietveld approach in the same way as was reported earlier [27,41]. In the refinements, anisotropic line broadening [42] and preferred orientation approximated with a symmetrized harmonics expansion up to the fourth order [43,44] were taken into account. All non-H atoms were refined isotropically; H atoms were positioned geometrically (C–H 0.93–0.97 Å; O–H 0.82–0.85 Å) and refined as riding.
The crystal structure H was solved and initially refined as anhydrous form ignoring the peaks of minor additional phase M (<25%). The preliminary refined structural model of H and final model of T were fixed and used in three-phase refinement of powder pattern 2, containing M in 30%, H- as a minor phase (<10%) and T as a main crystalline phase (>60%). Thus, a final structural model of M was obtained, fixed and then used in the two-phase Rietveld refinement of powder pattern 1, containing H as a main crystalline phase. After several cycles of refinement, the positive residual peak with the height of 1.7 e Å−3 was observed far from the three independent molecules. It was assigned to the oxygen atom from the water molecule and freely refined.

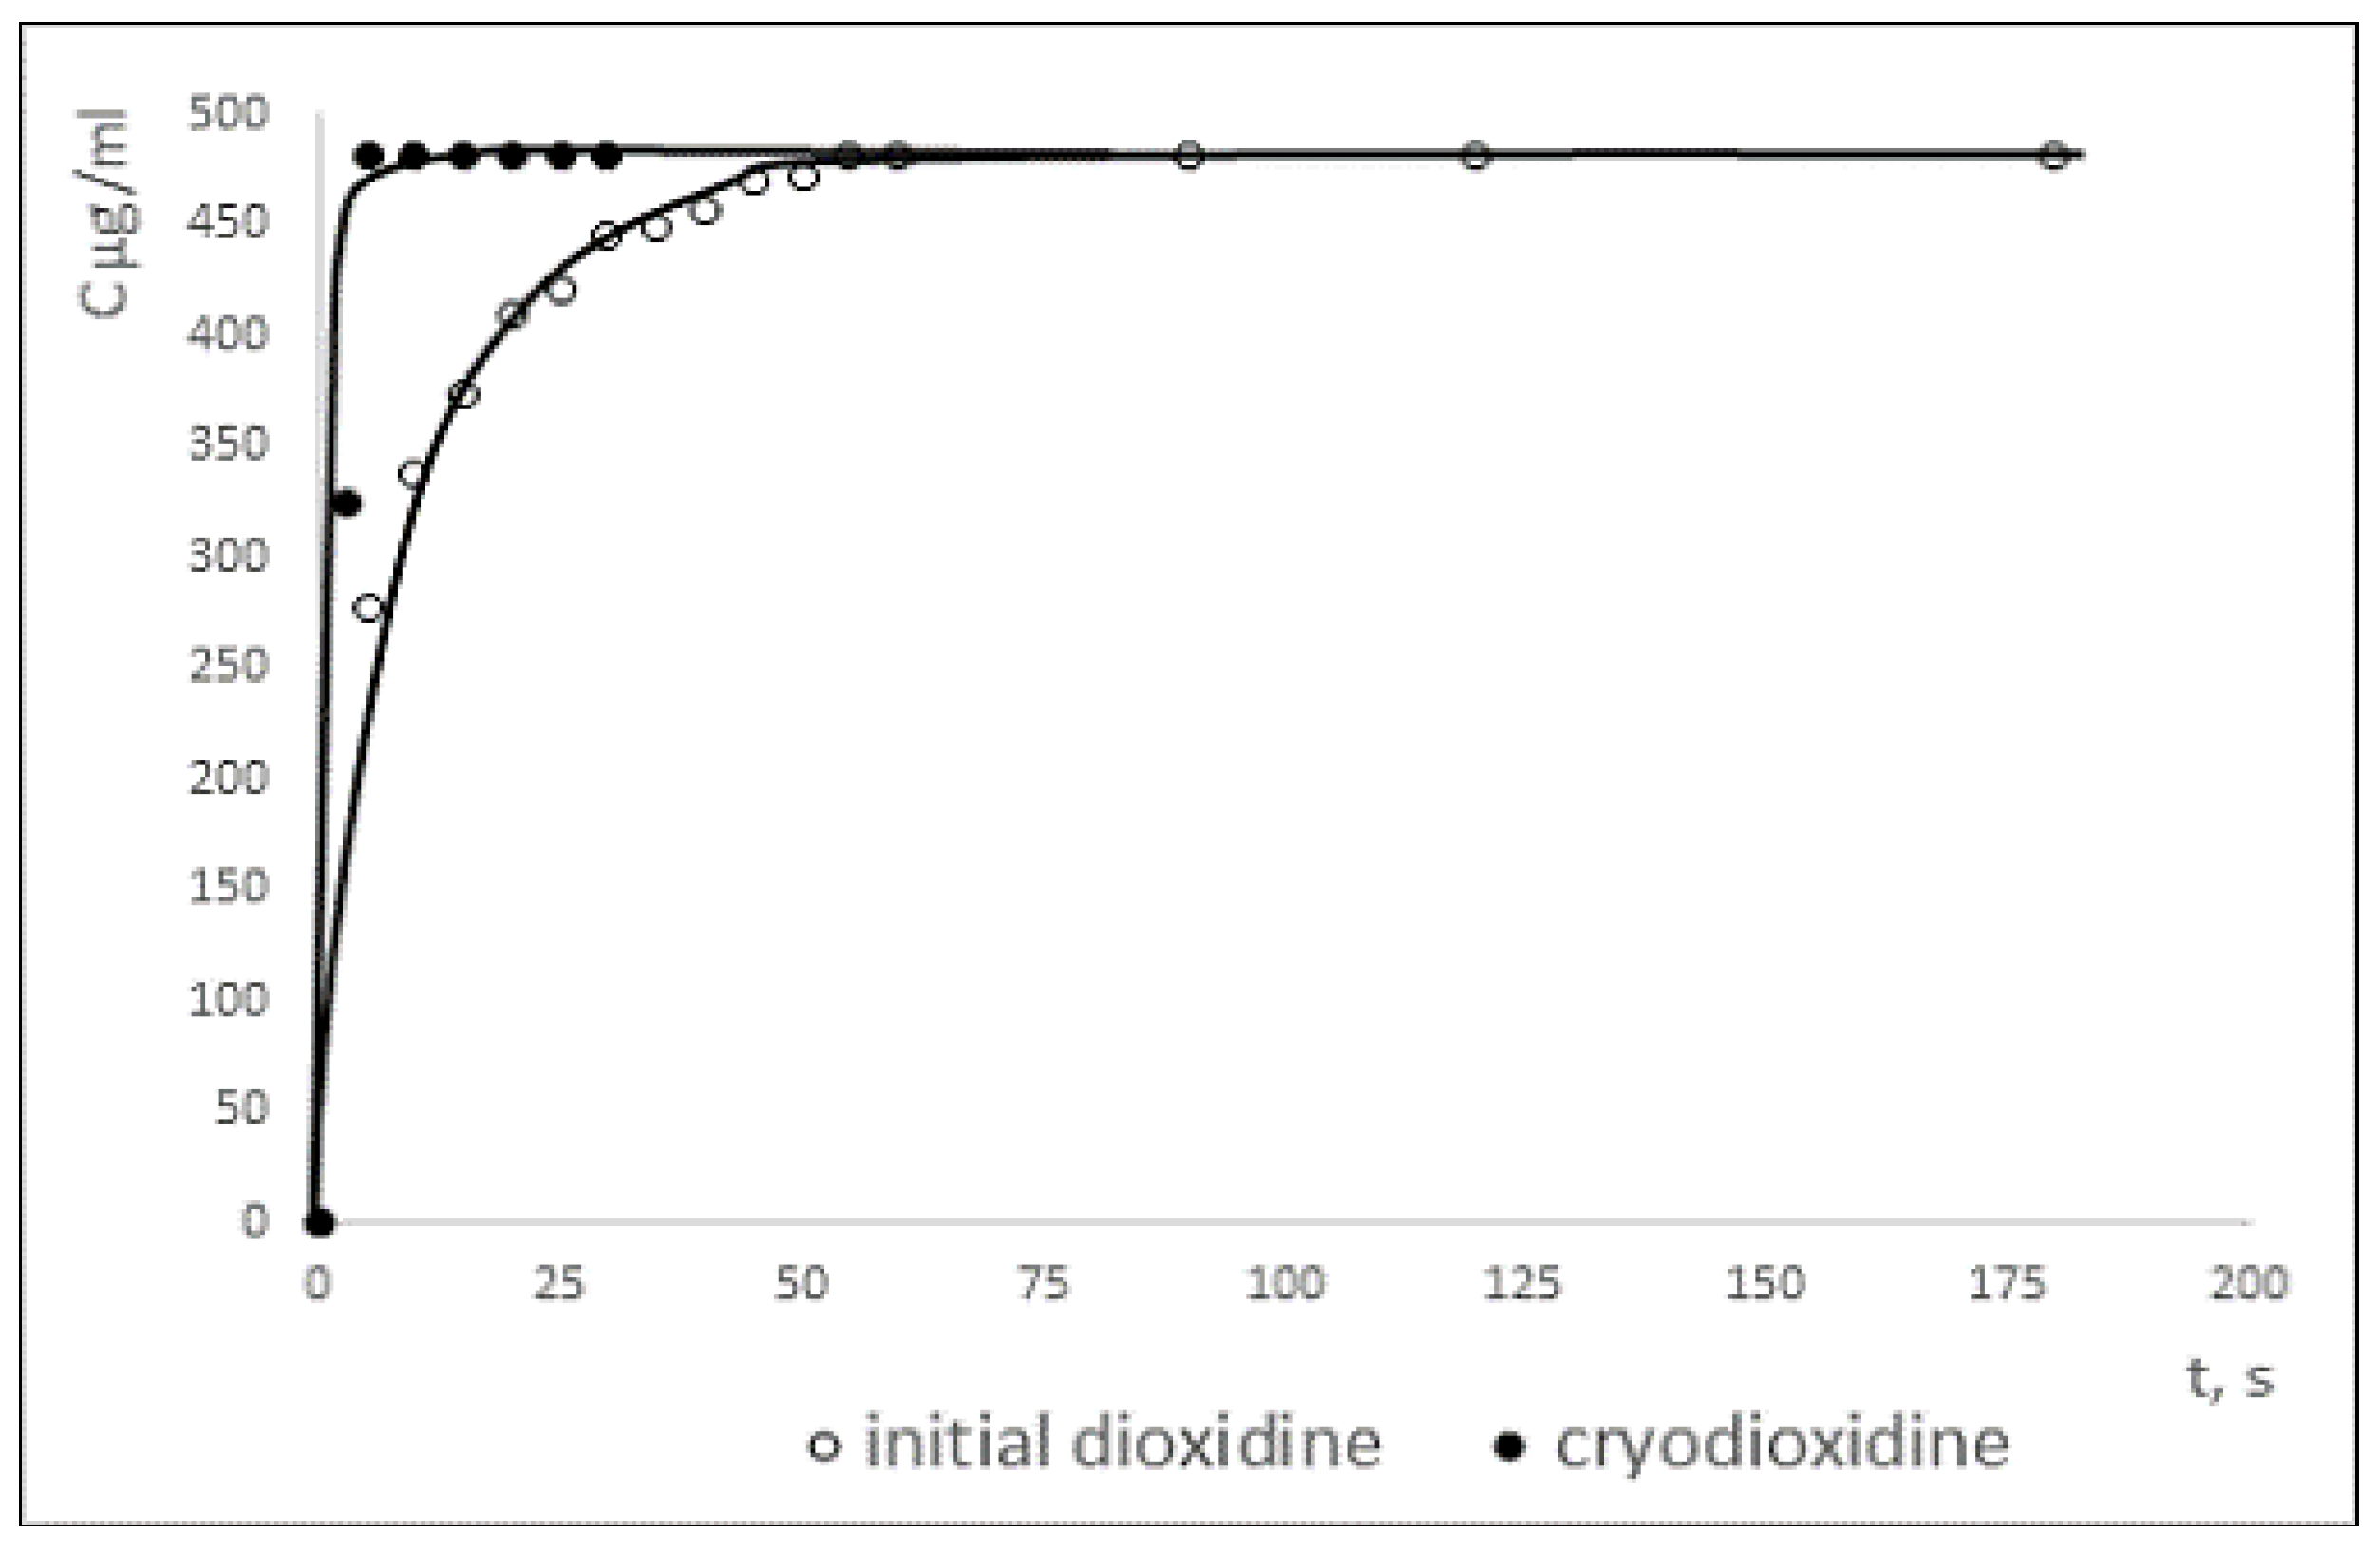
2.4. Determination of Dissolution Rate of Dioxidine Forms

Dioxidine samples (0.19 g) were placed into a flask with 20 mL of distilled water located on the activated magnetic stirrer with a stirring speed of 100 rpm at 25 °С. Solution samples with a volume of 0.1 mL were removed from the flask at defined intervals of time. Then the samples were diluted with distilled water by 20 times and then used for spectrophotometric determination of dioxidine concentration in the solution.

3. Results and Discussion

3.1. Physicochemical Characterization of Cryomodified Dioxidine

The H-NMR spectra [1] of the initial dioxidine (D2O) δ: 4.93–5.21 (m, 4H, 2 CH2), 7.85–8.05 (m, 2H, H-Ar), 8.38–8.52 (m, 2H, H-Ar), and cryomodified dioxidine (D2O) δ: 4.95–5.25 (m, 4H, 2 CH2), 7.86–8.05 (m, 2H, H-Ar), 8.35–8.50 (m, 2H, H-Ar) are similar, confirming the identity of chemical structure of cryomodified and initial samples.
The UV spectra of all forms of dioxidine aqueous solutions were identical and contained a high-intensity absorption band at 250 nm (doublet 241 and 259 nm) related to π→π* electron transition of the aromatic system and a low-intensity band at 375 nm related to n→π* electron transition of n-electrons of the nitrogen related to dioxidine molecule.
In FTIR-spectra of the cryomodified dioxidine samples the vibrations of quinoxaline ring appear at 1510 cm−1, the vibrations of C-H of benzene ring appear at 975, 113cm−1, and the band of vibrations of C–O–H is indicated at 1288 cm−1 (Figure S1). While in the case of original dioxidine, the vibrations of the quinoxaline ring appear at 1506 cm−1, and the vibrational bands of the C–H bonds of aromatic ring are manifested by the peak at 971 cm−1 and doublet at 1117 and 1113 cm−1, the vibration band of the C–O–H is also doublet at 1280 and 1288 cm−1 (Figure S1). These data show the differences in dioxidine molecular conformations for the initial and cryomodified forms and combined with the results of UV-vis-spectroscopy confirmed the unchanged chemical structure of dioxidine molecules by cryochemical modification.
At the same time, X-ray diffraction data show the difference between the initial pharmaceutical dioxidine substance (d (Å)-I, (%): 8.638–100.0%; 7.508–68.4%; 3.299–24.8%; 2.242–16.8%;) and the cryomodified form (d (Å)-I, (%): 8.740–100.0%; 8.026–94.2%; 3.358–99.3%; 3.304–67.6%;).
Thermal analysis curves (TG and DSC) also confirmed the difference of physico-chemical behavior of the initial and cryomodified forms (Figure 1). For the initial dioxidine form the loss of physically adsorbed water is 0.83%, melting occurs at (175.5 ± 0.5 °C) with thermal an endothermic effect (99.8 ± 0,4) J/g, and thermal degradation proceeds at (199.2 ± 0.5) °C with an exothermic thermal effect (1135 ± 4) J/g and a mass loss 51,48%. For the cryomodified dioxidine form the loss of adsorbed water is 1.05%, melting occurs at (173.9 ± 0.5) °C with an endothermic effect (75.4 ± 0.4) J/g, and thermal degradation proceeds at (193.6 ± 0.5) °C with an exothermic effect of (1472 ± 4) J/g and a mass change of 31.74%.
Cryochemical treatment led to the micronisation of the dioxidine substance and the formation of nanosized particles. By low-temperature argon adsorption, the value of specific surface area was determined, and average particle size was calculated for the initial (S = 0.7 m2/g, d = 5700 nm) and cryomodified dioxidine (21.3 m2/g and 190 nm). The similar data on cryomodified and initial dioxidine particles size were obtained by TEM (Figure 2). It was shown from the analysis of several micrographs that the particle size of the cryomodified dioxidine form is equal to 50–300 nm (average particle size 170 nm) and the particle size of the initial dioxidine form is equal to 150–18,000 nm (average particle size d = 5500 nm).
Dissolution curves of the initial and cryomodified dioxidine forms are presented in Figure 3. While the cryomodified dioxidine completely dissolves in water after 5 s, reaching maximal concentration of 470 mg/mL at 25 °C, it takes more than 50 s for the initial dioxidine form to be fully dissolved. A higher dissolution rate for the cryomodified dioxidine is possibly due to the smaller size of its particles and to the larger value of its specific surface area compared to the original dioxidine. Also, different dissolution rates of two dioxidine forms can be related to differences in their crystal structure.

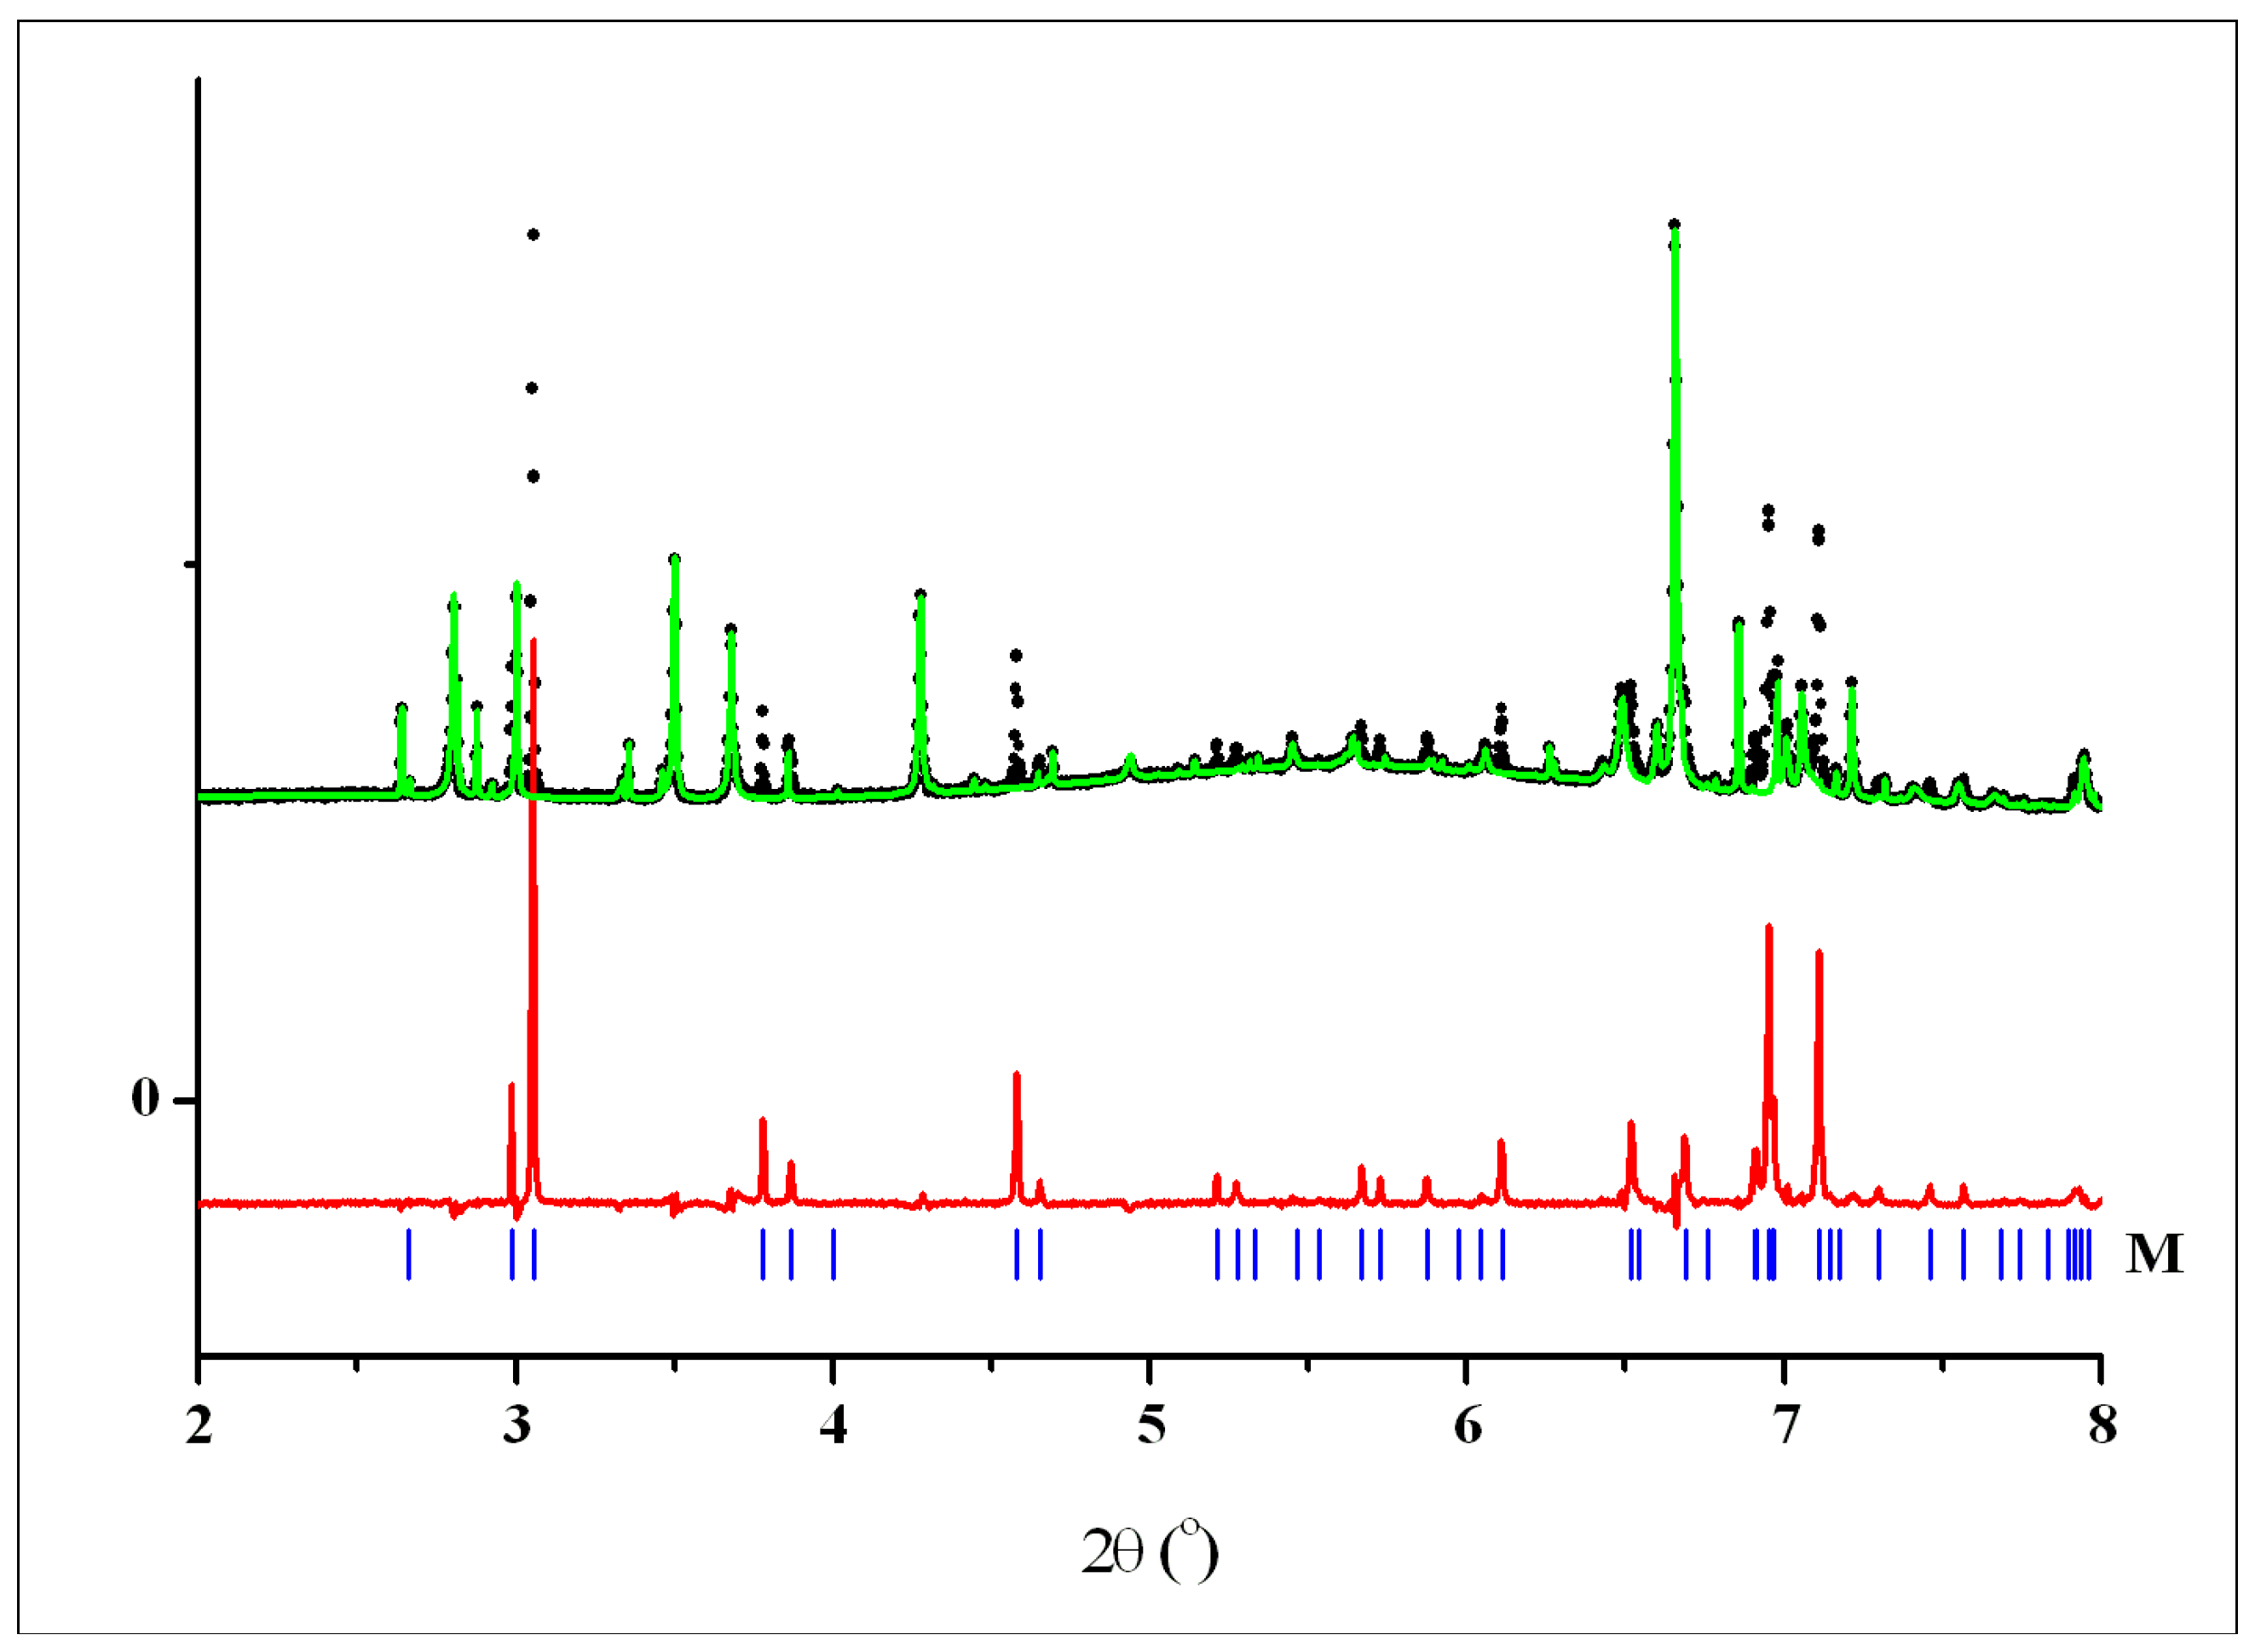
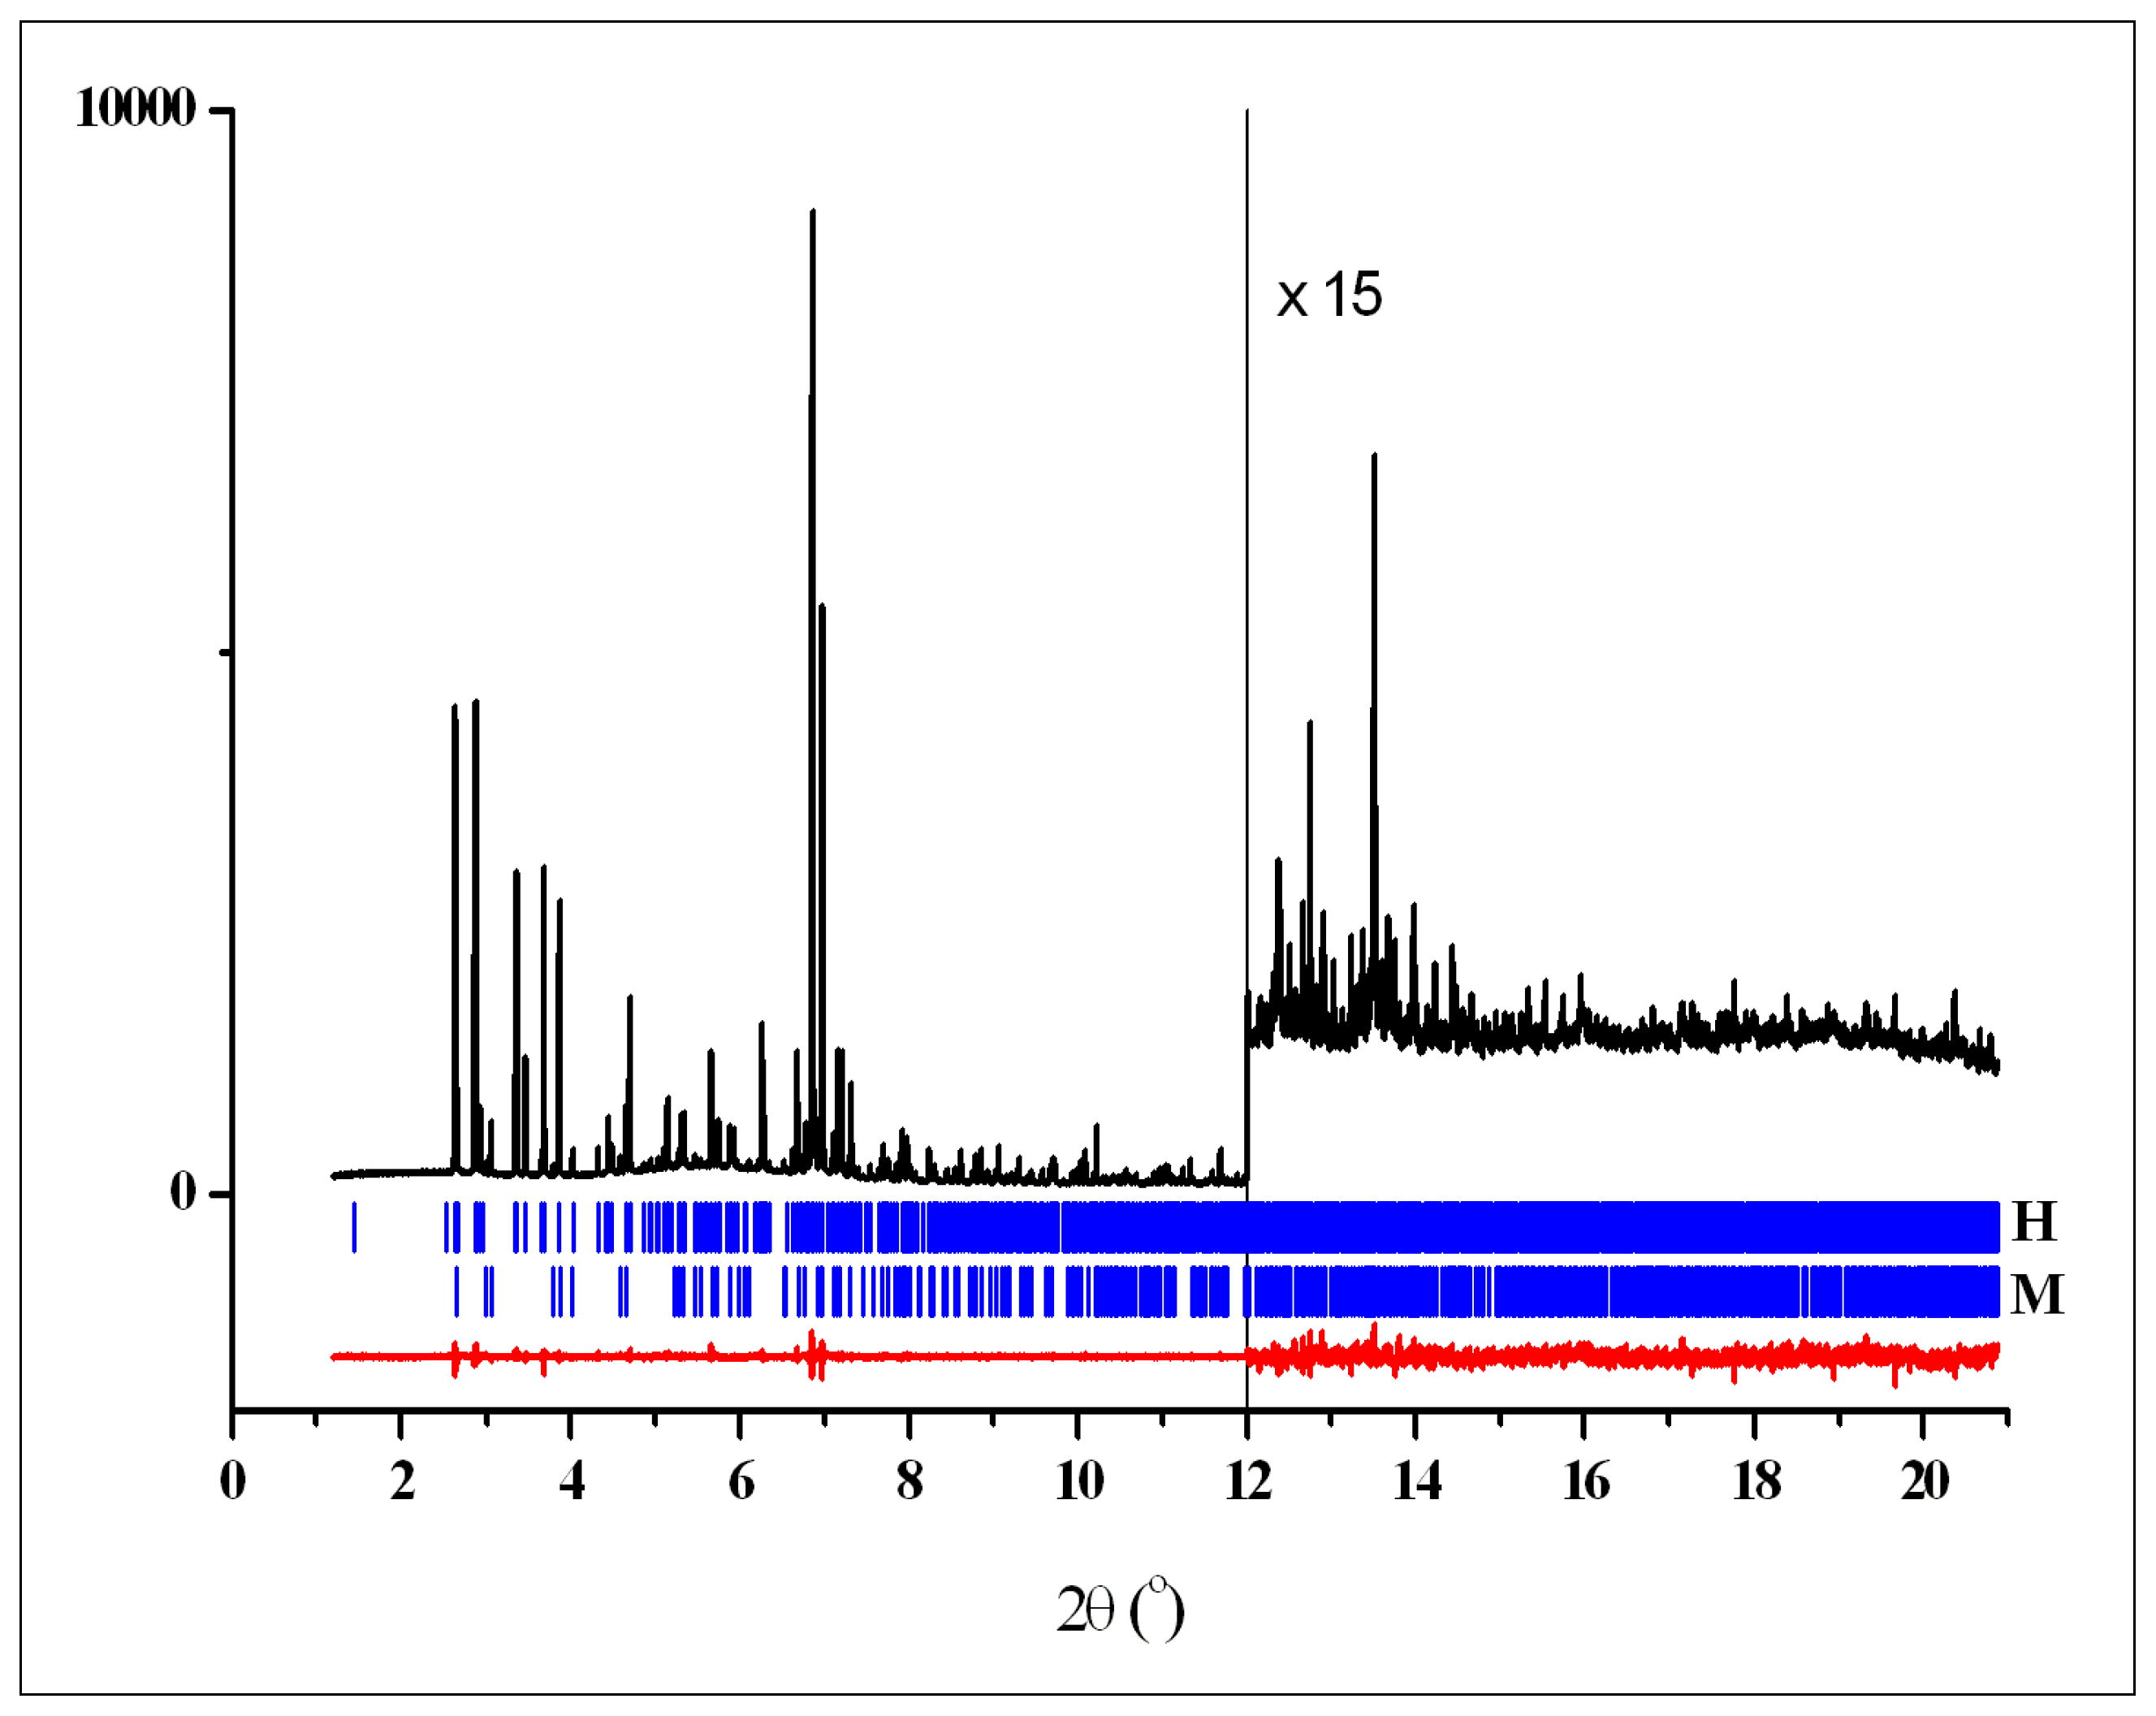
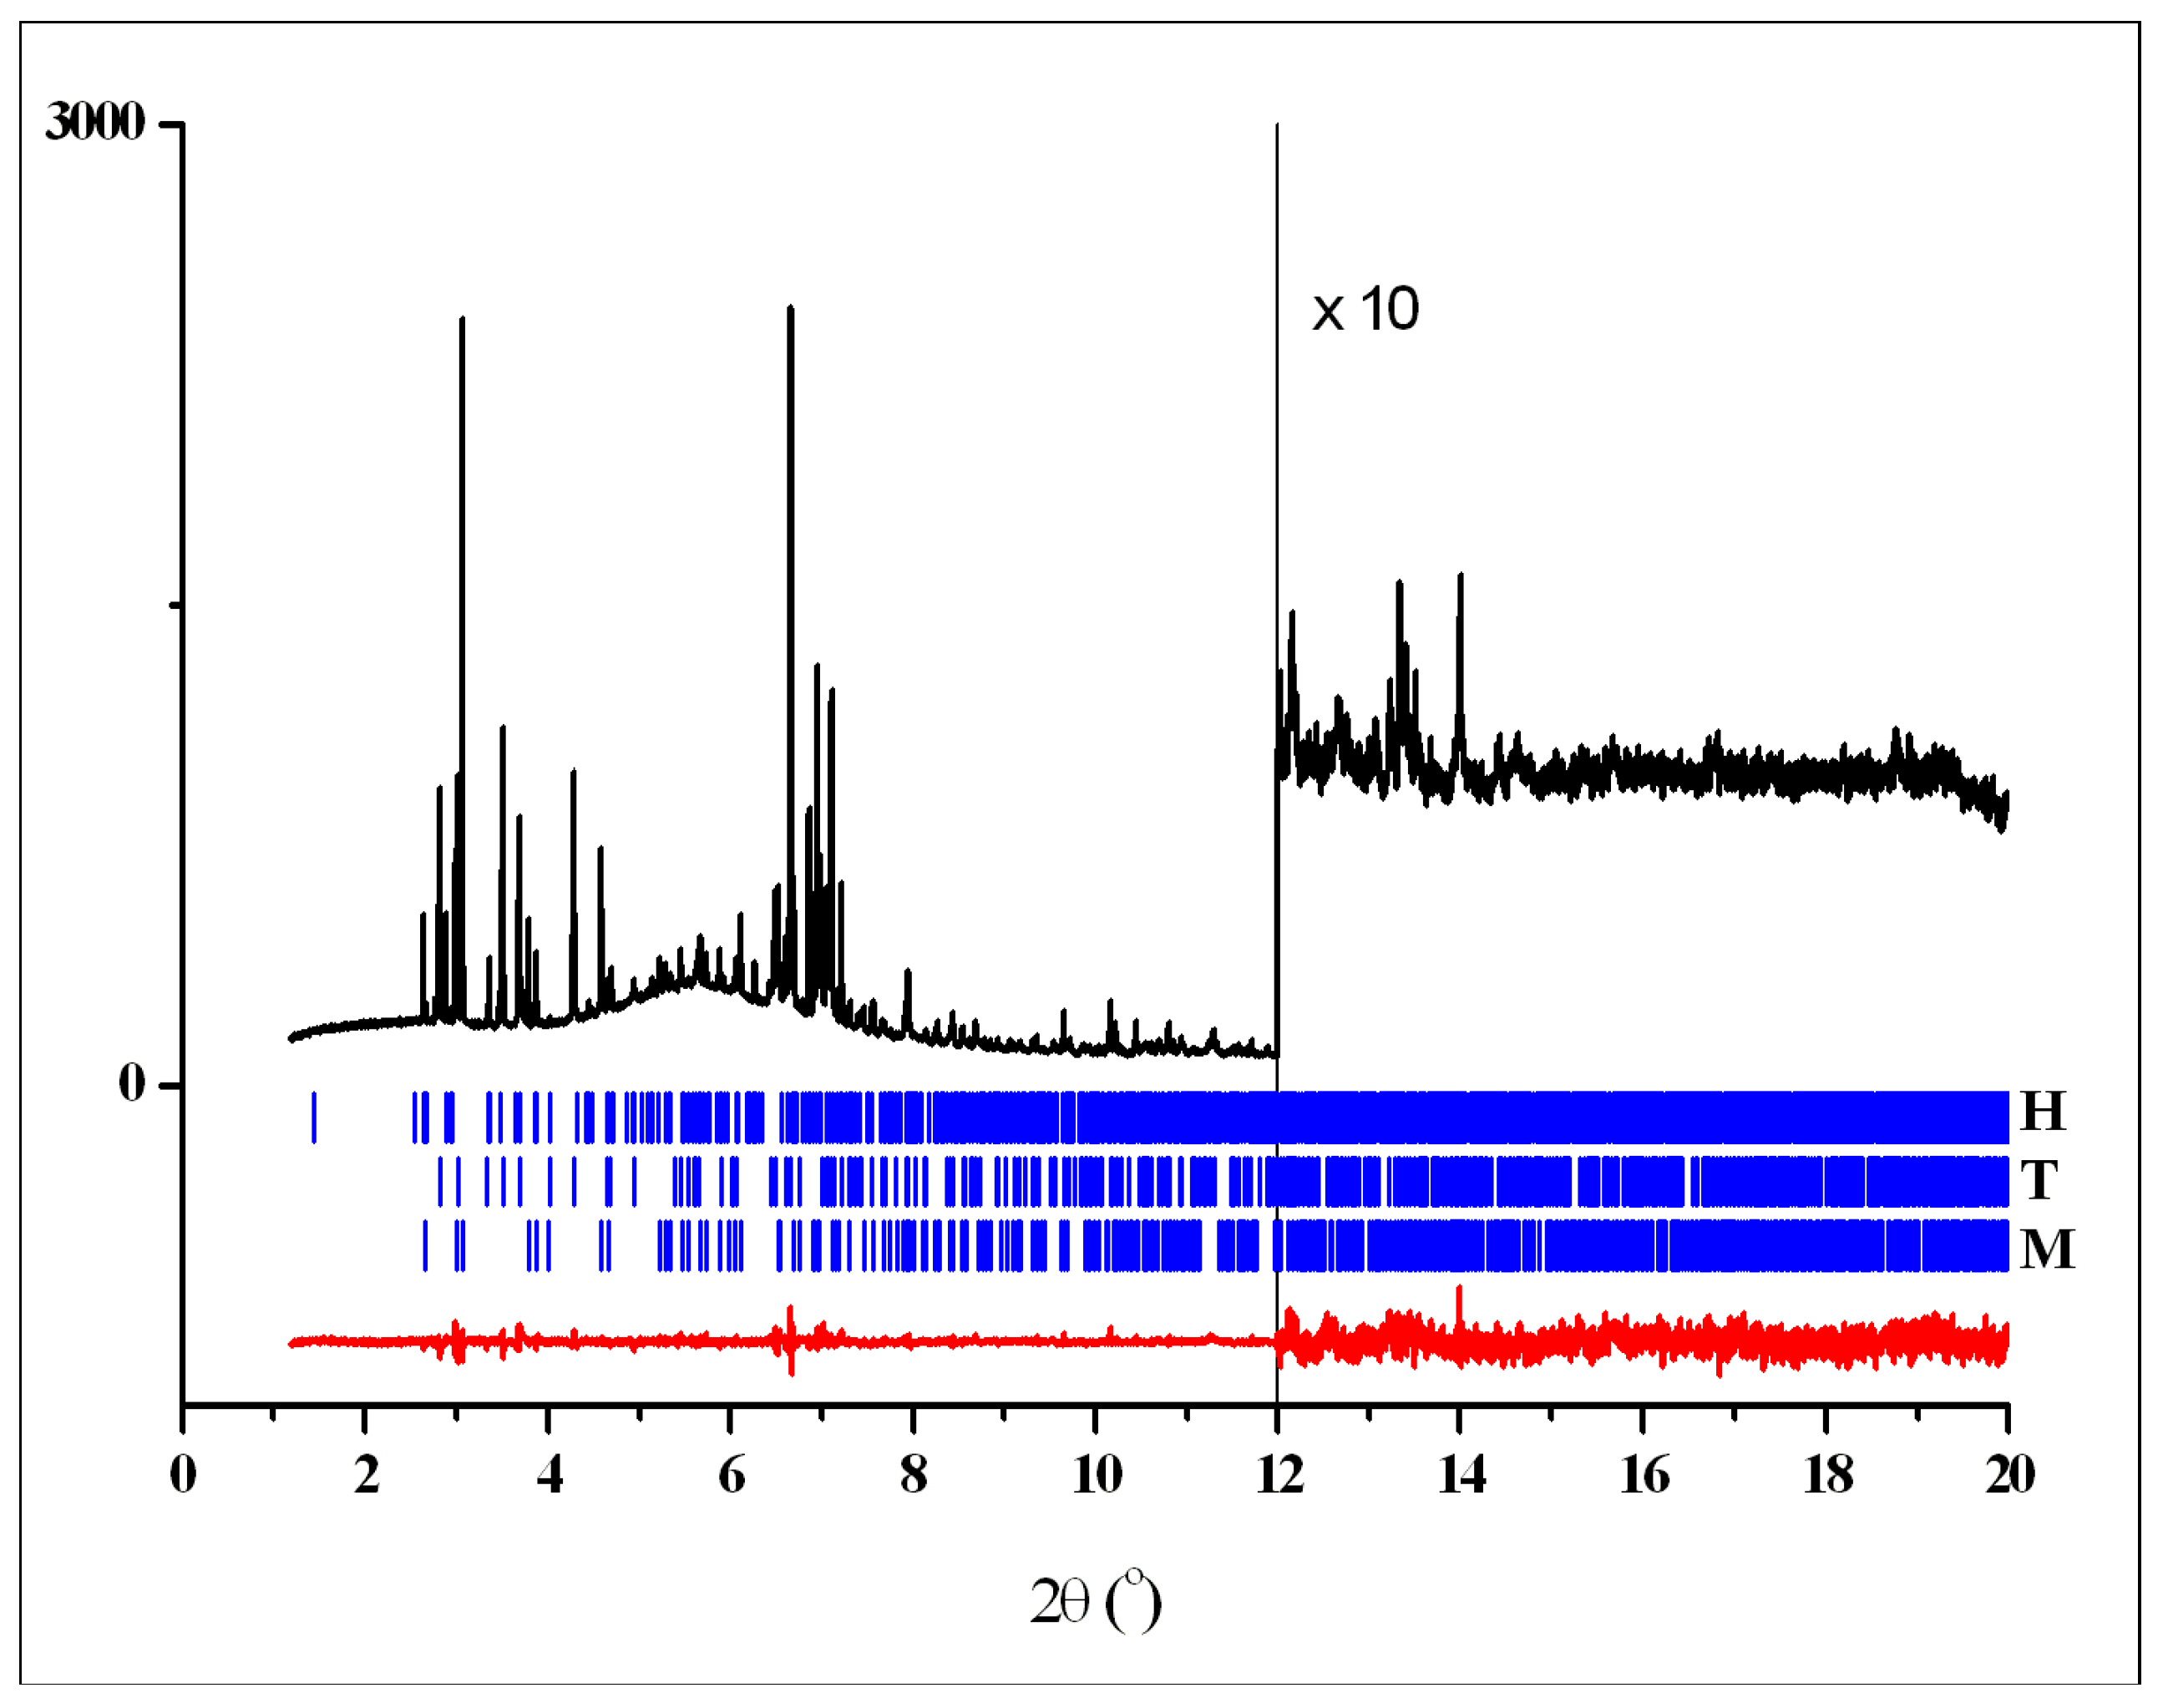
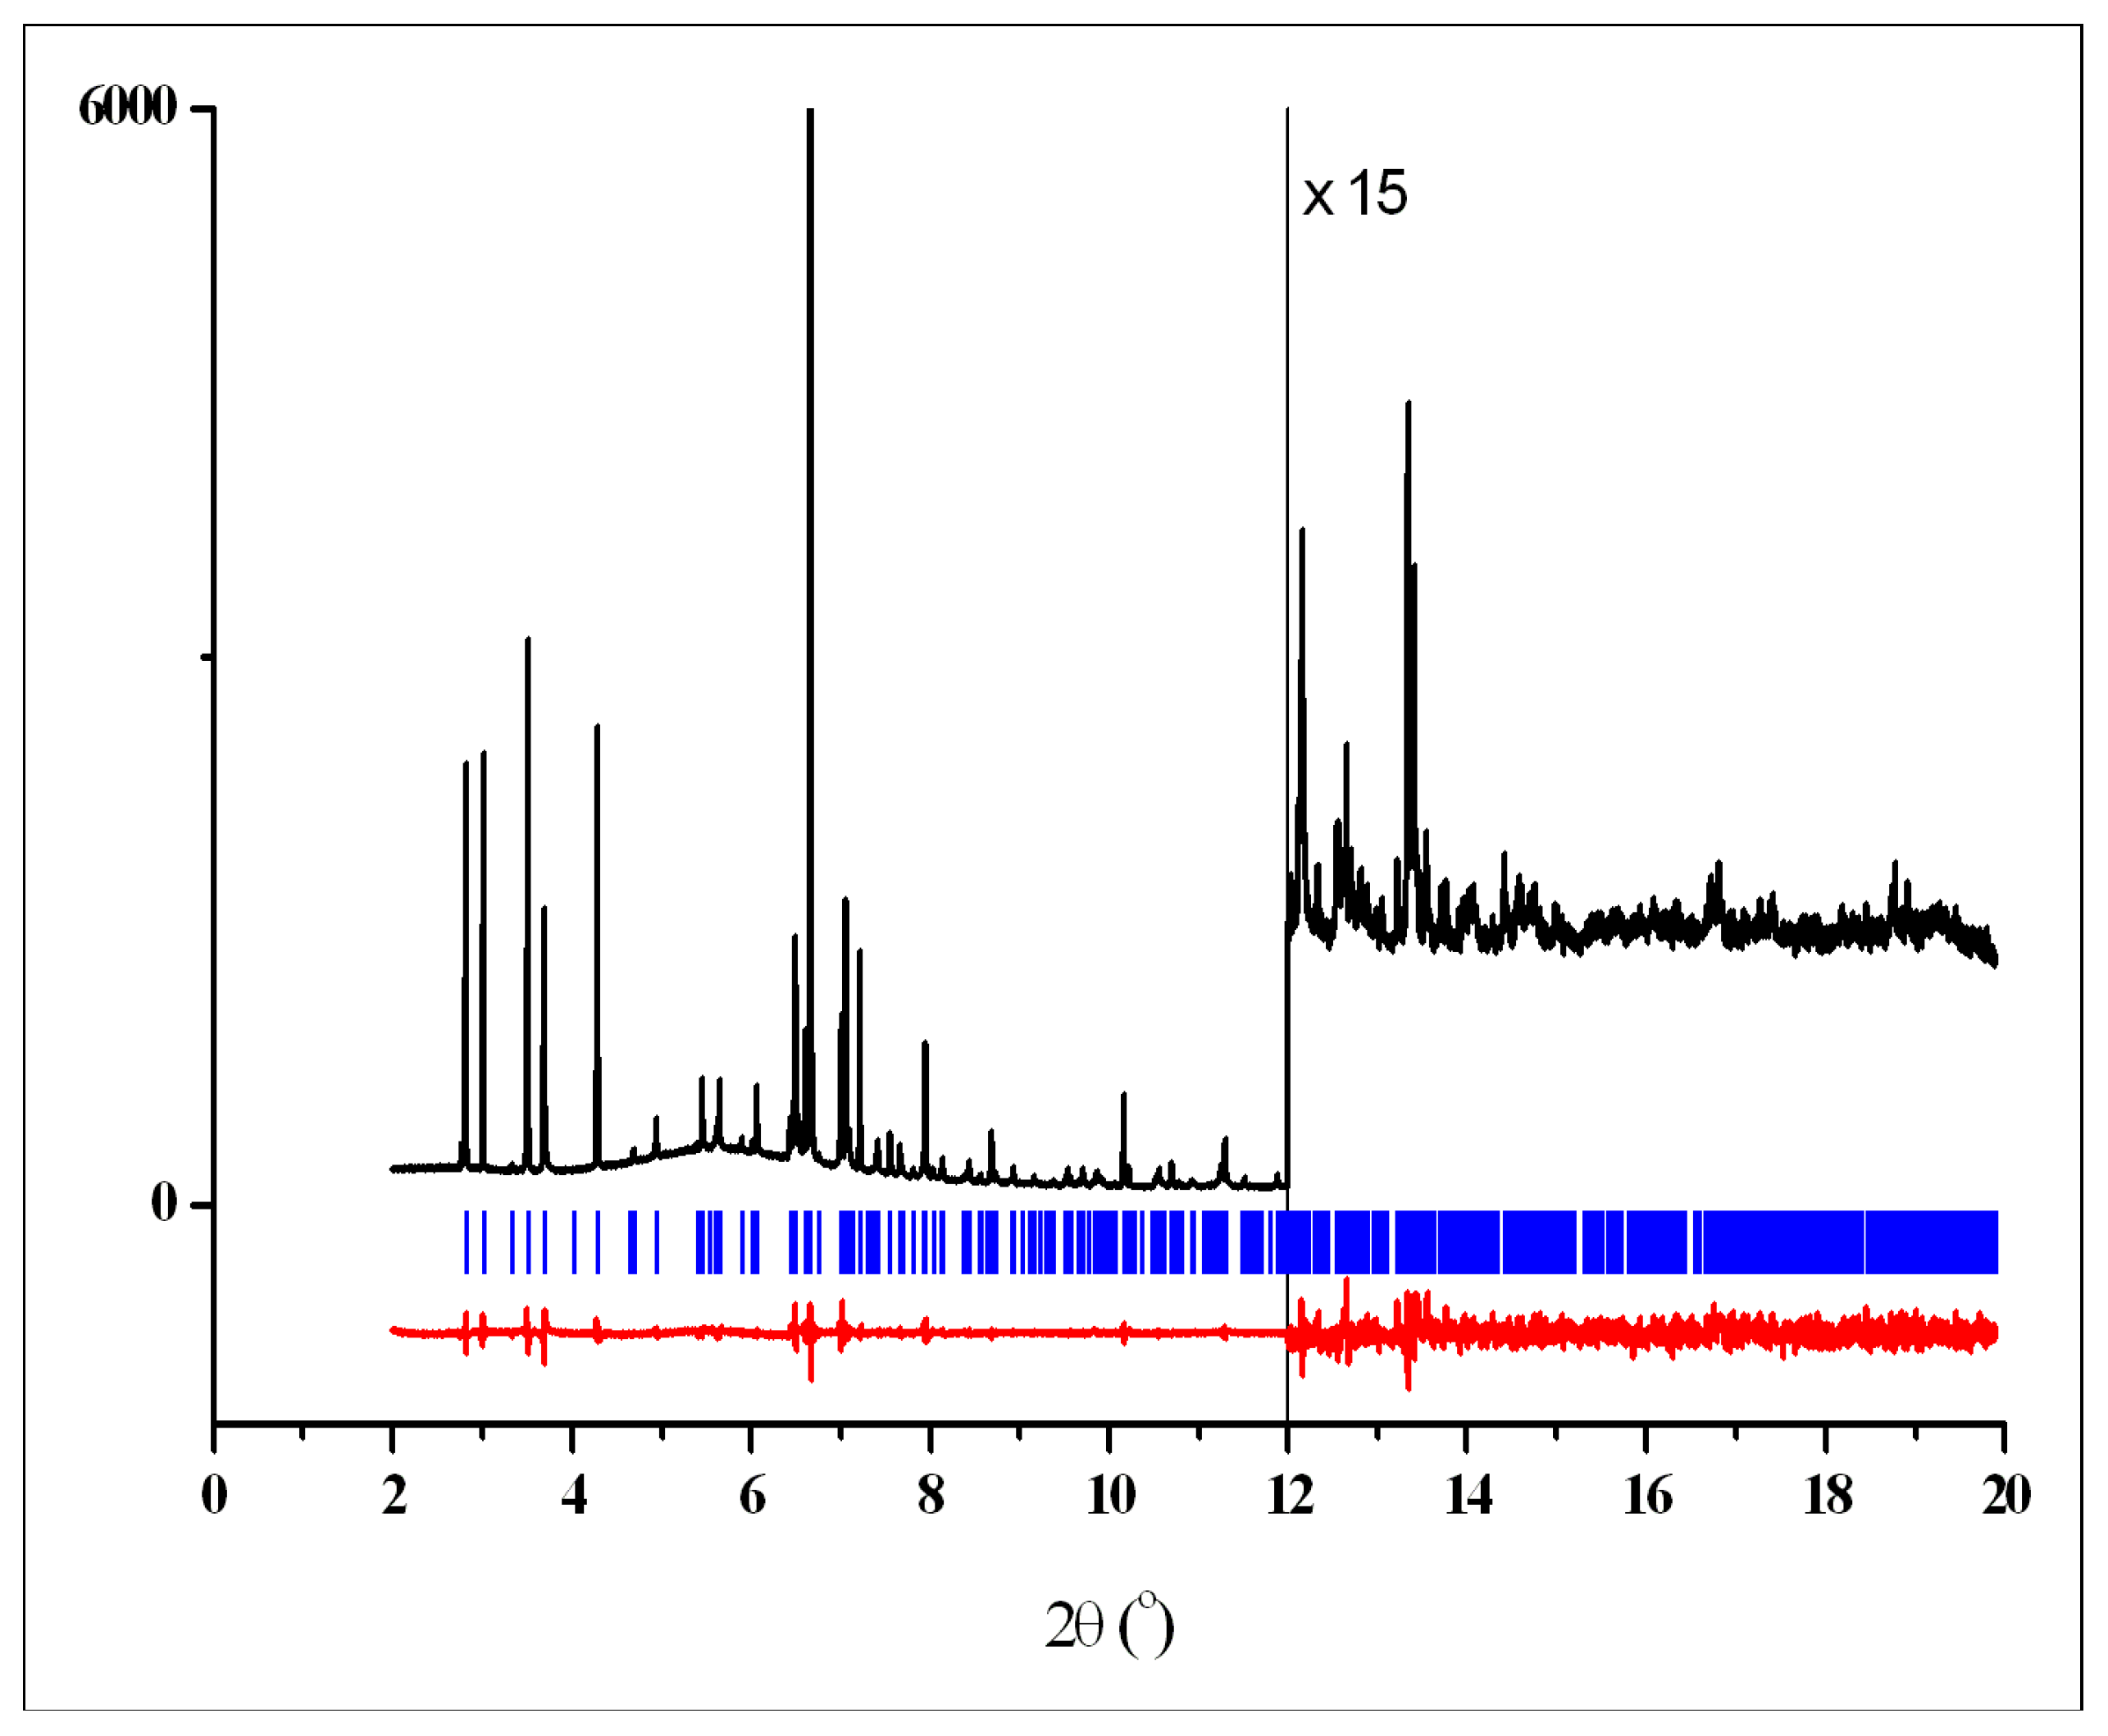
3.2. Crystal Structures

Crystal data, data collection, and refinement parameters for crystalline phases T, M and H are shown in Table 1. Rietveld plots after the final refinements for powder patterns 1–3 are shown in Figure 4, Figure 5 and Figure 6, respectively. Figure 7 shows powder pattern 2 and difference plot, calculated taking into account the contribution of two phases only—H and T, to demonstrate significant diffraction peaks from the third phase M.
The molecule of 2,3-bis(Hydroxymethyl)-quinoxaline-1,4-di-N-oxide (dioxidine) possesses only two internal degrees of freedom, so its conformations in various crystalline phases may differ in torsion angles N–C–C–O(H) only. In anhydrous polymorphs T and M, the asymmetric unit contains only one independent molecule, and conformations of these molecules are different (Figure 8, prepared with PLATON [45]). The asymmetric unit of the hydrated crystalline phase H contains three independent dioxidine molecules with different conformations and one water molecule (Figure 9).
The dioxidine molecule has two hydroxy-groups, which can serve both as donors and acceptors in hydrogen-bonding, and four oxygen atoms can be considered as acceptors. Thus, one can expect various hydrogen-bonding networks, which can consolidate the crystal packing of the dioxidine molecules. In T, classical intermolecular O–H···O hydrogen bonds (Table 2) link the molecules into chains extended in [1-1-1] (Figure 10, prepared with Mercury [46]), and weak intermolecular C–H···O interactions (Table 2) held these chains together in the crystal.
Classical intermolecular O−H···O hydrogen bonds in M (Table 2) link the molecules into centrosymetric dimers, which are further linked into chains running along axis a (Figure 11). These hydrogen-bonded chains in M are distinct from those in T. One hydroxy group in T (O14–H14) serves not only as a donor of hydrogen bond but as its acceptor too. And, one of two N-oxide oxygen atoms (O12) is not involved in classical O−H···O hydrogen-bonding. These considerations led to the conclusion that phase T should be more stable than M, i.e., phase M is metastable one. Weak intermolecular C–H···O interactions in M (Table 2), like in T, consolidate further the crystal packing (Figure 11).
Classical intermolecular O−H···O hydrogen bonds in H (Table 2) link dioxidine molecules and crystalline water molecules directly into three-dimensional networks, so numerous weak C−H···O interactions (Table 2) in H can be considered forced. Interestingly, some of the independent dioxidine molecules in H have the same peculiarities aforementioned in M, namely, one hydroxy group serves as a donor and an acceptor of hydrogen bonds, and one N-oxide oxygen is not involved in classical O−H···O hydrogen-bonding.
The established crystal structures of H, M and T-forms allow us to estimate phase content of source samples of dioxidine. So multi-phase Rietveld refinement of powder pattern of commercial sample (see Figure S2) has shown that it contains two crystalline phases H and M in a ratio of 1:5. Powder pattern of the cryomodified sample (Figure S3) indicates that it contains mainly amorphous phase, some amount of H-phase and trace amount of M-phase.

4. Conclusions

The improvement of medical therapeutic effects of known medications by obtaining nanoforms possessing nanosized particle and the modification of their crystal structure without changing of the chemical nature is one of the most important problems in modern nanomedicine and physicochemical pharmacy. The developed approaches allowed enhance biomedical efficiency of many drugs along with the reduction of unwanted side effects due to lowering of the required therapeutic doses and decreasing of their toxicity.
The method developed by the authors in this article employed the capabilities of cryochemical modification of solid organic compounds, which allowed us to convert the drug substances into nanoforms, and modify their crystal packing without changing their chemical structure under the conditions far from equilibrium. In most cases, amorphous or metastable crystal forms were obtained by this approach, which are kinetically frozen in the solid state and can exist for a long time. The bioavailability of the thus prepared nanoforms of drug substances are usually higher due to the higher dissolution rates and due to the ability of the nanosized particles to be transported by the bloodstream, to overcome the skin barriers and high permeability of cell membranes by nanosized particles.
In this work we have succeeded to produce cryochemically modified nanoforms of antimicribial drug substance 2,3-bis-(hydroxymethyl)quinoxaline-N,N′-dioxide (dioxidine) with particles size varied from 50 till 300 nm. The cryomodified samples were characterized by different physicochemical methods (FTIR, UV-Vis, 1H-NMR, DSC, TG, BET-chromatography and X-ray diffraction) and transmission electron microscopy (TEM). We established the identity of the chemical nature of the dioxidine drug substance. We have shown the modification of crystal structure of dioxidine cryoforms. The formation of three polymorph crystal forms was revealed for cryomodified dioxidine samples possessed by some thermal activation processes—two anhydrous polymorphs: triclinic (T), monoclinic (M), and hydrated form (H).
The extending of the number of antibiotic drug substances in the experiments on cryochemical modification and detailed study of their biomedical efficiency and bioavailability are in our future plans.

5. Patents

There is patent [29] resulting from the work reported in this manuscript.

Supporting Materials

X-ray Crystallographic file in CIF format. Crystallographic data for H, M and T have been deposited with the Cambridge Crystallographic Data Centre as the supplementary publication nos. CCDC 1533096-1533098. Copies of data can be obtained free of charge on application to CCDC, 12 Union Road, Cambridge CB21EZ, UK (fax: (44)1223-336-033; e-mail: [email protected]). Figures of the X-ray powder patterns of the commercial source and just after cryomodification of the samples.

Supplementary Materials

The following are available online at https://www.mdpi.com/2073-4352/8/7/298/s1. Figure S1. FTIR spectra of the samples were recorded in KBr discs between 4000 cm−1 and 400 cm−1 using spectrometer Bruker Tensor II (Germany). The FTIR spectra of the cryomodified (C) and commercial source (S) samples of dioxidine are presented in Figure S1. Figure S2, X-ray powder patterns of the commercial source (S) sample was measured on a Guinier-Huber camera in a transmission mode, CuK1-radiation. Figure S3, X-ray powder pattern of the just after cryomodification (C) sample was measured on a Guinier-Huber camera in a transmission mode, CuK1-radiation.

Author Contributions

Conceptualization, Methodology and Editing—T.I.S. and V.V.C., Supervision. Funding Acquisition and Validation—M.Y.M., Investigation and Writing-Original Draft—O.I.V., I.V.E., V.P.S. Resources, Data Curation and Formal Analysis—A.N.F.

Funding

This research was funded by [Russian Science Foundation] grant number [16-13-10365] for financial support. V.V.C. is grateful to the Russian Ministry of Science and Education for the financial support of X-ray part of this study (grant No. RFMEFI61616X0069).

Acknowledgments

T.I.S., O.I.V., V.P.S., I.V.E. & M.Y.M. thank Russian Science Foundation (grant No. 16-13-10365) for financial support. V.V.C. is grateful to the Russian Ministry of Science and Education for the support of X-ray part of this study (grant No. RFMEFI61616X0069). We also thank ESRF for the access to ID22 station, experiment MA-3313.

Conflicts of Interest

The authors declare no conflicts of interest.

References

  1. Peltonen, L.; Hirvonen, J. Pharmaceutical Nanocrystals by Nanomilling: Critical process parameters, particle fracturing and stabilization methods. J. Pharm. Pharmacol. 2010, 62, 1569–1579. [Google Scholar] [CrossRef] [PubMed]
  2. Sun, B.; Yeo, Y. Nanocrystals for the parenteral delivery of poorly water-soluble drugs. Curr. Opin. Solid State Mater. Sci. 2012, 16, 295–301. [Google Scholar] [CrossRef] [PubMed] [Green Version]
  3. Keck, C.M.; Muller, R.H. Drug nanocrystals of poorly soluble drugs produced by high pressure homogenization. Eur. J. Pharm. Biopharm. 2006, 62, 3–16. [Google Scholar] [CrossRef] [PubMed]
  4. Gao, L.; Zhang, D.; Chen, M. Drug nanocrystals for the formulation of poorly soluble drugs and its application as a potential drug delivery system. J. Nanopart. Res. 2008, 10, 845–862. [Google Scholar] [CrossRef]
  5. Junyaprasert, V.B.; Morakul, B. Nanocrystals for enhancement of oral bioavailability of poorly water-soluble drugs. Asian J. Pharm. Sci. 2015, 10, 13–23. [Google Scholar] [CrossRef]
  6. Sarnes, A.; Kovalainen, M.; Häkkinen, M.R.; Laaksonen, T.; Laru, J.; Kiesvaara, J.; Ilkka, J.; Oksala, O.; Rönkkö, S.; Järvinen, K.; et al. Nanocrystal-based peroral itraconazole delivery: superior in vitro dissolution enhancement versus sporanox® is not realized in In Vivo drug absorption. J. Control. Release 2014, 180, 109–116. [Google Scholar] [CrossRef] [PubMed]
  7. Sarma, B.; Chen, J.; His, H.-Y.; Myerson, A.S. Solid forms of pharmaceuticals: polymorphs, salts and cocrystals. Korean J. Chem. Eng. 2011, 28, 315–322. [Google Scholar] [CrossRef]
  8. Lee, E.H. A practical guide to pharmaceutical polymorph screening & selection. Asian J. Pharm. Sci. 2014, 9, 163–175. [Google Scholar]
  9. Yu, L.X.; Furness, M.S.; Raw, A.; Woodland, O.K.P.; Nashed, N.E.; Ramos, E.; Miller, S.P.F.; Adams, R.C.; Fang, F.; Patel, R.M.; et al. Scientific considerations of pharmaceutical solid polymorphism in abbreviated new drug applications. Pharm. Res. 2003, 20, 531–536. [Google Scholar] [CrossRef] [PubMed]
  10. Guranda, D.T.; Gil’deeva, G.N. Preparation of drug polymorphs. Pharm. Chem. J. 2010, 44, 254–260. [Google Scholar] [CrossRef]
  11. Blagden, N.; de Matas, M.; Gavan, P.T.; York, P. Crystal engineering of active pharmaceutical ingredients to improve solubility and dissolution rates. Adv. Drug Deliv. Rev. 2007, 59, 617–630. [Google Scholar] [CrossRef] [PubMed]
  12. Bak, A.; Gore, A.; Yanez, E.; Stanton, M.; Tufekcic, S.; Syed, R.; Akrami, A.; Rose, M.; Surapaneni, S.; Bostick, T.; et al. The co-crystal approach to improve the exposure of a water-insoluble compound: amg 517 sorbic acid co-crystal characterization and pharmacokinetics. J. Pharm. Sci. 2008, 97, 3942–3956. [Google Scholar] [CrossRef] [PubMed]
  13. Kang, B.K.; Lee, J.S.; Chon, S.K.; Jeong, S.Y.; Yuk, S.H.; Khang, G.; Lee, H.B.; Cho, S.H. Development of self-microemulsifying drug delivery systems (SMEDDS) for oral bioavailability enhancement of simvastatin in beagle dogs. Int. J. Pharm. 2004, 274, 65–73. [Google Scholar] [CrossRef] [PubMed]
  14. Taniguchi, C.; Kawabata, Y.; Wada, K.; Yamada, S.; Onoue, S. Microenvironmental pH-modification to improve dissolution behavior and oral absorption for drugs with pH-dependent solubility. Expert. Opin. Drug. Deliv. 2014, 11, 505–516. [Google Scholar] [CrossRef] [PubMed]
  15. Loftsson, T.; Brewster, M.E. Pharmaceutical applications of cyclodextrins. 1. Drug solubilization and stabilization. J. Pharm. Sci. 1996, 85, 1017–1025. [Google Scholar] [CrossRef] [PubMed]
  16. Muller, R.H.; Gohla, S.; Keck, C.M. State of the art of nanocrystals—special features, production, nanotoxicology aspects and intracellular delivery. Eur. J. Pharm. Biopharm. 2011, 78, 1–9. [Google Scholar] [CrossRef] [PubMed]
  17. Henwood, S.Q.; Liebenberg, W.; Tiedt, L.R. Characterization of the solubility and dissolution properties of several new rifampicin polymorphs, solvates, and hydrates. Drug Dev. Ind. Pharm. 2001, 27, 1017–1030. [Google Scholar] [CrossRef] [PubMed]
  18. Braun, D.E.; Gelbrich, T.; Kahlenberg, V.; Tessadri, R.; Wieser, J.; Griesser, U.J. Characterization of the solubility and dissolution properties of several new rifampicin polymorphs, solvates, and hydrates. J. Pharm. Sci. 2008, 98, 2010–2026. [Google Scholar] [CrossRef] [PubMed]
  19. Velaga, S.P.; Berger, R.; Carlfors, J. Supercritical fluids crystallization of budesonide and flunisolide. Pharm. Res. 2002, 19, 1564–1571. [Google Scholar] [CrossRef] [PubMed]
  20. Pasquali, I.; Bettini, R.; Giordano, F. Supercritical fluid technologies: an innovative approach for manipulating the solid-state of pharmaceuticals. Adv. Drug Deliv. Rev. 2008, 60, 399–410. [Google Scholar] [CrossRef] [PubMed]
  21. Sergeev, G.B.; Komarov, V.S.; Shabatin, V.P. Method of Obtaining Powders of Drugs. Patent RU 2195264, 25 December 2002. [Google Scholar]
  22. Vernaya, O.I.; Shabatin, V.P.; Semenov, A.M.; Shabatina, T.I. Obtaining ultradispersed dioxidine powder modified via cryochemical synthesis and determining its antibacterial activity. Mosc. Univ. Chem. Bull. 2016, 71, 295–298. [Google Scholar] [CrossRef]
  23. Vernaya, O.I.; Shabatin, V.P.; Semenov, A.M.; Shabatina, T.I. Cryochemical synthesis and antibacterial activity of a hybrid composition based on ag nanoparticles and dioxidine. Mosc. Univ. Chem. Bull. 2017, 72, 6–9. [Google Scholar] [CrossRef]
  24. Chakkittakandy, R.; Corver, J.A.W.M.; Planken, P.C.M. Terahertz Spectroscopy to Identify the Polymorphs in Freeze-Dried Mannitol. J. Pharm. Sci. 2010, 99, 932–940. [Google Scholar] [CrossRef] [PubMed]
  25. Morozov, Y.N.; Utekhina, A.Y.; Shabatin, V.P.; Chernyshev, V.V.; Sergeev, G.B. Cryosynthesis of nanosized drug substances. Russ. J. Gen. Chem. 2014, 84, 1010–1017. [Google Scholar] [CrossRef]
  26. Morozov, Y.N.; Fedorov, V.V.; Shabatin, V.P.; Vernaya, O.I.; Chernyshev, V.V.; Abel, A.S.; Arhangel’skii, I.V.; Shabatina, T.I.; Sergeev, G.B. cryochemical modification of drugs: nanosized form iii piroxicam and its physical and chemical properties. Mosc. Univ. Chem. Bull. 2016, 71, 287–294. [Google Scholar] [CrossRef]
  27. Chernyshev, V.V.; Morozov, Y.N.; Bushmarinov, I.S.; Makoed, A.A.; Sergeev, G.B. New polymorph of dehydroepiandrosterone (dhea) obtained via cryomodification. Cryst. Growth Des. 2016, 16, 1088–1095. [Google Scholar] [CrossRef]
  28. Vernaya, O.I.; Shabatin, V.P.; Shabatina Khvatov, D.I.; Semenov, A.M.; Yudina, T.P.; Danilov, V.S. Cryochemical modification, activity, and toxicity of dioxidine. Russ. J. Phys. Chem. A 2017, 91, 229–232. [Google Scholar] [CrossRef]
  29. Shabatin, V.P.; Vernaya, O.I.; Semenov, A.M.; Shabatina, T.I. Crystalline β—Modification Of 2,3-Bis-(Hydroxymethyl)-Quinoxaline-N,N′-Dioxide, Method for its Preparation and Pharmaceutical Composition on Its Basis. Patent RU2563256, 11 April 2014. [Google Scholar]
  30. Padeiskaya, E.N.; Pershin, G.N.; Kostyuchenok, B.M. Dioxidine, a new antibacterial drug for the treatment of suppurative infections. Pharm. Chem. J. 1977, 11, 1148–1154. [Google Scholar] [CrossRef]
  31. Padeiskaya, E.N.; Shipilova, L.D.; Budanova, L.I.; Sizova, T.N.; Ovdeenko, N.I.; Sedov, V.V. Pharmacokinetics of dioxidine: penetration of the drug into organs and tissues after single and repeated introductions. Pharm. Chem. J. 1983, 17, 391–396. [Google Scholar] [CrossRef]
  32. Werner, P.-E.; Eriksson, L.; Westdahl, M. TREOR: A semi-exhaustive trial-and-error powder indexing program for all symmetries. J. Appl. Crystallogr. 1985, 18, 367–370. [Google Scholar] [CrossRef]
  33. Visser, J.W. A fully automatic program for finding the unit cell from powder data. J. Appl. Crystallogr. 1969, 2, 89–95. [Google Scholar] [CrossRef] [Green Version]
  34. Zlokazov, V.B. MRIAAU a program for autoindexing multiphase polycrystals. J. Appl. Crystallogr. 1992, 25, 69–72. [Google Scholar] [CrossRef]
  35. Zlokazov, V.B. AUTOX—A program for autoindexing reflections from multiphase polycrystals. Comput. Phys. Commun. 1995, 85, 415–422. [Google Scholar] [CrossRef]
  36. Pawley, G.S. Unit-Cell Refinement from Powder Diffraction Scans. J. Appl. Crystallogr. 1981, 14, 357–361. [Google Scholar] [CrossRef]
  37. Zhukov, S.G.; Chernyshev, V.V.; Babaev, E.V.; Sonneveld, E.J.; Schenk, H. Application of simulated annealing approach for structure solution of molecular crystals from x-ray laboratory powder data. Z. Kristallogr. 2001, 216, 5–9. [Google Scholar] [CrossRef]
  38. Chernyshev, V.V.; Schenk, H. A grid search procedure of positioning a known molecule in an unknown crystal structure with the use of powder diffraction data. Z. Kristallogr. 1998, 213, 1–3. [Google Scholar] [CrossRef]
  39. Zlokazov, V.B.; Chernyshev, V.V. mria—A program for a full profile analysis of powder multiphase neutron-diffraction time-of-flight (direct and fourier) spectra. J. Appl. Crystallogr. 1992, 25, 447–451. [Google Scholar] [CrossRef]
  40. Dvoryantseva, G.G.; Lindeman, S.V.; Aleksanyan, S.V.; Struchkov, Y.T.; Teten’chuk, K.P.; Khabarova, L.S.; Elina, A.S. Connection Between the structure and the antibacterial activity of the n-oxides of quinoxalines. molecular structure of dioxidine and quinoxidine. Pharm. Chem. J. 1990, 24, 80–84. [Google Scholar] [CrossRef]
  41. Isaeva, V.I.; Belyaeva, E.V.; Fitch, A.N.; Chernyshev, V.V.; Klyamkin, S.N.; Kustov, L.M. synthesis and structural characterization of a series of novel zn(ii)-based mofs with pyridine-2,5-dicarboxylate linkers. Cryst. Growth Des. 2013, 13, 5305–5315. [Google Scholar] [CrossRef]
  42. Popa, N.C. The (hkl) dependence of diffraction-line broadening caused by strain and size for all laue groups in rietveld refinement. J. Appl. Crystallogr. 1998, 31, 176–180. [Google Scholar] [CrossRef]
  43. Ahtee, M.; Nurmela, M.; Suortti, P.; Järvinen, M. correction for preferred orientation in rietveld refinement. J. Appl. Crystallogr. 1989, 22, 261–268. [Google Scholar] [CrossRef]
  44. Järvinen, M. Application of symmetrized harmonics expansion to correction of the preferred orientation effect. J. Appl. Crystallogr. 1993, 26, 525–531. [Google Scholar] [CrossRef] [Green Version]
  45. Spek, A.L. Structure validation in chemical crystallography. Acta Crystallogr. D 2009, D65, 148–155. [Google Scholar] [CrossRef] [PubMed]
  46. Macrae, C.F.; Bruno, I.J.; Chisholm, J.A.; Edgington, P.R.; McCabe, P.; Pidcock, E.; Rodriguez-Monge, L.; Taylor, R.; van de Streek, J.; Wood, P.A. Mercury CSD 2.0—new features for the visualization and investigation of crystal structures. J. Appl. Crystallogr. 2008, 41, 466–470. [Google Scholar] [CrossRef]
Figure 1. Thermogravimetry (TG) (green) and differential scanning calorimetry (DSC) (blue) curves of initial (a) and cryomodified (b) dioxidine forms.
Crystals 08 00298 g001
Figure 2. TEM micrograph of cryomodified dioxidine form.
Crystals 08 00298 g002
Figure 3. Dissolution curves of initial and cryomodified dioxidine forms.
Crystals 08 00298 g003
Figure 4. Rietveld plot for the two-phase pattern of 1 showing the experimental (black) and difference (red) curves. The vertical blue bars denote the calculated positions of diffraction peaks for crystalline phases H (top raw) and M (bottom raw).
Crystals 08 00298 g004
Figure 5. Rietveld plot for the three-phase pattern of 2 showing the experimental (black) and difference (red) curves. The vertical blue bars denote the calculated positions of diffraction peaks for crystalline phases H (top raw), T (middle raw) and M (bottom raw).
Crystals 08 00298 g005
Figure 6. Rietveld plot for the single-phase pattern of 3 showing the experimental (black) and difference (red) curves. The vertical blue bars denote the calculated positions of diffraction peaks for crystalline phase T.
Crystals 08 00298 g006
Figure 7. A portion of the three-phase pattern of 2 showing the experimental intensities (black dots), calculated contribution of two phases—H + T (green curve), and difference red curve, corresponding to the contribution of phase M. The vertical blue bars denote the calculated positions of diffraction peaks for crystalline phase M.
Crystals 08 00298 g007
Figure 8. The molecular conformations of independent dioxidine molecule in T (a) and M (b) showing the atomic numbering and 50% probability displacement spheres.
Crystals 08 00298 g008
Figure 9. The asymmetric unit of H containing three independent dioxidine molecules—A, B and C, and crystalline water molecule (O1W). Displacement spheres are shown at the 50% probability level.
Crystals 08 00298 g009
Figure 10. A portion of the crystal packing of T showing the O−H···O hydrogen-bonded (thin purple lines) chain extended in [1-1-1].
Crystals 08 00298 g010
Figure 11. A portion of the crystal packing of M showing the O−H···O hydrogen-bonded (thin purple lines) chain extended in [100].
Crystals 08 00298 g011
Table 1. Crystallographic data for two anhydrous (T and M) and a hydrated (H) forms of Dioxidine 1.
Crystal Polymorph FormsTMH
Empirical formulaC10H10N2O4C10H10N2O4C10H10N2O4·0.33H2O
Formula weight222.20222.20228.21
Crystal systemtriclinicmonoclinicorthorhombic
Space groupP-1P21/cPbca
a, Å7.3194 (7)9.1709 (9)18.0035 (15)
b, Å8.0774 (8)15.3486 (14)31.8369 (19)
c, Å8.9872 (8)7.0367 (7)10.2555 (12)
θ, deg71.516 (11)9090
β, deg70.815 (9)110.316 (12)90
θ, deg79.317 (12)9090
V, Å3473.98 (8)928.87 (16)5878.2 (9)
M20260154144
F30583 (0.0014, 38)421 (0.0023, 43)397 (0.0021, 68)
Z2424
DiffractometerID22, ESRFID22, ESRFID22, ESRF
Wavelength, Å0.399996 (3)0.399996 (3)0.399996 (3)
ρcalc, g/cm31.5571.5891.547
μ, mm−10.0270.0280.027
2θmin–2θmax, increment, deg2.001–19.902, 0.0031.200–19.995, 0.0031.200–20.877, 0.003
Number of parameters/restraints124/56118/56235/177
Rp/Rwp/Rexp0.0316/0.0438/0.01680.0235/0.0317/0.01780.0243/0.0325/0.0165
goodness-of-fit2.6081.7641.947
1 For the powder patterns with M and H forms the multi-phase Rietveld refinement was applied.
Table 2. Hydrogen-bonding geometry (Å, degrees) in T, M and H crystalline phases.
D–H···AD–HH···AD···A∠O–H···A
T
O14−H14···O11i0.821.952.721(3)156
O16−H16···O12ii0.821.922.733(3)171
C13−H13B···O16iii0.972.423.205(5)138
C15−H15A···O11iv0.972.523.241(5)131
C8−H8···O12v0.932.543.382(5)150
M
O14−H14···O11vi0.822.213.001(6)162
O16−H16···O14vii0.821.862.588(6)148
C13−H13B···O16viii0.932.283.106(8)147
C15−H15A···O14vii0.972.372.922(8)115
H
O14A−H14A···O11C0.822.132.741(8)131
O14B−H14B···O12Cix0.821.932.692(8)154
O14C−H14C···O16Bx0.821.922.710(8)163
O16A−H16A···O12A0.822.372.884(8)122
O16A−H16A···O12Axi0.822.032.755(8)147
O16B−H16B···O16Axi0.8222.769(8)157
O16C−H16C···O11Bxii0.822.072.827(8)153
O1W−H1A···O16C0.852.022.828(8)157
O1W−H1B···O14Bxiii0.852.072.815(8)147
C5A−H5A···O16B0.932.513.287(11)141
C5B−H5B···O14Axi0.932.573.490(9)171
C6A−H6A···O16Cxiv0.932.563.289(9)136
C7B−H7B···O11Axi0.932.283.180(11)161
C13C−H13E···O11A0.972.53.306(11)140
C15A−H15B···O11Cxvi0.972.373.138(11)135
C15C−H15E···O11Bxvii0.972.363.222(10)148
Symmetry codes: (i) 2 − x, −y, −z; (ii) 1 − x, 1 − y, 1 − z; (iii) x, y − 1, z; (iv) 1 − x, 1 − y, −z; (v) x, 1 + y, z; (vi) −x, −y, −z; (vii) 1 − x, −y, −z; (viii) −x, y + 1/2, ½ − z; (ix) 1 + x, ½ − y, z − 1/2; (x) x − 1/2, y, 3/2 − z; (xi) 1 − x, −y, 1 − z; (xii) x − 1, y, z; (xiii) x − 1/2, y, ½ − z; (xiv) ½ + x, ½ − y, 1 − z; (xv) 1 + x, y, z; (xvi) ½ − x, −y, z − 1/2; (xvii) x − 1, ½ − y, ½ − z.

