Growth and Photocatalytic Properties of Gallium Oxide Films Using Chemical Bath Deposition
by

Che-Yuan Yeh
1,†, 
Yi-Man Zhao
1,2,†,
Hui Li
1,2,
Fei-Peng Yu
3,
Sam Zhang
2,* and
Dong-Sing Wuu
1,4,* 1
Department of Materials Science and Engineering, National Chung Hsing University, No. 145, Xingda Rd., Taichung 40227, Taiwan
2
Center for Advanced Thin Films and Devices, School of Materials and Energy, Southwest University, No. 2, Tiansheng Rd., Chongqing 400715, China
3
Department of Materials Science and Engineering, Da-Yeh University, No. 168, University Rd., Changhua 51591, Taiwan
4
Innovation and Development Center of Sustainable Agriculture, National Chung Hsing University, No. 145, Xingda Rd., Taichung 40227, Taiwan
*
Authors to whom correspondence should be addressed.
†
These authors contributed equally to this work.
Crystals 2019, 9(11), 564; https://doi.org/10.3390/cryst9110564
Submission received: 4 October 2019
/
Revised: 24 October 2019
/
Accepted: 25 October 2019
/
Published: 27 October 2019
(This article belongs to the Special Issue Functional Oxide Based Thin-Film Materials)
Abstract
:Gallium oxide (Ga2O3) thin films were fabricated on glass substrates using a combination of chemical bath deposition and post-annealing process. From the field-emission scanning electron microscopy and x-ray diffraction results, the GaOOH nanorods precursors with better crystallinity can be achieved under higher concentrations (≥0.05 M) of gallium nitrate (Ga(NO3)3). It was found that the GaOOH synthesized from lower Ga(NO3)3 concentration did not transform into α-Ga2O3 among the annealing temperatures used (400–600 °C). Under higher Ga(NO3)3 concentrations (≥0.05 M) with higher annealing temperatures (≥500 °C), the GaOOH can be transformed into the Ga2O3 film successfully. An α-Ga2O3 sample synthesized in a mixed solution of 0.075 M Ga(NO3)3 and 0.5 M hexamethylenetetramine exhibited optimum crystallinity after annealing at 500 °C, where the α-Ga2O3 nanostructure film showed the highest aspect ratio of 5.23. As a result, the photodegeneration efficiencies of the α-Ga2O3 film for the methylene blue aqueous solution can reach 90%.
1. Introduction
Environmental protection, especially against water pollution, has generated public interest in recent years, and the application of nanotechnology in this field has become a hot topic. Photocatalysis using natural sunlight as a clean energy source, has been extensively studied for environmental remediation since its discovery [1,2,3,4]. Methylene blue (MB), a common dye, has been widely used for the commercial products such as the dyeing paper, linen, silk fabric, bamboo, wood, etc. The discharge of untreated MB into the wastewater can lead to serious pollution problems, making degradation and decolorization of MB is one of the important targets of dyeing wastewater treatment [5,6].
Metal oxides, such as titanium dioxide, zinc oxide, and gallium oxide (Ga2O3), are considered promising for photocatalytic applications due to their excellent physical and chemical properties [7,8,9,10,11]. Among these metal oxides, Ga2O3, with various polymorphs (α-, β-, γ-, δ-, and ε-) can be synthesized at different temperatures [12,13]. Gallium oxides, which have wide bandgap ranging from 4.2 to 4.9 eV, are particularly important semiconductor materials [11,14]. The Ga2O3 material can be used for various device applications, such as gas sensors [15], catalysis [16], power and high voltage electronic devices [13] because it has unique conductive properties and is electrically and thermodynamically stable [17,18,19]. Various polymorphs of Ga2O3 as the photocatalysts in the degradation of organic dyes have been studied previously [11,20,21,22]. Reddy et al. [11] have reported that the photodegeneration efficiencies of α-Ga2O3 and β-Ga2O3 nanorods for the rhodamine B aqueous solution were 62% and 79%, respectively. The photocatalytic activity of α-Ga2O3 in the malachite green degradation was studied by Rodríguez et al. [20]. Zhao et al. [21], have demonstrated that the photodegeneration efficiency of β-Ga2O3 nanorods in the perfluorooctanic acid can reach 98.8%. In addition, the photocatalytic activity of the γ-Ga2O3 in rhodamine 590 degradation has also been investigated by Jin et al. [22].
Recently, various methods have been used to synthesize Ga2O3, including hydrothermal techniques [11,23], microwave-assisted hydrothermal methods [21], sol-gel methods [24], spray pyrolysis processes [25], and chemical vapor deposition [26]. The advantages of CBD for the synthesis of metal oxide thin films are based on the relatively low cost and convenience for deposition over a large area [27]. However, there are very few reports on the synthesis of Ga2O3 thin films via CBD. In this study, the Ga2O3 thin films were synthesized on the glass substrates using CBD with various post annealing treatments. The chemistry of the synthesis process can be summarized as follows [20,28,29,30]:
(CH2)6N4 + 6H2O → 4NH3 + 6HCHO
NH3 + H2O → NH4+ + OH
3OH−+ Ga3+ → Ga(OH)3
Ga(OH)3 → GaOOH+H2O
2. Experimental
Ga2O3 thin films were prepared on glass substrates using CBD. Analytical grade gallium (III) nitrate hydrate (Ga(NO3)3·nH2O, 99.9%) and hexamethylenetetramine (HMT, 99.9%) were used as starting materials. The glass substrates were cleaned with acetone, methanol, and 10% hydrofluoric acid for 10 min respectively, then rinsed with deionized (DI) water. Three growth solutions were prepared by dissolving 0.025 mol, 0.05 moL, or 0.075 mol Ga(NO3)3 and 0.5 mol HMT in 1 L of DI water. To obtain the GaOOH precursor, each aqueous solution was placed in a beaker with a glass substrate and vigorously stirred at 500 rpm with a magnetic stirrer for 5 h at 95 °C. The precursor was then dried at 70 °C for 5 min and allowed to cool naturally to room temperature. The as-prepared GaOOH thin films were annealed in a furnace tube at either 400 °C, 500 °C, or 600 °C for 3 h to form Ga2O3 thin films.
The crystal structures of the as-prepared samples were characterized using a high resolution X-ray diffraction system (HR-XRD, X’Pert Pro MRD, PANanalytical, Almelo, Nederland). A JSM-6700F field-emission scanning electron microscope (FE-SEM, JEOL, Tokyo, Japan) equipped with an energy dispersive spectrometer (EDS) was used to analyze the morphologies of the samples and their elemental distributions. FT-IR spectra were collected in the range from 4000 to 500 cm−1 with a Vertex 80v Fourier transform infrared spectrometer (Bruker, Billerica, Massachusetts, MA, USA). The photocatalytic properties of the Ga2O3 thin films in aqueous MB solutions were evaluated during and after irradiation under an 8 W UV lamp at wavelengths from 100 to 280 nm. Thin films with dimensions of 1 cm × 1 cm were first placed in aqueous solutions containing 5 ppm MB. The solutions were then irradiated for 5 h at room temperature in an otherwise dark environment. Photodegradation efficiency was determined through UV-visible spectrophotometric analysis (U3010, Hitachi, Tokyo, Japan)
3. Results and Discussion
The FE-SEM images of the GaOOH nanostructures obtained via CBD at various Ga(NO3)3 concentrations are shown in Figure 1, where the length, width, and the aspect ratio of at least eight GaOOH nanorods were measured. It was found that the Ga(NO3)3 concentration significantly influenced the synthesis of GaOOH nanorods and the formation of Ga2O3 thin films during the annealing process. The GaOOH crystalline quality increased as the Ga(NO3)3 concentration increased from 0.025 M (Figure 1a,d) to 0.075 M (Figure 1c,f). The average length, width and the aspect ratio of the GaOOH nanorods prepared from 0.025 M Ga(NO3)3 were 0.88 μm, 0.27 μm and 3.23, respectively (Figure 1d). The average length, width and the aspect ratio of the GaOOH nanorods prepared from 0.05 M Ga(NO3)3 were 0.92 μm, 0.25 μm and 3.76, respectively (Figure 1e). When the Ga(NO3)3 concentration increased to 0.075 M, the average length, width and the aspect ratio of the GaOOH nanorods increased to 1.24 μm, 0.25 μm and 5.06, respectively (Figure 1f). These indicated that the higher concentration of Ga(NO3)3 yielded the GaOOH nanorods with better crystallinity.
Figure 2a shows the XRD pattern of the as-prepared GaOOH obtained at each Ga(NO3)3 concentration. The full width at half maximum (FWHM) of each (110) crystal plane diffraction peak was calculated from XRD data as shown in Figure 2b. The XRD patterns indicated the as-prepared GaOOH had an orthorhombic structure (JCPDS no. 01–180). The sharp diffraction peak of the (110) crystal plane appeared at (2θ) 21.4° in the pattern of each sample. This indicated that GaOOH crystal growth proceeded preferentially in the [001] direction at each Ga(NO3)3 concentration. The diffraction peaks of the (130), (111), and (240) crystal planes of GaOOH were observed at (2θ) 33.7°, 37.2°, and 54.02°, respectively. The peaks at 21.4° in the patterns of GaOOH nanorods prepared using 0.025 M, 0.05 M, and 0.075 M Ga(NO3)3 had FWHMs of 878, 759.7, and 745.1 arcsec, respectively (Figure 2b). The FWHM of this peak was related to the crystallinity of the GaOOH nanorods and indicated that the crystallinity of the nanorods prepared with 0.075 M Ga(NO3)3 was higher than that of the other GaOOH samples. The XRD results agreed well with the crystallinity trend of the GaOOH nanorods deposited from various Ga(NO3)3 concentrations as presented in Figure 1.
An FTIR spectra of the as-prepared GaOOH nanorods synthesized at each Ga(NO3)3 concentration is shown in Figure 3. It is known that the peak at ~3222 cm−1 in the FTIR spectra of GaOOH nanorods was assigned to the H-OH stretching vibration, and the stretching vibration of O–H bonds was observed around 1323 cm−1 due to the adsorption of water molecules [11,31]. The peak at ~750 cm−1 was assigned to the Ga-O-H stretching vibration [20]. It is worthy to mention that the Ga-O-H bond will be enhanced and shifted from ~750 to ~820 cm−1 as the GaOOH content increased, [31,32]. This confirmed that the GaOOH nanostructure thin films were successfully grown on the glass substrates via CBD.
Figure 4 shows the XRD patterns of Ga2O3 in the films after annealing for 3 h at various temperatures from 400 to 600 °C. As shown in Figure 4a, the α-Ga2O3 polymorph (JCPDS no. 06–0503) was not indicated in any of the samples annealed at 400 °C. Possibly, the GaOOH could not change to α-Ga2O3 at such as a low temperature [12]. It was also found that the GaOOH synthesized from 0.025 M Ga(NO3)3 did not transform into α-Ga2O3 among these annealing temperatures. However, the transformation of as-prepared GaOOH into orthorhombic α-Ga2O3 occurred during annealing at 500 and 600 °C. The sharp diffraction peaks of the (104) and (110) α-Ga2O3 crystal planes were observed at (2θ) 33.78° and 36.03°, respectively. Table 1 shows the FWHM data of the (104) α-Ga2O3 diffraction peaks obtained from 500 and 600 °C-annealed GaOOH samples with 0.05 and 0.075 M Ga(NO3)3 concentrations. Obviously, the CBD-GaOOH sample with 0.075 M Ga(NO3)3 concentration and post thermal treatment at 500 °C can result in higher crystallinity of α-Ga2O3
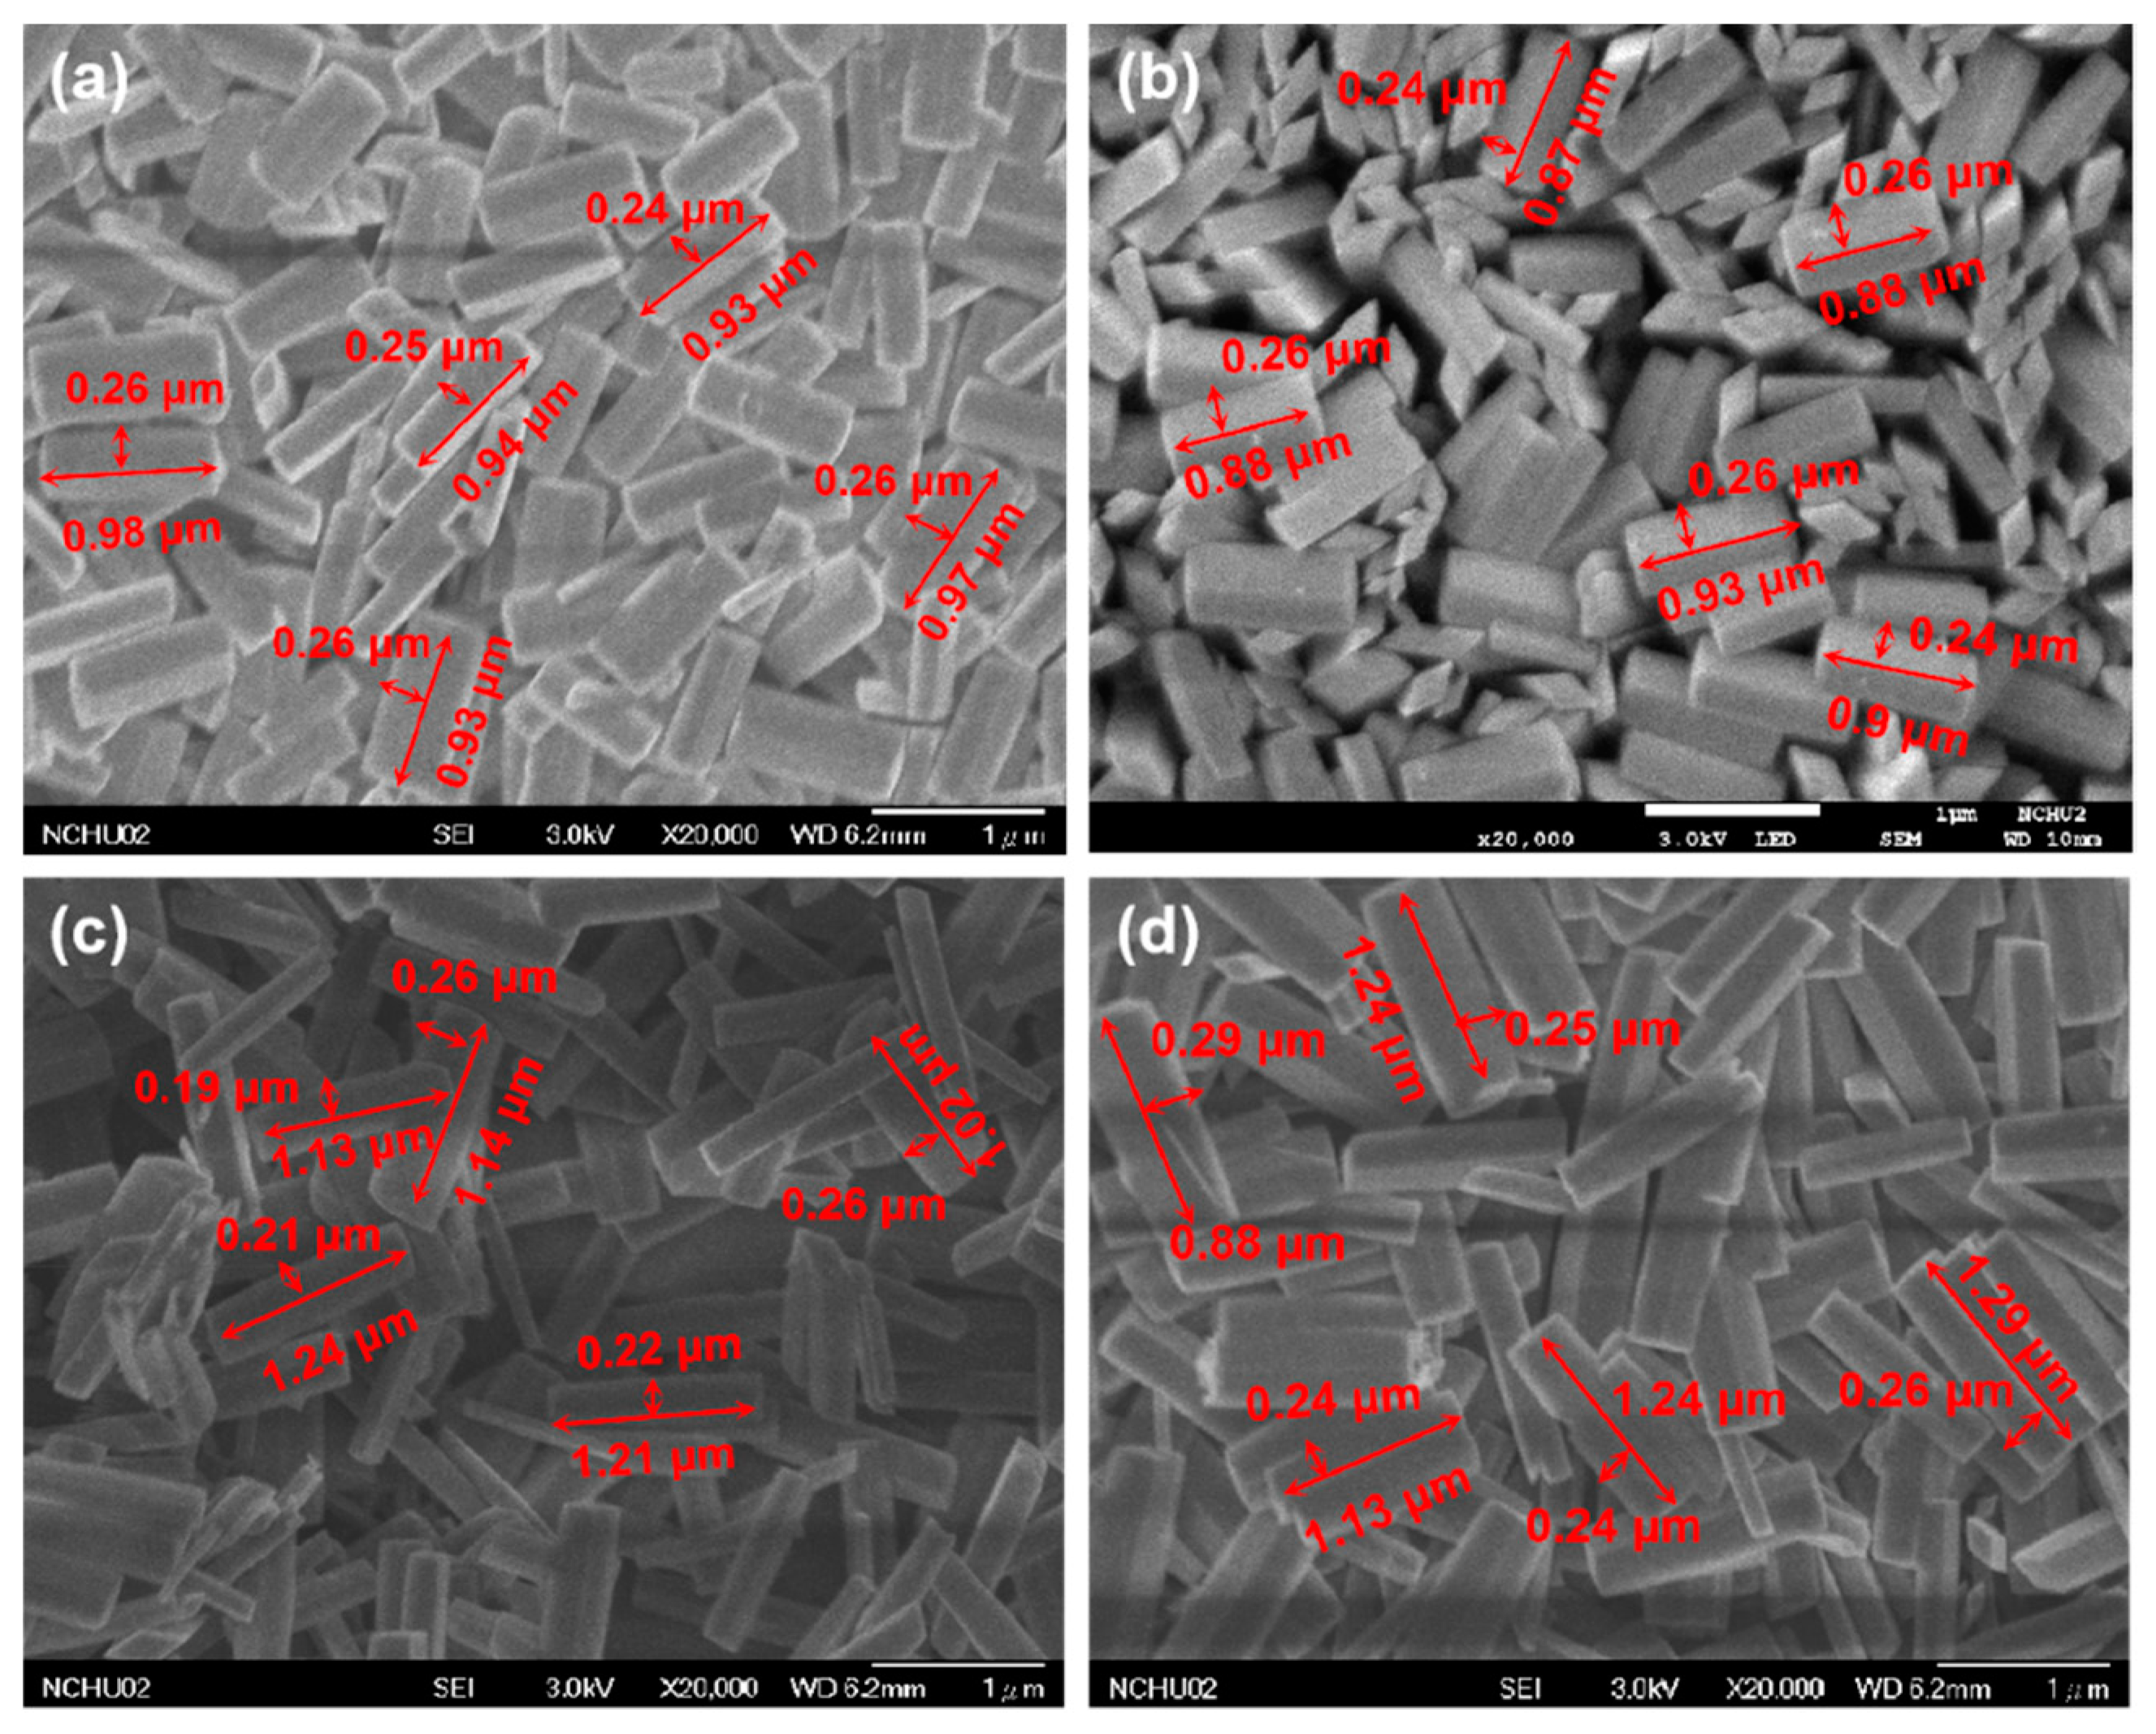
Figure 5 shows the corresponding FE-SEM micrograph of the α-Ga2O3 sample as tabulated in Table 1. After annealing at 500 °C, the average length, width and the aspect ratio of the Ga2O3 nanorods obtained from CBD-GaOOH with 0.05 M Ga(NO3)3 were 0.94 μm, 0.26 μm and 3.63, respectively (Figure 5a). When the annealing temperature increased to 600 °C, the average length, width and the aspect ratio of the Ga2O3 nanorods were 0.89 μm, 0.26 μm, and 3.45, respectively (Figure 5b). Besides, the average length, width and the aspect ratio of the Ga2O3 nanorods obtained from 500 °C-annealed GaOOH with 0.075 M Ga(NO3)3 were 1.16 μm, 0.23 μm and 5.23, respectively (Figure 5c). When the annealing temperature increased to 600 °C, the average length, width and the aspect ratio of the Ga2O3 nanorods were 1.22 μm, 0.26 μm, and 4.68, respectively (Figure 5d). Here, all the data of length, width, and the aspect ratio shown in the micrographs were measured at least eight times. It becomes clear that the higher annealing temperature (i.e., 600 °C) will lead to the slight decrease in the aspect ratio of Ga2O3 nanorods. As a result, these nanorods were tightly packed together.
The elemental compositions of the annealed samples were analyzed via EDS. The EDS spectra of samples prepared using Ga(NO3)3 at various concentrations after annealing at 500 °C are shown in Figure 6. The Si peaks in the EDS spectra were attributed to silicon in the glass substrates. The at.% of Ga in the sample prepared from 0.025 M Ga(NO3)3 was only 1.92% (Figure 6a). When the Ga(NO3)3 concentration increased to 0.05 M, the content of Ga atoms in the sample increased to 16.56% (Figure 6b). Moreover, the at.% of Ga in the sample prepared from 0.075 M Ga(NO3)3 was 30.35% (Figure 6c). From the XRD results as described in Figure 4, the CBD-GaOOH prepared under the lower concentration (0.025 M) cannot be transformed into the α-Ga2O3 regardless of the annealing temperature. It may be due to the fact that the 0.025 M Ga(NO3)3 cannot provide enough Ga content to transform into α-Ga2O3.
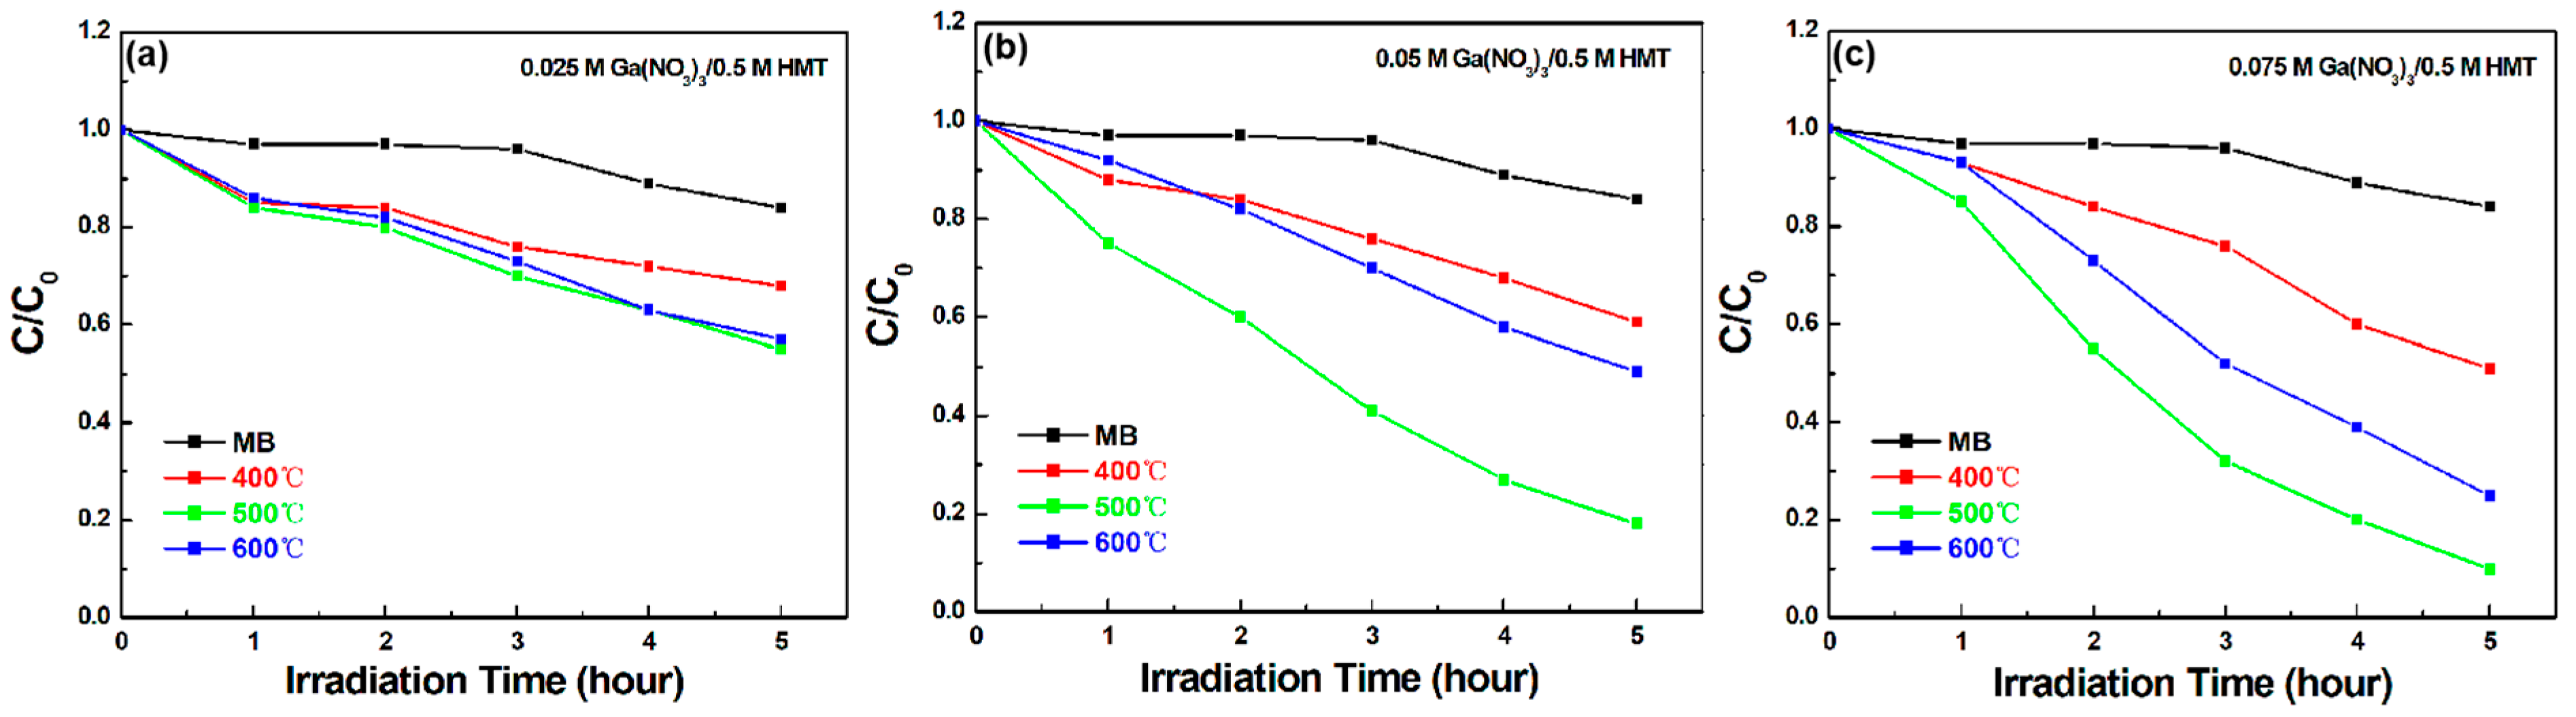
The photocatalytic properties of the α-Ga2O3 thin films in the MB solutions were examined under irradiation with UV light. The Ga2O3 shows the photocatalytic activity under deep-UV absorption owing to its high bandgap. In general, when the photon was absorbed into photocatalyst, the electron-hole pairs generated on the surface of Ga2O3 were used to the degradation of the MB solution. After interacting with aqueous media, these electrons and holes generate hydroxyl ions, which play the significant role in the degradation process. These hydroxyl ions have strong oxidation capabilities as they can mineralize most of organic compounds. Moreover, the photocatalytic activities intimately depend on the crystallinity and surface area. From the XRD (Figure 4) and FWHMs analyses (Table 1), the good crystallinity of α-Ga2O3 sample prepared using 0.075 M Ga(NO3)3 can bring the stable photocatalytic properties as compared with those of the other α-Ga2O3 samples. The calculated constant reaction rates of MB photodegradation by Ga2O3 in the solutions (C/C0) are plotted as a function of UV irradiation time in Figure 7. C0 is the initial MB concentration in solution, and C is the MB concentration in the UV-irradiated solution. The rates of MB self-degradation in solutions without the catalyst are shown for comparison. Absorbance by MB was monitored at 664 nm [33]. After 5 h of UV irradiation, 82% of the MB was photodegraded by α-Ga2O3 obtained from GaOOH prepared from 0.05 M Ga(NO3)3 after annealing at 500 °C (Figure 7b). Photodegradation by α-Ga2O3 obtained from the GaOOH sample prepared using 0.075 M Ga(NO3)3 after annealing at 500 °C was particularly efficient. After UV irradiation for 5 h, 90% of the MB had been photodegraded by the catalyst (Figure 7c). As shown in Figure 7a, only 29% of the MB was photodegraded by the sample obtained from GaOOH prepared using 0.025 M Ga(NO3)3. Based on the XRD results (Figure 4), its low photodegradation efficiency may have been due to the lack of GaOOH transformation into α-Ga2O3. The photodegradation efficiencies of α-Ga2O3 samples obtained after annealing at 500 °C were higher than those of α-Ga2O3 obtained after annealing at 600 °C. This may have been due to the higher the aspect ratio of the α-Ga2O3 annealed at 500 °C, which can lead to more surface area under the process of the degradation of the MB solution. The photocatalytic properties of α-Ga2O3 observed during the degradation of MB suggested it held promise for environmental remediation applications.
4. Conclusions
GaOOH thin films were successfully grown on glass substrates via CBD at 95 °C. The as-prepared GaOOH thin films were annealed for 3 h at either 400 °C, 500 °C, or 600 °C to convert GaOOH into thin films of α-Ga2O3, and the crystal structures and elemental compositions were confirmed through the XRD and EDS analysis, respectively. Nanocrystalline α-Ga2O3 films were obtained from GaOOH prepared at Ga(NO3)3 concentrations at or above 0.05 M after annealing at 500 °C or 600 °C. The α-Ga2O3 sample obtained after annealing GaOOH prepared at a Ga(NO3)3 concentration of 0.075 M photodegraded 90% of the MB in a solution irradiated under a UV lamp for 5 h. These results suggest that α-Ga2O3 thin films can be very useful alternatives for the photocatalytic degradation of dyes during wastewater treatment.
Author Contributions
Conceptualization and supervision, D.-S.W.; methodology, C.-Y.Y.; H.L. and F.-P.Y.; validation, C.-Y.Y.; data curation, C.-Y.Y. and Y.-M.Z.; writing-review and editing; Y.-M.Z., S.Z. and D.-S.W.
Funding
This work was financially supported by the Ministry of Science and Technology of Taiwan under grant No. 108–2221-E-005–028-MY3 and in part by the “Innovation and Development Center of Sustainable Agriculture” from The Featured Areas Research Center Program within the framework of the Higher Education Sprout Project by the Ministry of Education (MOE) in Taiwan. The work at Southwest University was partly supported by Fundamental Research Funds for the Central Universities: SWU118105.
Acknowledgments
The authors would like to thank the technical support from Yi-Guo Shang in the Department of Materials Science and Engineering, National Chung Hsing University, Taiwan, especially for the setup of chemical bath deposition and photocatalytic measurement systems.
Conflicts of Interest
The authors declare that they have no conflict of interest.
References
- Fujishima, A.; Honda, K. Electrochemical Photolysis of Water at a Semiconductor Electrode. Nature 1972, 238, 37–38. [Google Scholar] [CrossRef] [PubMed]
- Fujishima, A. Hydrogen Production under Sunlight with an Electrochemical Photocell. J. Electrochem. Soc. 1975, 122, 1487. [Google Scholar] [CrossRef]
- Djurišić, A.B.; Leung, Y.H.; Ng, A.M.C. Strategies for improving the efficiency of semiconductor metal oxide photocatalysis. Mater. Horizons 2014, 1, 400. [Google Scholar] [CrossRef]
- Benjwal, P.; Kar, K.K. Simultaneous photocatalysis and adsorption based removal of inorganic and organic impurities from water by titania/activated carbon/carbonized eponocoxy namposite. J. Environ. Chem. Eng. 2015, 3, 2076–2083. [Google Scholar] [CrossRef]
- Houas, A. Photocatalytic degradation pathway of methylene blue in water. Appl. Catal. B Environ. 2001, 31, 145–157. [Google Scholar] [CrossRef]
- Lachheb, H.; Puzenat, E.; Houas, A.; Ksibi, M.; Elaloui, E.; Guillard, C.; Herrmann, J.-M. Photocatalytic degradation of various types of dyes (Alizarin S, Crocein Orange G, Methyl Red, Congo Red, Methylene Blue) in water by UV-irradiated titania. Appl. Catal. B Environ. 2002, 39, 75–90. [Google Scholar] [CrossRef]
- Tan, L.-L.; Ong, W.-J.; Chai, S.-P.; Goh, B.T.; Mohamed, A.R. Visible-light-active oxygen-rich TiO2 decorated 2D graphene oxide with enhanced photocatalytic activity toward carbon dioxide reduction. Appl. Catal. B Environ. 2015, 179, 160–170. [Google Scholar] [CrossRef]
- Liu, L.; Gao, F.; Zhao, H.; Li, Y. Tailoring Cu valence and oxygen vacancy in Cu/TiO2 catalysts for enhanced CO2 photoreduction efficiency. Appl. Catal. B Environ. 2013, 134, 349–358. [Google Scholar] [CrossRef]
- Núñez, J.; O’Shea, V.A.D.L.P.; Jana, P.; Coronado, J.M.; Serrano, D.P.; O’Shea, V.A.D.L.P. Effect of copper on the performance of ZnO and ZnO1−xNx oxides as CO2 photoreduction catalysts. Catal. Today 2013, 209, 21–27. [Google Scholar] [CrossRef]
- Pan, Y.-X.; Sun, Z.-Q.; Cong, H.-P.; Men, Y.-L.; Xin, S.; Song, J.; Yu, S.-H. Photocatalytic CO2 reduction highly enhanced by oxygen vacancies on Pt-nanoparticle-dispersed gallium oxide. Nano Res. 2016, 9, 1689–1700. [Google Scholar] [CrossRef]
- Reddy, L.S.; Ko, Y.H.; Yu, J.S. Hydrothermal Synthesis and Photocatalytic Property of β-Ga2O3 Nanorods. Nanoscale Res. Lett. 2015, 10, 364. [Google Scholar] [CrossRef] [PubMed]
- Roy, R.; Hill, V.G.; Osborn, E.F. Polymorphism of Ga2O3and the System Ga2O3—H2O. J. Am. Chem. Soc. 1952, 74, 719–722. [Google Scholar] [CrossRef]
- Stepanov, S.I.; Nikolaev, V.I.; Bougrov, V.E.; Romanov, A.E. Gallium oxide: Properties and applications-a review. Mater. Sci. 2016, 44, 63–86. [Google Scholar]
- Liu, X.; Qiu, G.; Zhao, Y.; Zhang, N.; Yi, R. Gallium oxide nanorods by the conversion of gallium oxide hydroxide nanorods. J. Alloys Compd. 2007, 439, 275–278. [Google Scholar] [CrossRef]
- Pilliadugula, R.; Krishnan, N. Gas sensing performance of GaOOH and β-Ga2O3 synthesized by hydrothermal method: A comparison. Mater. Res. Express 2019, 6, 025027. [Google Scholar] [CrossRef]
- Nakagawa, K.; Kajita, C.; Okumura, K.; Ikenaga, N.-O.; Nishitani-Gamo, M.; Ando, T.; Kobayashi, T.; Suzuki, T. Role of Carbon Dioxide in the Dehydrogenation of Ethane over Gallium-Loaded Catalysts. J. Catal. 2001, 203, 87–93. [Google Scholar] [CrossRef]
- Kuperberg, J.M.; Réti, F.; Miró, J.; Herndon, R.C.; Hajnal, Z.; Kiss, G.; Deák, P. Role of oxygen vacancy defect states in the n -type conduction of β-Ga2O3. J. Appl. Phys. 1999, 86, 3792–3796. [Google Scholar]
- Wu, X.; Song, W.; Huang, W.; Pu, M.; Zhao, B.; Sun, Y.; Du, J. Crystalline gallium oxide nanowires: Intensive blue light emitters. Chem. Phys. Lett. 2000, 328, 5–9. [Google Scholar] [CrossRef]
- Binet, L.; Gourier, D. ORIGIN OF THE BLUE LUMINESCENCE OF β-Ga2O3. J. Phys. Chem. Solids 1998, 59, 1241–1249. [Google Scholar] [CrossRef]
- Rodríguez, C.I.M.; Álvarez, M.; Ángel, L.; Rivera, J.D.J.F.; Arízaga, G.G.C.; Michel, C.R. α-Ga2O3 as a Photocatalyst in the Degradation of Malachite Green. ECS J. Solid State Sci. Technol. 2019, 8, Q3180–Q3186. [Google Scholar] [CrossRef]
- Zhao, B.X.; Li, X.; Yang, L.; Wang, F.; Li, J.C.; Xia, W.X.; Li, W.J.; Zhou, L.; Zhao, C.L. β-Ga2O3 nanorod synthesis with a one-step microwave irradiation hydrothermal method and its efficient photocatalytic degradation for perfluorooctanoic acid. Photochem. Photobiol. 2015, 91, 42–47. [Google Scholar] [CrossRef] [PubMed]
- Jin, S.; Lu, W.; Stanish, P.C.; Radovanovic, P.V. Compositional control of the photocatalytic activity of Ga2O3 nanocrystals enabled by defect-induced carrier trapping. Chem. Phys. Lett. 2018, 706, 509–514. [Google Scholar] [CrossRef]
- Wang, Y.; Li, N.; Duan, P.; Sun, X.; Chu, B.; He, Q. Properties and Photocatalytic Activity of β-Ga2O3 Nanorods under Simulated Solar Irradiation. J. Nanomater. 2015, 2015, 126. [Google Scholar]
- Minami, T. Oxide thin-film electroluminescent devices and materials. Solid-State Electron. 2003, 47, 2237–2243. [Google Scholar] [CrossRef]
- Ji, Z.; Du, J.; Fan, J.; Wang, W. Gallium oxide films for filter and solar-blind UV detector. Opt. Mater. 2006, 28, 415–417. [Google Scholar] [CrossRef]
- Oshima, Y.; Vίllora, E.G.; Shimamura, K. Quasi-heteroepitaxial growth of β-Ga2O3 on off-angled sapphire (0001) substrates by halide vapor phase epitaxy. J. Cryst. Growth 2015, 410, 53–58. [Google Scholar] [CrossRef]
- Pawar, S.; Pawar, B.; Kim, J.; Joo, O.-S.; Lokhande, C. Recent status of chemical bath deposited metal chalcogenide and metal oxide thin films. Curr. Appl. Phys. 2011, 11, 117–161. [Google Scholar] [CrossRef]
- Zainelabdin, A.; Zaman, S.; Amin, G.; Nur, O.; Willander, M. Deposition of well-aligned ZnO nanorods at 50 °C on metal, semiconducting polymer, and copper oxides substrates and their structural and optical properties. Cryst. Growth Des. 2010, 10, 3250–3256. [Google Scholar] [CrossRef]
- Errico, V.; Arrabito, G.; Plant, S.R.; Medaglia, P.G.; Palmer, R.E.; Falconi, C. Chromium inhibition and sizeselected Au nanocluster catalysis for the solution growth of lowdensity ZnO nanowires. Sci. Rep. 2015, 5, 12336. [Google Scholar] [CrossRef]
- Arrabitoa, G.; Erricoa, V.; Zhang, Z.M.; Han, W.H.; Falconia, C. Nanotransducers on printed circuit boards by rational design of highdensity, long, thin and untapered ZnO nanowires. Nano Energy 2018, 46, 54–62. [Google Scholar] [CrossRef]
- Zhao, Y.; Frost, R.L.; Yang, J.; Martens, W.N. Size and Morphology Control of Gallium Oxide Hydroxide GaO(OH), Nano- to Micro-Sized Particles by Soft-Chemistry Route without Surfactant. J. Phys. Chem. C 2008, 112, 3568–3579. [Google Scholar] [CrossRef]
- Huang, C.-C.; Yeh, C.-S.; Ho, C.-J. Laser Ablation Synthesis of Spindle-like Gallium Oxide Hydroxide Nanoparticles with the Presence of Cationic Cetyltrimethylammonium Bromide. J. Phys. Chem. B 2004, 108, 4940–4945. [Google Scholar] [CrossRef]
- Yao, J.; Wang, C. Decolorization of Methylene Blue with TiO2 Sol via UV Irradiation Photocatalytic Degradation. Int. J. Photoenergy 2010, 2010, 643182. [Google Scholar] [CrossRef]
Figure 1.
FE-SEM images of GaOOH prepared from Ga(NO3)3 at concentrations ranging from 0.025 M to 0.075 M: (a) 0.025 M; (b) 0.05 M; (c) 0.075 M. Their corresponding enlarged micrographs are shown in (d–f), respectively.
Figure 1.
FE-SEM images of GaOOH prepared from Ga(NO3)3 at concentrations ranging from 0.025 M to 0.075 M: (a) 0.025 M; (b) 0.05 M; (c) 0.075 M. Their corresponding enlarged micrographs are shown in (d–f), respectively.
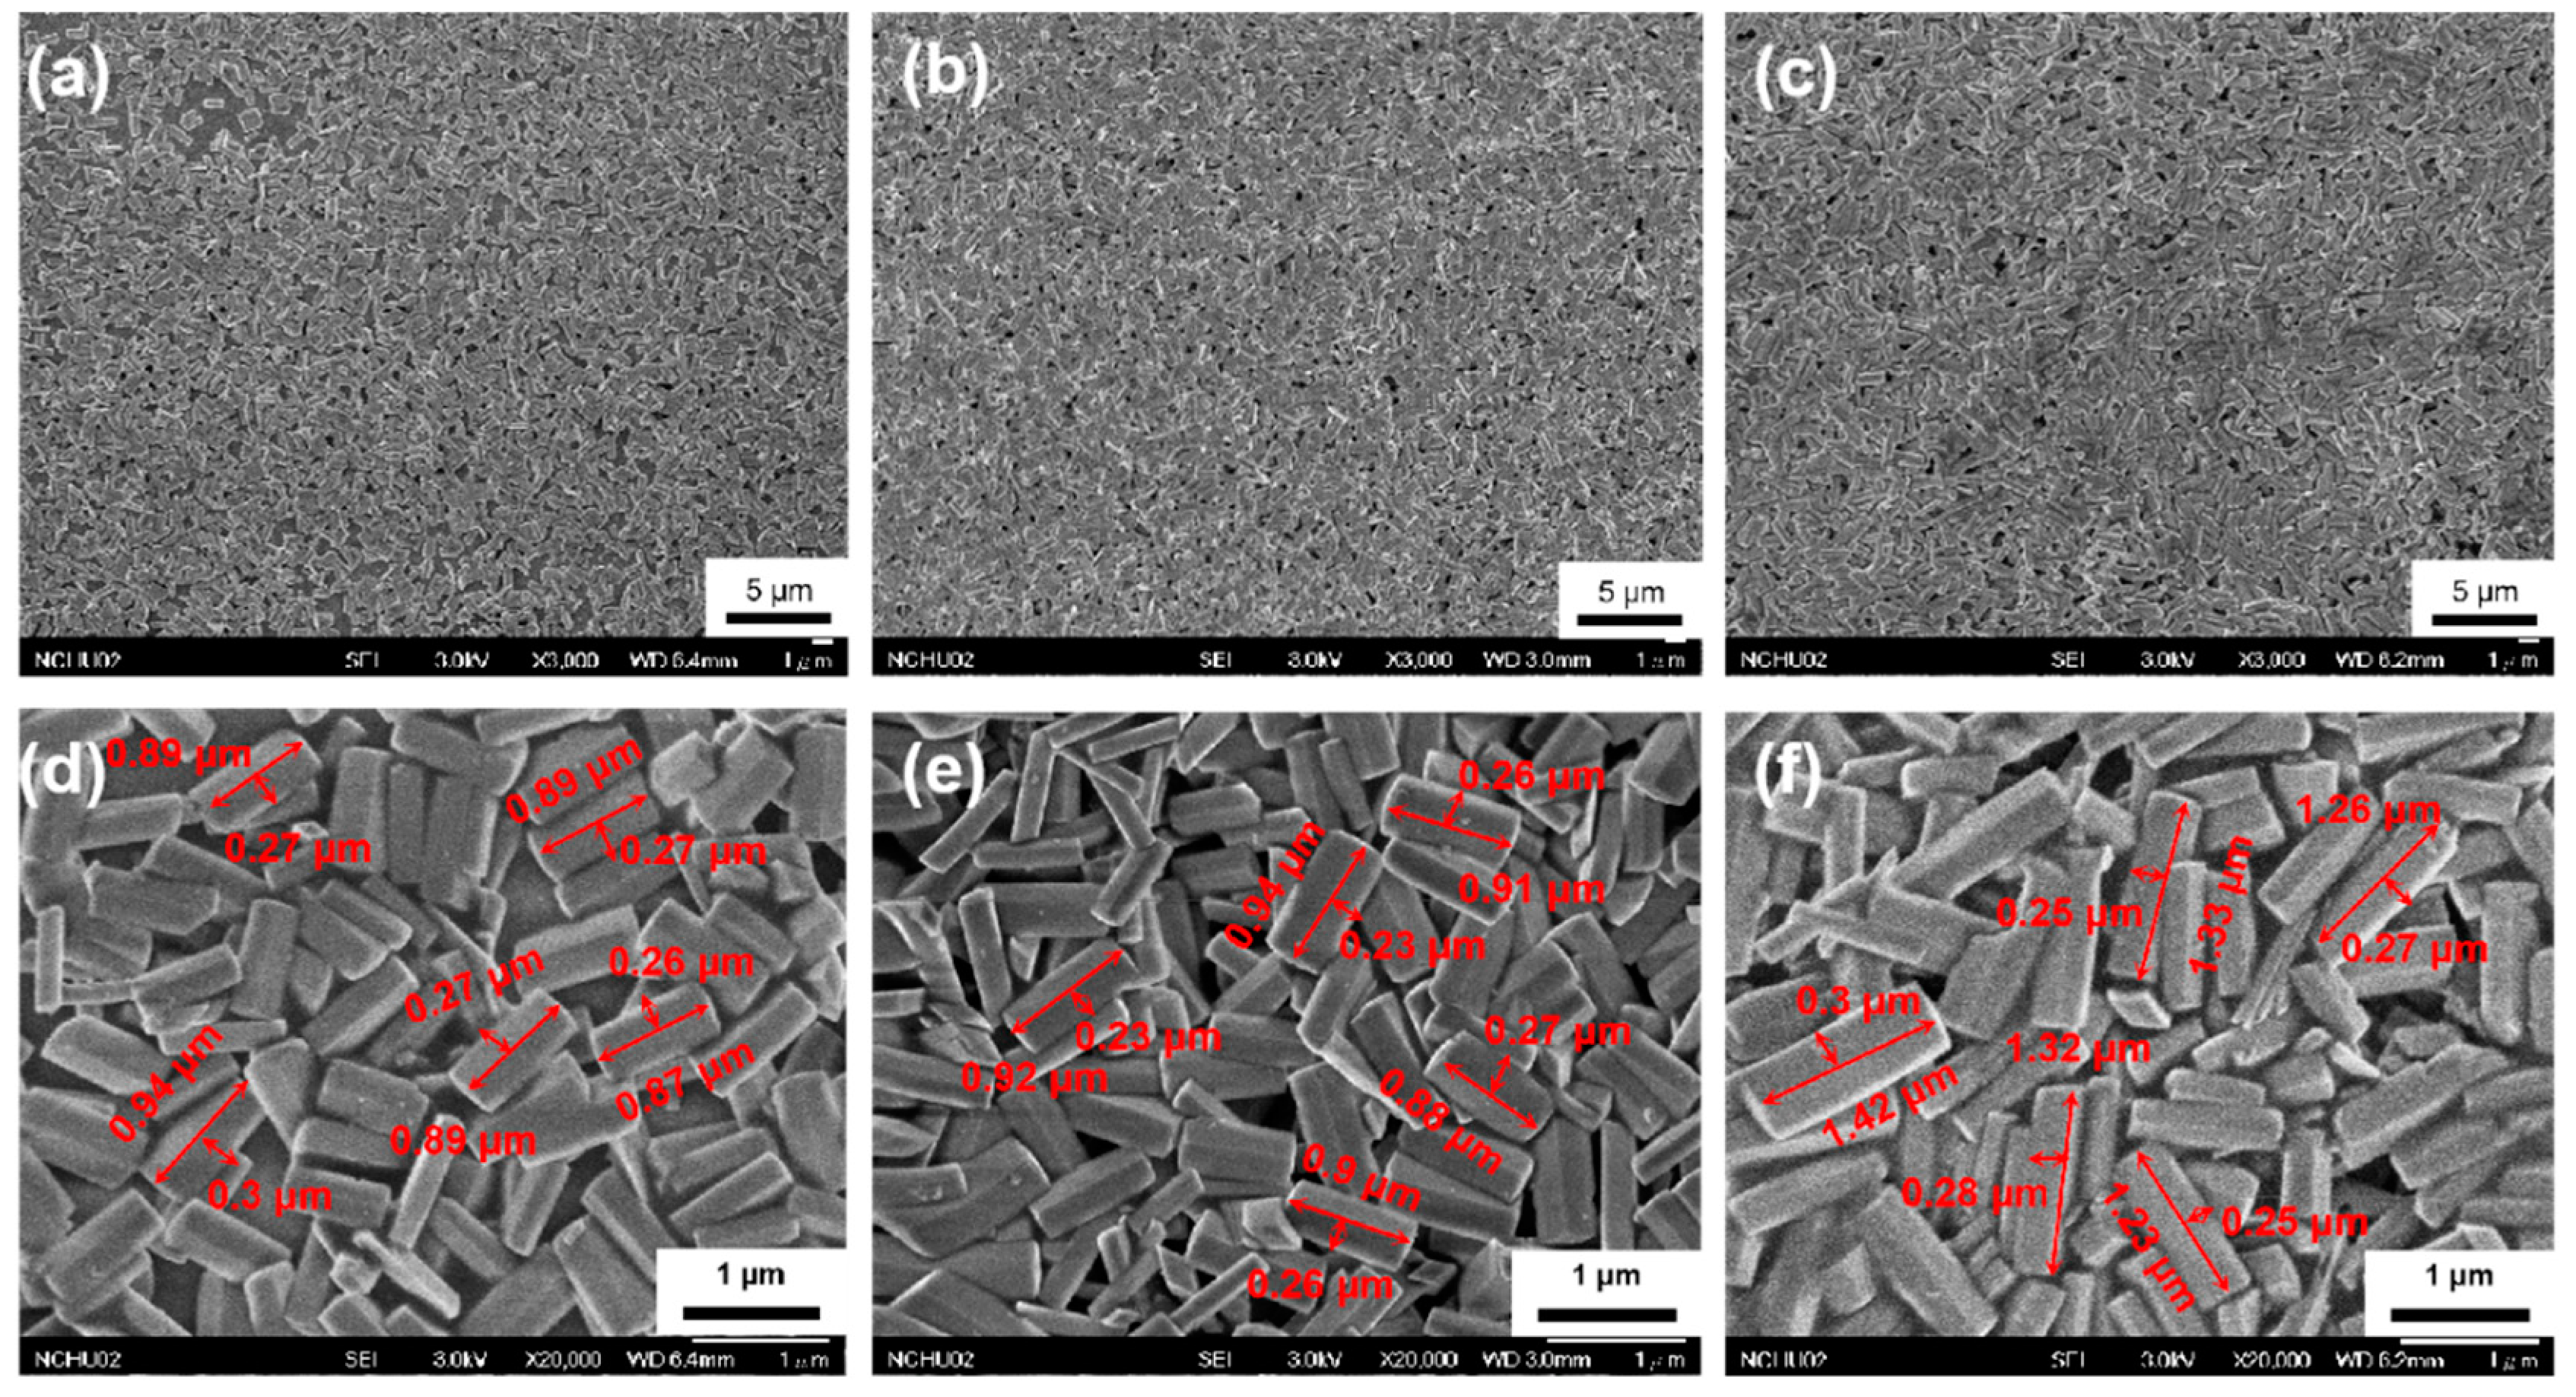
Figure 2.
(a) XRD patterns of as-prepared GaOOH nanorods obtained from Ga(NO3)3 at concentrations of 0.025 M, 0.05 M, and 0.075 M. (b) FWHMs of the GaOOH (110) crystal plane diffraction peaks shown in (a).
Figure 2.
(a) XRD patterns of as-prepared GaOOH nanorods obtained from Ga(NO3)3 at concentrations of 0.025 M, 0.05 M, and 0.075 M. (b) FWHMs of the GaOOH (110) crystal plane diffraction peaks shown in (a).
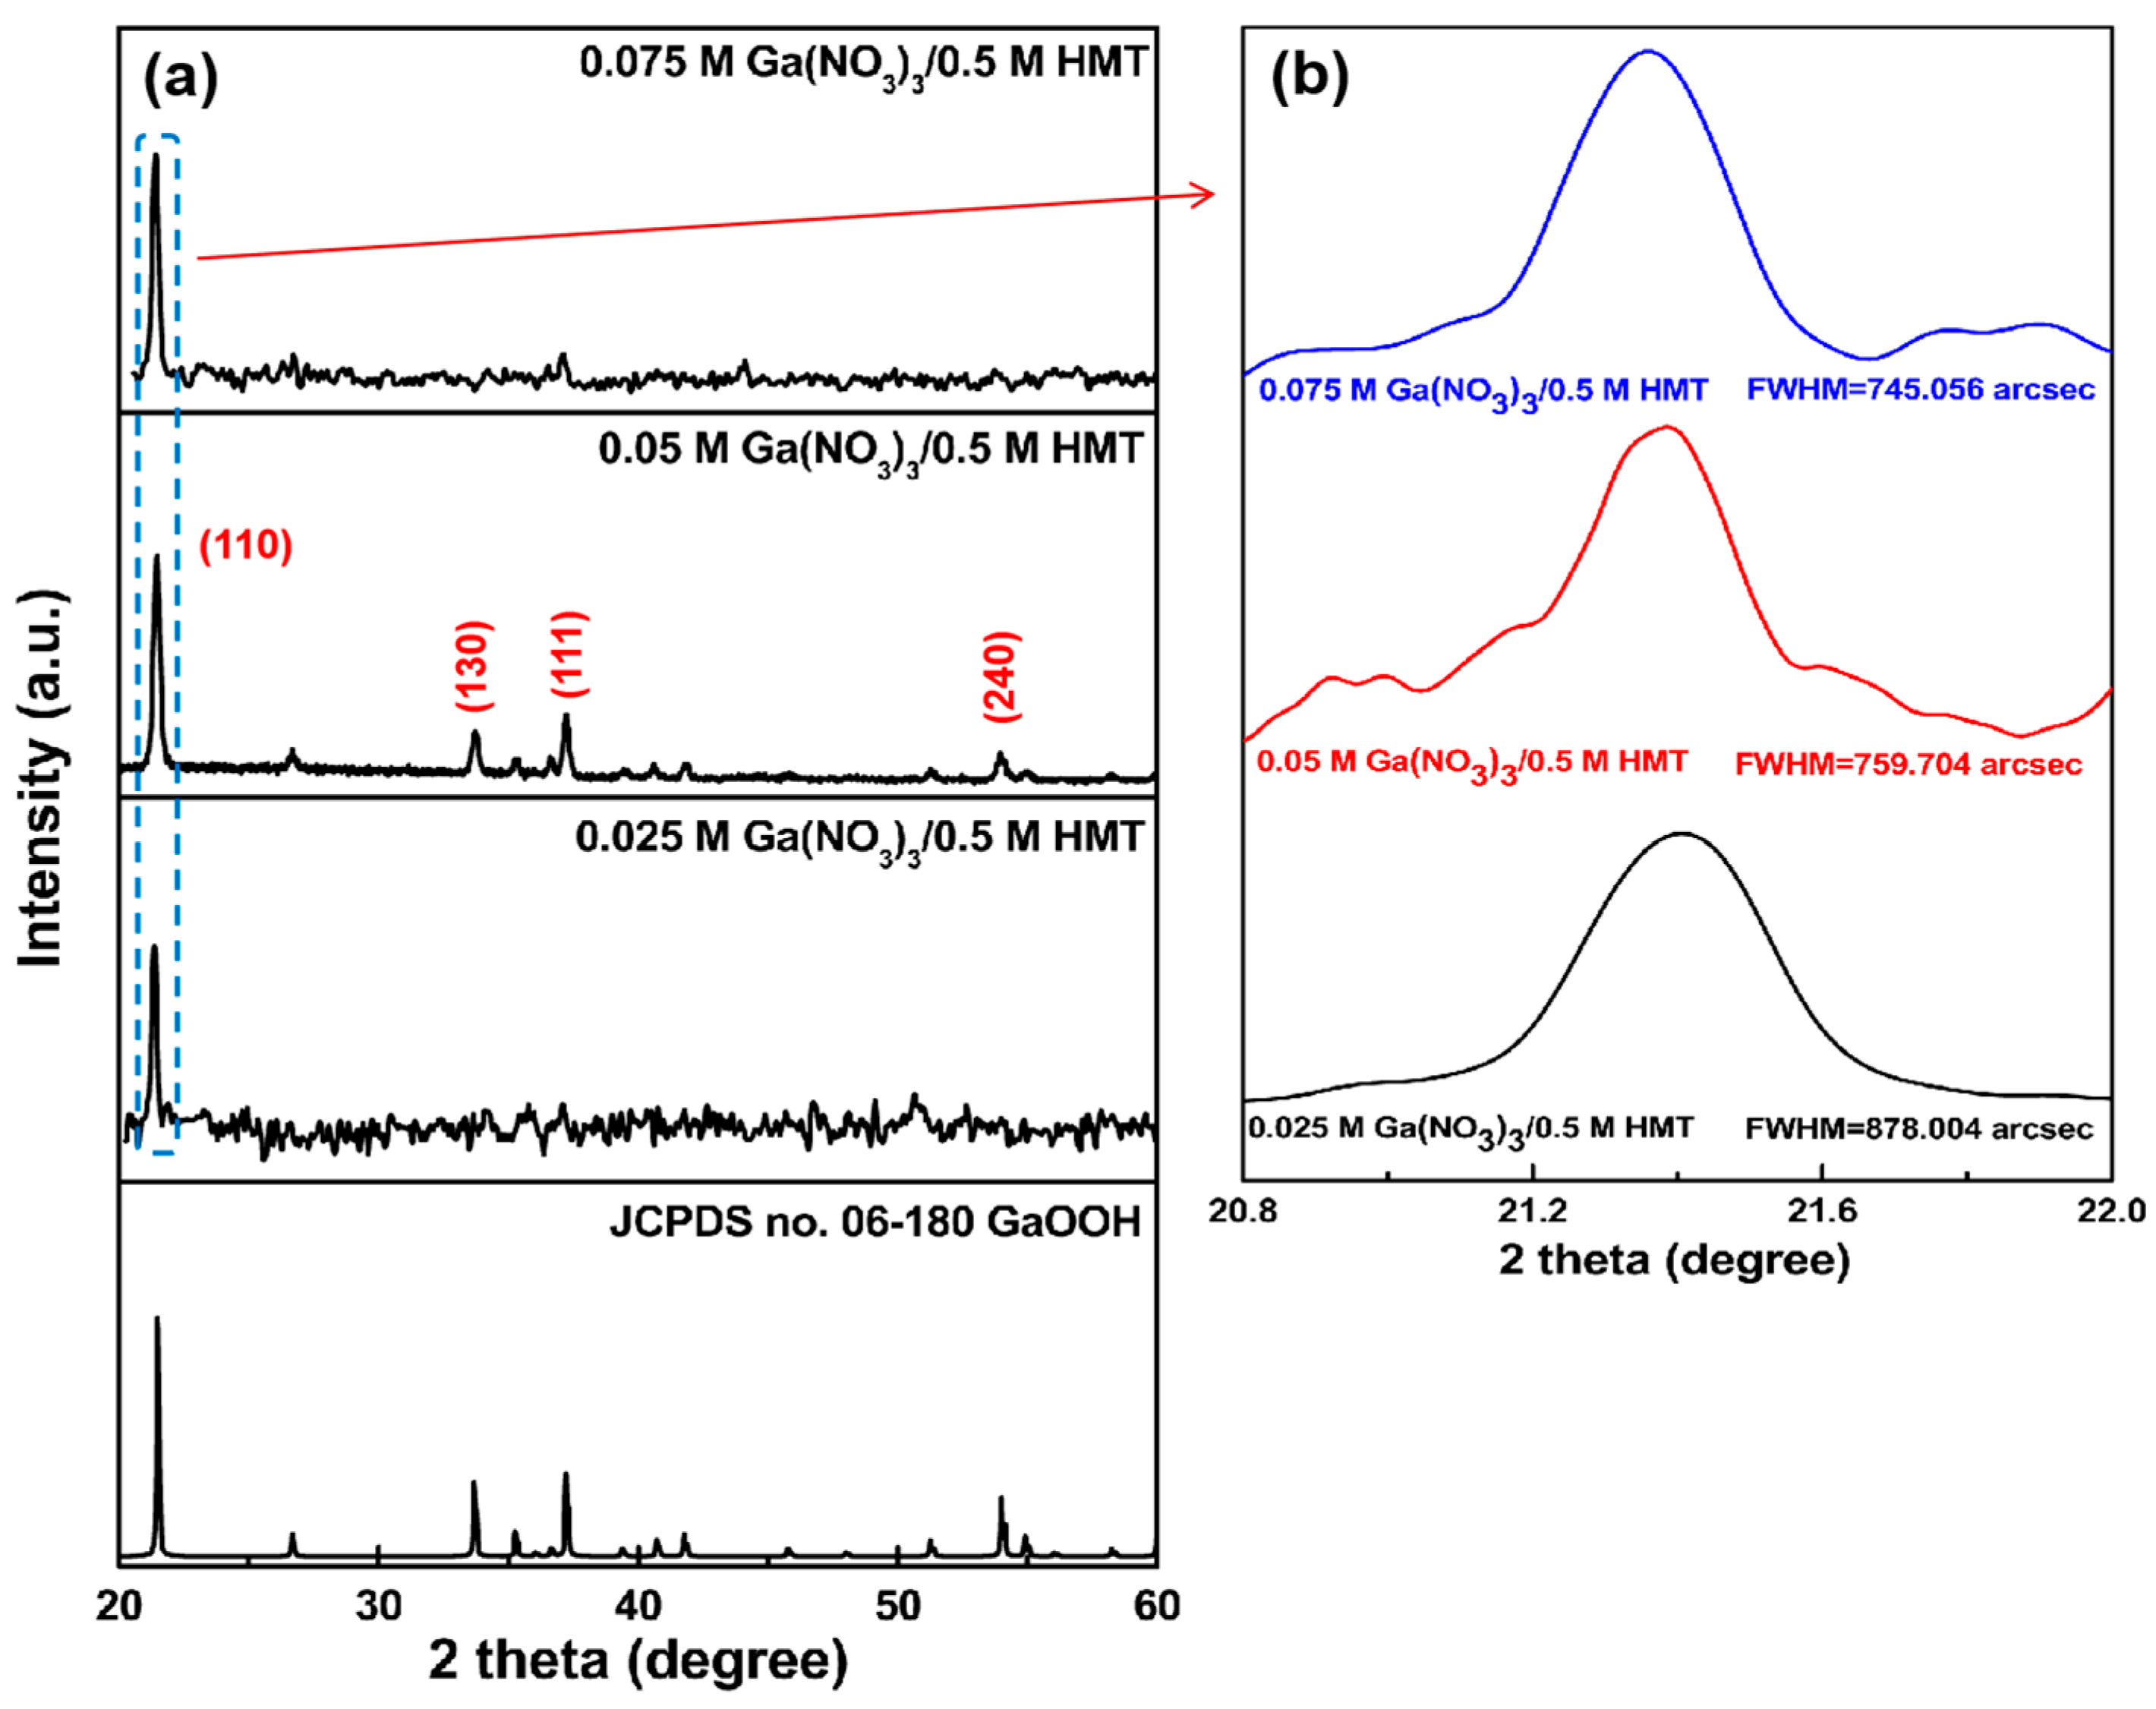
Figure 3.
FTIR spectra of GaOOH prepared from Ga(NO3)3 at various concentrations.
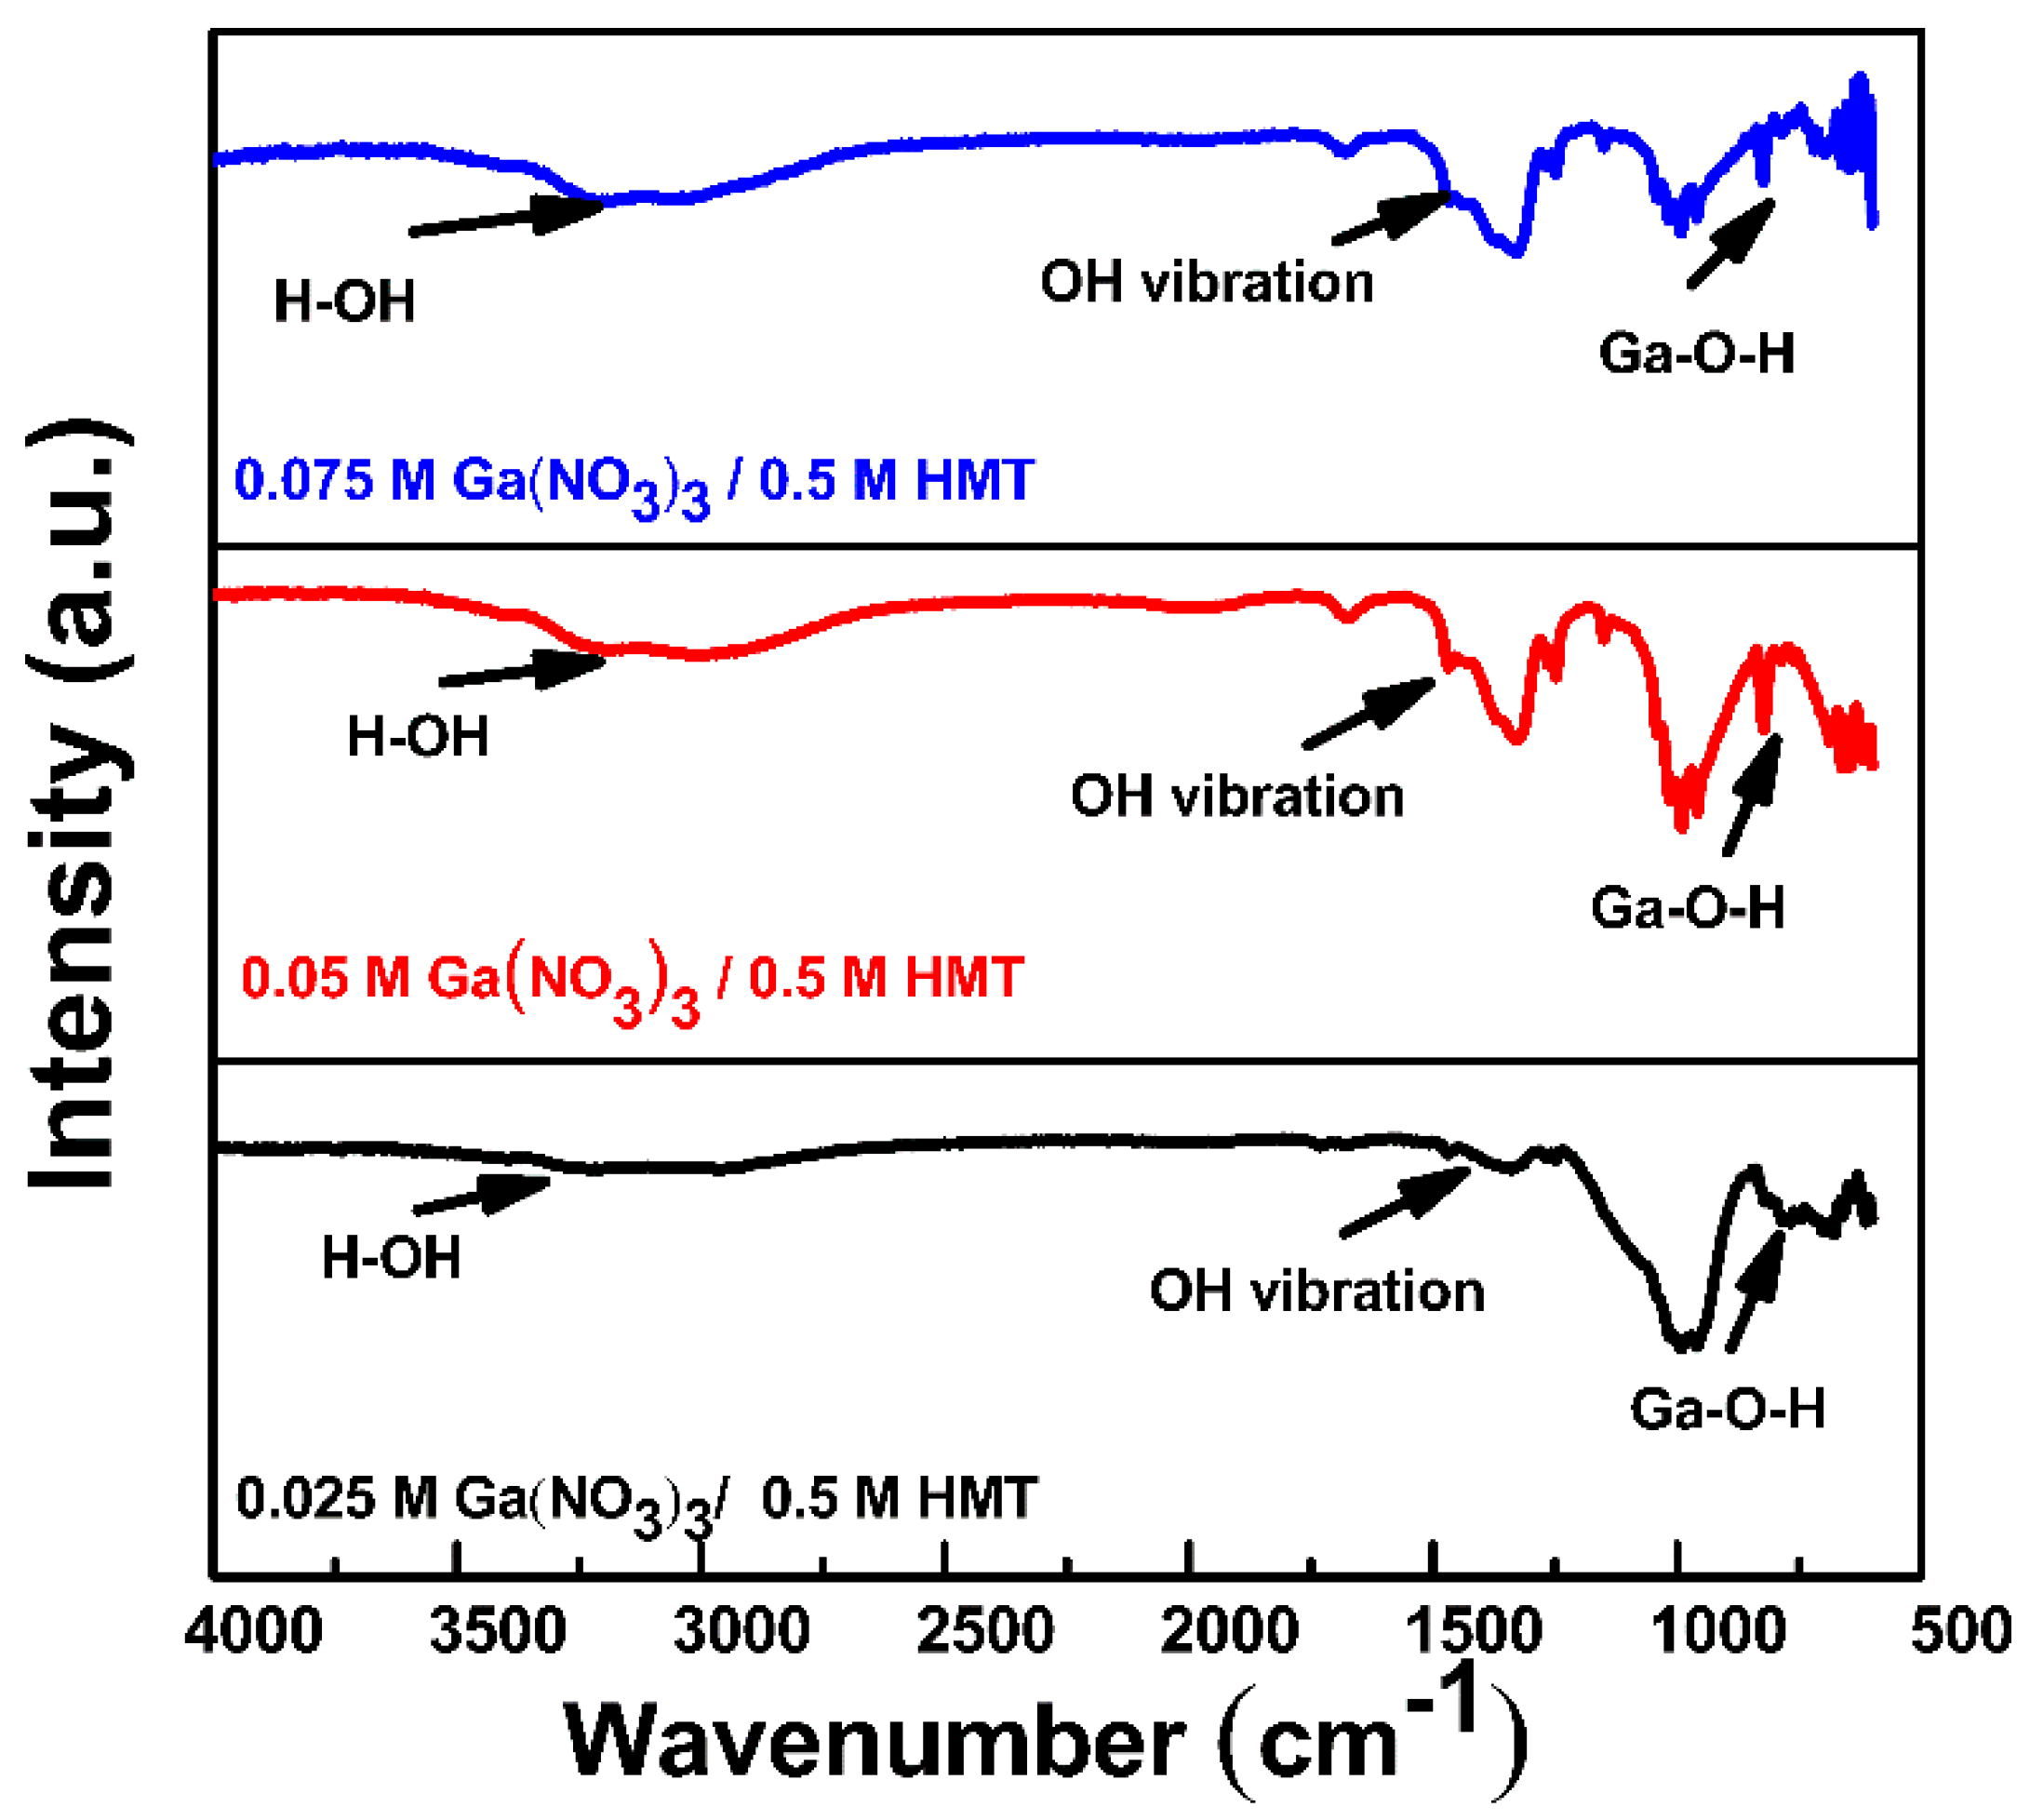
Figure 4.
XRD patterns of Ga2O3 obtained from thermal-treated GaOOH samples for 3 h at various temperatures (a) 400 °C, (b) 500 °C and (c) 600 °C.
Figure 4.
XRD patterns of Ga2O3 obtained from thermal-treated GaOOH samples for 3 h at various temperatures (a) 400 °C, (b) 500 °C and (c) 600 °C.
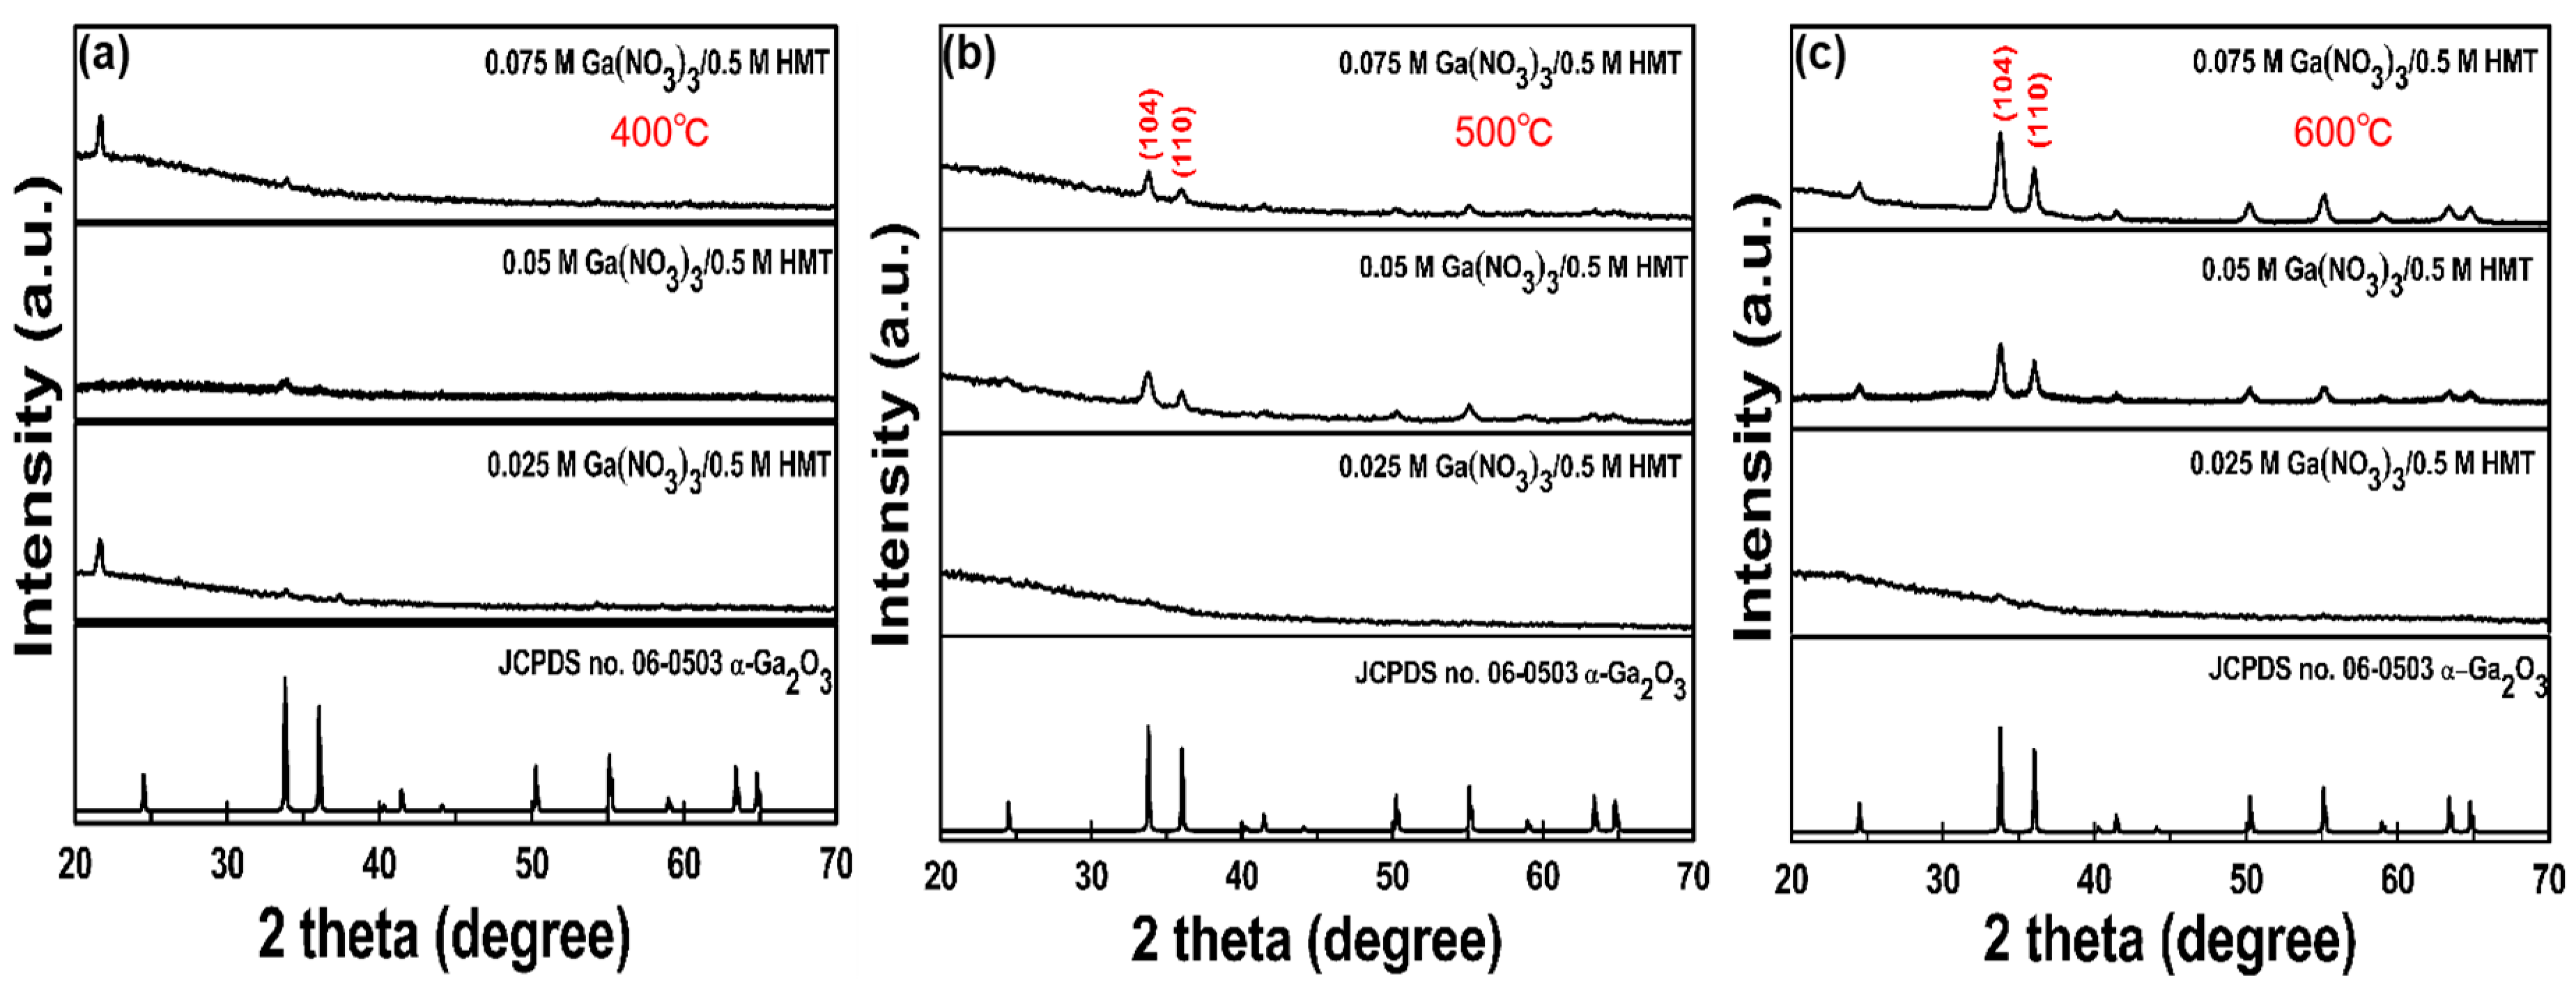
Figure 5.
FE-SEM Ga2O3 obtained after annealing GaOOH at 500 °C: (a) 0.05 M; (c) 0.075 M; and 600 °C: (b) 0.05 M; (d) 0.075 M.
Figure 5.
FE-SEM Ga2O3 obtained after annealing GaOOH at 500 °C: (a) 0.05 M; (c) 0.075 M; and 600 °C: (b) 0.05 M; (d) 0.075 M.

Figure 6.
EDS spectra of annealed samples synthesized using (a) 0.025 M Ga(NO3)3, (b) 0.05 M Ga(NO3)3 and (c) 0.075 M Ga(NO3)3. The samples were annealed for 3 h at 500 °C.
Figure 6.
EDS spectra of annealed samples synthesized using (a) 0.025 M Ga(NO3)3, (b) 0.05 M Ga(NO3)3 and (c) 0.075 M Ga(NO3)3. The samples were annealed for 3 h at 500 °C.
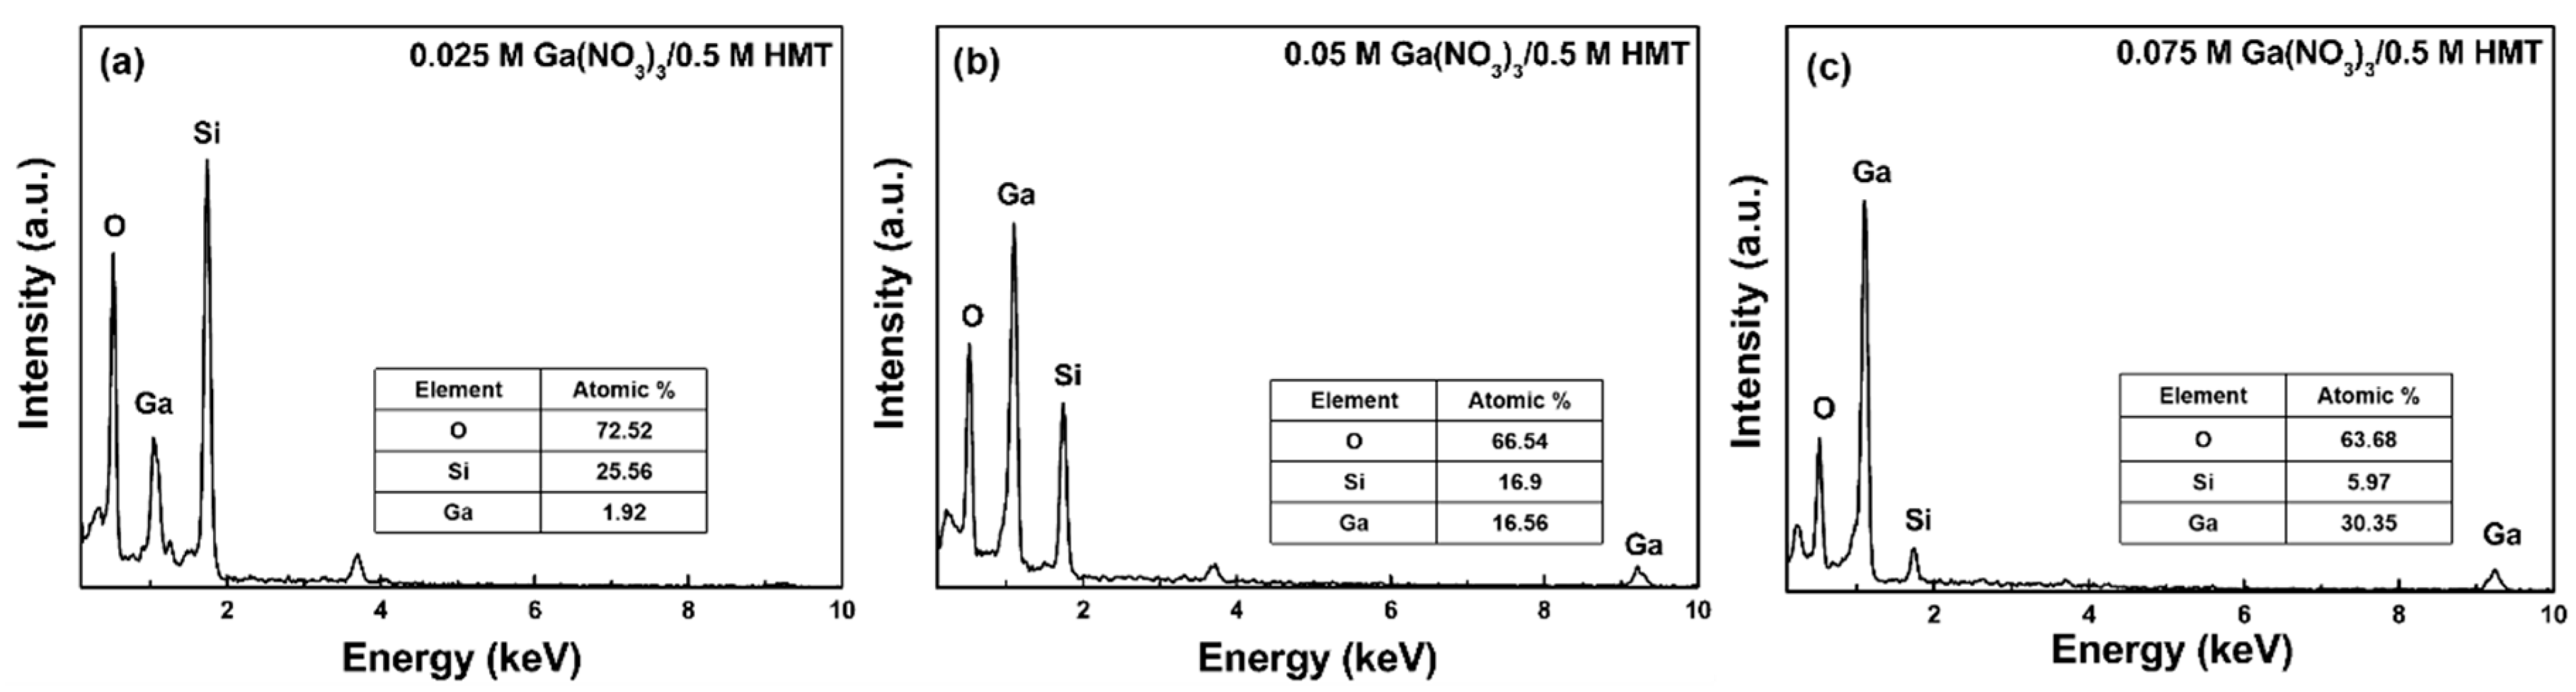
Figure 7.
Calculated constant reaction rate of MB photodegradation (C/C0) by Ga2O3 plotted as a function of UV irradiation time. The Ga2O3 samples were obtained following annealing of GaOOH prepared at Ga(NO3)3 concentrations of (a) 0.025 M, (b) 0.05 M and (c) 0.075 M.
Figure 7.
Calculated constant reaction rate of MB photodegradation (C/C0) by Ga2O3 plotted as a function of UV irradiation time. The Ga2O3 samples were obtained following annealing of GaOOH prepared at Ga(NO3)3 concentrations of (a) 0.025 M, (b) 0.05 M and (c) 0.075 M.

Table 1.
The FWHM data of (104) α-Ga2O3 diffraction peaks obtained from post-annealed GaOOH samples with 0.05 and 0.075 M Ga(NO3)3 concentrations.
Table 1.
The FWHM data of (104) α-Ga2O3 diffraction peaks obtained from post-annealed GaOOH samples with 0.05 and 0.075 M Ga(NO3)3 concentrations.
| Annealed Temperature | 0.05 M Ga(NO3)3 | 0.075 M Ga(NO3)3 |
|---|---|---|
| 500 °C | 2153.5 arcsec | 1567.4 arcsec |
| 600 °C | 1715 arcsec | 1700.6 arcsec |
© 2019 by the authors. Licensee MDPI, Basel, Switzerland. This article is an open access article distributed under the terms and conditions of the Creative Commons Attribution (CC BY) license (http://creativecommons.org/licenses/by/4.0/).
Share and Cite
MDPI and ACS Style
Yeh, C.-Y.; Zhao, Y.-M.; Li, H.; Yu, F.-P.; Zhang, S.; Wuu, D.-S. Growth and Photocatalytic Properties of Gallium Oxide Films Using Chemical Bath Deposition. Crystals 2019, 9, 564. https://doi.org/10.3390/cryst9110564
AMA Style
Yeh C-Y, Zhao Y-M, Li H, Yu F-P, Zhang S, Wuu D-S. Growth and Photocatalytic Properties of Gallium Oxide Films Using Chemical Bath Deposition. Crystals. 2019; 9(11):564. https://doi.org/10.3390/cryst9110564
Chicago/Turabian StyleYeh, Che-Yuan, Yi-Man Zhao, Hui Li, Fei-Peng Yu, Sam Zhang, and Dong-Sing Wuu. 2019. "Growth and Photocatalytic Properties of Gallium Oxide Films Using Chemical Bath Deposition" Crystals 9, no. 11: 564. https://doi.org/10.3390/cryst9110564
Note that from the first issue of 2016, this journal uses article numbers instead of page numbers. See further details here.