Graphene Adhesion Mechanics on Iron Substrates: Insight from Molecular Dynamic Simulations


1
School of Materials Science and Engineering & Key Laboratory for Anisotropy and Texture of Materials, Ministry of Education, Northeastern University, Shenyang 110819, China
2
Nuclear Engineering and Radiological Sciences, University of Michigan, Ann Arbor, MI 48109, USA
*
Authors to whom correspondence should be addressed.
Crystals 2019, 9(11), 579; https://doi.org/10.3390/cryst9110579
Submission received: 2 September 2019
/
Revised: 21 October 2019
/
Accepted: 3 November 2019
/
Published: 6 November 2019
(This article belongs to the Special Issue Graphene Mechanics)
Abstract
:The adhesion feature of graphene on metal substrates is important in graphene synthesis, transfer and applications, as well as for graphene-reinforced metal matrix composites. We investigate the adhesion energy of graphene nanosheets (GNs) on iron substrate using molecular dynamic (MD) simulations. Two Fe–C potentials are examined as Lennard–Jones (LJ) pair potential and embedded-atom method (EAM) potential. For LJ potential, the adhesion energies of monolayer GN are 0.47, 0.62, 0.70 and 0.74 J/m2 on the iron {110}, {111}, {112} and {100} surfaces, respectively, compared to the values of 26.83, 24.87, 25.13 and 25.01 J/m2 from EAM potential. When the number of GN layers increases from one to three, the adhesion energy from EAM potential increases. Such a trend is not captured by LJ potential. The iron {110} surface is the most adhesive surface for monolayer, bilayer and trilayer GNs from EAM potential. The results suggest that the LJ potential describes a weak bond of Fe–C, opposed to a hybrid chemical and strong bond from EAM potential. The average vertical distances between monolayer GN and four iron surfaces are 2.0–2.2 Å from LJ potential and 1.3–1.4 Å from EAM potential. These separations are nearly unchanged with an increasing number of layers. The ABA-stacked GN is likely to form on lower-index {110} and {100} surfaces, while the ABC-stacked GN is preferred on higher-index {111} surface. Our insights of the graphene adhesion mechanics might be beneficial in graphene growing, surface engineering and enhancement of iron using graphene sheets.
1. Introduction
Graphene, a single layer of graphite, possesses an intrinsic strength of 130 GPa [1,2], Young’s modulus of 1.0 Tpa [3] and many other extraordinary physical and chemical properties [4,5,6], as well as a wide range of applications [7]. To synthesis high-quality graphene on a large scale, growing graphene on metals such as Cu [8,9], Ni [10], Fe [11] and others [12] is a common approach. Graphene can also be a good candidate for the reinforcement of a metal matrix to enhance its mechanical behavior [13]. In both applications, graphene/metal contact is inevitable. However, since graphene is a 2D material with ultra-high specific surface area (~2600 m2/g) [14], it has a tendency to be crumpled intrinsically [15,16], which can greatly change the inherent properties of graphene. Hence, interfacial properties between graphene and metal substrate are important in graphene synthesis [17] and the design of graphene-reinforced metal matrix composites [18].
Many attempts have been made to explore the interfacial characteristics of graphene and metals, such as quantification of adhesion energy of graphene to metallic substrate. Among differently scaled simulation methods [17,19,20,21], first principle (FP) and molecular dynamic (MD) methods are commonly used to calculate adhesive energy, for example graphene on Ni, Cu and other seven metallic substrates by FP [17], on Fe by FP [22] and on Ti by MD [23]. There are also a few experimental works which directly measured the adhesion energy of graphene to metallic substrates, such as Cu and Ni [24,25]. However, the measured adhesion energy of graphene on Cu substrate had a large discrepancy, with results of 0.72 J/m2 [24] and 12.75 J/m2 [25]. The adhesion energy from FP calculation was about 0.40 J/m2 [26]. Although FP calculations can provide some material properties at an atomic scale, they limit the size of the studied system to only a few hundred atoms, where system size may play a significant role on adhesion energy of graphene and metals [27], resembling J-integral at crack propagation. This limitation could be overcome by employing the MD method, but the MD results strongly depend on the accuracy of interatomic potential. Moreover, the adhesion of graphene on Cu substrate is commonly known as a weak physisorption [17], while that on Ni substrate is believed as a strong chemisorption, which was also measured differently with the experimental values of 6.76 J/m2 [28] and 72.7 J/m2 [25], compared with 1.64 J/m2 from FP [26]. Therefore, the adhesion energy of graphene on metal substrate needs to be further clarified.
The interface features between graphene and iron have attracted great attention since iron is the most widespread transition metal, and it could yield a considerable price reduction in comparison with using other transition metal substrates. You et al. studied graphene growth on iron substrate by chemical vapor deposition (CVD) and found that cooling rate and atomic structure played an important role on the graphene growth [11]. In [22], the growth of graphene on epitaxial iron films was realized by CVD at relatively low temperatures and the resulting graphene monolayer created a novel periodically corrugated pattern on Fe {110} substrate. Graphene is believed to be strongly chemisorbed on iron due to a rich interaction between Fe and C, which is beneficial for interfacial strength [22,29] and also affects load transfer on graphene-reinforced metal matrix composites. In our previous work [30], we studied the mechanical properties of graphene nanosheet (GN)-reinforced iron matrix composite by MD simulation and the results showed that when the GN was parallel to the {110} plane of iron matrix, the shear modulus and yield stress of the composite increased by 107% and 1400%, respectively, compared to unreinforced Fe. However, a systematic study about adhesion energy of graphene on iron substrate is still lacking.
In this work, we systematically study the adhesion energy of monolayer graphene nanosheet (GN) on the {110}, {111}, {112} and {100} surfaces of a single crystalline iron using MD simulations and the corresponding morphologies of GN are further analyzed. The adhesion energies for bilayer and trilayer GNs with different stacking styles on iron surfaces are compared since the GN composed of a few graphene layers possesses similar properties to those of monolayer graphene but is much easier to produce [31]. In addition, the bilayer or trilayer graphene are also of interest due to their tunable band gaps, which are crucial in transistor applications [17].
2. Molecular Dynamic Setup and Interatomic Potentials
2.1. Molecular Dynamic Setup
Molecular dynamic (MD) is a well-established and powerful tool to investigate various properties with large-scale atomic insights [32]. In this study, the classical MD simulation was performed by Large-scale Atomic/Molecular Massively Parallel Simulator (LAMMPS) code [33].
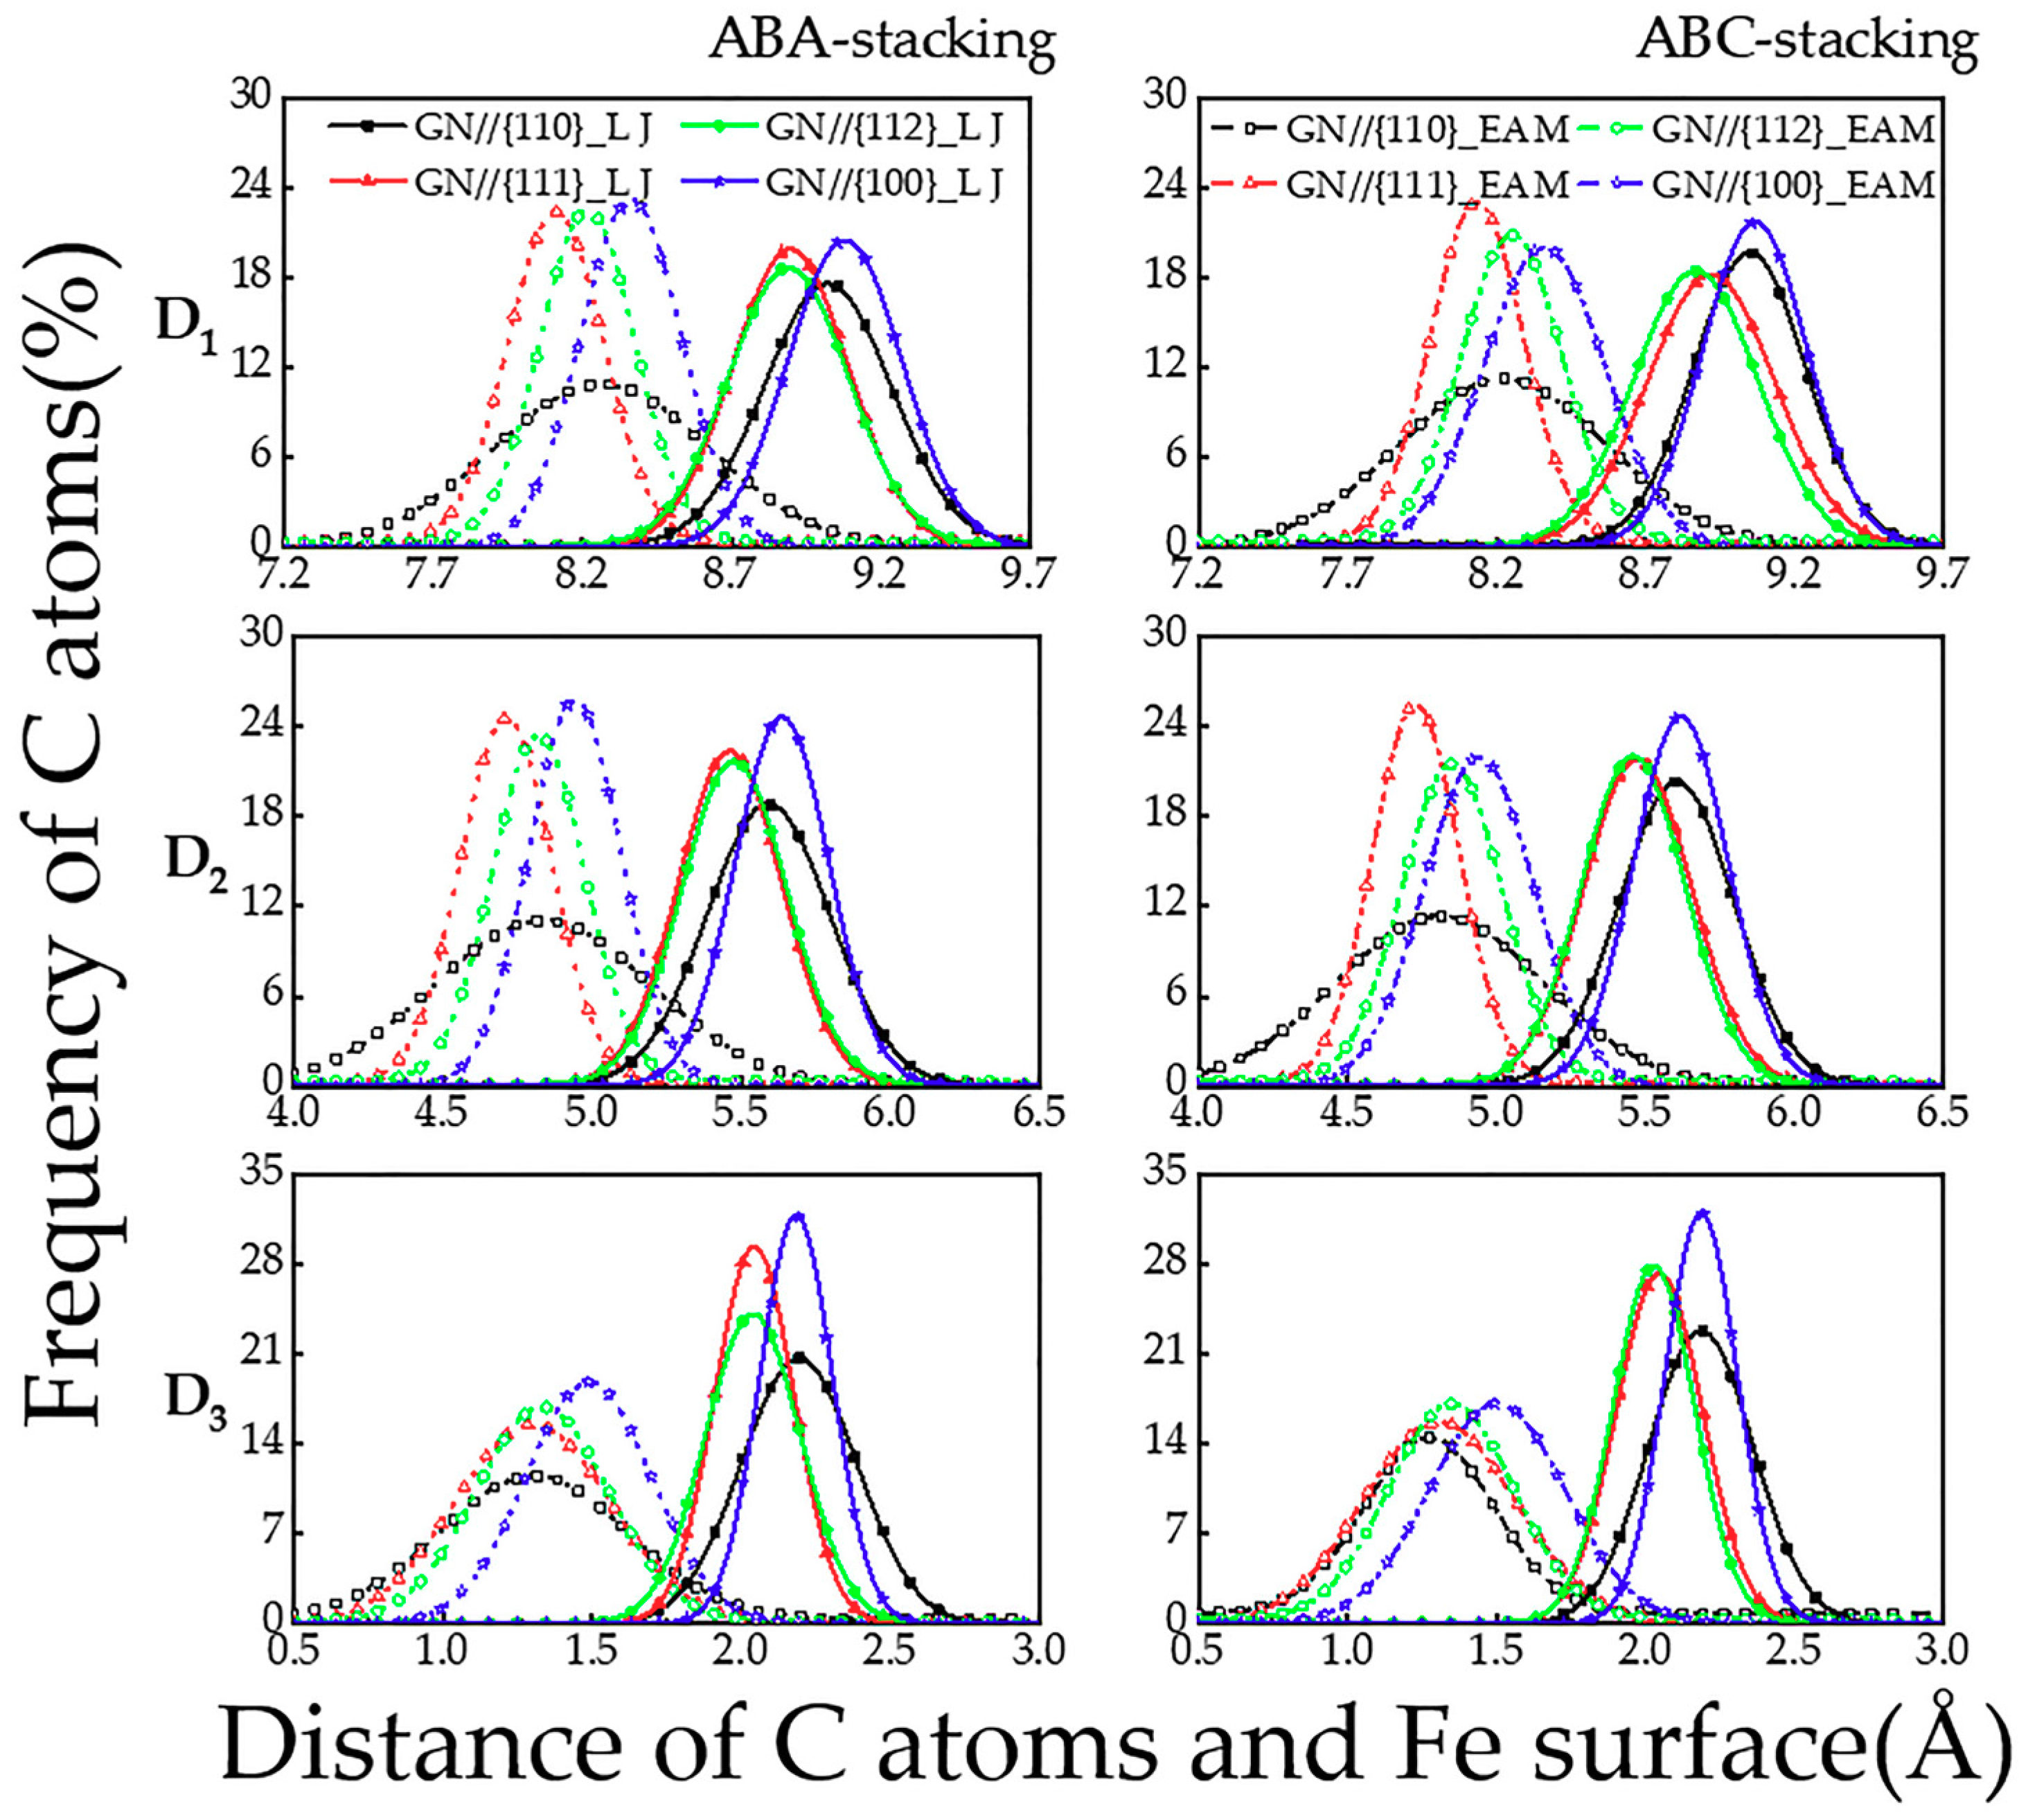
The schematic of the MD setting for a graphene nanosheet on iron substrate is shown in Figure 1. The simulation cell was about 100 × 100 × 100 Å3, which included a cubic single crystalline iron substrate and a square graphene nanosheet (GN) above. The substrate contained about 90,000 Fe atoms and the GN contained about 4000 C atoms in each layer. The lattice constant of BCC α–Fe matrix was 2.86 Å and the C–C bond length was 1.42 Å in the GN. The lateral x and y directions were set to periodic boundary conditions and the z direction was fixed boundary. The armchair and zigzag directions of the GN were parallel to x and y axes, respectively.
Three types of the GNs were used in this simulation, which contained a monolayer, bilayer and trilayer graphene. We also considered stacking sequence of multilayer graphene, where the two typical stackings of AB or AA for bilayer GN and ABA or ABC for trilayer were used, as shown in Figure 1b. The GN was initially placed 1.0 Å above the iron substrate with the {110}, {111}, {112} and {100} iron surfaces. To achieve {110} surface, the atoms along x, y, and z faces were ordered in [11], [111] and [10] respectively. For the {111}, {112} and {100} surfaces, the axis settings were x [10], y [11], z [111]; x [111], y [10], z [11]; and x [100], y [010], z [001], respectively. After energy minimization, the GN reached its stable structure and the adhesion energy of GN and the iron substrate was obtained.
The energy minimization was performed as follows: firstly, we applied 300 K temperature using Nose–Hoover algorithm [34] and set zero pressure in x, y and z directions under NPT ensemble to reduce internal stress and run the system to reach the thermostable state. Then, a quenching process was applied to minimize the total potential energy of the whole system. Afterward, the adhesion energy E, defined as the energy per unit area to connect graphene nanosheet with iron substrate, was calculated by [17,23,35]:
where EGN, EFe and EGN/Fe are the relaxed energies for graphene nanosheet, the clean iron substrate and the combined system, respectively and AGN is the interfacial area of graphene nanosheet.
2.2. Interatomic Potentials for Graphene and Iron System
When using classical MD to calculate adhesive energy of graphene to a metallic substrate, we need to employ empirical interatomic potential to mimic the interaction between C and metal. Therefore, the simulated results strongly depend on the accuracy of the potential. The C–metal interaction is commonly described by Lennard–Jones potential. The adhesion energies of graphene on Cu, Fe and Ni substrates from experiments and simulations are summarized in Table 1. There is a large discrepancy between them.
There are several types of Fe–C interatomic potentials, such as Lennard–Jones (LJ) pair potential [35], embedded-atom method (EAM) potential [40], modified EAM potential [38] and reactive force field (ReaxFF) potential [39]. Using MD with different types of Fe–C potentials, the adhesive energy of graphene on Fe {110} substrate was compared [35]. Then the LJ potential with two determined parameters of σC-Fe = 2.221 Å, εC-Fe = 0.043 eV and the cutoff radius of Rcut = 3σC-Fe was used to study the tribological features of graphene-coated Fe {110} surface. The LJ potential is commonly used to describe the weak interaction between the C and metallic atoms (e.g., van der Waals interaction). The reason to choose the LJ potential in [35] was that graphene on Fe {110} surface was believed to be stable at temperatures below 630 °C and few iron carbides could be formed [41]. The main failing of the LJ potential may be from the poor performance of various covalent bonding due to its simplicity and spherical symmetry of bonding [42]. There are some experimental works which indicated that graphene is chemisorbed on iron substrate. At present, the EAM potential of Fe–C has already been developed to describe chemical interactions of iron carbides [29,43,44,45,46,47], such as ferritic FeC solid solution or cementite (Fe3C) [11,40]. In our work, both LJ [35] and EAM potentials [40] are used to describe the Fe–C interaction and the main purpose is to reveal the effect of the Fe–C bonding features on adhesion energy and graphene structure on different iron surfaces.
The Fe–Fe interactions in iron substrate were described by an EAM potential [48]. The C–C interactions in graphene used the Brenner second–generation reactive empirical bond-order potential [49,50]. The cohesive energies of Fe–Fe, C–C and Fe–C interactions in our model are 4.29, 7.40 and 6.01 eV/atom, respectively, corresponding to the bonding lengths of 2.5, 1.4 and 1.8 Å [40,48,49].
3. Results and Discussion
3.1. Adhesion Features of Monolayer Graphene Nanosheet and Iron Surfaces
Firstly, the adhesion energies of monolayer graphene nanosheet (GN) on {110}, {111}, {112} and {100} surfaces of the iron substrates were calculated by MD simulations with the LJ and EAM potentials to describe Fe–C interaction. The data are presented in Table 2.
The results show that using the LJ potential, the predicted adhesion energies (Es) of the monolayer GN and Fe substrate are 0.47 J/m2 (or 0.076 eV/C atom), 0.62, 0.70 and 0.74 J/m2 on the {110}, {111}, {112} and {100} surfaces, respectively, with the average vertical distance (1) between the GN layer and iron surfaces of 2.0–2.2 Å. For comparison, a calculated E for graphene on Fe {110} surface was about 0.89 J/m2 from a FP simulation [29]. On the other hand, when using EAM potential, the Es are 26.83 J/m2 (or 4.36 eV/C atom), 24.87, 25.13 and 25.01 J/m2 on the {110}, {111}, {112} and {100} surfaces, respectively, with the corresponding 1 of 1.3–1.4 Å. The E order matches the surface stability of BCC α-iron where surface energies are 2.37, 2.57, 2.58 and 2.68 J/m2 on {110}, {100}, {112} and {111} surfaces, respectively [51]. In comparison, the MD-calculated Es between graphene monolayer and Fe {110} surface were 0.94, 40.09 and 15.04 J/m2 using LJ, MEAM and ReaxFF potentials of Fe–C, respectively [35]. Since this LJ potential of Fe–C [35] is used in our work, the E of the GN on Fe {110} is also calculated using the same MD setup in reference and is 0.72 J/m2, close to the reference value of 0.94 J/m2, where the difference might be from different potentials of Fe–Fe interaction.
In Table 2, the 1s on different surfaces from LJ are almost the same within the range of 2.0–2.2 Å, while those from EAM are in the range of 1.3–1.4 Å. In both cases, the 1 on the {111} surface is shorter than others. It may be caused by different Fe-Fe layer spacing under the surfaces, which are 2.02, 0.82, 1.17 and 1.43 Å under the {110}, {111}, {112} and {100} surfaces of BCC α-iron, respectively. In comparison, the 1s between the GN and the Fe {110} surface calculated from MD using LJ, MEAM and ReaxFF potentials were 2.2, 1.3 and 4.6 Å, respectively [35] and a reference value from DFT calculation was about 2.1 Å [29].
Comparing with the MD results from different potentials, the adhesion energy of GN and the iron surface from EAM potential is two orders of magnitude higher than that from LJ, and the GN on the {110} surface has the highest adhesion strength from EAM. Since the EAM potential includes several covalent types of Fe–C bonding [40,42] and should be better to capture more realistic chemisorption features [11,22,41], it implies that the predicted adhesion energy from LJ potential describes a weak interaction of Fe–C, while the adhesion from EAM can perform a hybrid and strong interaction occurring in GN/Fe interface.
In addition, we also considered the effect of initial distance between the GN and the iron surface on MD results using EAM potential. If we set the initial distance of 2.5 Å above the substrate in the MD model, the adhesion energies at local energy minimum state were about 23.25, 22.70, 23.83 and 22.20 J/m2, respectively, on the {110}, {111}, {112} and {100} surfaces, corresponding to the 1s of 2.2, 1.8, 1.7 and 2.1 Å.
The distributions of the length (Lb) of Fe–C bonding on the monolayer GN and Fe {110}, {111}, {112} and {100} surfaces are provided in Figure 2. It shows that the distribution of the Lb from EAM potential is discontinuous within the two ranges of 1.8–2.0 Å and 2.3–2.5 Å, while it becomes only one continuous range of 2.2–2.8 Å from LJ potential. Furthermore, the maximum frequency of the Lb from EAM is greater and the corresponding length is shorter than those from LJ one. The difference of the Lb from EAM and LJ potentials indicates that the bonding type from EAM is more complex than that from LJ. Moreover, different bonding will further affect surface morphology of GN on the iron surfaces.
The suspended pristine graphene sheet without metallic substrate is intrinsically rippled [15,52] and the graphene layer can form a unique structure called a moiré pattern when it is on different metallic surfaces. Surface morphologies of monolayer GN located on four iron surfaces have different moiré patterns, as shown in Figure 3. It is found that the corrugation from LJ potential varies smoothly over several moiré unit cells. Due to the weak interaction provided by LJ, the GN leads to a partial disordered moiré pattern and a rather random distribution of ripples has been probed, which is different from previous experimental results [22]. This implies that the LJ potential may provide improper binding sites for GN adherence. On the contrary, a sharp and ordered periodic moiré pattern with high corrugation is found from MD simulation using EAM potential, where the corrugation starts a precipitous decline in the boundaries of moiré unit cells, in good agreement with the experimental results [22].
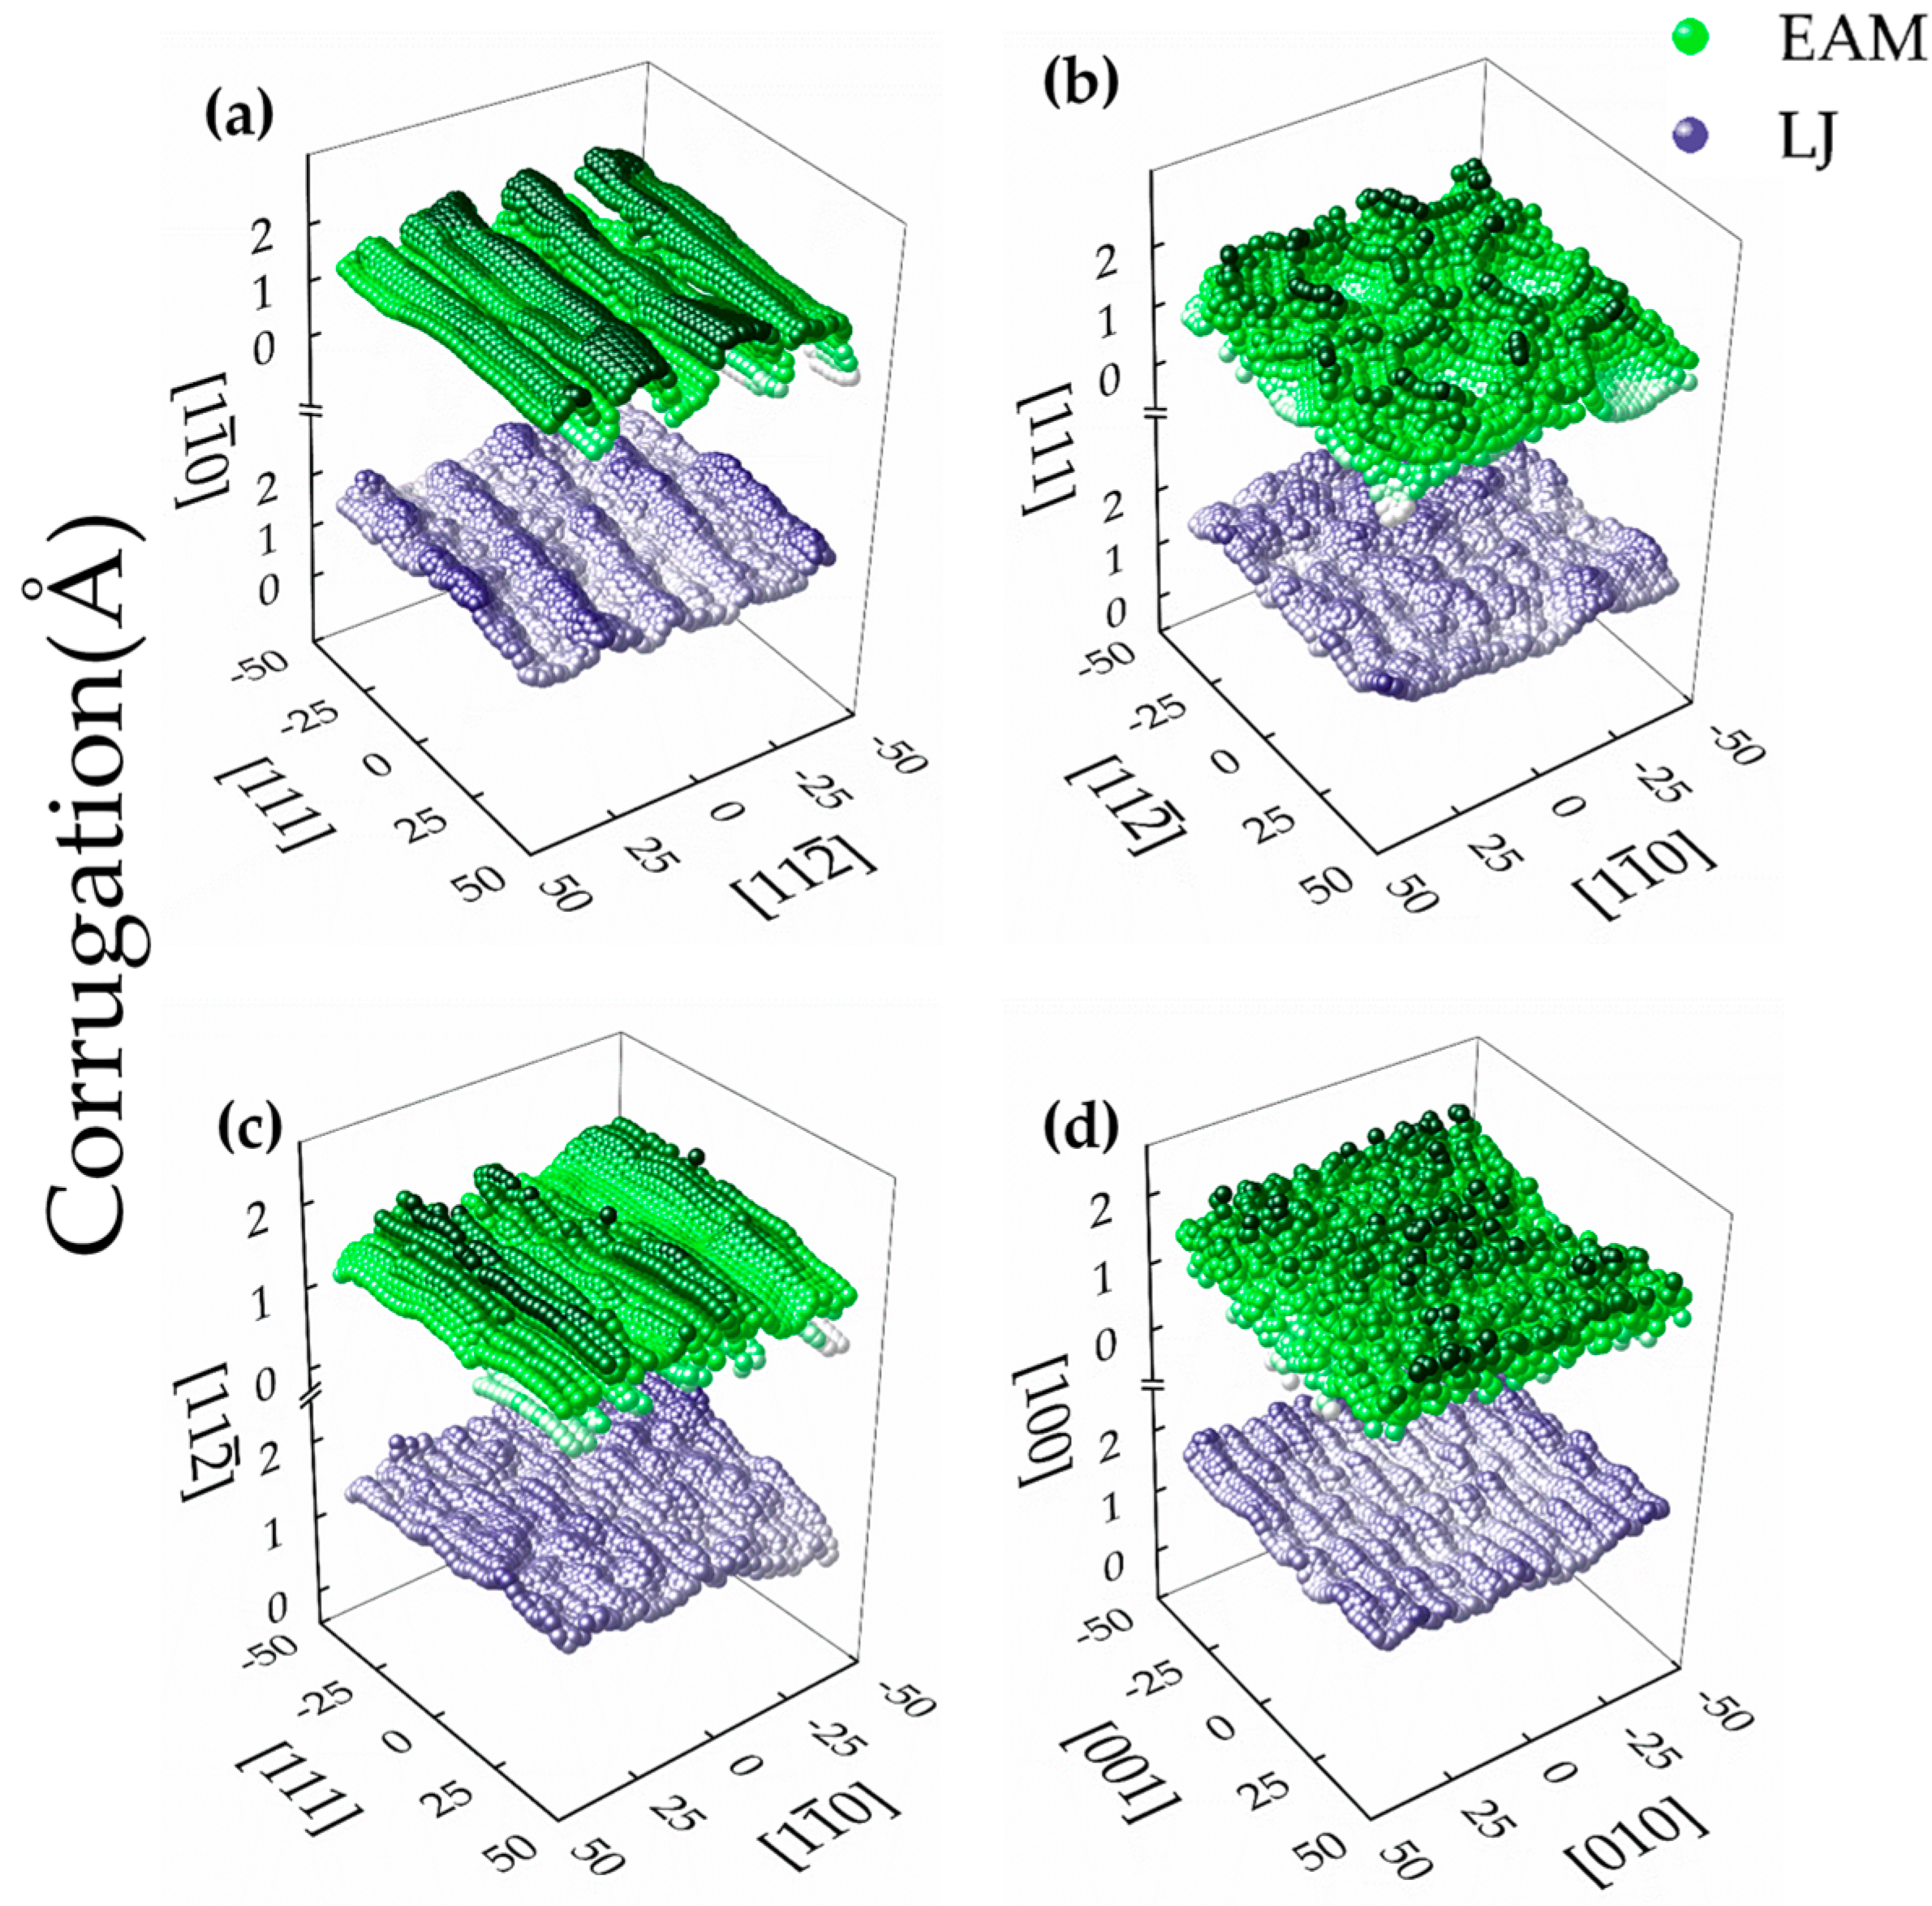
The GN morphologies on differently oriented substrates are quite different. In detail, the moiré pattern on the Fe {110} has long equidistant stripes with a periodicity of 4 nm, as shown in Figure 3a. Along the <112> direction, the distance between Fe–Fe atoms is 1.166 Å and every nine graphene rings can match 18 rows of the iron atoms, while seven graphene rings can match six rows of the iron atoms along the <100> direction. On Fe {111} surface, a typical morphology of the moiré structure is presented in Figure 3b, where the typical geometrical corrugation is dictated by the lattice mismatch and connected with a buckling of the graphene layer indicating local variations of the binding to iron. When GN is on the {112} surface, the moiré pattern is less evident, and the identification and characterization of the minimal coincidence supercell is difficult, as shown in Figure 3c. For GN on Fe {100}, a cable-like structure appears on GN and the unit cell of moiré patterning is much smaller than the other three surfaces in Figure 3d.
In Figure 3, the maximum lengths of the corrugation are about ∼1.65 Å for {110}, ∼1.42 Å for {111}, ∼1.22 Å for {112} and ∼1.34 Å for {100} from EAM potential, which are higher than those from LJ potential with ∼0.82 Å for {110}, ∼0.71 Å for {111}, ∼1.01 Å for {112} and ∼0.7 Å for {100}. The distributions of the vertical distance (D1) between the C atoms in the monolayer GN and the Fe {110}, {111}, {112} and {100} surfaces are further provided, as shown in Figure 4. It is found that the D1s from EAM potential are 1.3–1.4 ± 0.8 Å, and the distribution of D1 is more scattered and flatter than that from LJ one with the D1s of 2.0–2.2 ± 0.4Å. The distribution on four surfaces from EAM is less different than that from LJ. The maximum frequency (FM) of the D1 from EAM is smaller than that from LJ, and the FM on Fe {112} has always the highest value, while that on Fe {110} is the lowest from both potentials.
The structure for GN/Fe surface may also be affected by the layer number of graphene, the stacking style of multilayer graphene and defects on graphene [53,54,55]. For example, when the graphene has multiple layers, the graphene edge becomes a staggered edge, a double layer folded back on itself or a small scroll to resemble a nanotube [55]. Therefore, we continue to examine adhesion features of bilayer and trilayer GNs on four surfaces in the following section.
3.2. Adhesion Features of Bilayer or Trilayer Graphene Nanosheet and Iron Surfaces
When the number of GN layers increases, the adhesion energy (E) from EAM potential increases. On the contrary, there is no clear trend from LJ. The Es of the AB-stacked bilayer GN from LJ (EAM) potential are 0.80 (26.96), 0.22 (25.00), 0.49 (25.08) and 0.15 (25.29) J/m2 on the {110}, {111}, {112} and {100} iron surfaces, respectively, as listed in Table 3. For the AA-stacked GN from LJ (EAM) potential, the Es are −1.22 (27.00), −0.62 (24.91), −0.56 (25.56) and 0.47 (26.33) J/m2 on the {110}, {111}, {112} and {100} iron surfaces, respectively. It is also found that the E from EAM is much less sensitive to stacking, compared to that from LJ. The results show that the AB-stacked bilayer GN on Fe {110} surface has a higher adhesion strength than that on the other surfaces and the AA-stacked bilayer GN is more likely to form on higher-index surfaces of {100}.
Using EAM potential, the 1 for the average vertical spacing between the bottom-layered C atoms in GN and the iron surface is within the range of 1.3–1.4 Å, and the 2 for the average vertical spacing between the top-layered C atoms and the iron surface is in the range of 4.8–5.0 Å, while the 1 is 2.0–2.2 Å and the 2 is 5.5–5.6 Å from LJ.
Next, we briefly compare surface morphologies of a bilayer GN with AB and AA stacking on the Fe {110} surface, as shown in Figure 5. It is found that in the corresponding layer of GN, the moiré pattern from the two potentials is very close and the corrugations from the two stacking sequences are also similar, which indicate that the moiré pattern is less sensitive to the stacking sequence of GN. The maximum lengths of corrugation from EAM potential are ~1.42 Å for the bottom layer and ∼1.28 Å for the top one, which become ~1.10 and ∼0.97 Å from LJ potential. The maximum length of the corrugation for the bottom layer is shorter than that of monolayer GN from EAM potential, in contrast to that from LJ. The observations from surface morphology on the other three surfaces are similar to those on the {110} surface, which is not fully addressed in this work.
Furthermore, the distributions of the vertical distance (D1 and D2) between the C atom in the bottom and top layers of the GN and the Fe {110}, {111}, {112} and {100} surfaces are illustrated in Figure 6. It is found that (1) in the AB-stacked bilayer GN on four iron substrates, the distributions of the D1 are similar to those in the monolayer ones; (2) in the AA-stacked bilayer GN cases, the distribution of the D1 on Fe {112} from EAM becomes less scattered and the maximum frequency (FM) is higher, compared with those on the other surfaces; (3) the FM of the D1 on Fe {111} from LJ becomes the highest rather than that on Fe {112}, which occurs in the monolayer GN case; (4) in both AB- and AA-stacked GNs, the distribution of the D2 on the Fe {110} surface becomes more scattered and the FM is lower from EAM potential, compared with those of the D1 on Fe {110}; and (5) compared with those of the D1, the distributions of the D2 for AB- and AA-stacked GNs on the {111}, {112} and {100} iron surfaces become less scattered and the FM become higher from EAM potential.
For trilayer GN on the iron substrates, the ABA and ABC stacking sequences are considered. The Es of the ABA-stacked GN from LJ (EAM) potential are 0.12 (28.41), −1.03 (25.02), −0.86 (25.70) and 0.28 (25.03) J/m2 on the {110}, {111}, {112} and {100} iron surfaces, respectively, while the Es become −0.1 (27.36), 0.48 (25.08), −0.18 (25.76) and −0.22 (24.99) J/m2 for the ABC-stacked one. The findings are similar to those in the bilayer ones, where the adhesion energy from EAM is less sensitive to stacking, in contrast to that from LJ. It is also observed that the ABA-stacked GN is more likely to form on lower-index {110} and {100} surfaces, while the ABC-stacked GN could be preferred on the higher-index {111} surface.
From EAM potential, the 1 for the average vertical spacing between the bottom-layered C atom and the surface increases slightly within the range of 1.3–1.5 Å, the 2 for the average spacing between the central-layered C atom and the substrate is in the range of 4.7–5.0 Å, and the 3 of the top-layered C atom to the substrate ranges from 8.2 to 8.4 Å. When the LJ potential is used, the 1 becomes 2.0–2.2 Å, the 2 is 5.5–5.6 Å and the 3 is 8.9–9.1 Å, as listed in Table 3.
The distributions of the vertical distance (D1, D2 and D3) between the C atoms in the bottom, central and top layers of GN and the Fe {110}, {111}, {112} and {100} surfaces are displayed in Figure 7. It is found that (1) using EAM potential, the distributions of the D2 and D3 on the {111}, {112} and {100} iron surfaces are less scattered; (2) the FM are higher than those of the corresponding D1; (3) the highest FM of the D1, D2 and D3 from both potentials almost appears on the Fe {100} surface, while the lowest one is nearly on the Fe {110} surface; (4) the highest FM of the D2 and D3 from EAM potential occur on the Fe {111} surface in the ABC-stacked trilayer GN cases, while they change on the Fe {100} surface when the LJ potential is used; and (5) in the ABC-stacked trilayer GN cases, the lowest FM of the D3 appears on the Fe {111} surface from EAM potential.
The average distances between the monolayer GN and iron surface were 2.0–2.2 Å from LJ potential and 1.3–1.4 Å from EAM. This result is consistent with adhesion energy analysis where stronger chemical binding exists in EAM description resulting in a shorter separation. Such a separation is nearly unchanged with the increasing layer number. The underlying reason could be the fact that the interactions of the additional layers with the substrate are van der Waals interactions. Moreover, the distributions of the length of Fe–C bonding and the vertical distance between the C atoms in the bottom layer of GN and iron substrate from EAM potential are generally more scattered than those from LJ, suggesting hybrid and strong bonding features between C and Fe atoms.
4. Conclusions
In summary, we have investigated adhesion energy of monolayer, bilayer or trilayer graphene nanosheets (GNs) located on four differently oriented iron substrates by molecular dynamic simulations using two types of Fe–C potentials. The results show that using Lennard–Jones (LJ) pair potential of Fe–C, the predicted adhesion energies of monolayer GN and iron substrate are 0.47, 0.62, 0.70 and 0.74 J/m2 on the {110}, {111}, {112} and {100} surfaces, respectively. The values of the counterparts from embedded-atom method (EAM) potential on the {110}, {111}, {112} and {100} surfaces are 26.83, 24.87, 25.13 and 25.01 J/m2, respectively. When the GN layer number increases from one to three, the adhesion energy from EAM potential increases. However, there is not a clear trend from LJ.
The adhesion energies of the AB-stacked bilayer GN from LJ (EAM) potential are 0.8 (26.96), 0.22 (25.00), 0.49 (25.08) and 0.15 (25.29) J/m2 on the {110}, {111}, {112} and {100} iron surfaces, respectively. The corresponding values for the AA-stacked GN on the {110}, {111}, {112} and {100} iron surfaces are −1.22 (27.00), −0.62 (24.91), −0.56 (25.56) and 0.47 (26.33) J/m2, respectively. For a trilayer GN, the adhesion energies of the ABA-stacked GN are 0.12 (28.41), −1.03 (25.02), −0.86 (25.70) and 0.28 (25.03) J/m2 on the {110}, {111}, {112} and {100} surfaces, respectively, while they become −0.1 (27.36), 0.48 (25.08), −0.18 (25.76) and −0.22 (24.99) J/m2 for the ABC-stacked one. The iron {110} surface is the most adhesive surface for monolayer, bilayer and trilayer GN from EAM potential. Our results imply that the predicted adhesion energy from the LJ potential describes a weak bond of Fe–C, while the adhesion from EAM performs a hybrid chemical and strong bond.
The average vertical distances between the monolayer GN and four iron surfaces are 2.0–2.2 Å from LJ potential and 1.3–1.4 Å from EAM, consistent with the adhesion energy analysis. The graphene–iron separation is nearly unchanged with the increasing layer number. The distribution of the vertical distance between the C atom in the bottom layer of the GN and the iron surface from EAM potential is more scattered than that from LJ. It is also found that the ABA-stacked GN is likely to form on lower-index {110} and {100} surfaces, while the ABC-stacked GN is preferred on the higher-index {111} surface. Our study might be beneficial to graphene growing, surface engineering and enhancement of iron using graphene sheets.
Author Contributions
L.W., J.J., P.Y., Y.Z. and Q.P. conceived and designed the simulations; L.W. and P.Y. performed the simulations; L.W., J.J., P.Y., Y.Z. and Q.P. analyzed the data; L.W., J.J., Y.Z. and Q.P. wrote the paper. All authors discussed and commented on the manuscript.
Funding
This research was funded by National Key Research and Development Program of China (No. 2016YFB0701204) and National Higher-Education Institution General Research and Development Project (No. N180204012).
Conflicts of Interest
The authors declare no conflict of interest.
References
- Lee, C.; Wei, X.; Kysar, J.W.; Hone, J. Measurement of the Elastic Properties and Intrinsic Strength of Monolayer Graphene. Science 2008, 321, 385–388. [Google Scholar] [CrossRef] [PubMed]
- Peng, Q.; Liang, C.; Ji, W.; De, S. A theoretical analysis of the effect of the hydrogenation of graphene to graphane on its mechanical properties. Phys. Chem. Chem. Phys. 2013, 15, 2003–2011. [Google Scholar] [CrossRef] [PubMed]
- Cadelano, E.; Colombo, L. Effect of hydrogen coverage on the Young’s modulus of graphene. Phys. Rev. B 2012, 85, 245434. [Google Scholar] [CrossRef]
- Novoselov, K.S.; Fal’ko, V.I.; Colombo, L.; Gellert, P.R.; Schwab, M.G.; Kim, K. A roadmap for graphene. Nature 2012, 490, 192–200. [Google Scholar] [CrossRef]
- Hou, J.; Deng, B.H.; Zhu, H.X.; Lan, Y.C.; Shi, Y.F.; De, S.; Liu, L.; Chakraborty, P.; Gao, F.; Peng, Q. Magic auxeticity angle of graphene. Carbon 2019, 149, 350–354. [Google Scholar] [CrossRef] [Green Version]
- Cao, Q.; Geng, X.; Wang, H.; Wang, P.; Liu, A.; Lan, Y.; Peng, Q. A Review of Current Development of Graphene Mechanics. Crystals 2018, 8, 357. [Google Scholar] [CrossRef]
- Avouris, P.; Dimitrakopoulos, C. Graphene: Synthesis and applications. Mater. Today 2012, 15, 86–97. [Google Scholar] [CrossRef]
- Robertson, A.W.; Warner, J.H. Hexagonal Single Crystal Domains of Few-Layer Graphene on Copper Foils. Nano Lett. 2011, 11, 1182–1189. [Google Scholar] [CrossRef]
- Wang, W.H.; Peng, Q.; Dai, Y.Q.; Qian, Z.F.; Liu, S. Temperature dependence of raman spectra of graphene on copper foil substrate. J. Mater. Sci. 2016, 27, 3888–3893. [Google Scholar] [CrossRef]
- Zou, Z.; Carnevali, V.; Jugovac, M.; Patera, L.L.; Sala, A.; Panighel, M.; Cepek, C.; Soldano, G.; Mariscal, M.M.; Peressi, M.; et al. Graphene on nickel (100) micro-grains: Modulating the interface interaction by extended moiré superstructures. Carbon 2018, 130, 441–447. [Google Scholar] [CrossRef]
- You, Y.; Yoshimura, M.; Cholake, S.; Lee, G.H.; Sahajwalla, V.; Joshi, R. A Controlled Carburization Process to Obtain Graphene-Fe3C-Fe Composites. Adv. Mater. Interfaces 2018, 5, 1800599. [Google Scholar] [CrossRef]
- Wintterlin, J.; Bocquet, M.L. Graphene on metal surfaces. Surf. Sci. 2009, 603, 1841–1852. [Google Scholar] [CrossRef]
- Liu, P.; Cottrill, A.L.; Kozawa, D.; Koman, V.B.; Parviz, D.; Liu, A.T.; Yang, J.; Tran, T.Q.; Wong, M.H.; Wang, S.; et al. Emerging trends in 2D nanotechnology that are redefining our understanding of “Nanocomposites”. Nano Today 2018, 21, 18–40. [Google Scholar] [CrossRef]
- Bonaccorso, F.; Colombo, L.; Yu, G.; Stoller, M.; Tozzini, V.; Ferrari, A.C.; Ruoff, R.S.; Pellegrini, V. Graphene, related two-dimensional crystals, and hybrid systems for energy conversion and storage. Science 2015, 347, 1246501. [Google Scholar] [CrossRef]
- Fasolino, A.; Los, J.H.; Katsnelson, M.I. Intrinsic ripples in graphene. Nat. Mater. 2007, 6, 858–861. [Google Scholar] [CrossRef] [Green Version]
- Dai, J.F.; Wang, G.J.; Ma, L.; Wu, C.K. Surface properties of graphene: Relationship to graphene-polymer composites. Rev. Adv. Mater. Sci. 2015, 40, 60–71. [Google Scholar]
- Zheng, J.; Wang, Y.; Wang, L.; Quhe, R.; Ni, Z.; Mei, W.N.; Gao, Z.; Yu, D.; Shi, J.; Lu, J. Interfacial Properties of Bilayer and Trilayer Graphene on Metal Substrates. Sci. Rep. 2013, 3, 2081. [Google Scholar] [CrossRef]
- Gong, L.; Kinloch, I.A.; Young, R.J.; Riaz, I.; Jalil, R.; Novoselov, K.S. Interfacial Stress Transfer in a Graphene Monolayer Nanocomposite. Adv. Mater. 2010, 22, 2694–2697. [Google Scholar] [CrossRef] [Green Version]
- Su, B.; Han, Z.; Liu, B. Cellular Automaton Modeling of Austenite Nucleation and Growth in Hypoeutectoid Steel during Heating Process. ISIJ Int. 2013, 53, 527–534. [Google Scholar] [CrossRef] [Green Version]
- Han, Z.; Han, G.; Luo, A.A.; Liu, B. Large-scale three-dimensional phase-field simulation of multi-variant β-Mg17Al12 in Mg–Al-based alloys. Comput. Mater. Sci. 2015, 101, 248–254. [Google Scholar] [CrossRef]
- Cao, J.; Jin, J.; Wang, L.; Li, S.; Zong, Y. Modeling for onset strain of deformation-induced martensite transformation in Q&P steel by a mean-field Eshelby approach. Model. Simul. Mater. Sci. Eng. 2019, 27, 085002. [Google Scholar]
- Vinogradov, N.A.; Zakharov, A.A.; Kocevski, V.; Rusz, J.; Simonov, K.A.; Eriksson, O.; Mikkelsen, A.; Lundgren, E.; Vinogradov, A.S.; Mårtensson, N.; et al. Formation and Structure of Graphene Waves on Fe (110). Phys. Rev. Lett. 2012, 109, 026101. [Google Scholar] [CrossRef] [PubMed]
- Fonseca, A.F.; Liang, T.; Zhang, D.; Choudhary, K.; Phillpot, S.R.; Sinnott, S.B. Graphene–Titanium Interfaces from Molecular Dynamics Simulations. ACS Appl. Mater. Interfaces 2017, 9, 33288–33297. [Google Scholar] [CrossRef] [PubMed]
- Yoon, T.; Shin, W.C.; Kim, T.Y.; Mun, J.H.; Kim, T.S.; Cho, B.J. Direct Measurement of Adhesion Energy of Monolayer Graphene As-Grown on Copper and Its Application to Renewable Transfer Process. Nano Lett. 2012, 12, 1448–1452. [Google Scholar] [CrossRef]
- Das, S.; Lahiri, D.; Lee, D.Y.; Agarwal, A.; Choi, W. Measurements of the adhesion energy of graphene to metallic substrates. Carbon 2013, 59, 121–129. [Google Scholar] [CrossRef]
- Xu, Z.; Buehler, M.J. Interface structure and mechanics between graphene and metal substrates: A first-principles study. J. Phys. Condens. Matter 2010, 22, 485301. [Google Scholar] [CrossRef]
- Süle, P.; Szendrő, M. Time-lapsed graphene moiré superlattices on Cu (111). Model. Simul. Mat. Sci. Eng. 2015, 23, 29–33. [Google Scholar] [CrossRef]
- Chang, W.; Rajan, S.; Peng, B.; Ren, C.; Sutton, M.; Li, C. Adhesion energy of as-grown graphene on nickel substrates via StereoDIC-based blister experiments. Carbon 2019, 153, 699–706. [Google Scholar] [CrossRef]
- Restuccia, P.; Righi, M.C. Tribochemistry of graphene on iron and its possible role in lubrication of steel. Carbon 2016, 106, 118–124. [Google Scholar] [CrossRef] [Green Version]
- Wang, L.; Jin, J.; Cao, J.; Yang, P.; Peng, Q. Interaction of Edge Dislocations with Graphene Nanosheets in Graphene/Fe Composites. Crystals 2018, 8, 160. [Google Scholar] [CrossRef]
- Li, D.; Müller, M.B.; Gilje, S.; Kaner, R.B.; Wallace, G.G. Processable aqueous dispersions of graphene nanosheets. Nat. Nanotechnol. 2008, 3, 101–105. [Google Scholar] [CrossRef] [PubMed]
- Peng, Q.; Meng, F.; Yang, Y.; Lu, C.; Deng, H.; Wang, L.; De, S.; Gao, F. Shockwave generates<100>dislocation loops in bcc iron. Nat. Commun. 2018, 9, 4880. [Google Scholar] [CrossRef] [PubMed]
- Plimpton, S. Fast Parallel Algorithms for Short-Range Molecular Dynamics. J. Comput. Phys. 1995, 117, 1–19. [Google Scholar] [CrossRef] [Green Version]
- Hoover, W.G. Canonical dynamics: Equilibrium phase-space distributions. Phys. Rev. A 1985, 31, 1695–1697. [Google Scholar] [CrossRef] [Green Version]
- He, X.; Bai, Q.; Shen, R. Atomistic perspective of how graphene protects metal substrate from surface damage in rough contacts. Carbon 2018, 130, 672–679. [Google Scholar] [CrossRef]
- Shi, X.; Yin, Q.; Wei, Y. A theoretical analysis of the surface dependent binding, peeling and folding of graphene on single crystal copper. Carbon 2012, 50, 3055–3063. [Google Scholar] [CrossRef] [Green Version]
- Sidorenkov, A.V.; Kolesnikov, S.V.; Saletsky, A.M. Molecular dynamics simulation of graphene on Cu (111) with different Lennard-Jones parameters. Eur. Phys. J. B 2016, 89, 220. [Google Scholar] [CrossRef]
- Lee, B.J. A modified embedded-atom method interatomic potential for the Fe-C system. Acta Mater. 2006, 54, 701–711. [Google Scholar] [CrossRef]
- Masoud, A.; Van Duin, A.C.; Kubicki, J.D. Development of a reactive force field for iron-oxyhydroxide systems. J. Phys. Chem. A 2010, 114, 6298–6307. [Google Scholar]
- Becquart, C.; Raulot, J.; Bencteux, G.; Domain, C.; Perez, M.; Garruchet, S.; Nguyen, H. Atomistic modeling of an Fe system with a small concentration of C. Comput. Mater. Sci. 2007, 40, 119–129. [Google Scholar] [CrossRef]
- Vinogradov, N.; Simonov, K.; Generalov, A.; Drnec, J.; Carlà, F.; Vinogradov, A.; Preobrajenski, A.; Mårtensson, N.; Felici, R.; Vinogradov, N. The structural evolution of graphene/Fe (110) systems upon annealing. Carbon 2017, 111, 113–120. [Google Scholar] [CrossRef]
- Hepburn, D.J.; Ackland, G.J. Metallic-covalent interatomic potential for carbon in iron. Phys. Rev. B 2008, 78, 165115. [Google Scholar] [CrossRef]
- Zan, R.; Bangert, U.; Ramasse, Q.; Novoselov, K.S. Interaction of Metals with Suspended Graphene Observed by Transmission Electron Microscopy. J. Phys. Chem. Lett. 2012, 3, 953–958. [Google Scholar] [CrossRef] [PubMed]
- Hupalo, M.; Liu, X.; Wang, C.Z.; Lu, W.C.; Yao, Y.X.; Ho, K.M.; Tringides, M.C. Metal Nanostructure Formation on Graphene: Weak versus Strong Bonding. Adv. Mater. 2011, 23, 2082–2087. [Google Scholar] [CrossRef]
- Zan, R.; Bangert, U.; Ramasse, Q.; Novoselov, K.S. Metal−Graphene Interaction Studied via Atomic Resolution Scanning Transmission Electron Microscopy. Nano Lett. 2011, 11, 1087–1092. [Google Scholar] [CrossRef]
- Wang, Y.; Cao, C.; Cheng, H.P. Metal-terminated graphene nanoribbons. Phys. Rev. B 2010, 82, 205429. [Google Scholar] [CrossRef]
- Hupalo, M.; Binz, S.; Tringides, M.C. Strong metal adatom–substrate interaction of Gd and Fe with graphene. J. Phys. Condens. Matter 2011, 23, 045005. [Google Scholar] [CrossRef]
- Mendelev, M.I.; Han, S.; Srolovitz, D.J.; Ackland, G.; Sun, D.Y.; Asta, M. Development of new interatomic potentials appropriate for crystalline and liquid iron. Philos. Mag. 2003, 83, 3977–3994. [Google Scholar] [CrossRef]
- Donald, W.B.; Olga, A.S.; Judith, A.H.; Steven, J.S.; Boris, N.; Susan, B.S. A second-generation reactive empirical bond order (REBO) potential energy expression for hydrocarbons. J. Phys. Condens. Matter 2002, 14, 783. [Google Scholar]
- O’Connor, T.C.; Andzelm, J.; Robbins, M.O. AIREBO-M: A reactive model for hydrocarbons at extreme pressures. J. Chem. Phys. 2015, 142, 024903. [Google Scholar] [CrossRef]
- Zhang, J.M.; Wang, D.D.; Xu, K.W. Calculation of the surface energy of bcc transition metals by using the second nearest–neighbor modified embedded atom method. Appl. Surf. Sci. 2006, 252, 8217–8222. [Google Scholar] [CrossRef]
- Elettro, H.; Melo, F. Ripples and wrinkles in graphene: Beyond continuum mechanics. In Wrinkled Polymer Surfaces; Springer: Cham, Switzerland, 2019; pp. 229–252. [Google Scholar]
- Kroeger, D.; Cisternas, E.; Correa, J. Bilayer graphene films over Ru (0001) surface: Ab-initio calculations and STM images simulation. Surf. Sci. 2015, 634, 31–36. [Google Scholar] [CrossRef]
- Hu, X.; Meng, F. First-Principle Study on the Interaction between Fe and Trivacancy in Graphene. J. Nanomater. 2016, 2016, 2. [Google Scholar] [CrossRef]
- Gass, M.H.; Bangert, U.; Bleloch, A.L.; Wang, P.; Nair, R.R.; Geim, A.K. Free-standing graphene at atomic resolution. Nat. Nanotechnol. 2008, 3, 676–681. [Google Scholar] [CrossRef] [PubMed]
Figure 1.
(a) Schematic of molecular dynamic (MD) setting for a graphene nanosheet (blue) located on iron (grey) surface with different orientations; (b) atomic structure of a bilayer graphene nanosheet (GN) with AB or AA stacking; and (c) atomic structure of a trilayer GN with ABA or ABC stacking.
Figure 1.
(a) Schematic of molecular dynamic (MD) setting for a graphene nanosheet (blue) located on iron (grey) surface with different orientations; (b) atomic structure of a bilayer graphene nanosheet (GN) with AB or AA stacking; and (c) atomic structure of a trilayer GN with ABA or ABC stacking.

Figure 2.
Distribution histograms of the length of Fe–C bonding in the monolayer GN on the (a) {110}; (b) {111}; (c) {112}; and (d) {100} surfaces of iron substrates, calculated from MD simulations using LJ and EAM potentials.
Figure 2.
Distribution histograms of the length of Fe–C bonding in the monolayer GN on the (a) {110}; (b) {111}; (c) {112}; and (d) {100} surfaces of iron substrates, calculated from MD simulations using LJ and EAM potentials.

Figure 3.
Height profiles of monolayer GN on the (a) {110}; (b) {111}; (c) {112}; and (d) {100} surface of iron substrates, calculated from MD simulations using LJ and EAM potentials.
Figure 3.
Height profiles of monolayer GN on the (a) {110}; (b) {111}; (c) {112}; and (d) {100} surface of iron substrates, calculated from MD simulations using LJ and EAM potentials.

Figure 4.
Distribution histograms of the vertical distance (1) between the C atoms in the monolayer GN and the (a) {110}; (b) {111}; (c) {112}; and (d) {100} surface of iron substrates, calculated from MD simulations using LJ and EAM potentials.
Figure 4.
Distribution histograms of the vertical distance (1) between the C atoms in the monolayer GN and the (a) {110}; (b) {111}; (c) {112}; and (d) {100} surface of iron substrates, calculated from MD simulations using LJ and EAM potentials.

Figure 5.
Height profiles of a bilayer GN with (a) AB-stacking from EAM; (b) AA-stacking from EAM; (c) AB-stacking from LJ; and (d) AA-stacking from LJ, located on the iron {110} surface.
Figure 5.
Height profiles of a bilayer GN with (a) AB-stacking from EAM; (b) AA-stacking from EAM; (c) AB-stacking from LJ; and (d) AA-stacking from LJ, located on the iron {110} surface.
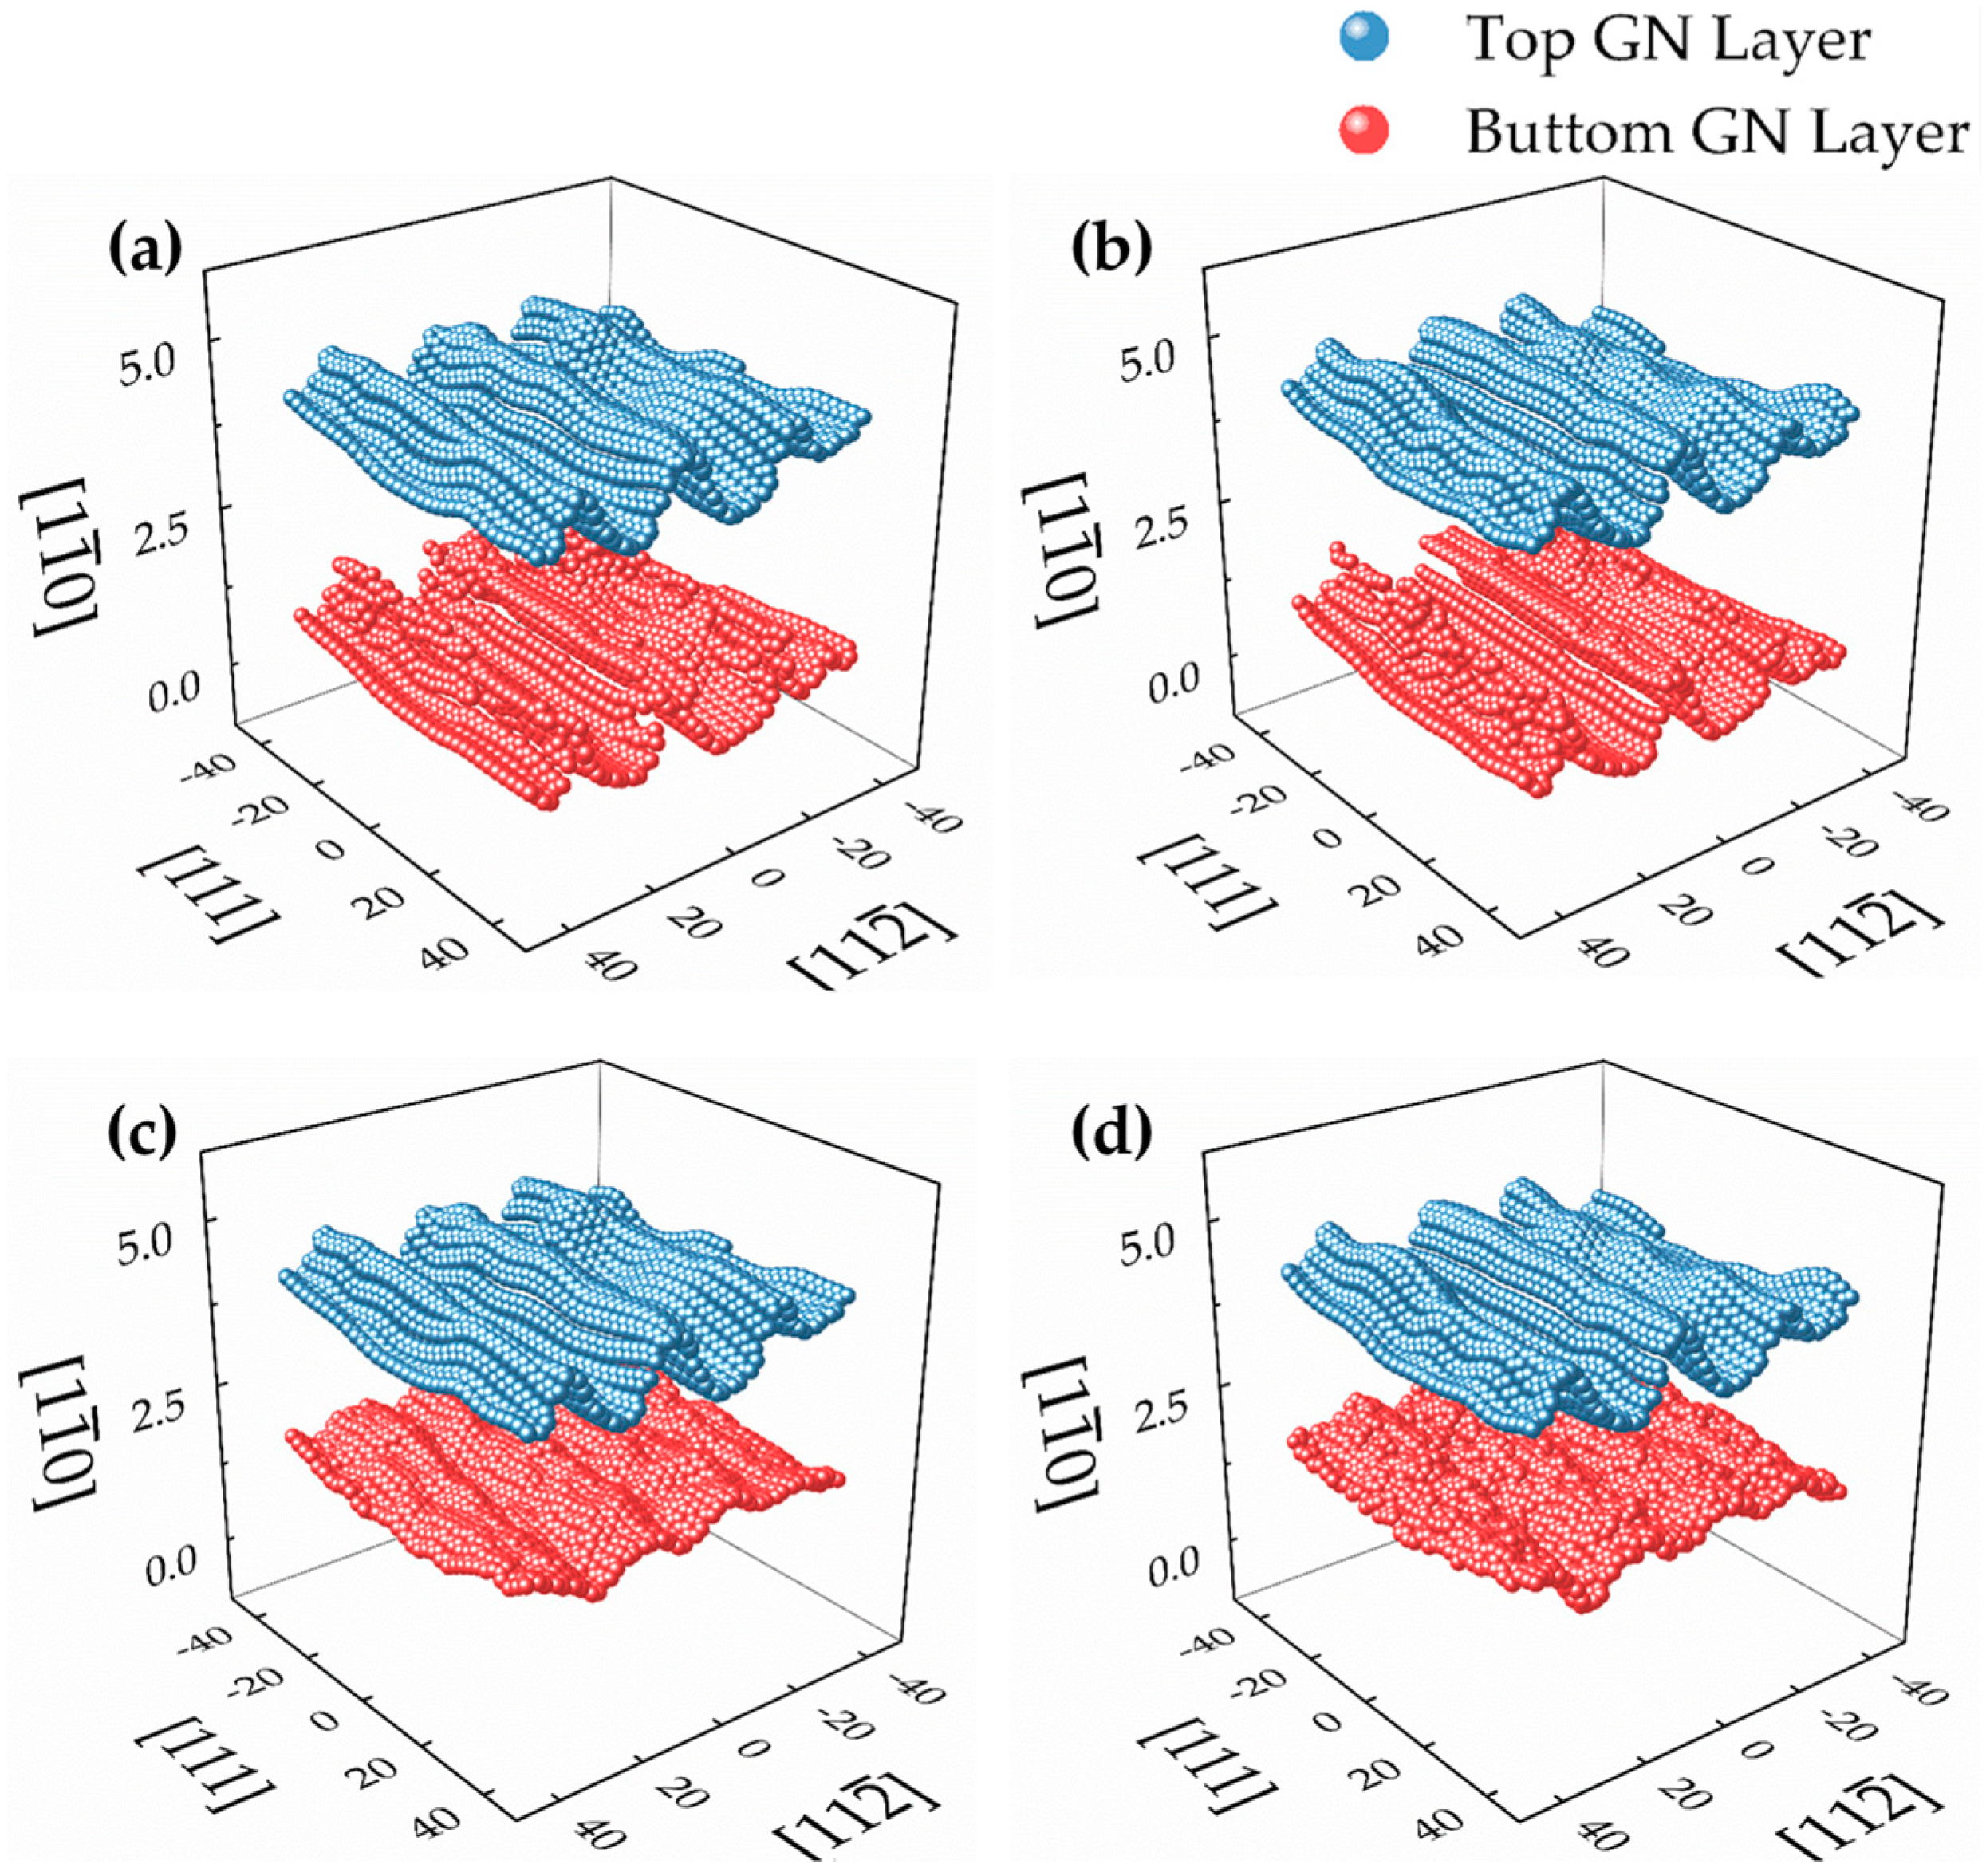
Figure 6.
The distributions of the vertical distance (D1 and D2) between the bottom- and top-layered C atoms of the AB- and AA-stacked bilayer GN and the {110}, {111}, {112} and {100} surfaces of iron substrates, calculated from MD simulations using LJ and EAM potentials.
Figure 6.
The distributions of the vertical distance (D1 and D2) between the bottom- and top-layered C atoms of the AB- and AA-stacked bilayer GN and the {110}, {111}, {112} and {100} surfaces of iron substrates, calculated from MD simulations using LJ and EAM potentials.

Figure 7.
The distributions of the vertical distance (D1, D2 and D3) between the bottom-, central- and top-layered C atoms of the ABA- and ABC-stacked trilayer GN and the {110}, {111}, {112} and {100} surfaces of iron substrates, calculated from MD simulations using LJ and EAM potentials.
Figure 7.
The distributions of the vertical distance (D1, D2 and D3) between the bottom-, central- and top-layered C atoms of the ABA- and ABC-stacked trilayer GN and the {110}, {111}, {112} and {100} surfaces of iron substrates, calculated from MD simulations using LJ and EAM potentials.

Table 1.
Comparison of adhesion energy (E) of graphene (Gr) to Fe, Cu and Ni substrates, obtained from experiments, first-principle (FP) simulation and molecular dynamic (MD) with different types of interatomic potentials.
Table 1.
Comparison of adhesion energy (E) of graphene (Gr) to Fe, Cu and Ni substrates, obtained from experiments, first-principle (FP) simulation and molecular dynamic (MD) with different types of interatomic potentials.
| Gr/Metal | Graphene/Fe (110) | Graphene/Cu (111) | Graphene/Ni (111) | ||||||||||
|---|---|---|---|---|---|---|---|---|---|---|---|---|---|
| FP [29] | MD [35] | FP [26] | MD-LJ [36] | MD-LJ [37] | EXP [24] | EXP [25] | FP [26] | EXP [28] | EXP [25] | ||||
| Adhesion | LJ [35] | MEAM [38] | ReaxFF [39] | ||||||||||
| E (J/m2) | 0.89 | 0.94 | 40.09 | 15.04 | 0.40 | 0.40 | 0.05–0.2 | 0.72 | 12.75 | 1.46 | 6.76 | 72.7 | |
Table 2.
Adhesion energy (E) and average vertical distance (1) between the C atoms of monolayer graphene nanosheet (GN) and iron surface, where the GN was located on differently oriented iron surfaces.
Table 2.
Adhesion energy (E) and average vertical distance (1) between the C atoms of monolayer graphene nanosheet (GN) and iron surface, where the GN was located on differently oriented iron surfaces.
| GN/Fe | {110} | {111} | {112} | {100} | |||||
|---|---|---|---|---|---|---|---|---|---|
| Adhesion | LJ | EAM | LJ | EAM | LJ | EAM | LJ | EAM | |
| E (J/m2) | 0.47 | 26.83 | 0.62 | 24.87 | 0.70 | 25.13 | 0.74 | 25.01 | |
| 1 (Å) | 2.2 | 1.4 | 2.0 | 1.3 | 2.0 | 1.4 | 2.2 | 1.4 | |
Table 3.
Adhesion energy (E) and average vertical distance (i) between the C atoms in the ith layer of GN and iron surface, where a bilayer or trilayer GN is located on iron substrate with different surface orientation.
Table 3.
Adhesion energy (E) and average vertical distance (i) between the C atoms in the ith layer of GN and iron surface, where a bilayer or trilayer GN is located on iron substrate with different surface orientation.
| GN/Fe | {110} | {111} | {112} | {100} | |||||
|---|---|---|---|---|---|---|---|---|---|
| Adhesion | LJ | EAM | LJ | EAM | LJ | EAM | LJ | EAM | |
| Bilayer GN AB-stack | E (J/m2) | 0.80 | 26.93 | 0.22 | 25.00 | 0.49 | 25.08 | 0.15 | 25.29 |
| 1 (Å) | 2.2 | 1.4 | 2.0 | 1.3 | 2.0 | 1.4 | 2.2 | 1.4 | |
| 2 (Å) | 5.6 | 4.9 | 5.5 | 4.8 | 5.5 | 4.9 | 5.6 | 4.9 | |
| AA-stack | E (J/m2) | −1.22 | 27.00 | −0.62 | 24.91 | −0.56 | 25.26 | 0.47 | 26.33 |
| 1 (Å) | 2.2 | 1.4 | 2.0 | 1.2 | 2.0 | 1.4 | 2.2 | 1.4 | |
| 2 (Å) | 5.6 | 4.9 | 5.5 | 4.9 | 5.5 | 4.9 | 5.6 | 4.9 | |
| Trilayer GN ABA-stack | E (J/m2) | 0.12 | 28.41 | −1.03 | 25.02 | −0.86 | 25.70 | 0.28 | 25.03 |
| 1 (Å) | 2.2 | 1.4 | 2.0 | 1.3 | 2.0 | 1.4 | 2.2 | 1.5 | |
| 2 (Å) | 5.6 | 4.9 | 5.5 | 4.7 | 5.5 | 4.8 | 5.6 | 5.6 | |
| 3 (Å) | 9.0 | 8.4 | 8.9 | 8.2 | 8.9 | 8.2 | 9.1 | 8.4 | |
| ABC-stack | E (J/m2) | −0.1 | 27.36 | 0.48 | 25.08 | −0.18 | 25.76 | −0.22 | 24.99 |
| 1 (Å) | 2.2 | 1.4 | 2.0 | 1.3 | 2.0 | 1.4 | 2.2 | 1.5 | |
| 2 (Å) | 5.6 | 4.9 | 5.5 | 4.7 | 5.5 | 4.9 | 5.6 | 5.0 | |
| 3 (Å) | 9.1 | 8.3 | 8.9 | 8.2 | 8.9 | 8.3 | 9.1 | 8.4 | |
© 2019 by the authors. Licensee MDPI, Basel, Switzerland. This article is an open access article distributed under the terms and conditions of the Creative Commons Attribution (CC BY) license (http://creativecommons.org/licenses/by/4.0/).
Share and Cite
MDPI and ACS Style
Wang, L.; Jin, J.; Yang, P.; Zong, Y.; Peng, Q. Graphene Adhesion Mechanics on Iron Substrates: Insight from Molecular Dynamic Simulations. Crystals 2019, 9, 579. https://doi.org/10.3390/cryst9110579
AMA Style
Wang L, Jin J, Yang P, Zong Y, Peng Q. Graphene Adhesion Mechanics on Iron Substrates: Insight from Molecular Dynamic Simulations. Crystals. 2019; 9(11):579. https://doi.org/10.3390/cryst9110579
Chicago/Turabian StyleWang, Lu, Jianfeng Jin, Peijun Yang, Yaping Zong, and Qing Peng. 2019. "Graphene Adhesion Mechanics on Iron Substrates: Insight from Molecular Dynamic Simulations" Crystals 9, no. 11: 579. https://doi.org/10.3390/cryst9110579
Note that from the first issue of 2016, this journal uses article numbers instead of page numbers. See further details here.