Article

Bending Nanoindentation and Plasticity Noise in FCC Single and Polycrystals

1
Department of Mechanical and Aerospace Engineering, West Virginia University, Morgantown, WV 26506, USA
2
Department of Mechanical Engineering, Johns Hopkins University, Baltimore, MD 21216, USA
3
Department of Control Engineering, Faculty of Electrical Engineering, Czech Technical University in Prague, Technika 2, 16627 Prague 6, Czech Republic
4
Department of Physics and Astronomy, West Virginia University, Morgantown, WV 26506, USA
*
Author to whom correspondence should be addressed.
Crystals 2019, 9(12), 652; https://doi.org/10.3390/cryst9120652
Submission received: 21 October 2019 / Revised: 3 December 2019 / Accepted: 5 December 2019 / Published: 7 December 2019

Abstract

:
We present a high-throughput nanoindentation study of in situ bending effects on incipient plastic deformation behavior of polycrystalline and single-crystalline pure aluminum and pure copper at ultranano depths (< 200 nm). We find that hardness displays a statistically inverse dependence on in-plane stress for indentation depths smaller than 10 nm, and the dependence disappears for larger indentation depths. In contrast, plastic noise in the nanoindentation force and displacement displays statistically robust noise features, independently of applied stresses. Our experimental results suggest the existence of a regime in Face Centered Cubic (FCC) crystals where ultranano hardness is sensitive to residual applied stresses, but plasticity pop-in noise is insensitive to it.

1. Introduction

Nanoindentation provides a unique opportunity to probe mechanical deformation at the nanoscale of any solid surface. While numerous experimental nanoindentation studies have been conducted to understand size effects [1,2,3,4,5,6,7,8] and residual stresses [9,10,11,12] in nano- and microscale plasticity, it has been elusive to use surface nanoindentation to distinguish surface from bulk crystal plasticity features [13,14,15,16,17,18,19,20,21]. In a dislocation-free region, nanoindentation turns from elastic to plastic through a sudden burst, labeled as primary "pop-ins" [22,23,24,25,26,27,28,29,30]. However, in a dislocation-rich region, nanoindentation is characterized by a noisy response, with multiple secondary pop-in bursts at multiple depths [31]. Nanoindentation primary pop-in bursts initiate crystal plasticity and are known to be driven by surface dislocation nucleation [32] due to large stress concentrations at the indentation tip. Surface-induced primary pop-in events have been very useful in revealing fundamental mechanisms of surface-induced crystal plasticity in annealed crystals, and they appear to provide an onset signature of local plasticity in dislocation-starved surface locations. In this work, we investigate the role and character of the secondary pop-ins, namely the collective noise that emerges during nanoindentation at low depths (<200 nm) in determining mechanical properties of FCC crystals. We find that this secondary noise is robust across FCC single and poly- crystals, as well as in the presence of applied in situ tension, even though hardness displays strong sensitivity.
Nanoindentation has been used in investigations of in situ mechanically loaded metallic samples using a variety of indentation protocols, geometries and depths [32,33,34,35,36,37,38]. The main outcome of these works is a strong dependence of the apparent hardness on tensile stress, which nevertheless disappears if the nanoindentation surface contact area is scaled appropriately [39,40]. However, nanoscale effects of pop-in events, either primary or secondary ones, and especially in in situ loaded samples with large pre-existing dislocation density [31,32] (namely, prestrained and in situ loaded) have been ambiguous [33]. In particular, the question that arises is the ability to distinguish bulk dislocation density populations through the thorough investigation of noise features in force and hardness measurements at the ultrananoscale regime,).
In this paper, we focus on the statistical features of the noise in the nanoindentation force-depth curves at very shallow depths (<200 nm). We concentrate our efforts on common Face Centered Cubic (FCC) metals, in particular single and polycrystalline pure aluminum, and single crystal pure copper. In addition, we explore the effect of in situ bending stress on nanoindentation at very shallow depths (see Figure 1 and Figure 2). At shallow depths, plasticity is not primarily controlled by the shape of the indenter tip (see Supplementary Materials (SM)) and the most pronounced evidence of this fact is the well-known observation that post-indentation surface profiles are stochastic at depths less than 15 nm and do not exactly follow the indenter tip’s shape [31,32]. We study two tips, Berkovich (with a residual 10 nm apex-radius) and spherical with a radius of 5 μm (see Figure 3), and we find qualitative and statistical agreement of reported results (see also Supplementary Materials (SM)). In this work, we report on high-throughput indentation measurements on prestressed (see Table 1 and Table 2) FCC samples (single and polycrystal Cu, Al) (see Table 3) and statistically analyze large datasets of load–displacement curves, focusing on the behavior of hardness and pop-in noise. High-throughput indentations may be averaged to statistically nullify the effects of uncorrelated surface roughness and/or grain orientation, thus providing us the opportunity of only focusing on intrinsic microstructural effects. Single crystalline samples were oriented at (100) orientation, since uniaxial tension along this orientation leads to multi-slip dislocation plasticity [40]. The material selection of Cu and Al provided also some testing evidence for the variability of stacking fault energies and propensity for cross-slip in two distinct microstructures [41,42].

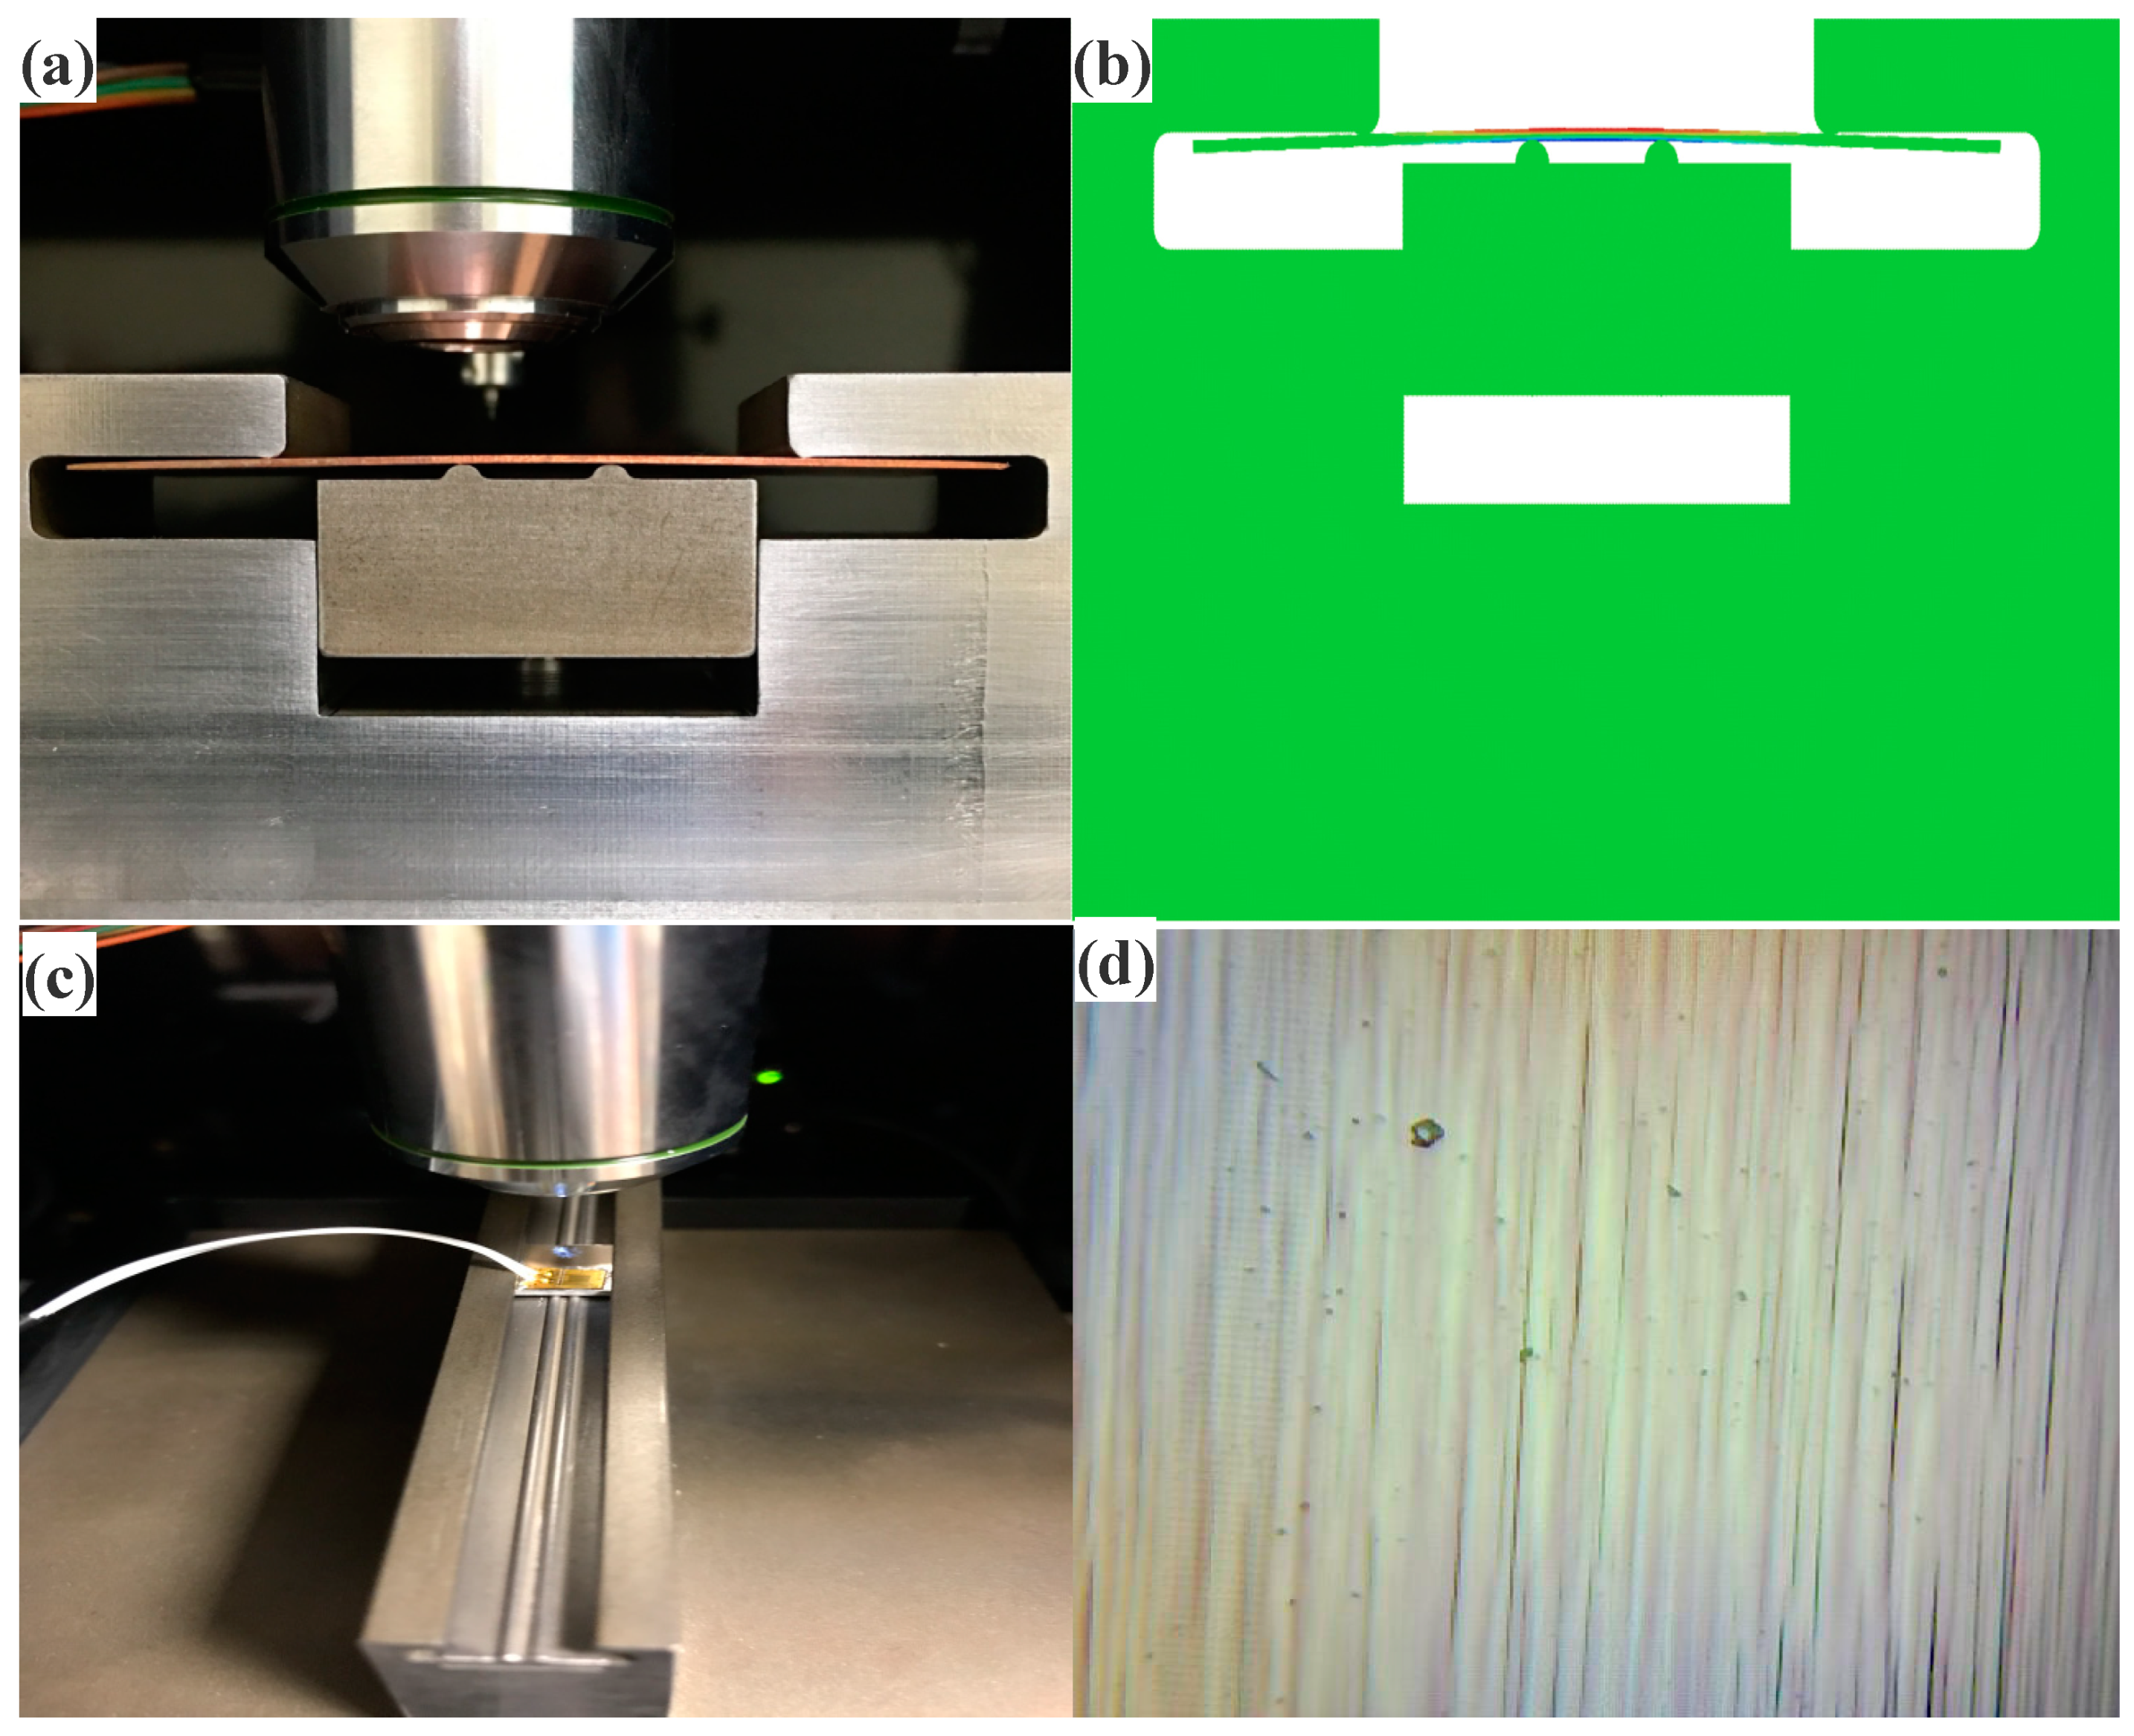
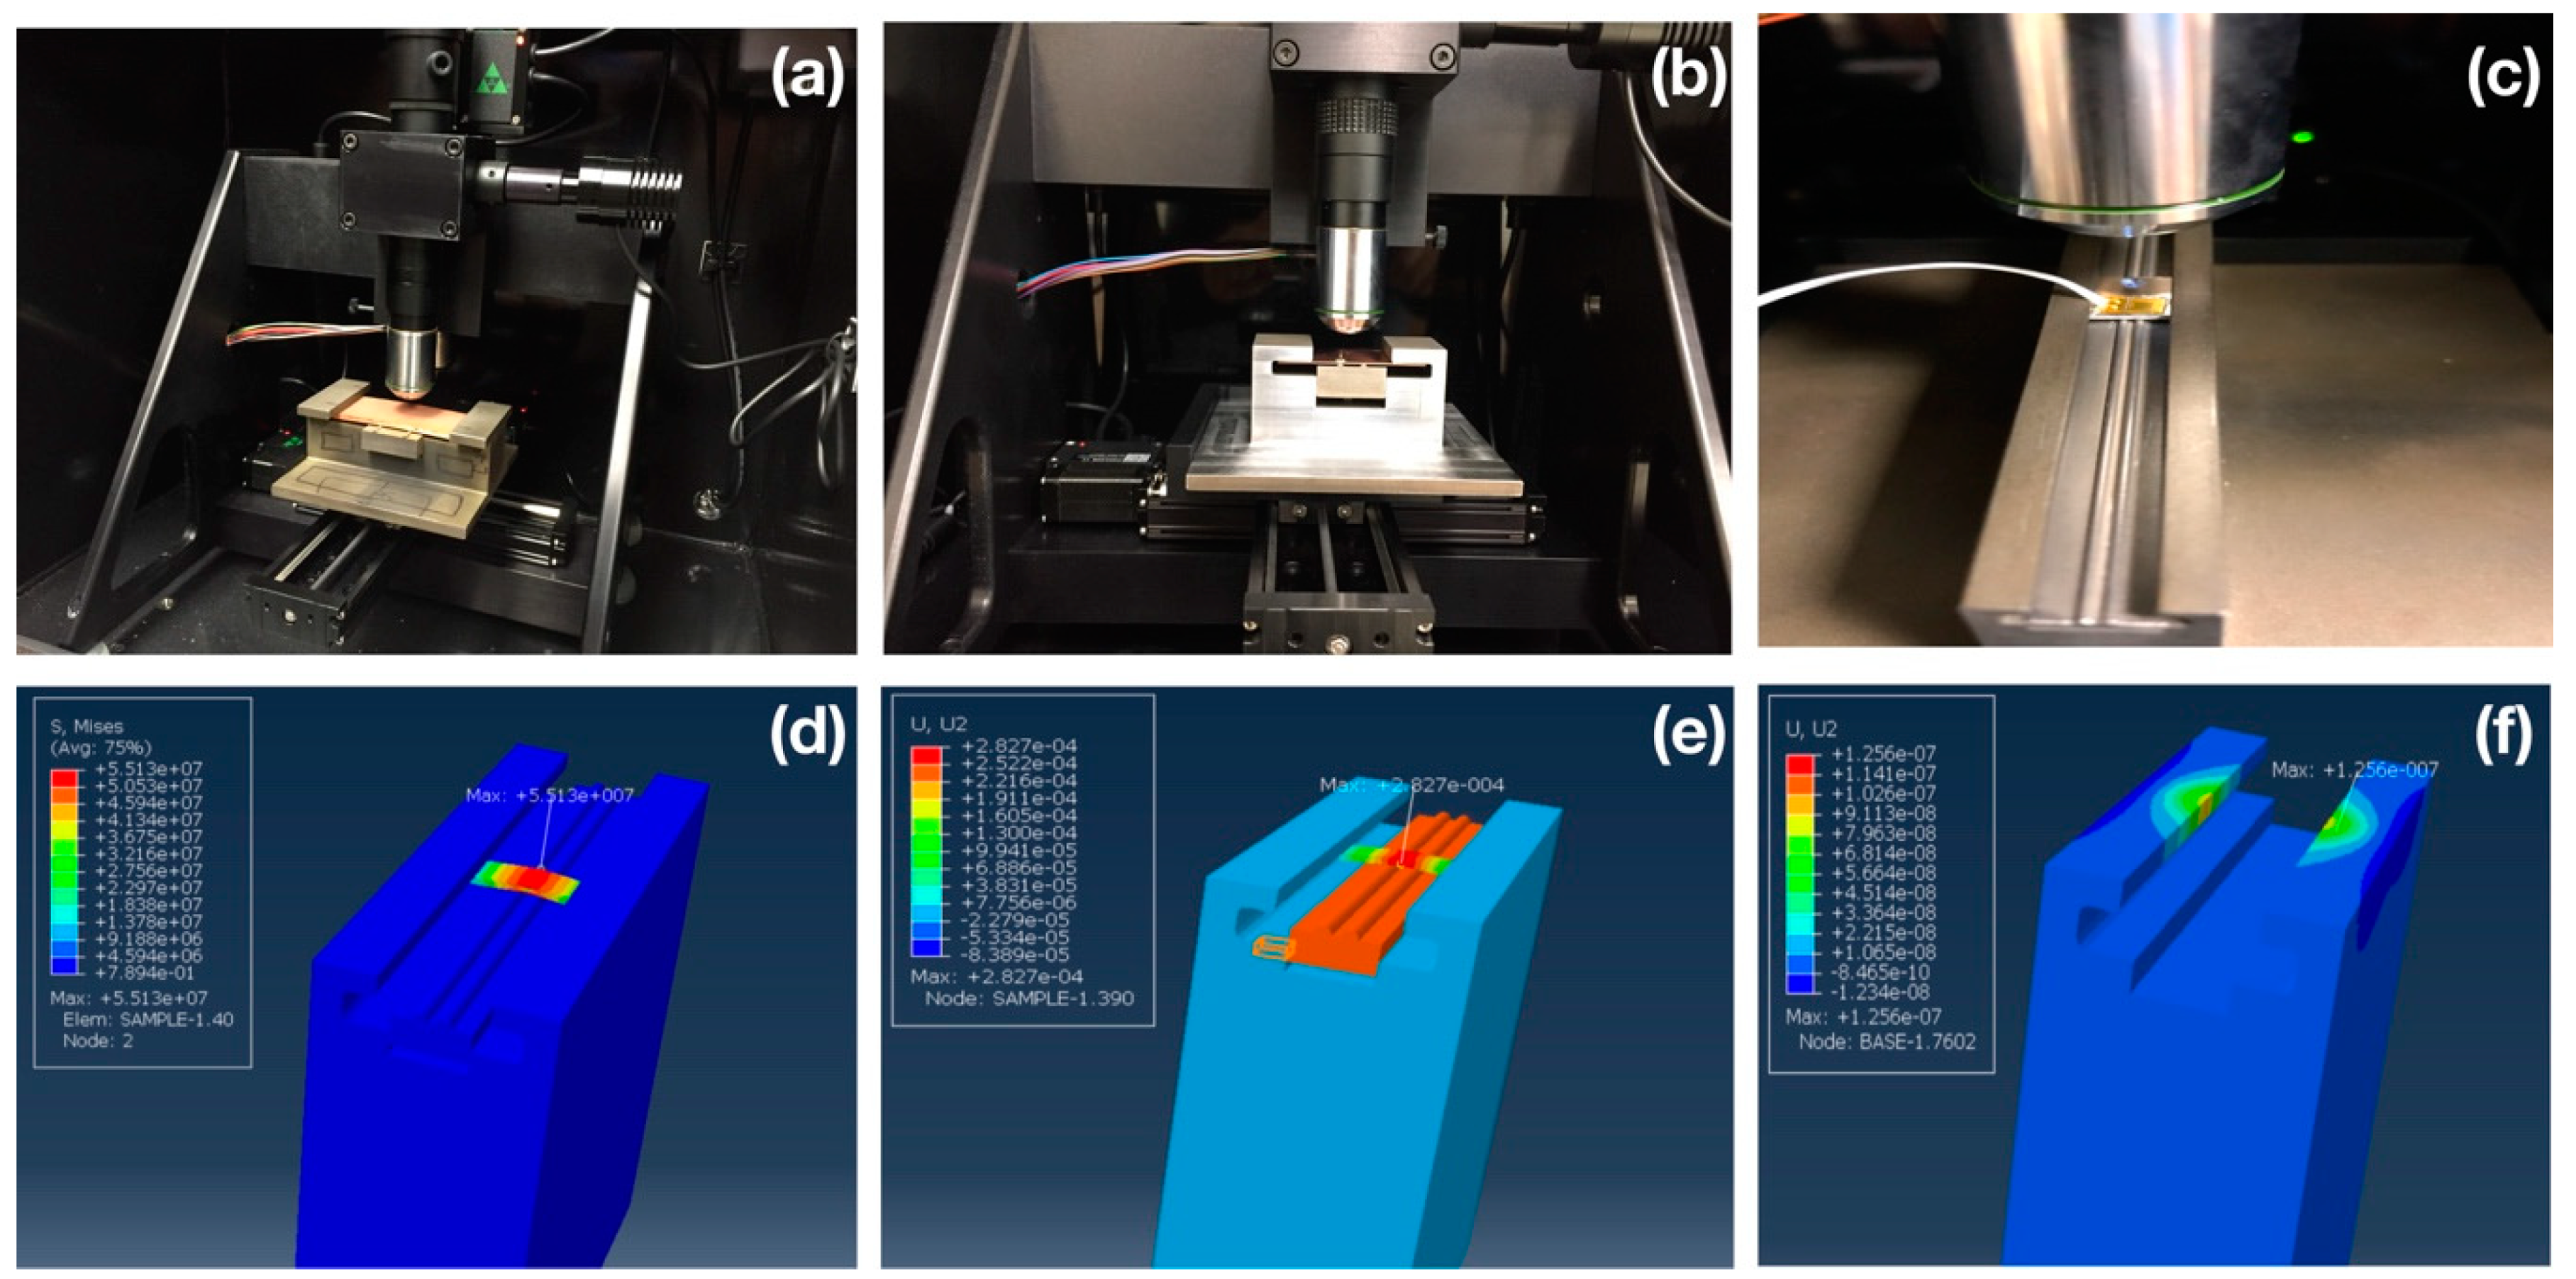
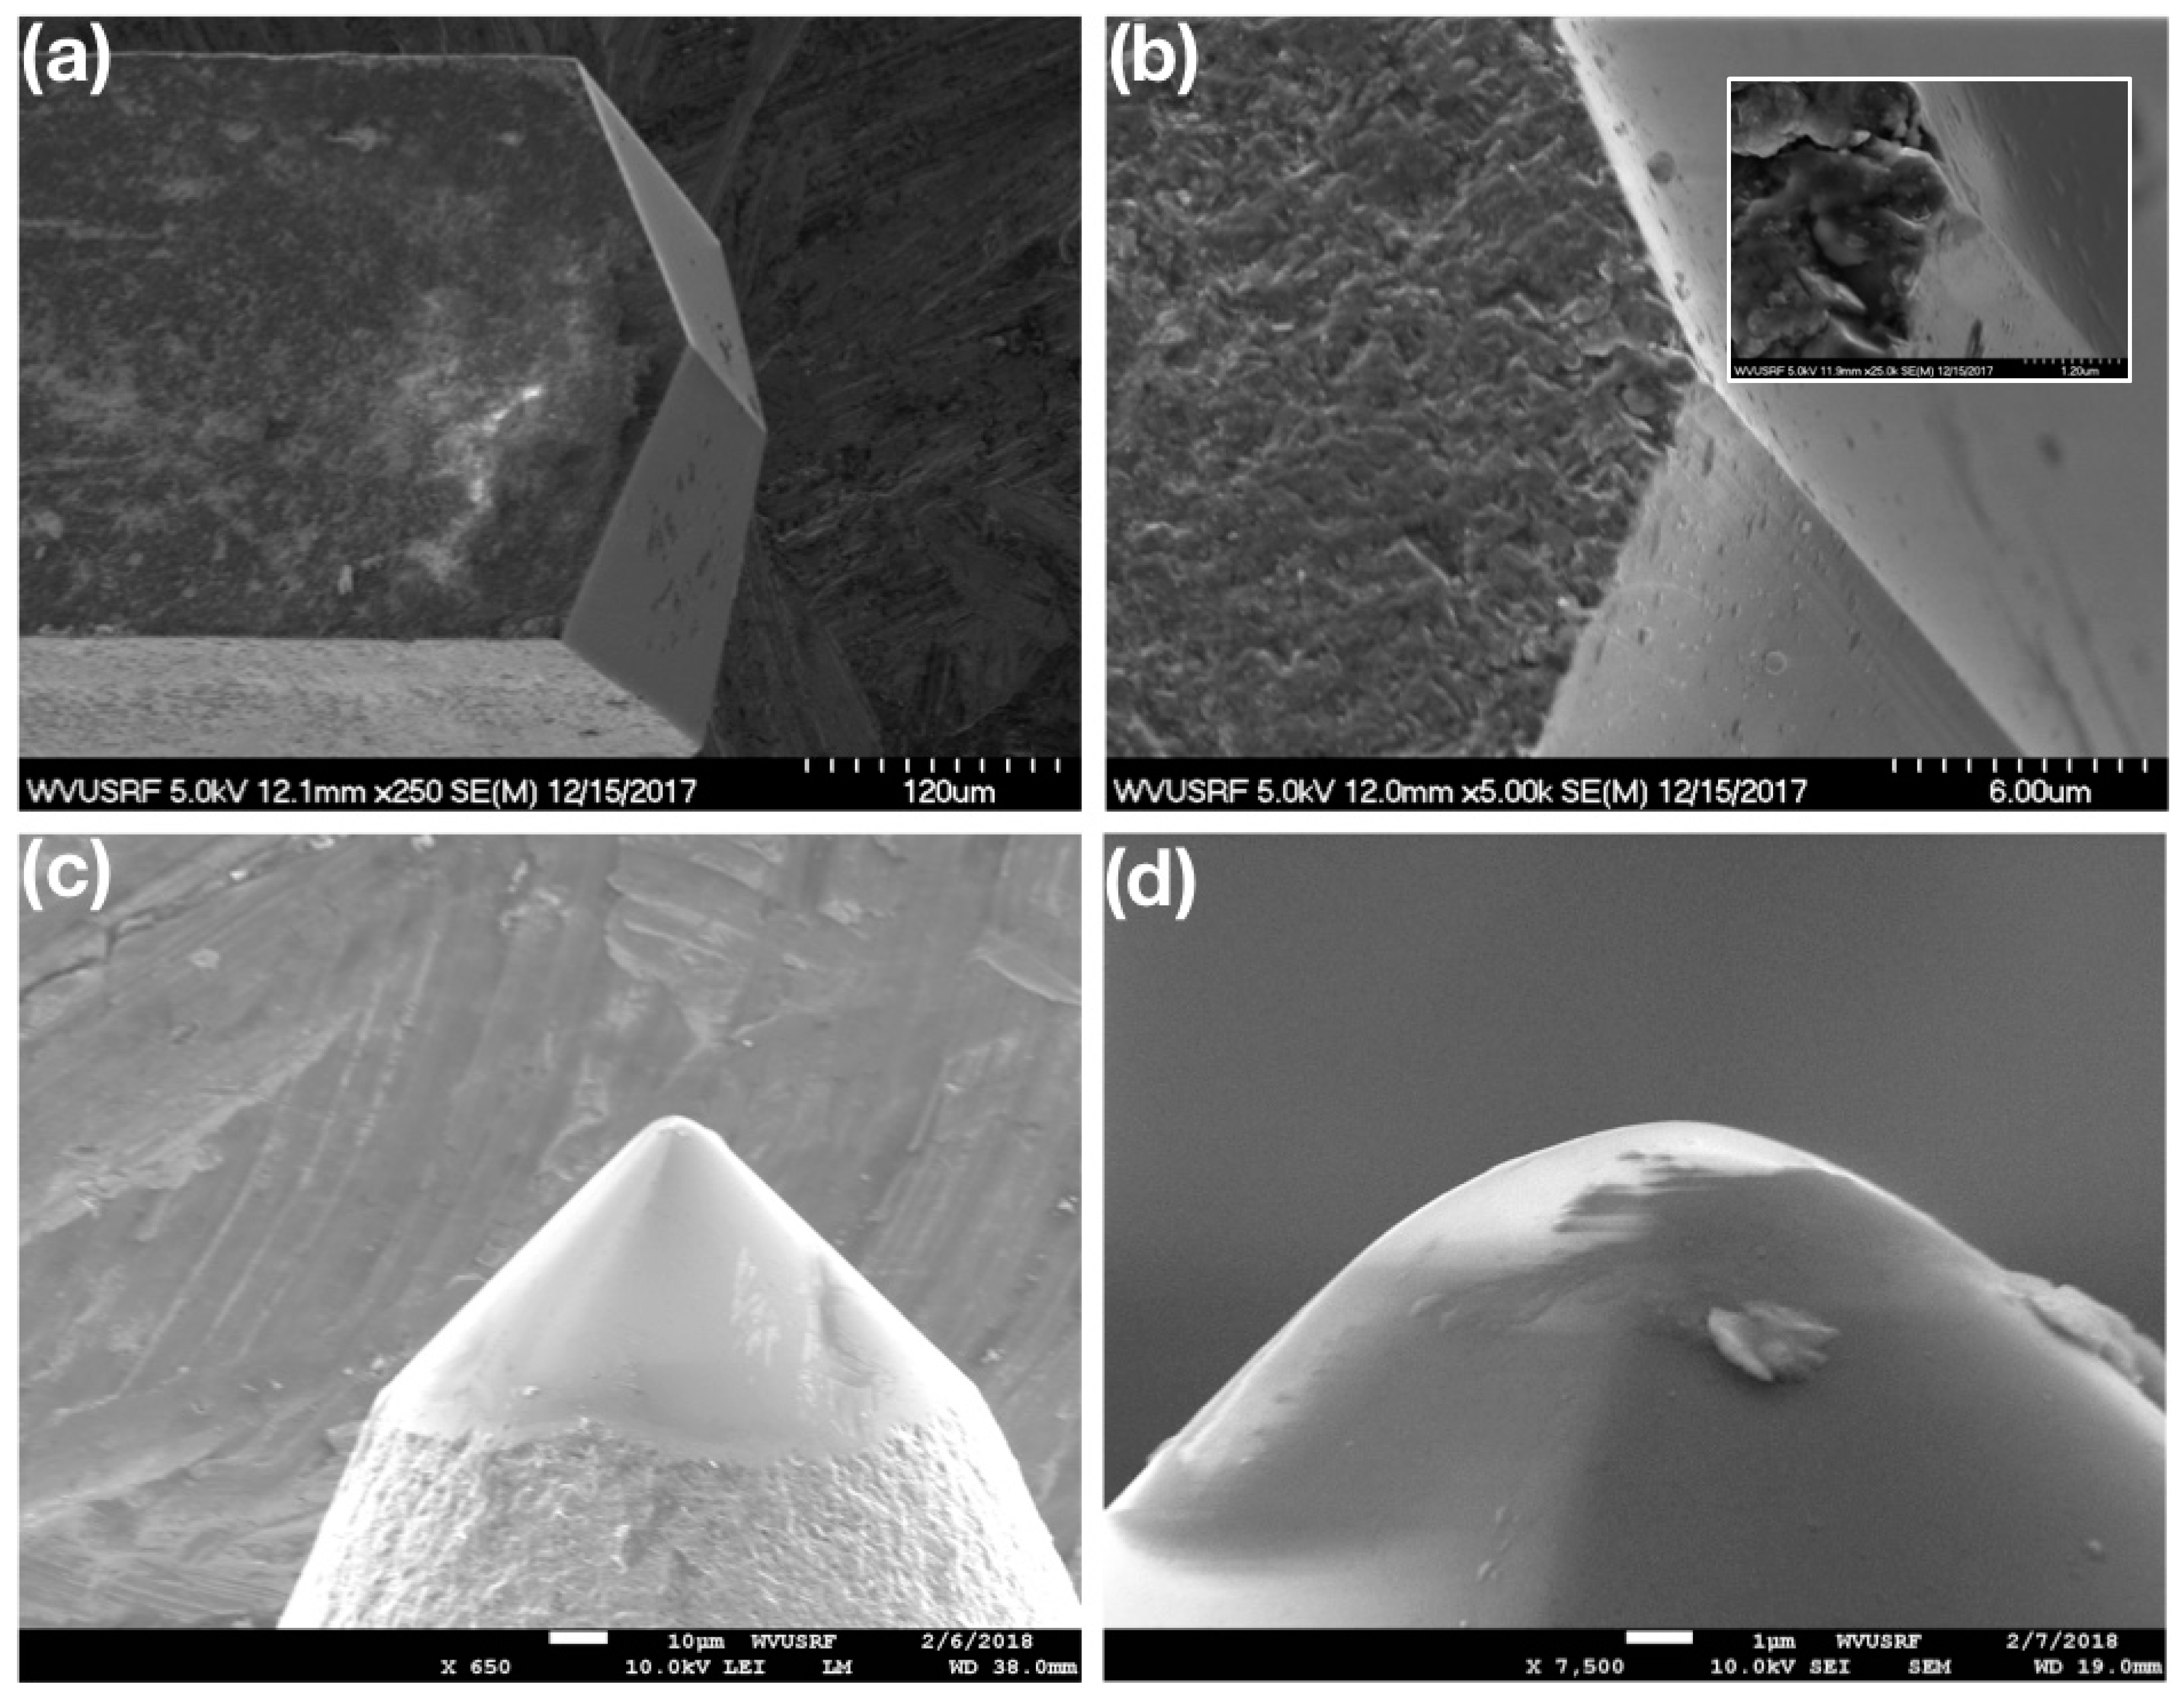
2. Materials and Methods
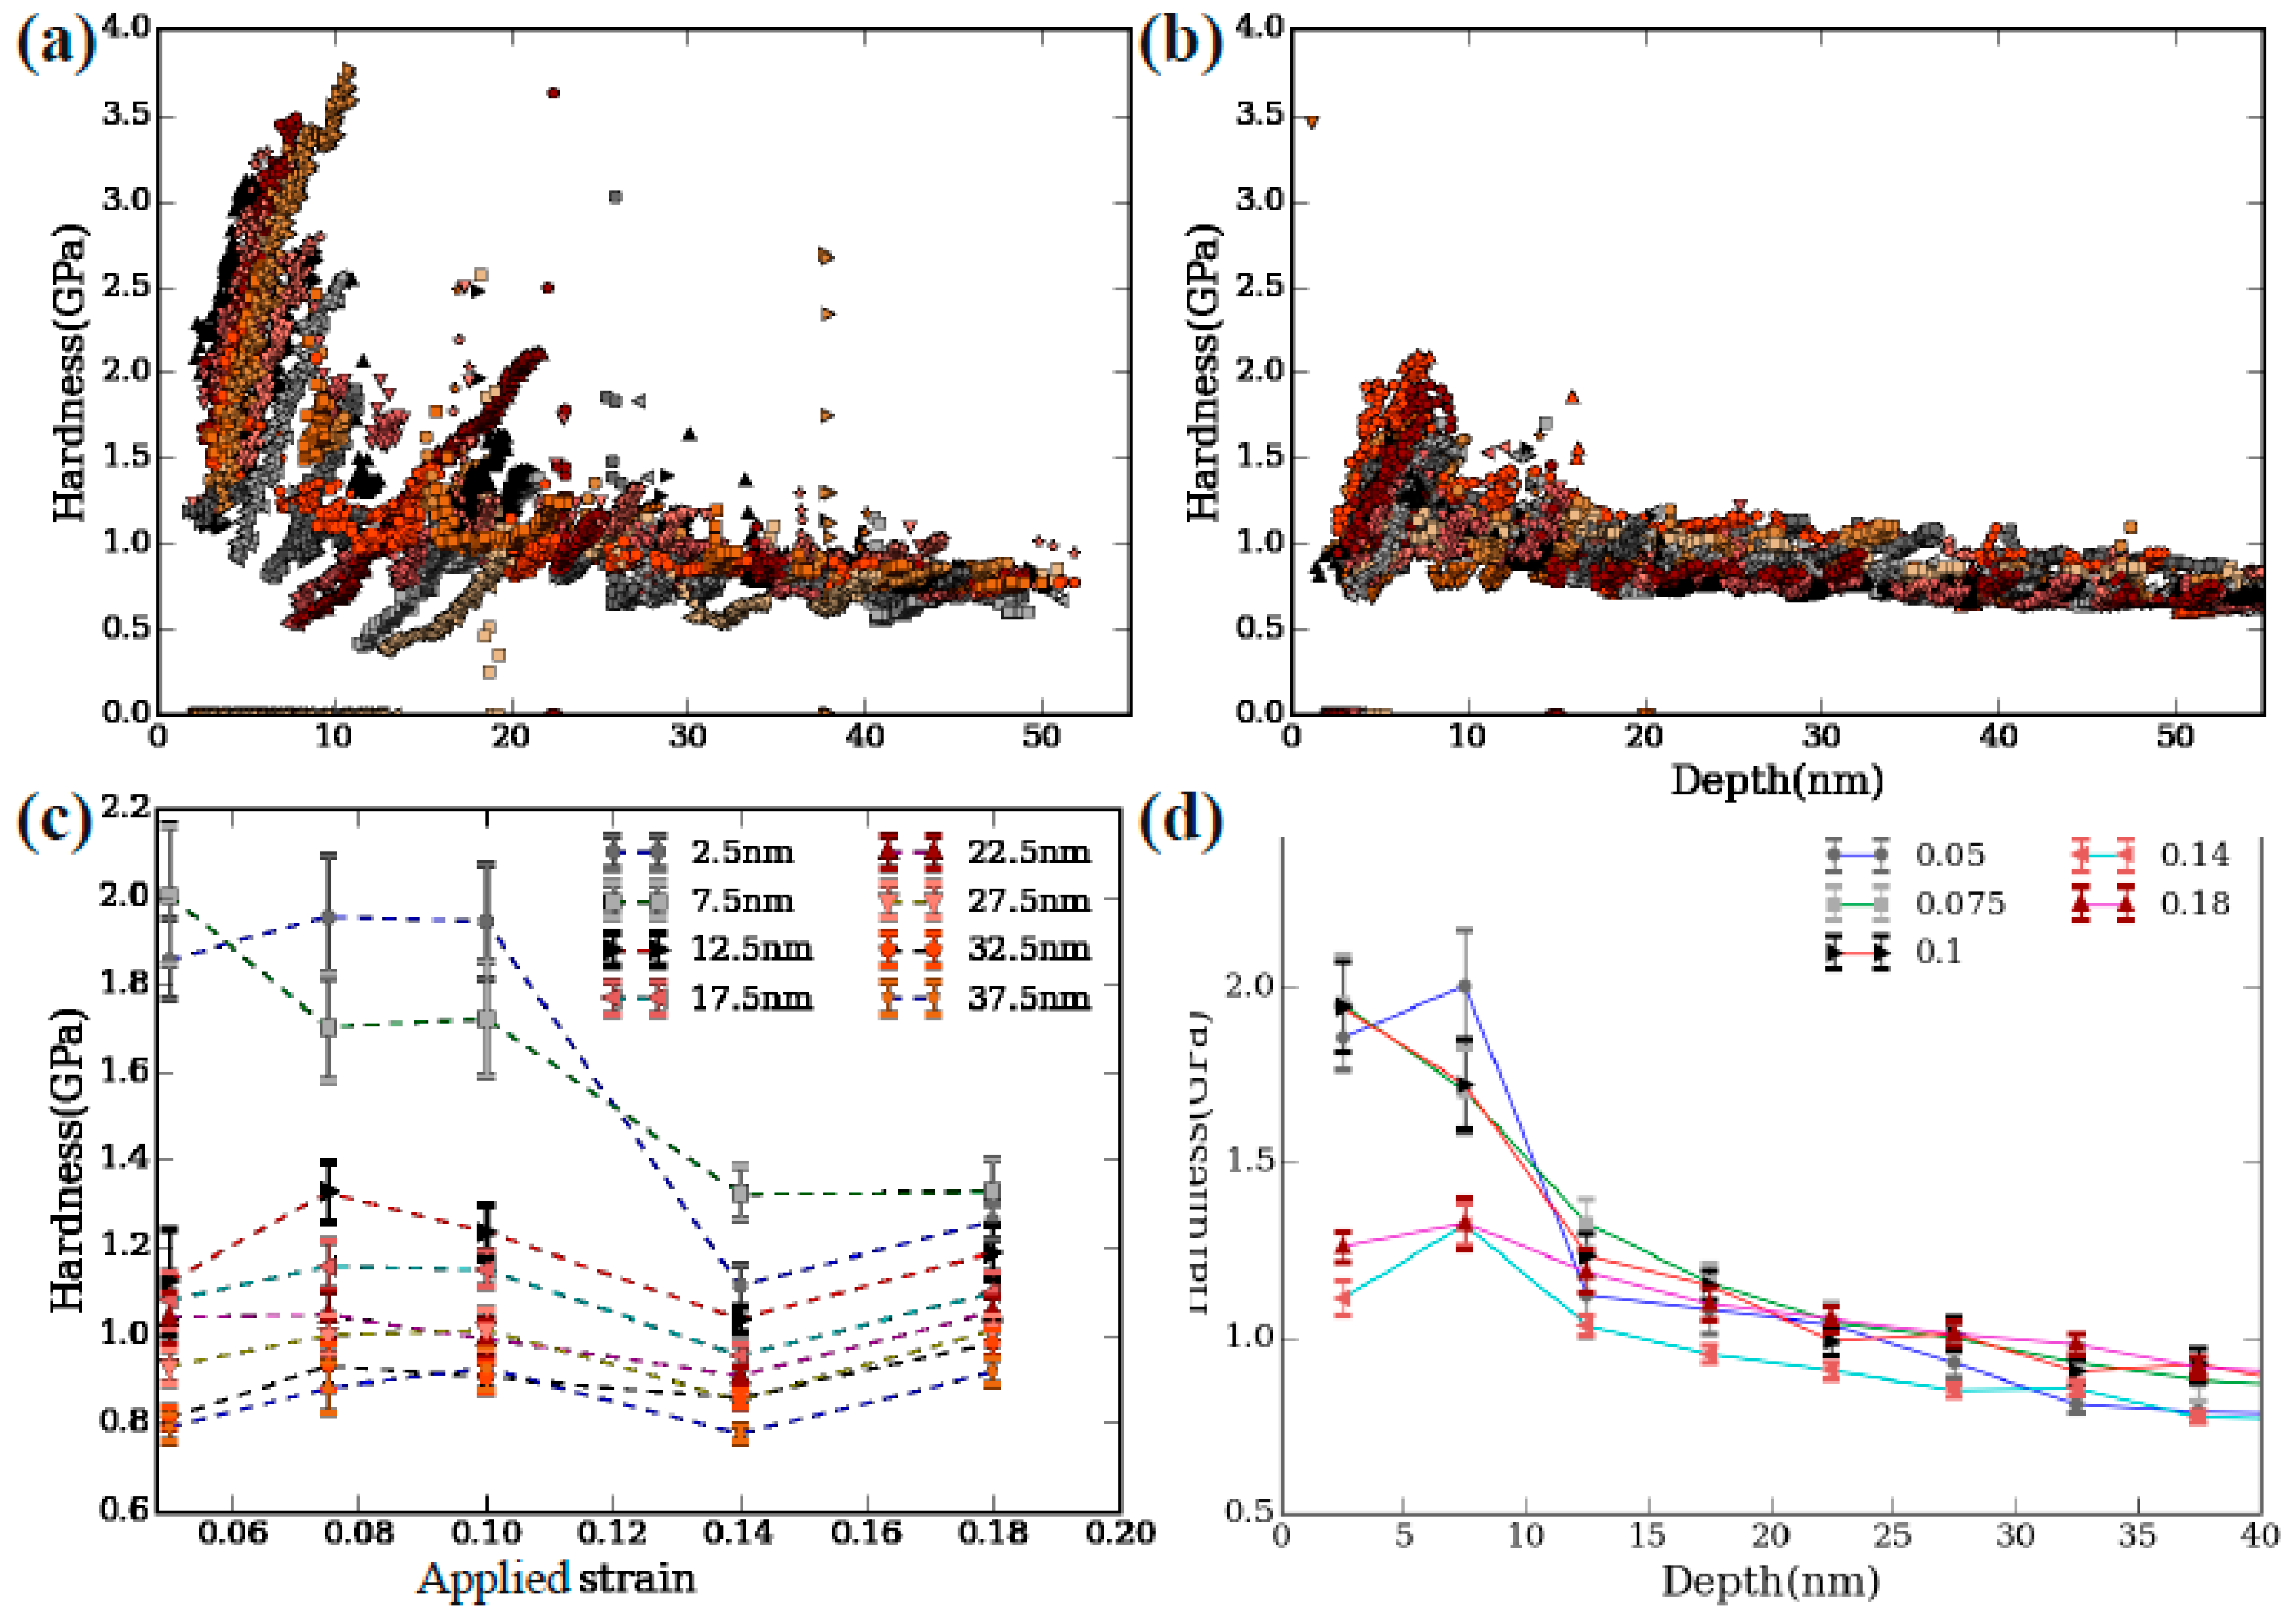
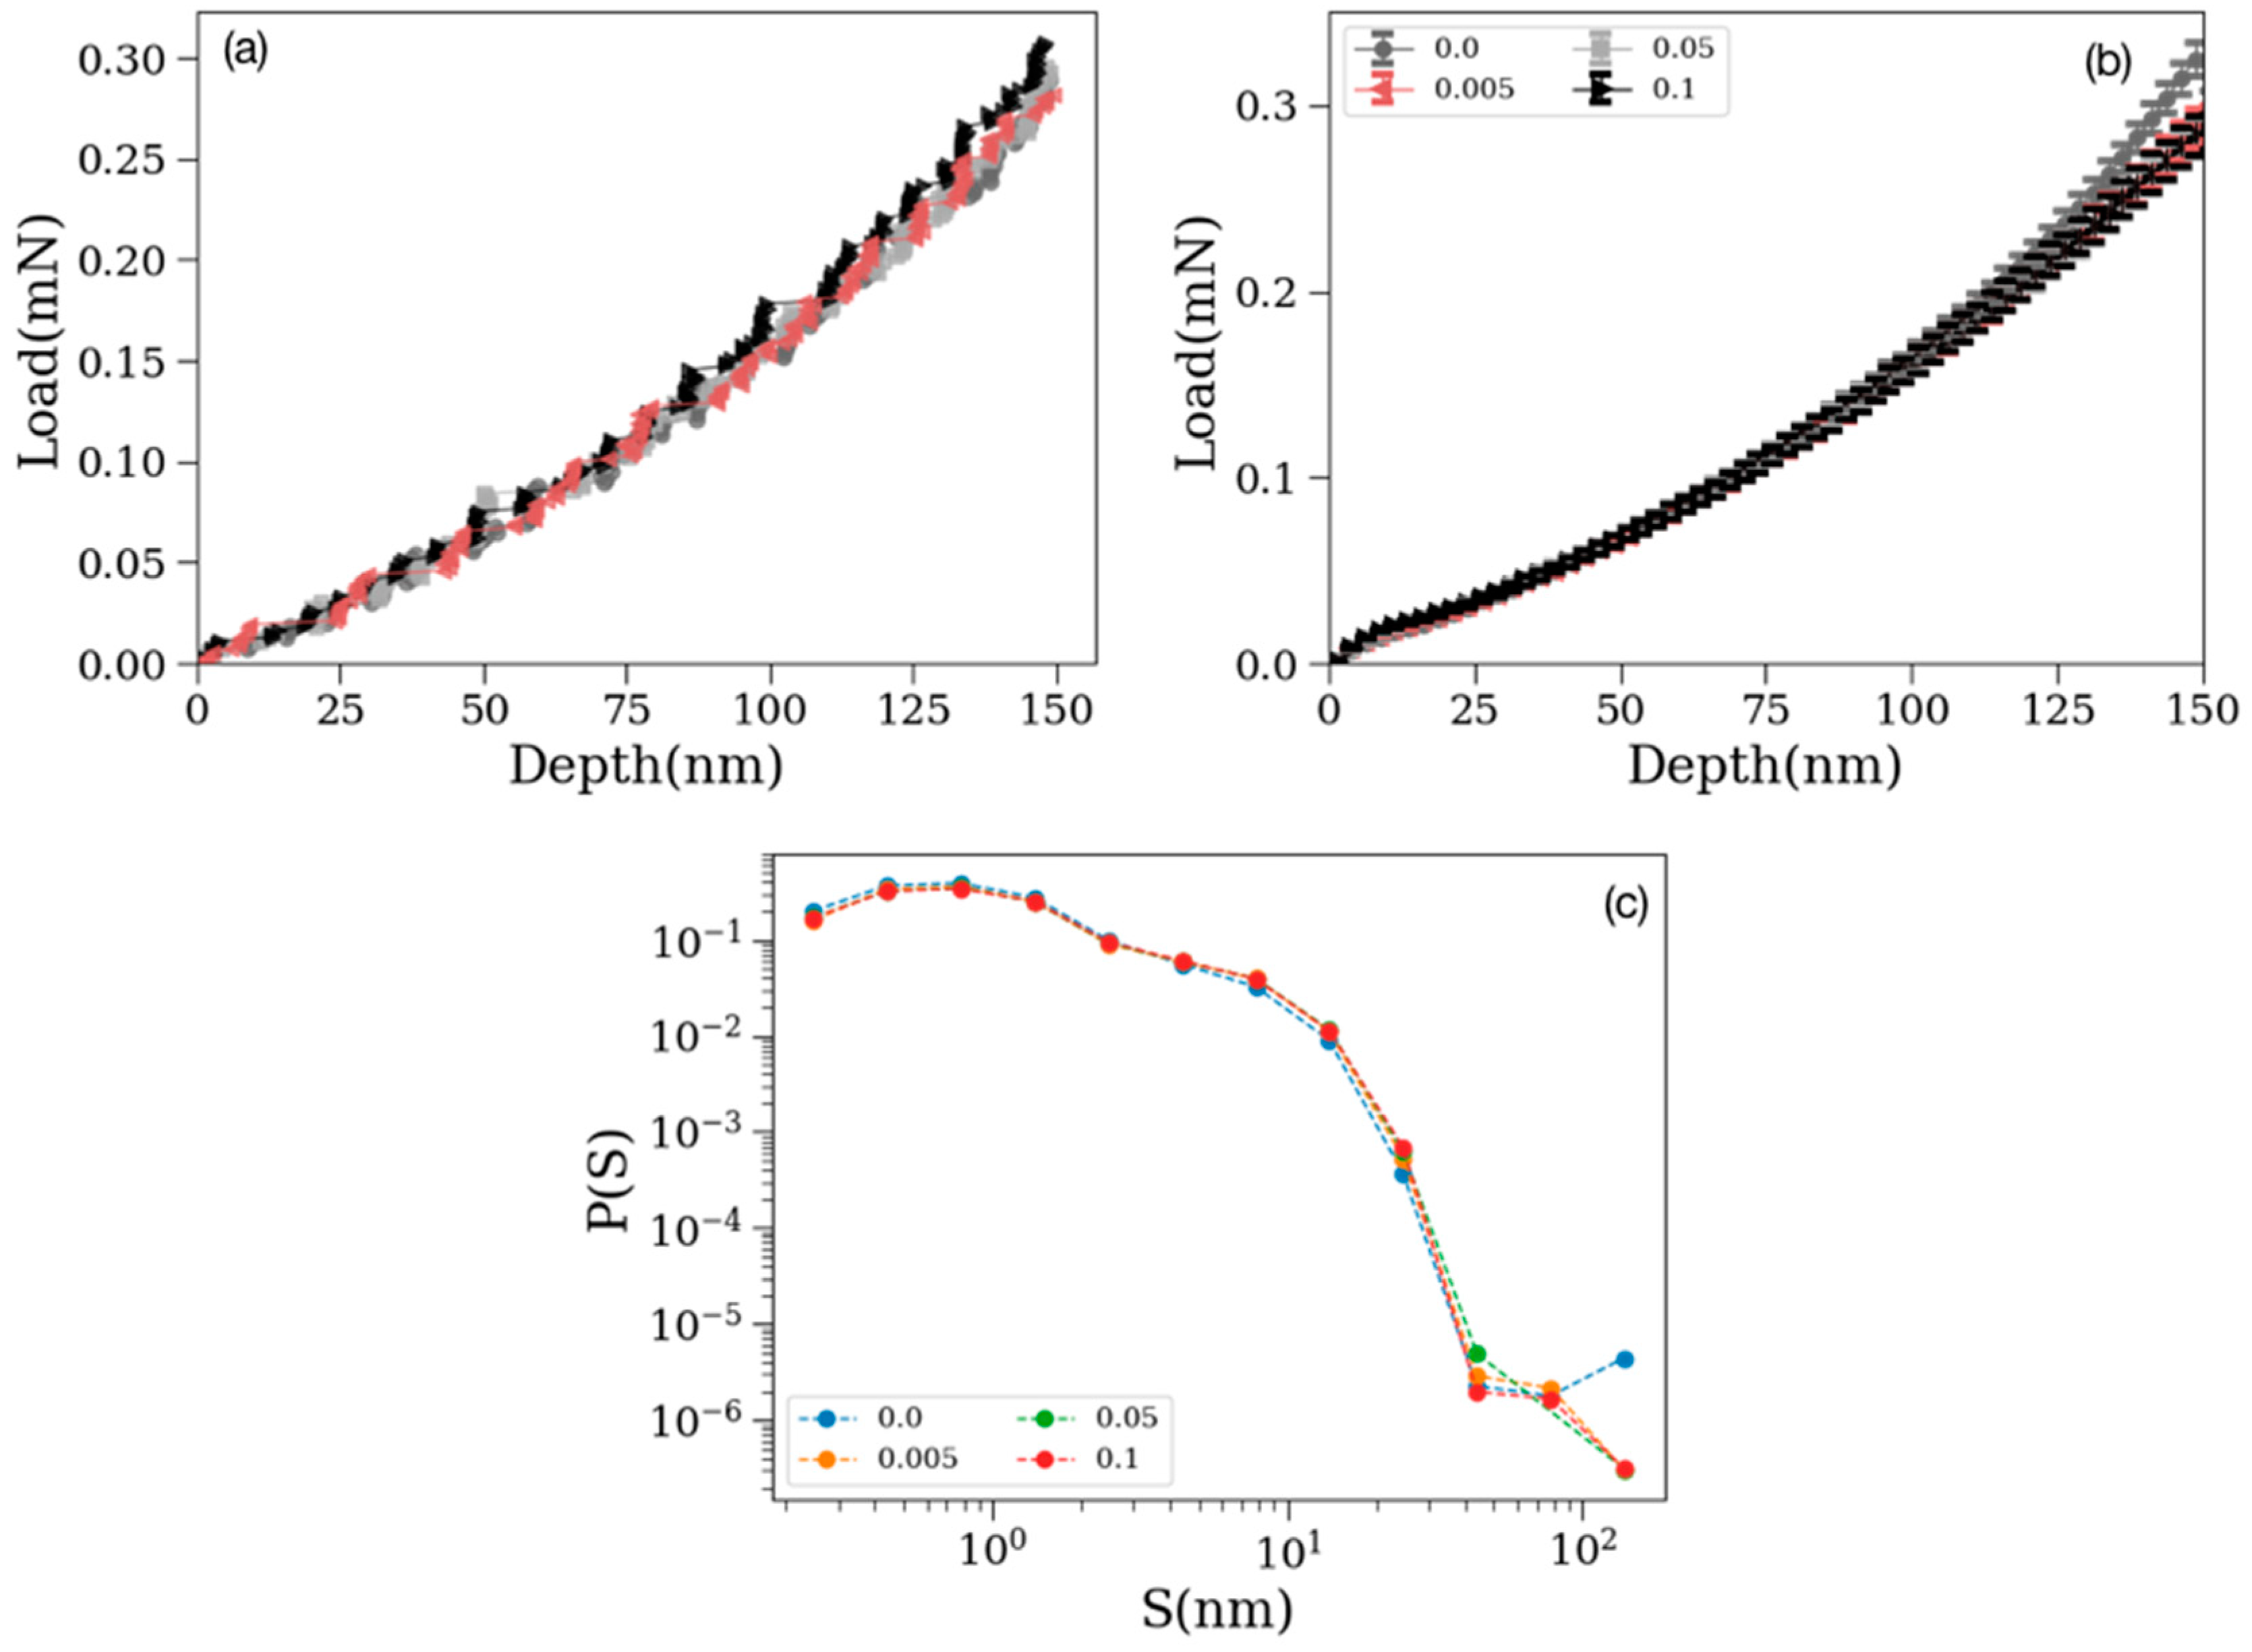
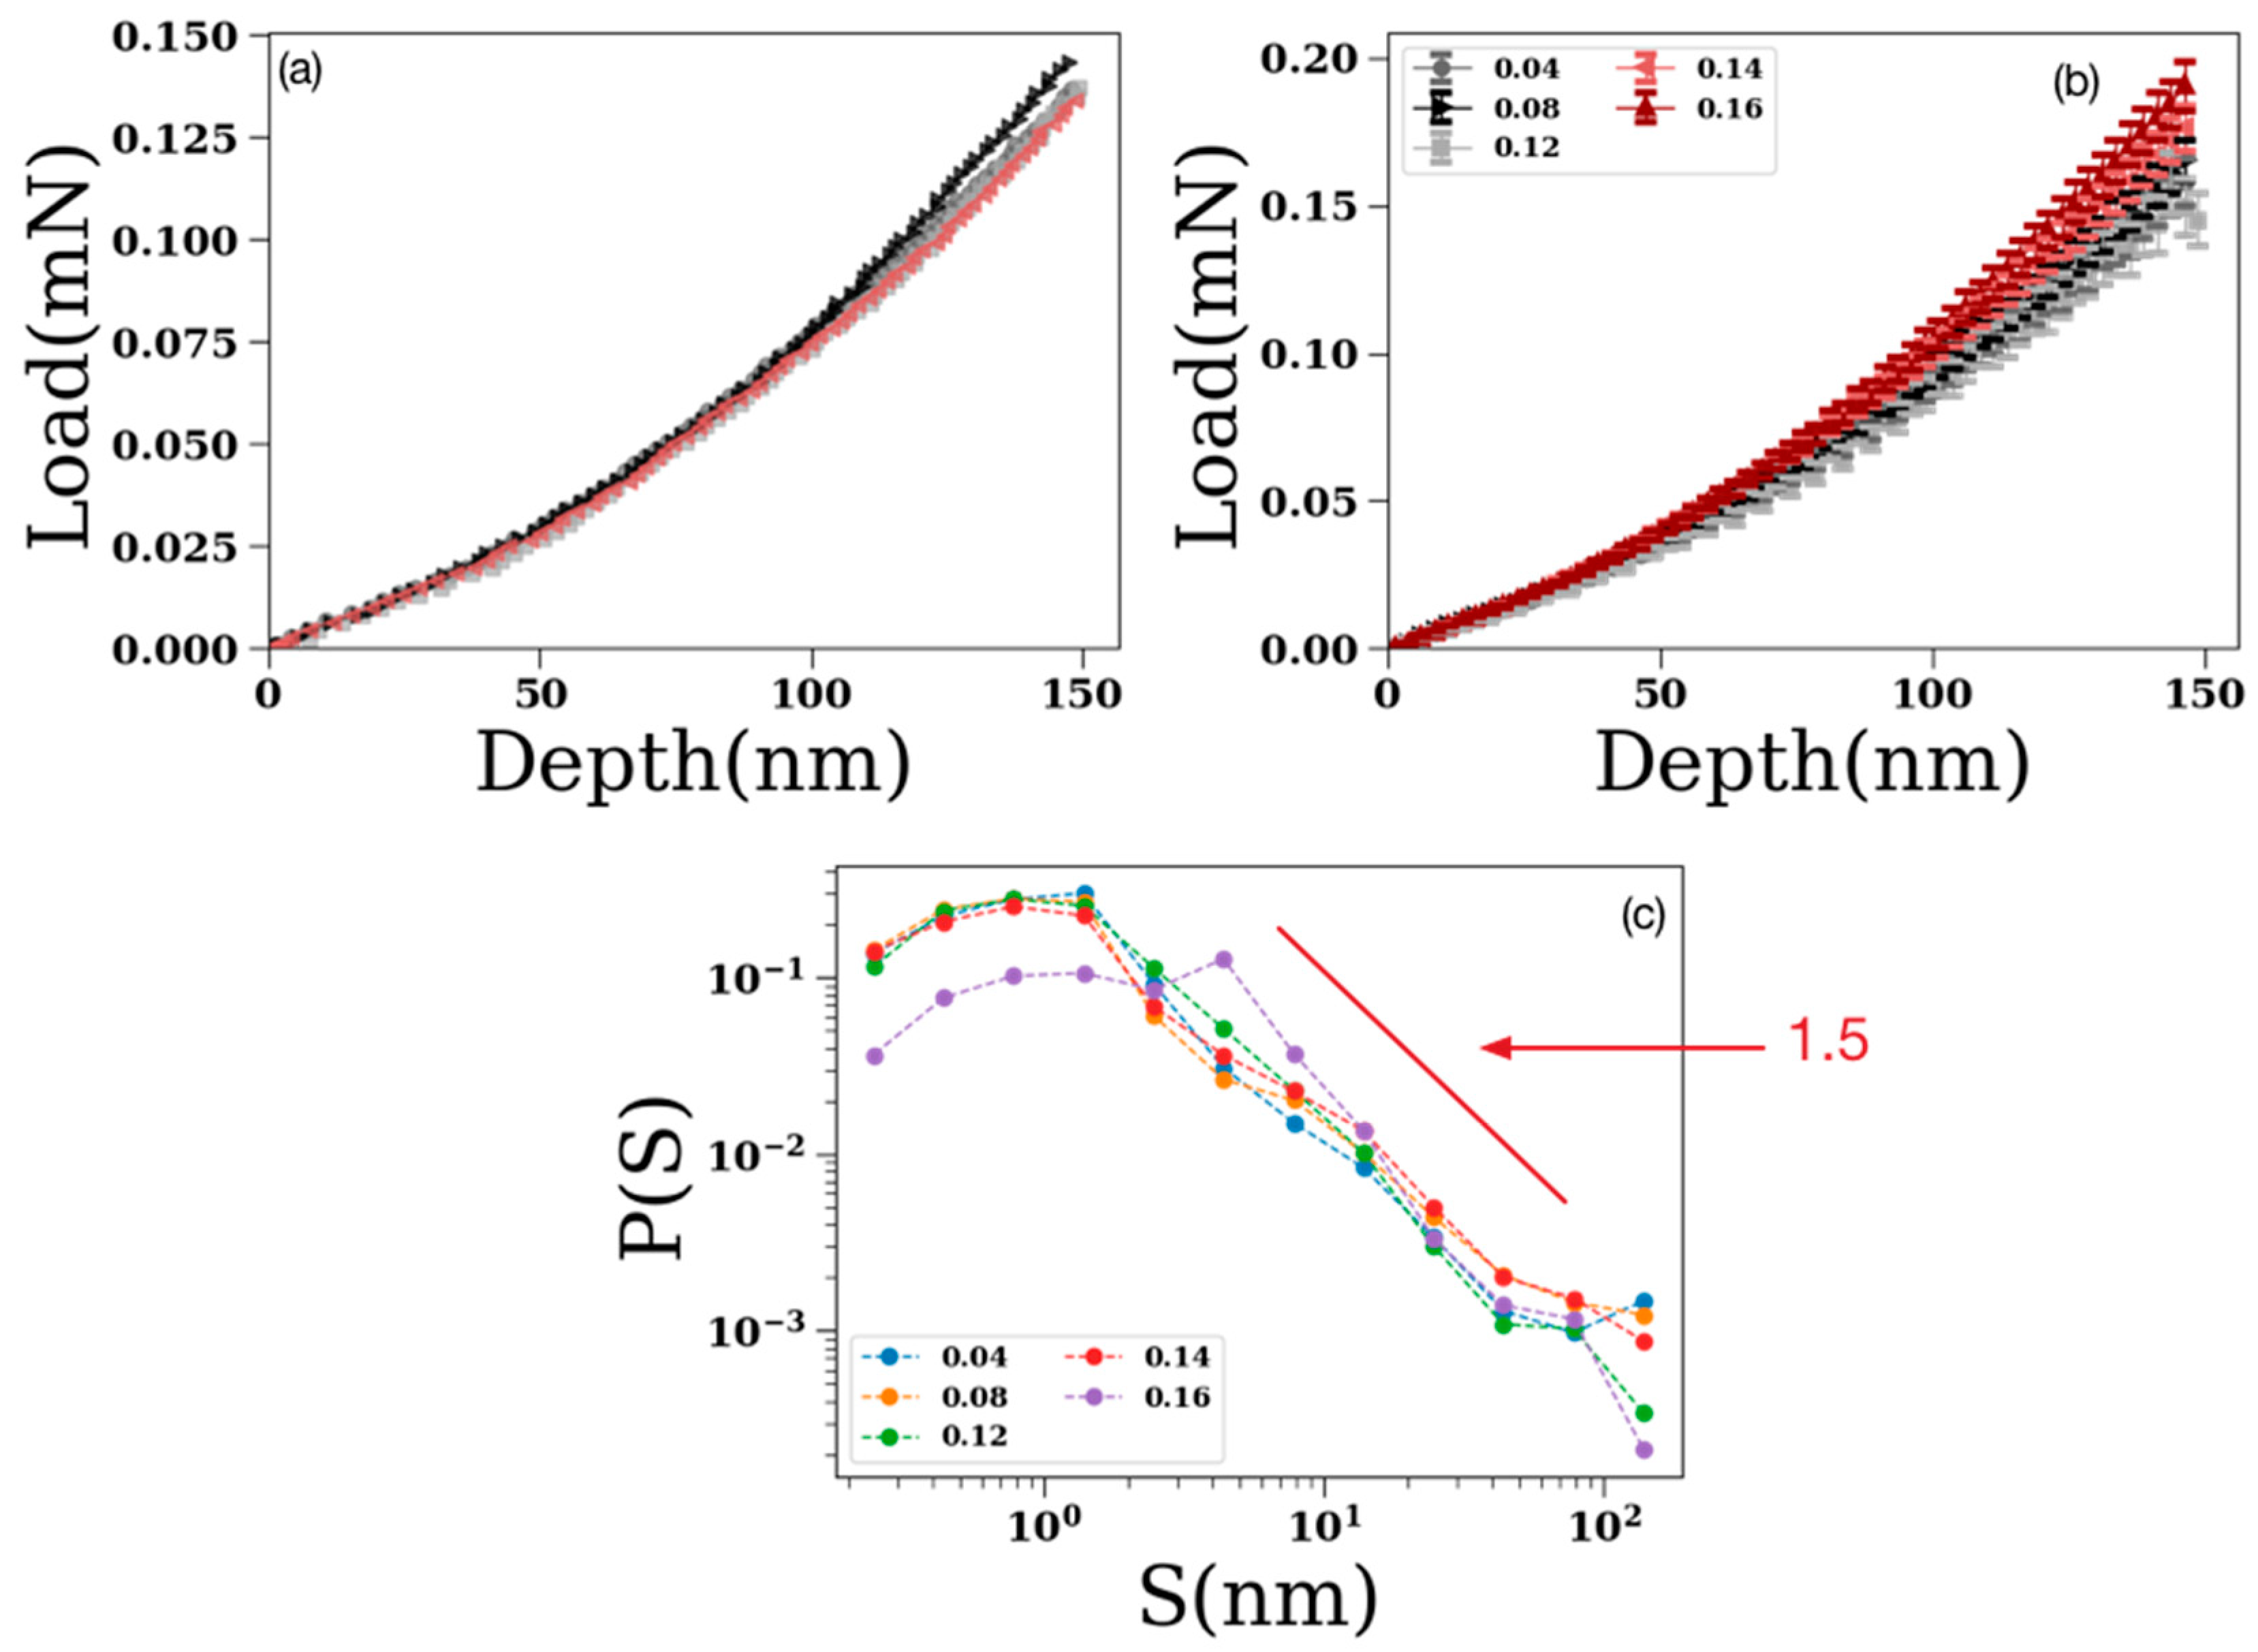
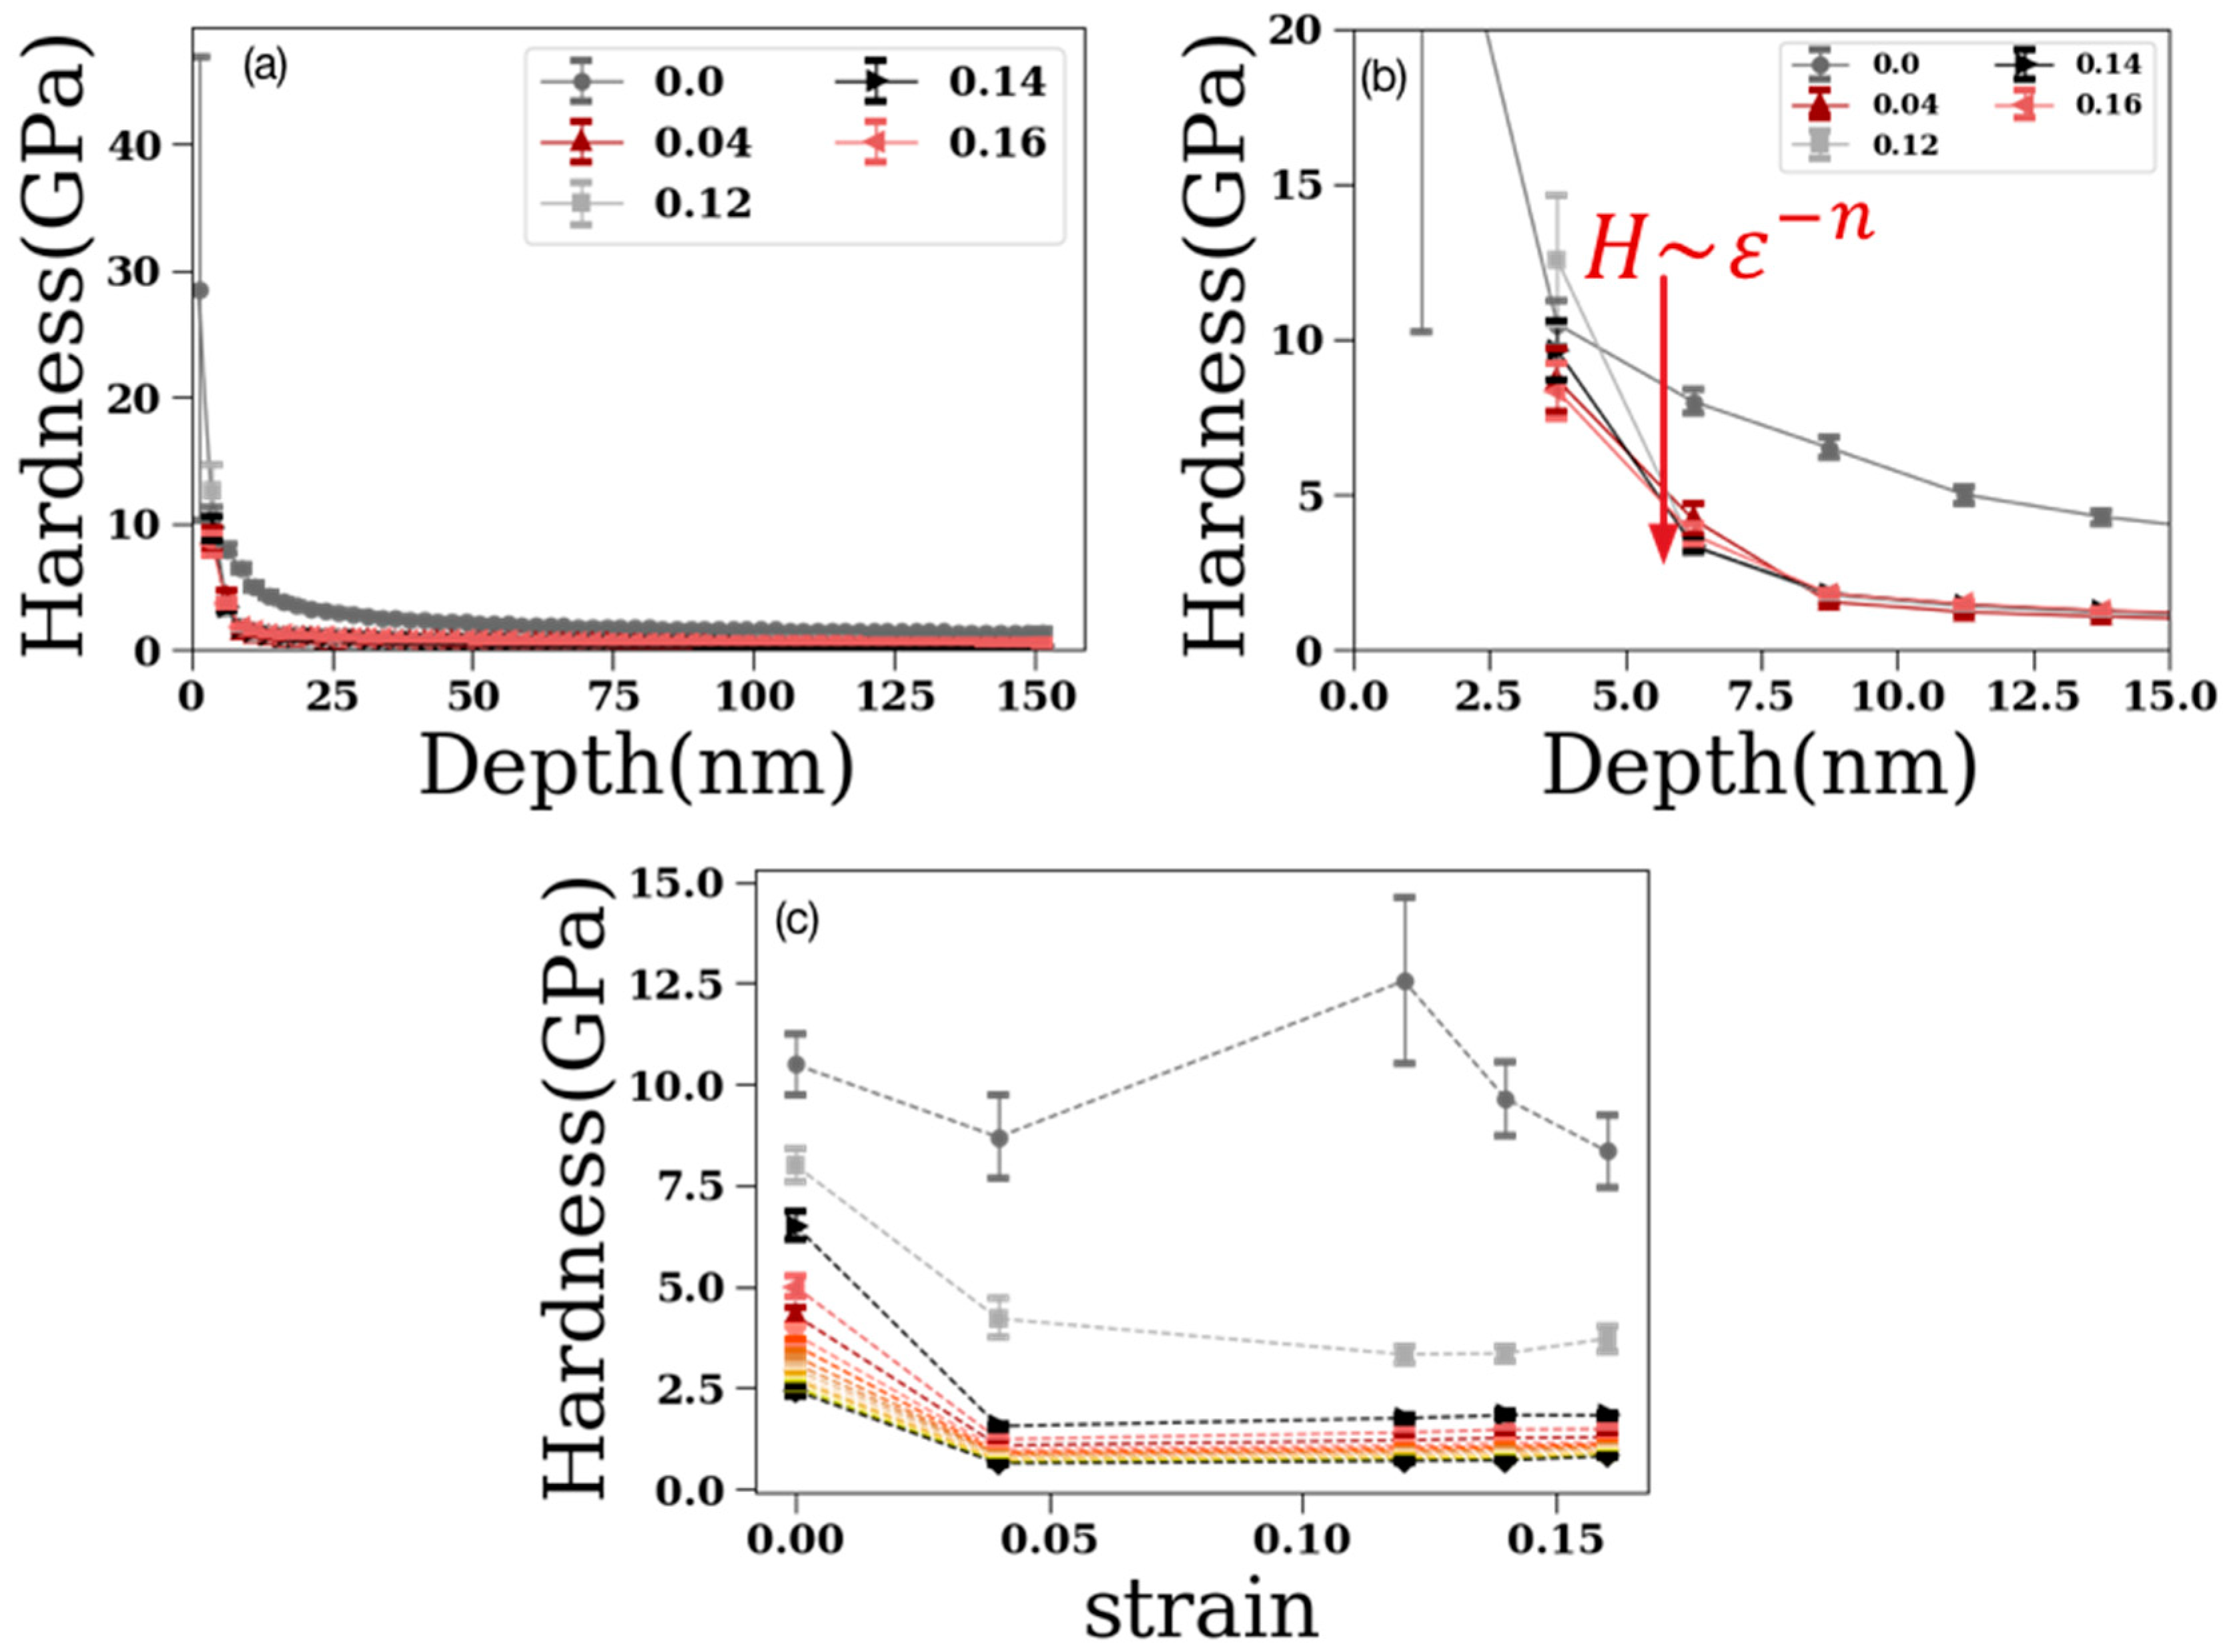
Multiple electropolished commercial aluminum polycrystals (99.99% purity, Plasma Materials Inc., US) and commercial aluminum and copper single crystals at orientation (100) (99.99% purity, MTI Corporation, US), of dimensions 2 mm × 5 mm × 10 mm, were used in this study. No thermal annealing or other processing was performed on the samples, so that dislocation density variability is averaged in the statistical sampling throughout the study (see examples of apparent dislocation density variability in Table 1, Table 2 and Table 3). Samples were originally tested for their elastic moduli and compressive strength (see Table 3). Custom-made 4-point loading fixtures (see Figure 1 and Figure 2) were designed to apply in-plane tension at the sample’s top central region during nanoindentation, controlling the local strain at the top central surface area through a screw element at the bottom of the fixture. The strain was measured in situ by using commercial strain gauges (see Figure 1c and Table 1 and Table 2). Data presented in this work have been produced through the device in Figure 1a,c and Figure 2c–f, but the consistency of the results has been demonstrated using the larger samples and devices (see Supplementary Materials (SM)). It is also important to note that the strain measured by the strain gage cannot directly correspond to the strain of a uniaxially loaded sample (Table 3) due to the bending deformation and material inhomogeneities.
High-throughput nanoindentations were performed in the center (1 mm)2 surface areas of the samples, with typical distances between nanoindentation sites being 10 μm in each direction. Given that nanoindentation depths did not exceed 250 nm, the distance between nanoindentation sites may be regarded as independent [24,27]. For the estimation of the applied tension at the nanoindentation sites, independently measured elastic moduli and yield stresses were exported into finite element simulations, performed using ABAQUS software [43] (see an example in Figure 1b and also in the Supplementary Materials (SM)). Through systematic calculations and testing, tables for strain/stress/plastic-strain mapping were developed for each material (see Table 1 and Table 2 for a particular example of polycrystalline, as well as single-crystalline aluminum). The applied strain on the samples extended, in small steps, up to 0.5%, well into the crystal plasticity regime. Clear surface steps (primarily due to dislocation plasticity) formed after 0.2% strain in all materials tested (example seen in Figure 1d for a single crystal copper sample), naturally influencing the indentation results at small depths. For this reason, our main results are focused on small loads/strains (<0.2%), which should not be influenced by such steps, and more details on these issues are discussed in the Supplementary Materials (SM).
Nanoindentation experiments were performed with an iNano (Nanomechanics Inc., TN) nanoindenter with Berkovich (apex roundness of 20 nm) and spherical (5 μm) tips (see Figure 3), acquired by Microstar Inc. This work focuses on Berkovich indentations, with spherical indentations used for verification and validation purposes, since we believe that this work’s main findings are independent of the tip-shape. The details of the materials preparation, bending fixture and nanoindentation protocols are discussed in the Supplementary Materials (SM) (see also Figure 2). Standard CSM parameters were used for CSM hardness measurements using the Berkovich tip (100 Hz frequency, drift rate error of 0.2 nm/s).

3. Results

In the following, we present our main results on the correlation between hardness and secondary pop-in bursts in FCC polycrystalline pure aluminum, single-crystalline pure aluminum and single crystalline pure copper. Our data is also supported by the Supplementary Materials (SM), which provides additional details. In each of the cases, we focused on two main observables: i) the raw force-depth curves and ii) the Continuous Stiffness Method (CSM)-estimated hardness [24,27]. Both observables were analyzed in statistical terms by defining histograms of hardness or large fluctuations in depth, as the applied tension is modified. For the pop-in event probability distributions, the pop-in noise event size is defined so that S = i   for   δ h > h thr δ h i , to analyze the displacement bursts in a quantitative manner, using the threshold h thr being equal to the machine noise threshold h thr = 0.2 n m , which was independently tested, given the laboratory’s environmental conditions.
Polycrystalline Al: In order to investigate the influence of the applied in-plane stresses on the load–displacement curves, we carried out indentation tests across a large surface area of 1 × 1 mm2 in the centerline of three polycrystalline specimens (for each sample, ∼5000 indentations at each stress level given in Table 1). Samples were electropolished before being loaded and indented.
In all cases, load–displacement curves show a continuous elastic response followed by multiple measurable displacement bursts (see Figure 4b). These bursts are at depths large compared to the expected oxide film in aluminum, and therefore may statistically attributed to the mechanical response of polycrystalline aluminum. This intrinsic material noise is attributed to both surface roughness and stochasticity of crystalline plastic deformation. In Figure 4c, S is the magnitude of a single displacement burst, while P(S) is the probability density. The event distributions display a remarkable stability into a form that resembles P(S) = A*S−1.6 exp(−S/S0), where A is a normalization constant and S0 defines the cutoff of the distribution (here, ~12 nm in all applied tensions). Interestingly, the applied tension appears to consistently suppress large events, however the robustness of the power-law response (P(S) ~ S−1.6) seems clear. It is worth noting that this power-law response is observed in other nanomechanical studies [6,7,44], and it is suspected to hold across nanomechanical responses in a material-independent and loading-independent, thus universal, manner [40,45,46,47].
The current study represents the first evidence of this kind in nanoindentation of FCC crystals. Following Reference [46] and in the effort to corroborate the evidence of Figure 4c, we also investigated the behavior of the local event "intensity", defined as the recorded rate of depth changes dh/dt. In Figure 4d, the probability distribution of the local event intensity P(V) is presented as obtained data from depth vs. time (h-t) curves. The observed behavior is reminiscent of typical avalanche dynamics in various mean-field models [46] and appears independent of the applied tension.
A distinct dimension in the investigation of nanoindentation is provided by the behavior of hardness. While not an exact measurement, the CSM method [24] provides a concrete continuous measure of hardness that is expected to be consistent in relative terms, especially for the same material class and sample. Figure 5a–d show the variation of hardness as a function of indentation depth at different in-plane stresses, for a large multitude of indented locations and five different samples. Hardness displays a strong size effect dependence on depth for all in-situ tension levels. These size effects are well known from various prior studies of Berkovich indentation on FCC metals ([27,29,31] and references therein). Hardness values first increase with increasing indentation depth until it reaches a peak (approximately 2 GPa for zero applied in-plane stress and zero strain, see Figure 4c,d) and then decreases towards a plateau at approximately 1 GPa consistent with prior studies [25,26,27,28,36,37]. However, we notice an additional, overall, unseen before, effect of in situ tension on hardness, which becomes clear when Figure 5a (low tension) is contrasted to Figure 5b (high tension). Despite natural data variability due to extrinsic (roughness) and intrinsic (dislocation bursts) reasons, there is a strikingly strong correlation between the depth-dependent hardness and the applied in-plane stress. At up to 43.21 MPa in-plane stresses, the hardness shifts towards lower values. As it can be seen in Figure 5b–d, the hardness below depths of 10 nm shows a clear dependence on the applied in-plane stress (strain), while for larger depths such dependence disappears.
Single-Crystalline Al: Samples at orientation (100) of ultra-high purity were mechanically polished to nanometer scale as purchased from the manufacturer. Analogously to the case of polycrystalline Al, Figure 6a–c show force–displacement curves and the statistics of pop-in events, for different applied tension levels. Figure 6a displays the actual response of four individual indentation sites, demonstrating the existence of non-trivial displacement jumps that extend to 10 nm, even at depths of 100 nm. If these curves are averaged across indentation sites, then the average dependence on the applied tension can be distinguished at very low depths (<20 nm) as well as large depths (>125 nm). Nevertheless, the histograms of displacement bursts through all indentation sites at a given stress level display a wide distribution that has a marked independence on the applied tension. While the power-law behavior appears similar to the one observed in polycrystalline Al, the behavior resembles P(S) = A*S−1.3 exp(−(S/S0)1.5). These differences may signify distinct micromechanical mechanisms, as expected [46,47].
The behavior of the CSM hardness for single crystalline Al is quite consistent with the polycrystalline case. As seen in Figure 7a, the sample-averaged hardness shows that the applied tension drastically decreases the small-depth hardness by a factor of 30. As shown in Figure 7b, the decrease of the hardness at depths less than 15 nm is proportional to the applied strain at a high negative power n < −3. Figure 3d shows the sample-average hardness at various depths as function of applied tensile strain, showing both the saturation at larger strains and the drastic decrease as soon as tension is applied (see Supplementary Materials (SM) for details). As shown in a recent theoretical work [48], the identified 10 nm-depth dependence of the CSM hardness on in-plane tension cannot be detected in a simple experimental way (by using AFM, for example on 1–2 samples). As shown in Reference [48] through discrete dislocation simulations, a large ensemble of images is required in order for the averaging process to demonstrate this dislocation-density-induced and tip-shape-independent statistical effect, and this effect persists in a consistent manner with the behavior of the stiffness [48].
Single-Crystalline Cu: Samples at orientation (100), of ultra-high purity, were mechanically polished to nanometer scale as purchased from manufacturer. Analogously to the other materials tested, results display a universal set of displacement bursts at small depths in conjunction to a strong sensitivity of the CSM hardness on in situ applied tension. Figure 8a shows sample responses at individual indentation sites. Displacement bursts are clear but evidently smaller than in aluminum.
The sample-averaged force–displacement curves in Figure 8b show a clear dependence on the applied tension at all tested depths. In Figure 6c, the histogram of displacement bursts show the existence of a clear power-law behavior that resembles the one found for polycrystalline aluminum following the form P(S) = A*S−1.6 exp(−S/S0).
The behavior of the CSM hardness for single crystalline Cu is quite consistent with the polycrystalline case. As seen in Figure 9a, the sample-averaged hardness shows that the applied tension drastically decreases the small-depth hardness by a factor of 30. As shown in Figure 9b, the decrease of the hardness at depths less than 15 nm is proportional to the applied strain at a high negative power n < −2. Figure 9c shows the sample-average hardness at various depths as function of applied tensile strain, showing again, both the saturation at larger strains and the drastic decrease as soon as tension is applied.
We conclude by clarifying that the origin of the hardness dependence on applied tension at ultranano indentation depths may not be related to simple mechanical origins, such as four-point-bending contact displacements [11,19]. Not only the 4pt bending contacts are at very large distances from the indentation region (~5 mm), and the nanoindentation depths are impressively small (~10 nm), the data is also consistent with analogous findings in much larger four-point-bending fixtures (see Figure 2a,b), with much larger tested samples (see additional discussion and figures in Supplementary Materials (SM) and Reference [49]). Thus, we conclude that the effect’s origin is intrinsic to the nanomechanics underneath the metallic material surface. This effect is a novel dislocation-density controlled effect and displays relative independence from the nanoindentation tip shape and effective radius [48]. Thus, this effect is controlled by the mean dislocation spacing [48], which also effectively controls the nanoindentation depth at which tip-shape-related size effects [13] become visible [48,50]. The mean dislocation spacing displays strong dependence on prior processing, and thus on the pre-existing dislocation density, even in single crystalline metals [48,50].

4. Discussion

The variation of depth-dependent hardness at the ultranano regime has remained a challenging concept. Early studies [25,26,32,51] used the strain gradient plasticity approaches using geometrically necessary dislocations concepts. However, further experimental investigations were not convincing enough to support the overall conclusions, particularly at nanometer-scale depths [37]. Specifically, the Nix–Gao model overestimates the hardness values at very small depths [51]. Poole et al. suggested that the overestimation is due to the strong repulsion of the geometrically necessary dislocations (GND) at shallow depths, causing an expansion of the effective volume of geometrically necessary dislocations [52,53]. In brief, the nanoscale plausible plasticity is governed by two main mechanisms, either dislocation nucleation at the surface or interactions, movement and nucleation of the pre-existing bulk (but close to the surface) dislocations. While the former case has been well known, the precise role of the latter effect is the focus of this work.
The exploration of such nanoscale phenomena using nanoindentation displays the major bottleneck of a very-hard-to-estimate contact area that prevents measures such as Vickers hardness to be well defined. The CSM method provides significant improvement over traditional methods for hardness, but there are still major experimental and fundamentally physical issues with the definition of contact areas in the ultranano regime below 50 nm in common metals [54], such as the ones studied in this work. While it is clear that contact areas in nm-level depths can be well defined only in simulations, the CSM-estimated hardness provides a relative measure that can provide invaluable insights, especially in the statistical sense of large number of trials, if appropriate theoretical studies can provide precise interpretations. For this purpose, and in order to understand the effect of bulk dislocation interactions and nucleation, we decided to perform simulations in the absence of surface dislocation nucleation—in this way, the overall qualitative effect of bulk dislocation driving is explored and understood.
To explore possible physical phenomena that could lead to the observed hardness deviation, we have used two-dimensional discrete dislocation dynamics (2D DDD) simulations [48] (see also Supplementary Materials (SM)) to account for the effect of in-plane stress and indentation depth. We assumed that bulk dislocation sources are prevalent and also, indentation depths are small so that indentation is primarily dominated by close-to-surface but bulk dislocation nucleation and movement. In this way, we did not explicitly model surface dislocation nucleation. Details of the 2D DDD model can be found in the Supplementary Materials (SM) and in Reference [48]. The density of pre-existing dislocations was set at 3 × 10 12   m 2 . We noticed that for depths smaller than 10 nm, and holding the depth fixed, the increase of in-plane stress results in a sharp decrease of the indentation force. This result is consistent with the experimental findings reported in this work.
Furthermore, one may apply small-scale plasticity considerations using a local yield stress picture framework. Gerberich et al. [55] linked the indentation size effect in the nanometer scale to a ratio between the energy of newly created surface and plastic strain energy dissipation. The hardness in the nanometer scale then follows, H = ˜ σ f ( S V ) 2 / 3 1 ( 2 δ R ) 1 / 3 for spherical indentation (tip radius R) where S/V is the plastic surface area over volume ratio, δ is indentation depth. Based on the data of Au in table 2 of [55], S V δ decreases at small indentation depth. We define σ f as the local material flow stress, which is a function of the local dislocation density. In nanoindentation, the local flow stress should determine the measured hardness. The local flow stress is expected to [56] have a complex non-monotonic dependence on the local dislocation density at the nanoscale, in analogy with early theoretical suggestions as well as studies of metallic nanopillars [57]. Following Reference [57], we suggest that the local flow stress during indentation is a function of the local dislocation density: σ f β R ρ + α b ρ , where ϱ is the local dislocation density, R is the nanoindenter’s radius, b is the magnitude of the Burgers vector, and β, α are dimensionless fitting parameters which in our case take the values 1.76 × 10 3 and 0.46, respectively. For the indentation depth of 5 nm, our estimate of hardness vs. in-plane stress is shown in Figure 4b (dashed line), which qualitatively agrees with our simulation and experimental findings.
In the light of our nanoindentation experiments and their agreement with the simple DDD simulations [48], we propose an alternative explanation for hardness size effects at the ultranano regime [39]: for small indentation depths (below 10 nm for a Berkovich tip, but more generally below the overall depth at which pop-ins would be expected), the applied stress-induced dislocation motion statistically dominates the deformation, in the sense of ensemble-averaged behavior over many indentation locations. At that length scale, initial dislocation density controls the deformation behavior of the sample. This behavior is analogous to the source-limited regime found in pillar compression [44,45,57]. For indentation depths above 10 nm, the dislocation density saturates, and the system reaches the critical GND density threshold and is independent of the applied in-plane stress. As the indentation depth increases, the dislocation density is controlled by dislocation source nucleation, and the effect of dislocations generated by in-plane tension disappears at large indentation depth (>50 nm).

5. Conclusions

In summary, we employed large arrays of nanoindentation tests on polycrystalline and single crystalline pure FCC metals (Cu, Al) at different in-plane tensions to investigate the incipient plasticity transition and size effect dependences in a statistical, spatially self-averaging manner. The depth-dependent hardness measurements show a clear transition at ∼10 nm, as the applied in-plane stress increased to ∼50 MPa and the estimated in-plain strain rose to 0.3%. That is indicative of the high stochastic behavior as small indentation depths disappeared at high in-plane stresses, while pop-in statistics indicate that displacement bursts are insensitive to in-plane tension. The experiments are comparable to insightful 2D–DDD simulations [48] (see also Supplementary Materials (SM)) and a plausible constitutive dislocation density model. The identified effect appears independent from the tip shape (spherical from Berkovich) but displays strong dependence on the material’s pre-existing dislocation density. Nevertheless, it shall be noted that further verification of the identified effects is required, since it is plausible that the stochastic variation of the experimental results may contain significant contributions related to individual sample inhomogeneity and sample preparation details.

Supplementary Materials

More details on the experimental procedures and analysis methods are available online at https://www.mdpi.com/2073-4352/9/12/652/s1.

Author Contributions

Conceptualization, S.P., K.J.H. and H.S.; methodology, H.Y., R.B., S.P.; software, S.P., H.S.; validation, S.P., H.Y., K.J.H. and R.B; formal analysis, R.B., S.P., H.S.; investigation, H.Y., R.B., S.P., H.S.; resources, S.P., K.J.H.; data curation, H.Y., R.B., K.J.H.; writing—original draft preparation, S.P., H.Y.; writing—review and editing, S.P., K.J.H., H.S.; visualization, S.P., R.B., H.S.; supervision, S.P., K.J.H.; project administration, S.P., K.J.H.; funding acquisition, S.P., K.J.H.

Funding

This research was funded by the U.S. Department of Energy (DOE), Office of Sciences, Basic Energy Sciences (BES), DE-SC0014109 (HY,RB,KH,HS), and also the National Science Foundation (NSF), Award #1709568 (SP).

Acknowledgments

We would like to thank Bryan Crawford for technical support throughout the work.

Conflicts of Interest

The authors declare no conflicts of interest. The funders had no role in the design of the study.

References

  1. Kese, K.O.; Li, Z.C.; Bergman, B. Influence of residual stress on elastic modulus and hardness of soda-lime glass measured by nanoindentation. J. Mater. Res. 2004, 19, 3109–3119. [Google Scholar] [CrossRef]
  2. Zhou, X.; Jiang, Z.; Wang, H.; Yu, R. Investigation on methods for dealing with pile-up errors in evaluating the mechanical properties of thin metal films at sub-micron scale on hard substrates by nanoindentation technique. Mater. Sci. Eng. A 2008, 488, 318–332. [Google Scholar] [CrossRef]
  3. Bufford, D.; Liu, Y.; Wang, J.; Wang, H.; Zhang, X. In situ nanoindentation study on plasticity and work hardening in aluminium with incoherent twin boundaries. Nat. Commun. 2014, 5, 4864. [Google Scholar] [CrossRef] [PubMed] [Green Version]
  4. Schuh, C.A.; Lund, A.C. Application of nucleation theory to the rate dependence of incipient plasticity during nanoindentation. J. Mater. Res. 2004, 19, 2152–2158. [Google Scholar] [CrossRef]
  5. Wang, L.; Bei, H.; Gao, Y.F.; Lu, Z.P.; Nieh, T.G. Effect of residual stresses on the hardness of bulk metallic glasses. Acta Mater. 2011, 59, 2858–2864. [Google Scholar] [CrossRef]
  6. Uchic, M.D.; Dimiduk, D.M.; Florando, J.N.; Nix, W.D. Sample dimensions influence strength and crystal plasticity. Science 2004, 305, 986–989. [Google Scholar] [CrossRef]
  7. Voyiadjis, G.Z.; Yaghoobi, M. Chapter 1—Introduction: Size Effects in Materials 2019, in Size Effects in Plasticity; Academic Press: Cambridge, MA, USA, 2019; pp. 1–79. [Google Scholar]
  8. Voyiadjis, G.Z.; Yaghoobi, M. Size Effects during Nanoindentation: Molecular Dynamics Simulation. In Handbook of Nonlocal Continuum Mechanics for Materials and Structures; Springer International Publishing AG: Cham, Switzerland, 2019; pp. 39–76. [Google Scholar]
  9. Suresh, S.; Giannakopoulos, A.E. A new method for estimating residual stresses by instrumented sharp indentation. Acta Mater. 1998, 46, 5755–5767. [Google Scholar] [CrossRef]
  10. Giannakopoulos, A.E.; Suresh, S. Determination of elastoplastic properties by instrumented sharp indentation. Scr. Mater. 1999, 40, 1191–1198. [Google Scholar] [CrossRef] [Green Version]
  11. Bolshakov, A.P.G.M.; Pharr, G.M. Influences of pileup on the measurement of mechanical properties by load and depth sensing indentation techniques. J. Mater. Res. 1998, 13, 1049–1058. [Google Scholar] [CrossRef]
  12. Chen, X.; Yan, J.; Karlsson, A.M. On the determination of residual stress and mechanical properties by indentation. Mater. Sci. Eng. A 2006, 416, 139–149. [Google Scholar] [CrossRef] [Green Version]
  13. Voyiadjis, G.Z.; Peters, R. Size effects in nanoindentation: An experimental and analytical study. Acta Mech. 2010, 211, 131–153. [Google Scholar] [CrossRef]
  14. Yang, R.; Zhang, Q.; Xiao, P.; Wang, J.; Bai, Y. Two opposite size effects of hardness at real nano-scale and their distinct origins. Sci. Rep. 2017, 7, 16053. [Google Scholar] [CrossRef] [PubMed]
  15. Hou, X.D.; Jennett, N.M. A method to separate and quantify the effects of indentation size, residual stress and plastic damage when mapping properties using instrumented indentation. J. Phys. D Appl. Phys. 2017, 50, 455304. [Google Scholar] [CrossRef] [Green Version]
  16. Jarausch, K.F.; Kiely, J.D.; Houston, J.E.; Russell, P.E. Defect-dependent elasticity: Nanoindentation as a probe of stress state. J. Mater. Res. 2000, 15, 1693–1701. [Google Scholar] [CrossRef] [Green Version]
  17. Sun, K.; Shi, J.; Ma, L. Atomistic Insights into the Effects of Residual Stress during Nanoindentation. Crystals 2017, 7, 240. [Google Scholar] [CrossRef] [Green Version]
  18. Larsson, P.L. On the influence of elastic deformation for residual stress determination by sharp indentation testing. J. Mater. Eng. Perform. 2017, 26, 3854–3860. [Google Scholar] [CrossRef] [Green Version]
  19. Khan, M.K.; Fitzpatrick, M.E.; Hainsworth, S.V.; Edwards, L. Effect of residual stress on the nanoindentation response of aerospace aluminium alloys. Comput. Mater. Sci. 2011, 50, 2967–2976. [Google Scholar] [CrossRef]
  20. Zhu, L.N.; Xu, B.S.; Wang, H.D.; Wang, C.B. Measurement of residual stresses using nanoindentation method. Crit. Rev. Solid State Mater. Sci. 2015, 40, 77–89. [Google Scholar] [CrossRef]
  21. Xu, Z.H.; Li, X. Estimation of residual stresses from elastic recovery of nanoindentation. Philos. Mag. 2006, 86, 2835–2846. [Google Scholar] [CrossRef]
  22. Shen, T.D.; Koch, C.C.; Tsui, T.Y.; Pharr, G.M. On the elastic moduli of nanocrystalline Fe, Cu, Ni, and Cu–Ni alloys prepared by mechanical milling/alloying. J. Mater. Res. 1995, 10, 2892–2896. [Google Scholar] [CrossRef]
  23. Pharr, G.M. Measurement of mechanical properties by ultra-low load indentation. Mater. Sci. Eng. A 1998, 253, 151–159. [Google Scholar] [CrossRef]
  24. Oliver, W.C.; Pharr, G.M. An improved technique for determining hardness and elastic modulus using load and displacement sensing indentation experiments. J. Mater. Res. 1992, 7, 1564–1583. [Google Scholar] [CrossRef]
  25. Liu, Y.; Ngan, A.H.W. Depth dependence of hardness in copper single crystals measured by nanoindentation. Scr. Mater. 2001, 44, 237–241. [Google Scholar] [CrossRef]
  26. Durst, K.; Backes, B.; Franke, O.; Göken, M. Indentation size effect in metallic materials: Modeling strength from pop-in to macroscopic hardness using geometrically necessary dislocations. Acta Mater. 2006, 54, 2547–2555. [Google Scholar] [CrossRef]
  27. Oliver, W.C.; Pharr, G.M. Measurement of hardness and elastic modulus by instrumented indentation: Advances in understanding and refinements to methodology. J. Mater. Res. 2004, 19, 3–20. [Google Scholar] [CrossRef]
  28. Catoor, D.; Gao, Y.F.; Geng, J.; Prasad, M.J.N.V.; Herbert, E.G.; Kumar, K.S.; Pharr, G.M.; George, E.P. Incipient plasticity and deformation mechanisms in single-crystal Mg during spherical nanoindentation. Acta Mater. 2013, 61, 2953–2965. [Google Scholar] [CrossRef]
  29. Lorenz, D.; Zeckzer, A.; Hilpert, U.; Grau, P.; Johansen, H.; Leipner, H.S. Pop-in effect as homogeneous nucleation of dislocations during nanoindentation. Phys. Rev. B 2003, 67, 172101. [Google Scholar] [CrossRef] [Green Version]
  30. Jiapeng, S.; Cheng, L.; Han, J.; Ma, A.; Fang, L. Nanoindentation induced deformation and pop-in events in a silicon crystal: Molecular dynamics simulation and experiment. Sci. Rep. 2017, 7, 10282. [Google Scholar] [CrossRef]
  31. Bei, H.; Xia, Y.Z.; Barabash, R.I.; Gao, Y.F. A tale of two mechanisms: Strain-softening versus strain-hardening in single crystals under small stressed volumes. Scr. Mater. 2016, 110, 48–52. [Google Scholar] [CrossRef] [Green Version]
  32. Voyiadjis, G.Z.; Yaghoobi, M. Review of nanoindentation size effect: Experiments and atomistic simulation. Crystals 2017, 7, 321. [Google Scholar] [CrossRef] [Green Version]
  33. Lee, Y.H.; Kwon, D. Estimation of biaxial surface stress by instrumented indentation with sharp indenters. Acta Mater. 2004, 52, 1555–1563. [Google Scholar] [CrossRef]
  34. Gu, Y.; Nakamura, T.; Prchlik, L.; Sampath, S.; Wallace, J. Micro-indentation and inverse analysis to characterize elastic–plastic graded materials. Mater. Sci. Eng. A 2003, 345, 223–233. [Google Scholar] [CrossRef]
  35. Zhu, L.N.; Xu, B.S.; Wang, H.D.; Wang, C.B. Effect of residual stress on the nanoindentation response of (100) copper single crystal. Mater. Chem. Phys. 2012, 136, 561–565. [Google Scholar] [CrossRef]
  36. Kucharski, S.; Jarząbek, D.; Piątkowska, A.; Woźniacka, S. Decrease of nano-hardness at ultra-low indentation depths in copper single crystal. Exp. Mech. 2016, 56, 381–393. [Google Scholar] [CrossRef] [Green Version]
  37. Feng, G.; Nix, W.D. Indentation size effect in MgO. Scr. Mater. 2004, 51, 599–603. [Google Scholar] [CrossRef]
  38. Bolshakov, A.; Oliver, W.C.; Pharr, G.M. Influences of stress on the measurement of mechanical properties using nanoindentation: Part II. Finite element simulations. J. Mater. Res. 1996, 11, 760–768. [Google Scholar] [CrossRef]
  39. Tsui, T.Y.; Oliver, W.C.; Pharr, G.M. Influences of stress on the measurement of mechanical properties using nanoindentation: Part I. Experimental studies in an aluminum alloy. J. Mater. Res. 1996, 11, 752–759. [Google Scholar] [CrossRef]
  40. Asaro, R.; Lubarda, V. Mechanics of Solids and Materials; Cambridge University Press: Cambridge, UK, 2006. [Google Scholar]
  41. Cockayne, D.J.H.; Jenkins, M.L.; Ray, I.L.F. The measurement of stacking-fault energies of pure face-centred cubic metals. Philos. Mag. 1971, 24, 1383–1392. [Google Scholar] [CrossRef]
  42. Ludwigson, D.C. Modified stress-strain relation for FCC metals and alloys. Metall. Trans. 1971, 2, 2825–2828. [Google Scholar] [CrossRef]
  43. ABAQUS “ABAQUS Documentation”; Dassault Systèmes: Providence, RI, USA, 2011.
  44. Uchic, M.D.; Shade, P.A.; Dimiduk, D.M. Plasticity of micrometer-scale single crystals in compression. Annu. Rev. Mater. Res. 2009, 39, 361–386. [Google Scholar] [CrossRef] [Green Version]
  45. Papanikolaou, S.; Dimiduk, D.M.; Choi, W.; Sethna, J.P.; Uchic, M.D.; Woodward, C.F.; Zapperi, S. Quasi-periodic events in crystal plasticity and the self-organized avalanche oscillator. Nature 2012, 490, 517. [Google Scholar] [CrossRef] [Green Version]
  46. Papanikolaou, S.; Bohn, F.; Sommer, R.L.; Durin, G.; Zapperi, S.; Sethna, J.P. Universality beyond power laws and the average avalanche shape. Nat. Phys. 2011, 7, 316. [Google Scholar] [CrossRef] [Green Version]
  47. Budrikis, Z.; Castellanos, D.F.; Sandfeld, S.; Zaiser, M.; Zapperi, S. Universal features of amorphous plasticity. Nat. Commun. 2017, 8, 15928. [Google Scholar] [CrossRef] [Green Version]
  48. Song, H.; Yavas, H.; Van der Giessen, E.; Papanikolaou, S. Discrete dislocation dynamics simulations of nanoindentation with pre-stress: Hardness and statistics of abrupt plastic events. J. Mech. Phys. Solids 2019, 123, 332–347. [Google Scholar] [CrossRef] [Green Version]
  49. Bolin, R. Detecting the Onset of the bulk crystal plasticity transition in face centered cubic metals using nanoindentation; Graduate Theses, Dissertations, and Problem Reports; West Virginia University: Morgantown, WV, USA, 2018; p. 5228. Available online: https://researchrepository.wvu.edu/etd/5228 (accessed on 21 October 2019).
  50. Hou, X.; Jennett, N.M. Application of a modified slip-distance theory to the indentation of single-crystal and polycrystalline copper to model the interactions between indentation size and structure size effects. Acta Mater. 2012, 60, 4128–4135. [Google Scholar] [CrossRef]
  51. Nix, W.D.; Gao, H. Indentation size effects in crystalline materials: A law for strain gradient plasticity. J. Mech. Phys. Solids 1998, 46, 411–425. [Google Scholar] [CrossRef]
  52. Poole, W.J.; Ashby, M.F.; Fleck, N.A. Micro-hardness of annealed and work-hardened copper polycrystals. Scr. Mater. 1996, 34, 559–564. [Google Scholar] [CrossRef]
  53. Ma, Z.S.; Zhou, Y.C.; Long, S.G.; Lu, C. On the intrinsic hardness of a metallic film/substrate system: Indentation size and substrate effects. Int. J. Plast. 2012, 34, 1–11. [Google Scholar] [CrossRef] [Green Version]
  54. Pharr, G.M.; Herbert, E.G.; Gao, Y. The indentation size effect: A critical examination of experimental observations and mechanistic interpretations. Annu. Rev. Mater. Res. 2010, 40, 271–292. [Google Scholar] [CrossRef]
  55. Gerberich, W.W.; Tymiak, N.I.; Grunlan, J.C.; Horstemeyer, M.F.; Baskes, M.I. Interpretations of indentation size effects. J. Appl. Mech. 2002, 69, 433–442. [Google Scholar] [CrossRef]
  56. Zhou, C.; LeSar, R. Dislocation dynamics simulations of plasticity in polycrystalline thin films. Int. J. Plast. 2012, 30, 185–201. [Google Scholar] [CrossRef]
  57. El-Awady, J.A. Unravelling the physics of size-dependent dislocation-mediated plasticity. Nat. Commun. 2015, 6, 5926. [Google Scholar] [CrossRef] [PubMed] [Green Version]
Figure 1. Representative images of experimental device. (a) Custom 4 point-bending fixture, side view of the stage for polycrystalline sample; (b) finite element modeling, using the ABAQUS software [43], assisted design (see Table 1 and Table 2); (c) top view of 4 point-bending fixture for a single-crystalline sample, strain gauge is glued on the top surface of the sample. (d) Optical image of surface steps when strain is larger than 0.1% in single crystalline copper sample.
Crystals 09 00652 g001
Figure 2. Four-point bending fixtures in a nanoindentation device: (ac) Stainless steel fixtures in an iNano nanoindenter. (a) 10 cm-long, (b) 5 cm-long, (c) 10 mm-long. The fixture in (c) is the one that provided all data presented in this work. (df) Finite element simulations of von Mises stress (d) and lateral displacements (e,f) of various steel device components and a copper sample in the fixture, showing that the strain effect of the fixture on the sample is smaller than 10 6 (see also Supplementary Materials (SM)).
Crystals 09 00652 g002
Figure 3. Nanoindentation tips used in study: (a,b and b-inset) Diamond Berkovich tip Scanning Electron Microscopy (SEM) images at three resolutions (120μm, 6μm, 1μm); the tip has a residual spherical endpoint of radius 10 nm. (c,d) Five-μm-radius diamond spherical tip.
Crystals 09 00652 g003
Figure 4. Pop-in events in polycrystalline aluminum. (a) A representative sample of nanoindentation load–depth curves in Al non-stressed samples over a region of 1 mm2 on the top surface. (b) Detailed load–depth behavior at four randomly selected locations on non-stressed sample top surface, colors in (a,b) just signify distinct indentation trials (distinct indentation sites). (c) Probability event distribution P(S) as function of event size S (described in text) for applied total in-plane strain of 0.031 (●) (blue), 0.065 ∎ (green), 0.11 (▶) (red), 0.15 (◀)(cyan), 0.2 (▲)% (purple). The solid line is a guide to the eye and represents y ∼ x –1.6. (d) Probability distribution P (V) of the “pop-in noise” intensity V = dh/dt (described in text) (total strain shown in legend).
Crystals 09 00652 g004
Figure 5. Hardness in polycrystalline aluminum. Variation of hardness as a function of indentation depth for multiple samples at in-plane stress (a) zero and (b) 43.21 MPa (with 0.08% plastic strain (see Table 1)). Colors in (a,b) signify distinct indentation trials (distinct indentation sites). In (c), we show the change of average and binned hardness with applied in-plane strain at various indentation depths (depths shown in legend), while in (d), we show the change of average and binned hardness with depth at various total applied strains (corresponding strains shown in legend).
Crystals 09 00652 g005
Figure 6. Pop-in events in single crystal aluminum. (a) Representative samples of nanoindentation load–depth curves in Al non-stressed samples (Colors/symbols in (a) signify just distinct indentation trials at distinct indentation sites). (b) Sample-averaged load–depth behavior as function of applied total tensile strain levels (0%, 0.005%, 0.05%, 0.1%, see legend). There are about 1000 tests averaged per strain. (c) Probability event distribution P(S) as function of event size as function of the applied in-plane tensile strain (strain level shown in legend).
Crystals 09 00652 g006
Figure 7. Hardness and statistics in single-crystalline aluminum. (a) Sample-averaged hardness-depth measurements carried on single crystals (100) at multiple tensile strain levels (0%, 0.005%, 0.05%, 0.1%). (b) Average hardness for four strains (zoomed in) showing that the behavior is consistent with a strong dependence on applied tensile strain, analogously to the behavior in polycrystalline Al, showing that hardness is proportional to a power law of the applied tensile strain. Different symbols/colors indicate different applied tensile strains. Each figure has almost 1000 indentations averaged in each strain. (c) Shows the full hardness averages with respect to the applied tensile strains, for a given depth bin (colors/symbols in (c) follow legend in (b)).
Crystals 09 00652 g007
Figure 8. Force–displacement and pop-in events in single crystal copper. (a) Representative samples of nanoindentation load–depth curves in Cu non-stressed samples (Colors/symbols in (a) signify just distinct indentation trials at distinct indentation sites). (b) Sample-averaged load–depth behavior as function of applied total tensile strain levels (0.04%, 0.08%, 0.12%, 0.14%, 0.16%). There are about 1000 tests averaged per strain. (c) Probability event distribution P(S) as function of event size as function of the applied in-plane tensile strain. The statistical behavior is similar to the one observed for polycrystal copper (not shown [49]), and consistently similar to the behaviors observed for single crystal and polycrystal Al.
Crystals 09 00652 g008
Figure 9. Hardness and statistics in single-crystalline copper. (a) Sample-averaged hardness-depth measurements carried on single crystals (100) at multiple tensile strain levels (0%, 0.04%, 0.08%, 0.16%, see legend). (b) Average hardness for four strains (zoomed in) showing that the behavior is consistent with a strong dependence on applied tensile strain, analogously to the behavior in single and polycrystalline Al, showing that hardness is proportional to a power law of the applied tensile strain. Different symbols/colors indicate different applied tensile strains. Each figure has almost 1000 indentations averaged in each strain. (c) Shows the full hardness averages with respect to the applied tensile strains for a given depth bin. (ac) Shows that the hardness at shallow depths transitions almost immediately, but the effect is still present until 15 nm. (Colors/symbols in (c) follow legend in (b)).
Crystals 09 00652 g009
Table 1. Example of bending deflection and strain–stress correspondence: Polycrystal Al: Measured total strain and calculated stress and plastic strain.
Deflection (µm)Total Strain%Plastic Strain%Tensile Stress (MPa)
0000
9.70.031019.1
22.60.065040.13
31.60.110.0441.86
40.30.150.0843.21
49.30.20.12744.6
58.30.240.16545.9
71.70.310.23347.12
82.30.360.28347.35
Table 2. Example of bending deflection and strain–stress correspondence: Single Crystal Al: Measured total strain and calculated stress and plastic strain.
Deflection (µm)Total Strain%Plastic Strain%Tensile Stress (MPa)
2.30.00503.5
9.30.050.00920
11.20.10.0420.11
Table 3. Material properties of materials tested as estimated in a materials test frame (see also Supplementary Materials (SM)).
Material TestedElastic Modulus (GPa)Strength (0.2%) (MPa)
Cu (100)10886
Al (100)71112
Cu Polycrystal114125
Al Polycrystal73105

