Analysis of the Transmission Characteristic and Stress-Induced Birefringence of Hollow-Core Circular Photonic Crystal Fiber


1
State Key Laboratory of Information Photonics and Optical Communications, Beijing University of Posts and Telecommunications, Beijing 100876, China
2
College of Electrical Information, Langfang Normal University, Langfang 065000, China
3
School of Ethnic Minority Education, Beijing University of Posts and Telecommunications, Beijing 100876, China
*
Authors to whom correspondence should be addressed.
Crystals 2019, 9(3), 128; https://doi.org/10.3390/cryst9030128
Submission received: 21 January 2019
/
Revised: 26 February 2019
/
Accepted: 26 February 2019
/
Published: 2 March 2019
(This article belongs to the Special Issue Sonic and Photonic Crystals)
Abstract
:Orbital angular momentum modes in optical fibers have polarization mode dispersion. The relationship between polarization mode dispersion and the birefringence vector can be deduced using an optical fiber dynamic equation. First, a mathematical model was established to formulate mode dispersion caused by stress-induced birefringence. Second, in the stress-induced birefringence simulation model, the finite element method was used to analyze the transmission characteristics of the hollow-core circular photonic crystal fiber. Finally, mode dispersion caused by stress-induced birefringence was obtained using theoretical derivation and simulation analyses. The results showed that the new fiber type has good transmission characteristics and strong stress sensitivity, which provide key theoretical support for optimizing the structural parameters of optical fiber and designing stress sensors.
1. Introduction
With the development of 5G—Internet of things, big data, and real-time data—optical fiber communication systems, it is imperative to expand their capacity, improve transmission stability, and network intelligence [1,2,3]. Current communication systems’ capacity expansion technologies, such as time division multiplexing, frequency division multiplexing, polarization division multiplexing, and high-order modulated, cannot meet future information communication demands [4,5]. Therefore, space division multiplexing, a new capacity expansion technology, is emerging as a solution for this problem both in free space communication and optical fiber communication. Moreover, mode division multiplexing (MDM), a space division multiplexing technology, has been a hot area of research for several years.
Orbital angular momentum (OAM) multiplexing is a MDM technology. When transmitting information independently, it utilizes different modes as transmission channels based on the orthogonality of different OAM modes, and it can therefore spread in the optical fiber at the same time. In 1984, to obtain analytical solutions of some uniform geometrical shape, fiber birefringence—a thermal elastic model of gradient function—was developed by Chu et al. [6]. For fiber composed of uniformly-shaped stress zones, Tsai et al. [7] proposed the idea of superposition in 1991, whereby total stress field distribution is obtained by stress zone superposition. In [8], Yu et al. studied stress field distribution and the size of birefringence from stress microelements, and concluded that stress size and birefringence at the core’s center are completely unrelated to the shape and placement direction of stress microelements. Since the first photonic crystal fiber (PCF) was successfully sketched in 1996, nonlinear effects were found to effectively improve with the variety of the cladding structures [9]. In [10], Yang Yue et al. first proposed that PCF can be used for supercontinuum generation of optical vortex modes, but PCF cladding of hexagonal symmetrical structures is only to support two groups of OAM modes, which would cause the problem of large loss and dispersion. Subsequently, Wong et al. twisted photonic crystal fiber to adjust dispersion and nonlinearity of OAM transmission [11]. Then a new type, C-PCF, designed by Zhang et al. was able to transmit OAM mode with low transmission loss and flat dispersion [12]. PCF is of great potential in the optical fiber communication field because it has the characteristics of low loss, small dispersion, and low nonlinear effect, especially for long-distance communication systems. Compared with circular fiber, a series of C-PCFs proposed by our research [13], can achieve a high refractive index difference of fiber cross-section without a complicated doping process. Continuous progress in PCF design methods and manufacturing processes are slowly perfecting it. Therefore, PCF is of great practical value for the future.
The fiber cross-section should be ideally a circle. The propagation constants of two degenerate modes in the orthogonal direction are equal, and the two polarization directions are perpendicular to each other, so that the OAM mode can stably transfer without a birefringence problem. However, residual birefringence exists in optical fiber, which can be divided into two categories: intrinsic and extrinsic birefringence [14]. Extrinsic birefringence is caused by fiber bending, external stress, torsion, environmental temperature change, external electromagnetic field, and vibration, which may occur during fiber cable manufacturing and laying. In the same OAM mode, propagation speeds of odd and even modes are different, leading to the birefringence modal dispersion (MD) effect [15]. Recently, in [16,17], Wang et al. analyzed the phenomenon of birefringence MD based on the polarization mode dispersion of single-mode fibers in OAM fiber. Stress-induction is a key influential factor in birefringence MD; however, to the best of our knowledge, it is rarely considered. Therefore, it is necessary to further research the problem of stress-induced birefringence.
In view of most approaches addressing SMFs birefringence, it can still be used for birefringence MD. The main contribution in this paper is that the transmission characteristics and stress-induced birefringence of the new designed C-PCF. For multiple modes in the OAM fibers, an improved method of dynamic equation is used to solve the problem for birefringence MD. In this article, the solid mechanics module in the COMSOL Multiphysics software, which is based on the finite element method [18], was used to analyze OAM modes the propagation properties supported by our hollow-core C-PCF. The results indicate that the new type hollow-core C-PCF fiber can realize effective segregation and stable transmission of OAM modes. The theoretical derivation of stress-induced birefringence in this paper is based on the cross-section of the fiber with an irregular shape in the stress region. Therefore, the designed hollow-core C-PCF in the application of MDM fiber communication systems might greatly improve channel capacity and spectral efficiency.
2. Theoretical Model
With the rapid development of optical fiber communication networks, the communication capacity of the existing SMFs is close to its Shannon limit, which gradually fails to meet the growing demand for information. The OAM multiplexing technology can solve increasing channel congestion problems of fiber communication. Due to the orthogonality of OAM modes with different topological charges in space—it is theoretically considered that the number of topological charges is infinite—research using OAM modes as information carriers in communication systems has aroused wide public concern [2,3,19]. In this part, we first provide the electric field distribution of the OAM mode in optical fiber. Then, the mode dispersion of birefringence is given. Finally, the mathematical formula on the stress-induced birefringence model is obtained.
2.1. OAM Modes in PCF
According to [19,20], the OAM mode electric field distribution in optical fiber can be expressed as follows:
where is the phase distribution of mode field in the radial direction, is the mode solutions, and is radial mode profile.
OAM modes in optical fiber are composed of the linear combination of vector eigenmodes [20]. The OAM mode in optical fiber is specifically expressed in the following configuration:
where “±” represents the polarization direction of the OAM mode. In OAM fiber, OAM mode can be regarded as the superposition of even and odd modes of HE or EH, and there is π/2 phase difference between the even and odd modes. When the value of l is larger than 1, there are four OAM modes to compose a OAM mode group for a given l and m, but when l equals 1, only two OAM modes form a OAM mode group. Because TE0,m and TM0,m modes have different propagation constants, which cannot form OAM modes, only even and odd HE2,m modes could be used to form an OAM mode. For the even and odd modes in the same OAM mode, the absolutes of topological charge number are both degenerate. In other words, their effective refractive indices are almost the same, and the electric field distribution of odd and even modes in Equation (2) can be expanded as
2.2. Birefringence Mode Dispersion
A dynamic equation is an effective method for analyzing the polarization mode dispersion (PMD) vector with the variation of transmission distance [21,22]. For multiple modes of transmission in OAM fiber, there exists not only inter-mode dispersion but also intra-mode dispersion. In order to facilitate the analysis, we split the fiber into numerous segments, and each segment of birefringence can be considered uniform, specifically
where is the birefringence vector, is the OAM-PMD vector, and is the polarization state. Assuming that the frequency ω and distance z are invariable, we computed the input polarization state ŝ partial derivatives about ω and z, respectively. The relationship between the PMD and birefringence vectors can be simplified as:
when fiber is disturbed by an external force or electromagnetic effect, its cross-section becomes slightly deformed, and the propagation constant of two linear polarization modes changes. Meanwhile, the state of the two polarization modes is not degenerate as before. The study on OAM-PMD vector τ can be started with the birefringence vector β.
As birefringence exists in the OAM fiber, and the refractive index of odd and even modes is different, and, therefore, the propagation constant is different. Generally speaking, stress-induced birefringence is much larger than that caused by fiber core manufacturing errors of noncircular deformation. Since fiber is a type of good elastic medium, and the photoelastic effect occurs under the action of external force, which will cause refractive index changes. In order to study fiber stress distribution under external forces, fiber stress distribution is obtained as follows:
As shown in Figure 1, stresses in each direction can be decomposed into the sum of the stresses in the three axes. Hence, the stress distribution matrix under external force is as follows:
According to the equivalent theory of shearing stress [23], the above matrix is symmetric. Optical fiber changes are described by positive and shear strains. A positive strain is indicated by ‘ε’, shear strain is indicated by ‘γ’, and the strain matrix is expressed as follows:
where the x component of strain εx is related to the x component of displacement u, and the y component strain εy is related to the y component displacement v.
The size of z direction is considered much larger than that of the other two directions, and the vertical external force on the cross-section of optical fiber. We only compute displacement vectors at all points parallel to the x and y planes. Since any optical fiber cross-section that can be treated is symmetric, Equation (7) can be transformed into a plane strain problem.
In the case of complete elasticity and isotropy, the above equation of physical properties is conformed to Hooke's law within the range of elastic response.
where E is the modulus of elasticity in stress direction, and is the ratio of Poisson, which indicates the coefficient of shrinkage. We can introduce Airy's stress function F to solve this equation as follows:
where and are the x and y components of stress distribution in the homogeneous fiber, respectively. The Airy stress function is the solution for the biharmonic Equation [23]:
To achieve the calculation of the Airy stress function, we used Fourier series expansion of polar coordinates to denote F, and the expansion coefficients an and bn were determined from boundary conditions.
The stress components of Equation (11) were transformed into polar coordinates as follows:
The corresponding stress-induced birefringence B is given using the stress distribution formula:
where C is the stress-optic coefficient of the fiber, which depends on the wavelength and material. The stress-optic coefficient is proportional to the difference in the material’s refractive index. The electric field distribution depends on the normalized frequency, which can be defined as:
where λ is the wavelength, n is the refractive index, a is the fiber core radius, and Δ is the relative index difference between core and cladding, respectively. Equation (15) can be rewritten as:
where is the electric field’s intensity distribution, while and represent anisotropic stress distributions in the fiber. The stress-induced birefringence formula can be used to calculate the cross-section of any photonic crystal fiber with an irregular shape.
3. Simulation and Analysis
Hollow-core circular photonic crystal fiber (C-PCF) can support 26 OAM modes, and the numerical analysis shows that the proposed fiber possesses very good fiber parameter values. In Reference [24], a novel ring-core photonic crystal fiber was fabricated, which supports four groups of OAM modes with 2.13 × 10⁻³ minimum difference of effective indices at 1550 nm. The realized fiber is expected to be a good platform for OAM mode transmission. In this section, we analyzed the stress distribution of hollow-core C-PCF. Then, the transmission characteristics and the resulting birefringence of OAM modes were analyzed using finite element methods. Finally, the simulation results were obtained using the solid mechanics module in the COMSOL Multiphysics software.
3.1. Model of Stress-Induced Field
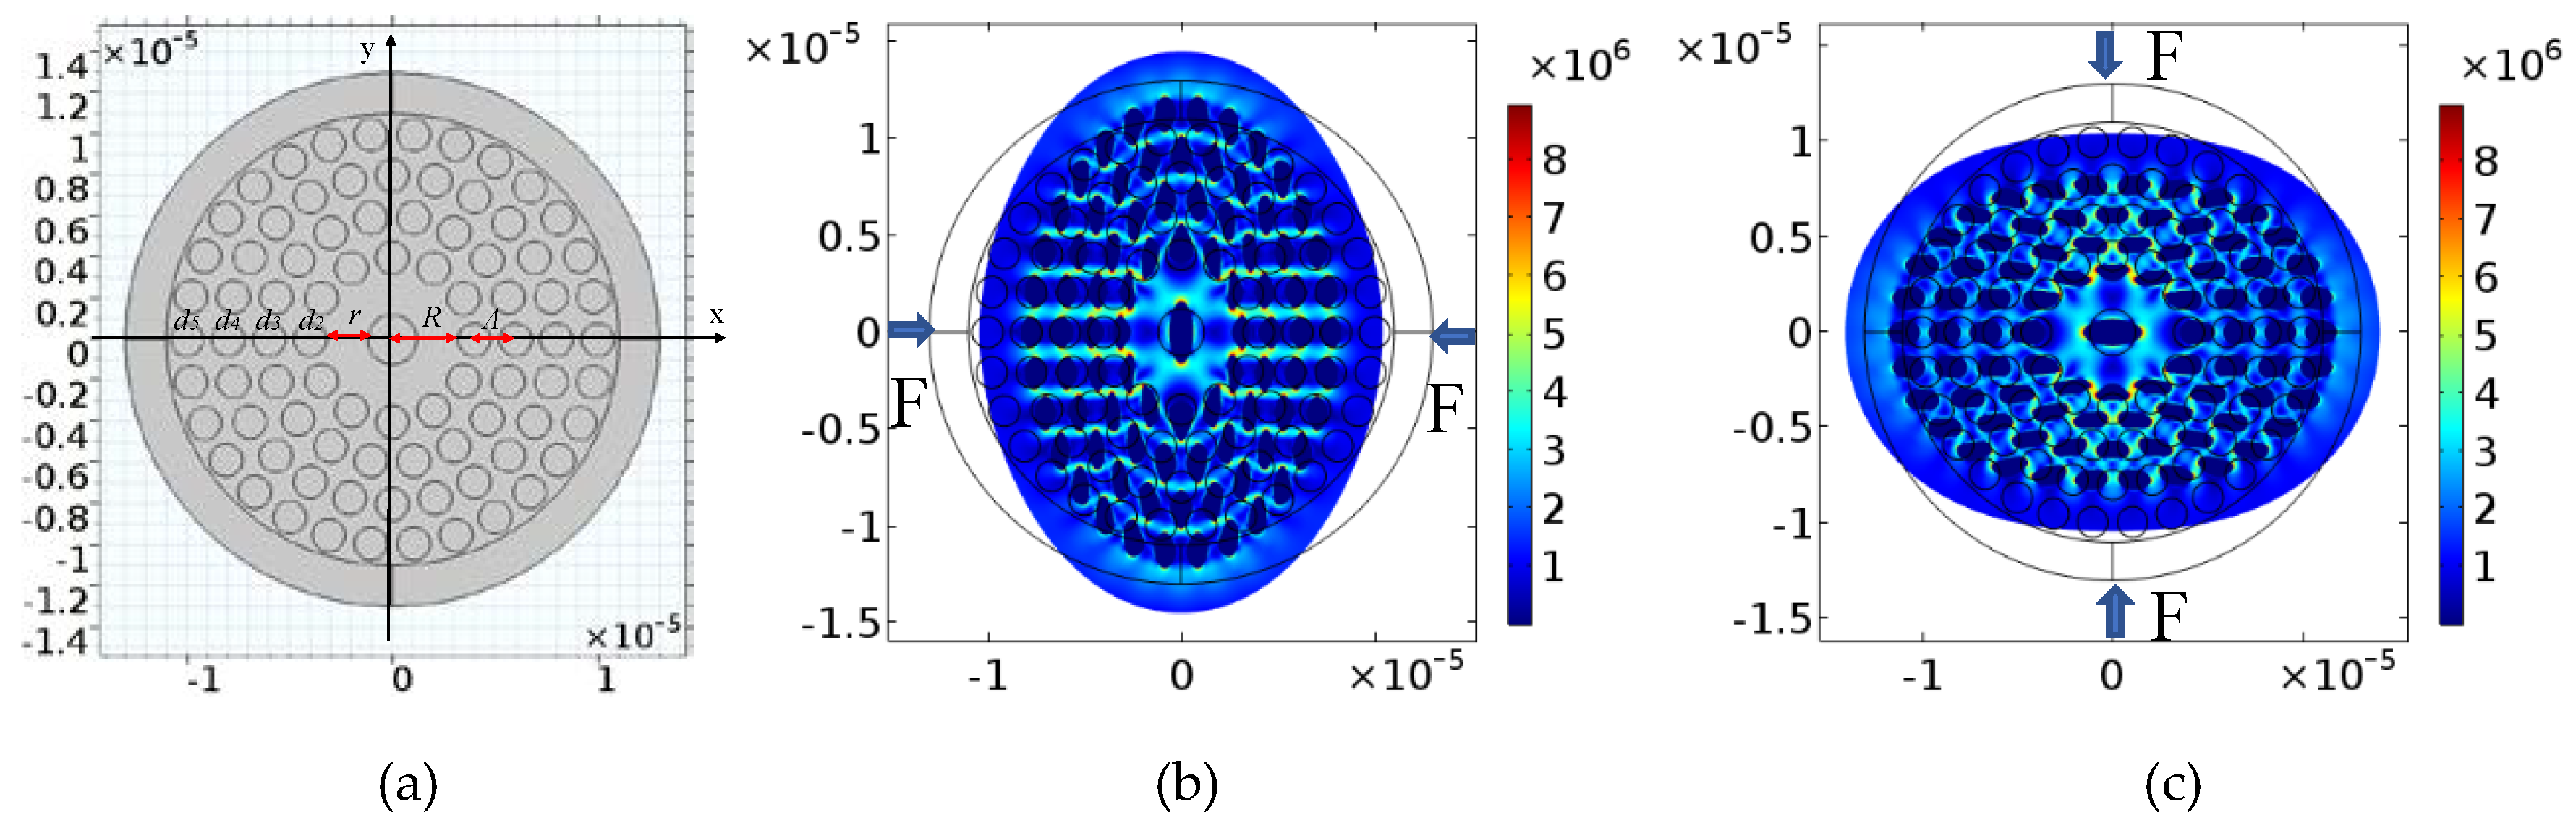
We used [25,26] hollow-core C-PCF as the stress field model. The simulation parameters are given in Table 1. This structure’s adjustable parameters in Figure 2(a) include: center air hole radius r, the cladding inner radius R, outer air hole diameter dn (n = 2, 3, 4, 5. . .), the distance between two consecutive circles Λ, and the number of outer air hole rings N. In this paper, we set r = 4.4 µm, R = 6 µm, Λ = 2.2 µm, N = 4, dn/Λ = 0.8, and d = 1.76 µm. Figure 2b,c indicate that hollow-core C-PCF deformed under external force, the deformation not only included air hole spacing but also change in air hole shape. Therefore, photonic crystal fiber symmetry changed, Figure 2b,c are oriented toward qualitative analysis and have little quantitative analysis on the deformation of the stress field [27,28]. Due to fiber symmetry, only the propagation characteristics simulation results of stress in the vertical direction are given.
Effective Refractive Index
Considering the actual situation of pressure in the process of optical fiber production and laying, we chose a 1–200 MPa pressure range in the simulation calculation. Figure 3a shows an effective refractive index as a function of stress for different modes, and Figure 3b shows the effective index difference between even and odd modes as a function of stress. Compared to the effective refractive index difference of fiber under no stress, we obtained the effective refractive index difference of odd and even modes due to stress. The effective refractive index increased with stress, as did the effective index difference between even and odd modes. The difference of effective refractive index between different modes was much larger than that between odd and even modes within the same mode with different stress. When external stress was applied to fiber, the fiber’s cross-section was not symmetrical. The index difference between even and odd modes in the lower order modes was larger than that in the higher order modes. Electric field distribution of fiber depends on the normalized frequency defined by effective index difference between even and odd modes.
Since the stress-optic coefficient of fiber was determined by the wavelength of the transmitted beam, analyzed the change of effective refractive index with wavelength. Figure 4a shows that the effective refractive index changed with wavelength variation for different modes under 100 MPa stress in the y direction. Figure 4b shows that the effective refractive index difference between even and odd modes changed with wavelength variation. The difference of effective refractive index between different modes was much larger than that between odd and even modes within the same mode with different wavelengths. The effective refractive index decreased with wavelength variation, and the difference between even and odd modes in the lower order modes was larger than those in the higher order modes. Although these changes were small, it may be very important that they impact the value of modal birefringence.
3.2. Transmission Characteristics of OAM Modes
This section simulates the transmission characteristics of hollow-core C-PCF under longitudinal pressure, including intensity, phase, polarization, and loss. There are two ways to compose an OAM mode in Equation (2), which can be obtained by the linear superposition of the odd and even modes of HE mode or EH mode. In Figure 3, the effective refractive index difference between EH mode and HE mode that make up the same mode group is much larger than that between the odd and even mode within the same mode, so we only consider the dispersion effect within the mode. Here we use the transmission characteristics of HE mode to represent the transmission characteristics of an OAM mode. When the pressure was less than 1 MPa, transmission characteristics changes are unobvious, and the maximum pressure in the fiber’s practical application was less than 200 MPa. Therefore, we exerted 1–200 MPa stress. The intensity distribution of each OAM mode transmitted in optical fiber was annular, and the phase distribution was related to the topological charge. Here we only selected the HE31 mode as an example to reflect the transmission characteristics of each mode.
3.2.1. Intensity and Phase
Figure 5 shows the normalized intensity distribution of HE31 under 1–200 MPa stress in the y direction. The xy plane represents the fiber core’s cross-section, and the z-axis represents the normalized intensity of the HE31 mode. Figure 6 illustrates the intensity distribution of the axis cross-section in HE31 mode under the same situation. The intensity distribution of HE31 under the different stresses were almost the same, but the peak value of intensity distribution in the middle cross-section changed with increasing stress. Since the ringlike energy distribution changed with increasing stress, the ringlike intensity distribution of any single-mode vortex beam was no longer regular, and it generated distortion.
Figure 7 and Figure 8 illustrate the normalized intensity distribution for even and odd modes of HE31 under 1–200 MPa stress in the y direction. The intensity distribution for even and odd modes have the same shape for the one OAM mode, but the peak value in the middle of the even and modes’ cross-section changed in opposite tendency with increasing stress. The strength lobes of odd and even modes were complementary, thus the strength distribution of the OAM mode was comprised by superposition, which presented a ring distribution. Figure 9 shows the intensity distribution in the axis cross-section of HE31 under the same situation, HE31e and HE31o are even and odd modes, respectively. The abscissa represents the fiber’s core scale, and the ordinate represents mode intensity. As stress is impacted in the vertical direction, HE31e surface strength was no longer flat. The quartered petal-shaped distribution gradually separated with increasing stress, and the top of the quartered distribution became irregular.
Figure 10a–f shows the phase distribution of HE31 mode under 1–200 MPa stress in the y direction. As the pressure increases, the isophase line becomes gradually irregular. However, phase distribution of HE31 satisfied phase characteristics of the OAM mode, and we concluded that the phase is insensitive to stress disturbances. Figure 11a–f shows the phase distribution of HE31 even and odd modes under the same situation. The first row represents even mode phase results, and the last row represents odd mode phase results. Figure 11 shows that phase distortion of HE31 even and odd modes worsened with increasing stress, and the phase difference between odd and even modes was π/4. The isophase lines in phase distribution were no longer smooth. With stress increase, the phase ambiguity of optical fiber became gradually serious, indicating that phase distortion was more serious. The phase distribution diagram shows that optical fiber can maintain stable OAM mode transmission within the selected stress range.
3.2.2. Polarization
Figure 12 shows the polarization distribution of HE31 mode under stress from 1MPa to 200 MPa in the y direction. In Figure 12, ellipticity represents polarization intensity [29], and change of polarization intensity in the vertical direction was faster than that in the horizontal direction. In Figure 12a, the ellipse shapes were almost perfect circles, indicating that the OAM mode synthesized by HEe ± iHEo in the fiber was almost only LCP light (or the RCP light). However, the ellipticities of the ellipses in Figure 12b were slightly larger, meaning that the light synthesized by HE31e ± iHE31o in the fiber was composed of both LCP light and RCP light. Thus, this synthesized light contains SAM and OAM. Ellipticities in Figure 4c–f are obvious, and were even larger, meaning that polarization of the synthesized OAM mode in fiber gradually increased with stress.
3.2.3. Loss Characteristics
Dispersion is an important factor causing optical fiber transmission signal distortion, which leads to communication quality decline and limited communication capacity. In optical fiber design, dispersion characteristics of optical fiber should be as flat as possible. According to [30], dispersion can be calculated using the following formula:
Figure 13 shows dispersion as a function of wavelength for different modes under different stress values. Dispersion of the new type C-PCF increased with stress variation, and the higher order mode was larger than the lower order mode. Dispersion is insensitive to pressure changes (the same color represent the same mode under different stress), so the designed optical fiber could keep good dispersion properties.
In the PCF structure, due to transverse distribution limitation, there is confinement loss in fiber structure, which is mainly determined by the imaginary part of the effective refractive index [31,32]. The calculation formula is as follows:
Figure 14a shows confinement loss as a function of stress for different modes, and Figure 14b shows confinement loss as a function of length for different modes under 100 MPa stress in the y direction. Confinement loss increases with stress variation, and increases with wavelength variation. The loss in the lower order mode was smaller than that in higher order mode, indicating that the lower order mode was more stable. In Figure 14, the solid line shows fiber confinement loss without stress, while the dotted line shows confinement loss under 100 MPa stress. Fiber has a low confinement loss and can provide good quality OAM modes.
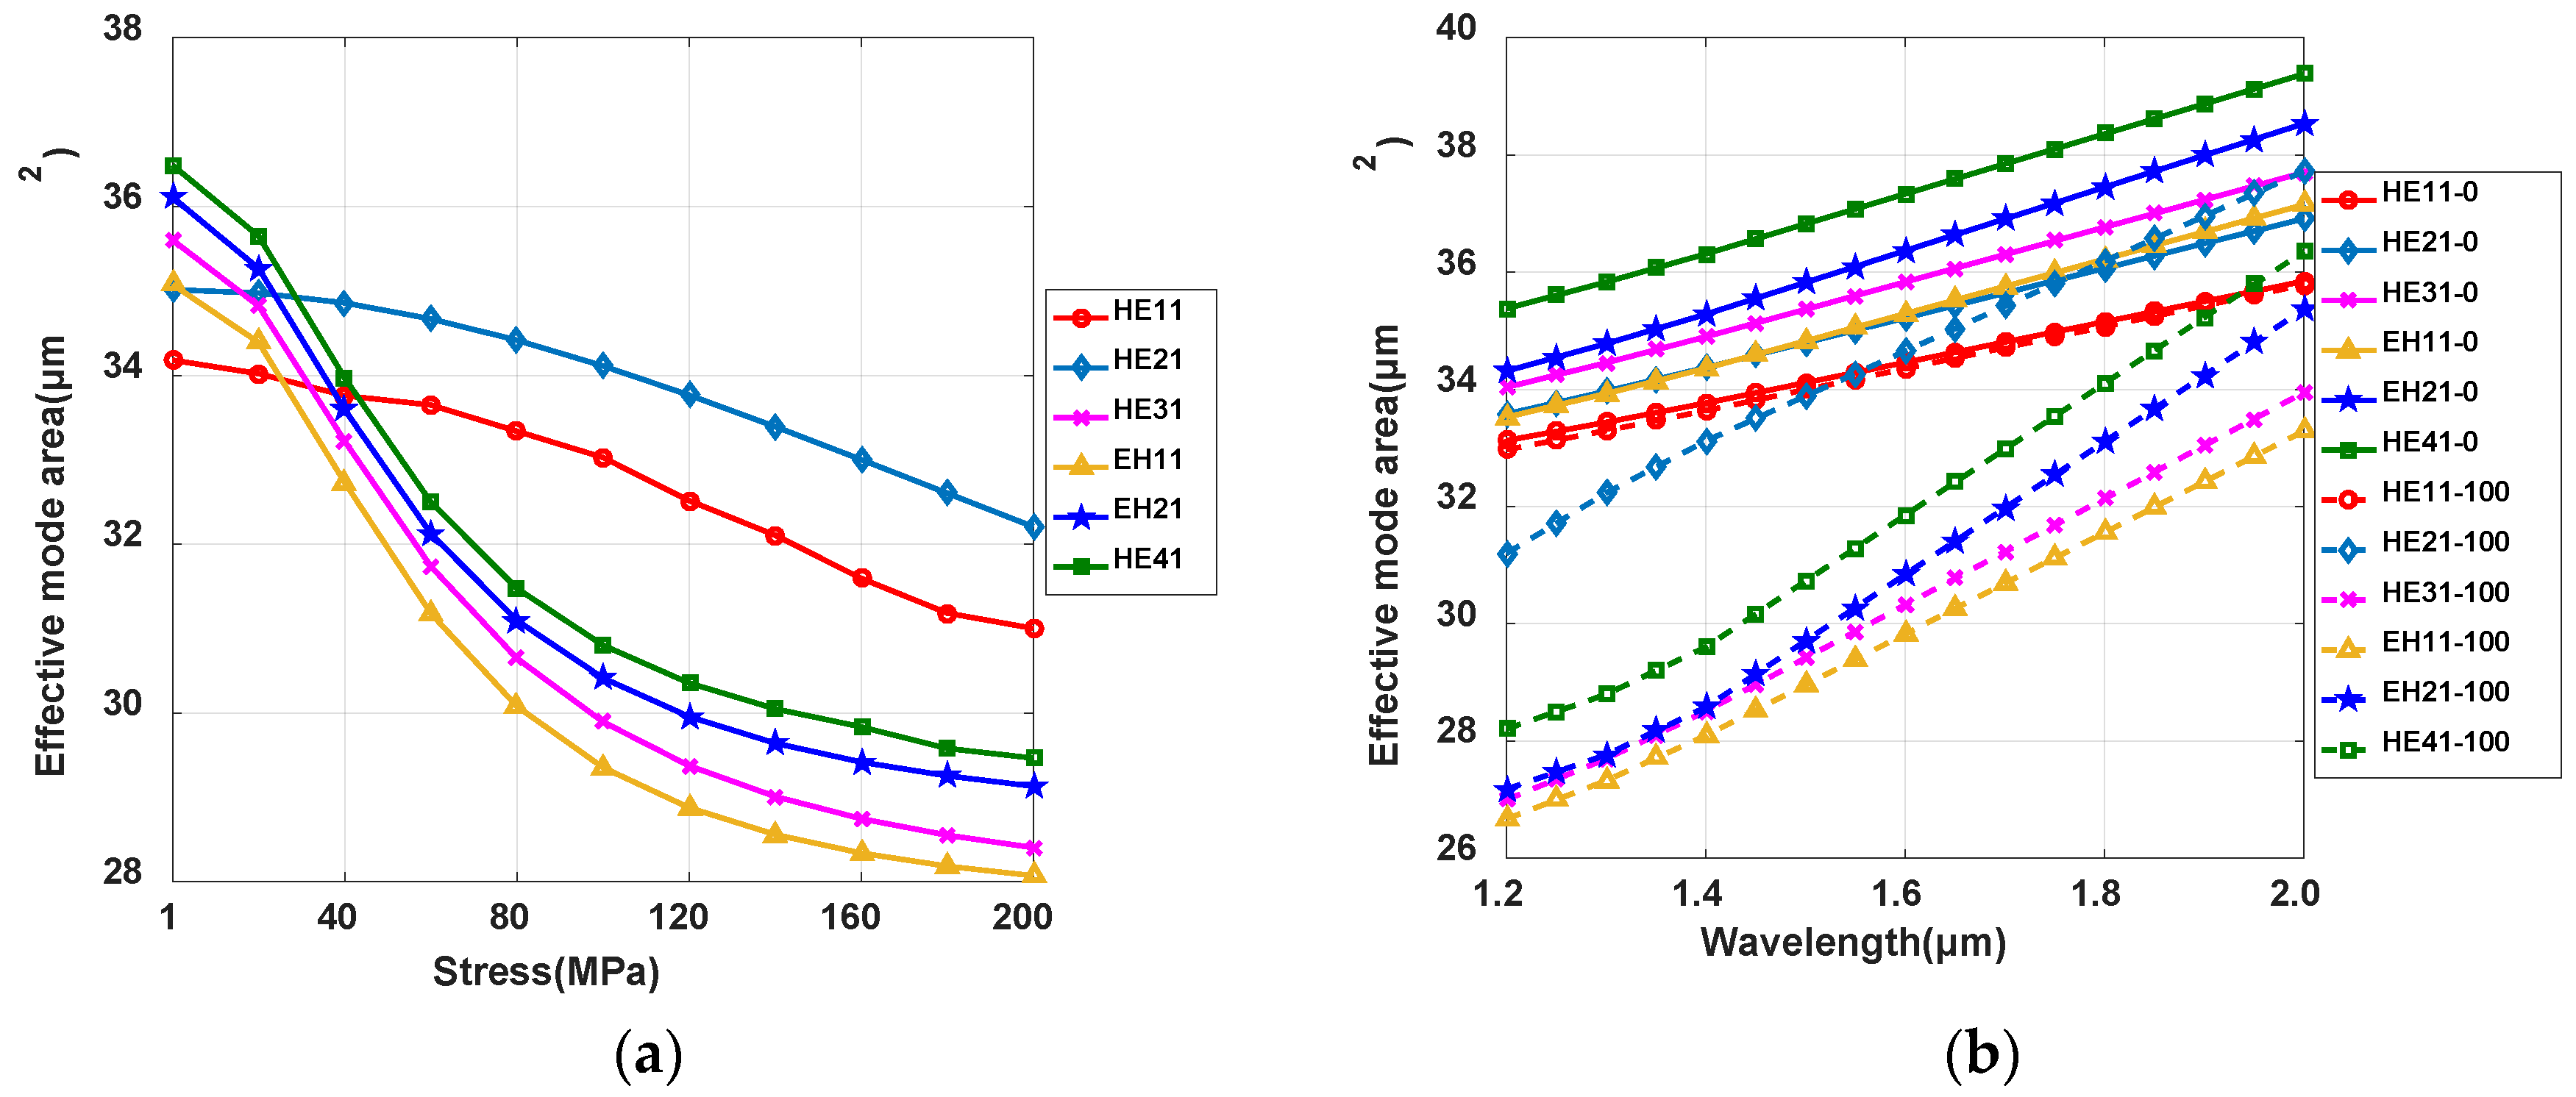
The nonlinear effect in optical fiber is also one of the main factors affecting the quality of mode transmission. A large effective mode field area is conducive to restraining the nonlinear effect in optical fiber. Therefore, it is necessary to generate fiber structure with a large effective mode field area as far as possible, so as to improve the quality of mode transmission. The area of the effective mode field can be obtained by the following formula [33]:
The formula for calculating the nonlinear coefficient is:
Figure 15a shows effective mode area as a function of stress for different modes, and Figure 15b shows an effective mode area as a function of wavelength for different modes under 100 MPa stress in the y direction. Effective mode area decreased with increasing stress, and increased with increasing wavelength. Compared to the higher order mode, the effective mode area of the lower order mode was not sensitive stress. Figure 16a shows the nonlinear parameter as a function of stress for different modes, and Figure 16b shows the nonlinear parameter as a function of wavelength for different modes under 100 MPa stress in the y direction. Nonlinear parameter increased with increasing stress, while it decreased with increasing wavelength. The variation trend of the nonlinear parameter was the opposite to that of the effective mode area. Higher order modes were more sensitive to wavelength.
3.3. Stress-Induced Birefringence
The modal birefringence is an important parameter for reflecting OAM fiber performance. Figure 17 shows the stress-induced birefringence of the vector modes as a function of stress. It shows that stress-induced birefringence increased with increasing stress. Birefringence in the lower order mode was larger than that in the higher order mode. The difference of effective refractive indices between even and odd modes decides the stress-induced birefringence. The higher order model had smaller birefringence compared to the lower order model, so it had better stress resistance. Birefringence curves of the same mode group were close to each other, while birefringence curves of different mode groups were separated. Therefore, the effect of stress-induced birefringence should be considered in MDM systems.
4. Conclusions
In this article, a complete numerical dispersion theory framework, in relation to processing PCF fiber birefringence patterns, is established. We deducted the mathematical model for the OAM mechanism, which can now be used to calculate stress birefringence of any irregularly shaped fiber core. Furthermore, the model was simulated by structural mechanics and wave optics modules using the COMSOL software. Considering that fiber core symmetry changed due to fiber force, conclusions can be drawn through the above theoretical calculation and simulation analysis, and verified by the transmission characteristics of hollow-core C-PCF. At first, the intensity and phase of the OAM modes remain relatively stable within the range of actual stress. For another, this kind of new designed hollow-core C-PCF could keep a low loss under stress. Modal birefringence for the hollow-core C-PCF is sensitive to stress. The study of transmission characteristics provides basic theoretical research for mode division multiplexing, and improves the quality and performance of optical fiber communication systems.
Author Contributions
Methodology, X.Y.; software, H.Z.; validation, G.Z.; formal analysis, X.Y.; resources, G.Z. and H.Z.; writing—original draft preparation, X.Y.; funding acquisition, G.Z. X.X. and H.Z.; writing-review and editing, X.Y. and H.L.
Funding
This work was supported by the National Natural Science Foundation of China (NSFC) [61571057, 61527820, 61575082].
Conflicts of Interest
The authors declare no conflict of interest.
References
- Essiambre, R.J.; Kramer, G.; Winzer, P.J.; Foschini, G.J.; Goebel, B. Capacity limits of optical fiber networks. J. Light. Technol. 2010, 28, 662–701. [Google Scholar] [CrossRef]
- Chen, H.; Zhuang, Y. Research progress on key technologies in mode division multiplexing system. J. Nanjing Univ. Posts Telecommun. 2018, 38, 37–44. [Google Scholar]
- Huang, H.; Milione, G.; Lavery, M.P.; Xie, G.; Ren, Y.; Cao, Y.; Ahmed, N.; Nguyen, T.A.; Nolan, D.A.; Li, M.-J.; et al. Mode division multiplexing using an orbital angular momentum mode sorter and MIMO-DSP over a graded-index few-mode optical fiber. Sci. Rep. 2015, 5, 14931. [Google Scholar] [CrossRef] [PubMed]
- Wang, L.; Vaity, P.; Messaddeq, Y.; Rusch, L.; LaRochelle, S. Orbital-angular-momentum polarization mode dispersion in optical fibers and its measurement technique. In Proceedings of the 2015 European Conference on Optical Communication (ECOC), Valencia, Spain, 27 September–1 October 2015. [Google Scholar]
- Puttnam, B.J.; Luís, R.S.; Klaus, W.; Sakaguchi, J.; Mendinueta, J.-M.D.; Awaji, Y.; Wada, N.; Tamura, Y.; Hayashi, T.; Hirano, M.; et al. 2.15 Pb/s transmission using a 22 core homogeneous single-mode multi-core fiber and wideband optical comb. In Proceedings of the 2015 European Conference on Optical Communication (ECOC), Valencia, Spain, 27 September–1 October 2015. [Google Scholar]
- Chu, P.; Sammut, R. Analytical method for calculation of stresses and material birefringence in polarization-maintaining optical fiber. J. Light. Technol. 1984, 2, 650–662. [Google Scholar]
- Tsai, K.H.; Kim, K.S.; Morse, T.F. General solutions for stress-induced polarization in optical fibers. J. Light. Technol. 1991, 9, 7–17. [Google Scholar] [CrossRef]
- Yu, P.; Ji, M. Stress element analysis method of the birefringence in stress- induced fiber. Laser Optoelectron. Prog. 2014, 52, 020604. [Google Scholar]
- Philip, R. Photonic crystal fibers. Science 2003, 299, 358–362. [Google Scholar]
- Yue, Y.; Zhang, L.; Yan, Y.; Ahmed, N.; Yang, J.; Huang, H.; Ren, Y.; Dolinar, S.; Tur, M.; Willner, A.E. Octave-spanning supercontinuum generation of vortices in an As2S3 ring photonic crystal fiber. Opt. Lett. 2012, 37, 1889–1891. [Google Scholar] [CrossRef] [PubMed]
- St Russell, P.; Beravat, R.; Wong, G.K.L. Helically twisted photonic crystal fibres. Philosophical Transactions of the Royal Society A: Mathematical. Phys. Eng. Sci. 2017, 375, 20150440. [Google Scholar] [CrossRef] [PubMed]
- Zhang, L.; Wei, W.; Zhang, Z.; Liao, W.; Yang, Z.; Fan, W.; Li, Y. Propagation properties of vortex beams in a ring photonic crystal fiber. Acta Phys. Sin. 2017, 66, 014205. [Google Scholar]
- Tian, W.; Zhang, H.; Zhang, X.; Xi, L.; Zhang, W.; Tang, X. A circular photonic crystal fiber supporting 26 OAM modes. Opt. Fiber Technol. 2016, 30, 184–189. [Google Scholar] [CrossRef]
- Park, Y.; Paek, U.; Kim, D.Y. Determination of stress-induced intrinsic birefringence in a single-mode fiber by measurement of the two-dimensional stress profile. Opt. Lett. 2002, 27, 1291–1293. [Google Scholar] [CrossRef] [PubMed]
- Galtarossa, A.; Palmieri, L.; Schiano, M.; Tambosso, T. Statistical characterization of fiber random birefringence. Opt. Lett. 2000, 25, 1322–1324. [Google Scholar] [CrossRef] [PubMed]
- Wang, L.; Vaity, P.; Chatigny, S.; Messaddeq, Y.; Rusch, L.A.; LaRochelle, S. Orbital-Angular-Momentum Polarization Mode Dispersion in Optical Fibers. J. Light. Technol. 2014, 34, 1661–1671. [Google Scholar] [CrossRef]
- Brunet, C.; Ung, B.; Wang, L.; Messaddeq, Y.; LaRochelle, S.; Rusch, L.A. Design of a family of ring-core fibers for OAM transmission studies. Opt. Express 2015, 23, 10553–10563. [Google Scholar] [CrossRef] [PubMed]
- Bréchet, F.; Marcou, J.; Pagnoux, D.; Roy, P. Complete analysis of the characteristics of propagation into photonic crystal fibers, by the finite element method. Opt. Fiber Technol. 2000, 6, 181–191. [Google Scholar] [CrossRef]
- Willner, A.E.; Huang, H.; Yan, Y.; Ren, Y.; Ahmed, N.; Xie, G.; Bao, C.; Li, L.; Cao, Y.; Zhao, Z.; Wang, J.; et al. Optical communications using orbital angular momentum beams. Adv. Opt. Photonics 2015, 7, 66–106. [Google Scholar] [CrossRef]
- Brunet, C.; Vaity, P.; Messaddeq, Y.; LaRochelle, S.; Rusch, L.A. Design, fabrication and validation of an OAM fiber supporting 36 states. Opt. Express 2014, 22, 26117–26127. [Google Scholar] [CrossRef] [PubMed]
- Menyuk, C.R.; Wai, P.K.A. Polarization evolution and dispersion in fibers with spatially varying birefringence. J. Opt. Soc. Am. B 1994, 11, 1288–1296. [Google Scholar] [CrossRef]
- Bakhshali, A.; Chan, W.Y.; Cartledge, J.C.; O’Sullivan, M.; Laperle, C.; Borowi, A. Frequency-Domain Volterra-Based Equalization Structures for Efficient Mitigation of Intrachannel Kerr Nonlinearities. J. Light. Technol. 2016, 34, 1770–1777. [Google Scholar] [CrossRef]
- Shibata, N.; Okamoto, K.; Tateda, M.; Seikai, S.; Sasaki, Y. Modal birefringence and polarization mode dispersion in single-mode fibers with stress-induced anisotropy. IEEE J. Quant. Electron. 1989, 19, 1110–1115. [Google Scholar] [CrossRef]
- Zhang, H.; Zhang, W.; Xi, L.; Tang, X.; Zhang, X.; Zhang, X. A New Type Circular Photonic Crystal Fiber for Orbital Angular Momentum Mode Transmission. IEEE Photonics Technol. Lett. 2016, 28, 1426–1429. [Google Scholar] [CrossRef]
- Zhang, H.; Zhang, X.; Li, H.; Deng, Y.; Zhang, X.; Xi, L.; Tang, X.; Zhang, W. A design strategy of the circular photonic crystal fiber supporting good quality orbital angular momentum mode transmission. Opt. Commun. 2017, 397, 59–66. [Google Scholar] [CrossRef]
- Li, H.; Zhang, H.; Zhang, X.; Deng, Y.; Xi, L.; Tang, X.; Zhang, W. Design tool for circular photonic crystal fibers supporting orbital angular momentum modes. Appl. Opt. 2018, 57, 2474–2481. [Google Scholar]
- Zhu, Z.; Brown, T.G. Stress-induced birefringence in micro structured optical fibers. Opt. Lett. 2003, 28, 2306–2308. [Google Scholar] [CrossRef] [PubMed]
- Schreiber, T.; Schultz, H.; Schmidt, O.; Röser, F.; Limpert, J.; Tünnermann, A. Stress-induced birefringence in large-mode-area micro-structured optical fibers. Opt. Express 2005, 13, 3637–3646. [Google Scholar] [CrossRef] [PubMed]
- Zhang, Z.; Gan, J.; Heng, X.; Wu, Y.; Li, Q.; Qian, Q.; Chen, D.; Yang, Z. Optical fiber design with orbital angular momentum light purity higher than 99.9%. Opt. Express 2015, 23, 29331–29341. [Google Scholar] [CrossRef] [PubMed]
- Xu, H.; Wu, J.; Xu, K.; Dai, Y.; Xu, C.; Lin, J. Ultra-flattened chromatic dispersion control for circular photonic crystal fibers. J. Opt. 2011, 13, 994–1001. [Google Scholar] [CrossRef]
- Varnham, M.P.; Payne, D.N.; Barlow, A.J.; Birch, R.D. Analytic solution for the birefringence produced the thermal stress in polarization-maintaining optical fibres. J. Light. Technol. 1983, LT-1, 332–339. [Google Scholar] [CrossRef]
- Maji, P.S.; Chaudhuri, P.R. Circular photonic crystal fibers: Numerical analysis of chromatic dispersion and losses. ISRN Opt. 2013, 2013, 986924. [Google Scholar] [CrossRef]
- Tandjè, A.; Yammine, J.; Bouwmans, G.; Dossou, M.; Vianou, A.; Andresen, E.R.; Bigot, L. Design and Fabrication of a Ring-Core Photonic Crystal Fiber for Low-Crosstalk Propagation of OAM Modes. In Proceedings of the 2018 European Conference on Optical Communication (ECOC), Rome, Italy, 23–27 September 2018. [Google Scholar]
Figure 1.
Diagram of stress decomposition.

Figure 2.
(a) Hollow-core C-PCF cross section without stress; (b) hollow-core C-PCF deformed under x direction external force; (c) hollow-core C-PCF deformed under y direction external force
Figure 2.
(a) Hollow-core C-PCF cross section without stress; (b) hollow-core C-PCF deformed under x direction external force; (c) hollow-core C-PCF deformed under y direction external force

Figure 3.
(a) Effective refractive index as a function of stress for different modes; (b) effective index difference between even and odd modes as a function of stress.
Figure 3.
(a) Effective refractive index as a function of stress for different modes; (b) effective index difference between even and odd modes as a function of stress.

Figure 4.
(a) Effective refractive index as a function of wavelength for different modes; (b) effective index difference between even and odd modes as a function of wavelength under 100 MPa stress in the y direction.
Figure 4.
(a) Effective refractive index as a function of wavelength for different modes; (b) effective index difference between even and odd modes as a function of wavelength under 100 MPa stress in the y direction.
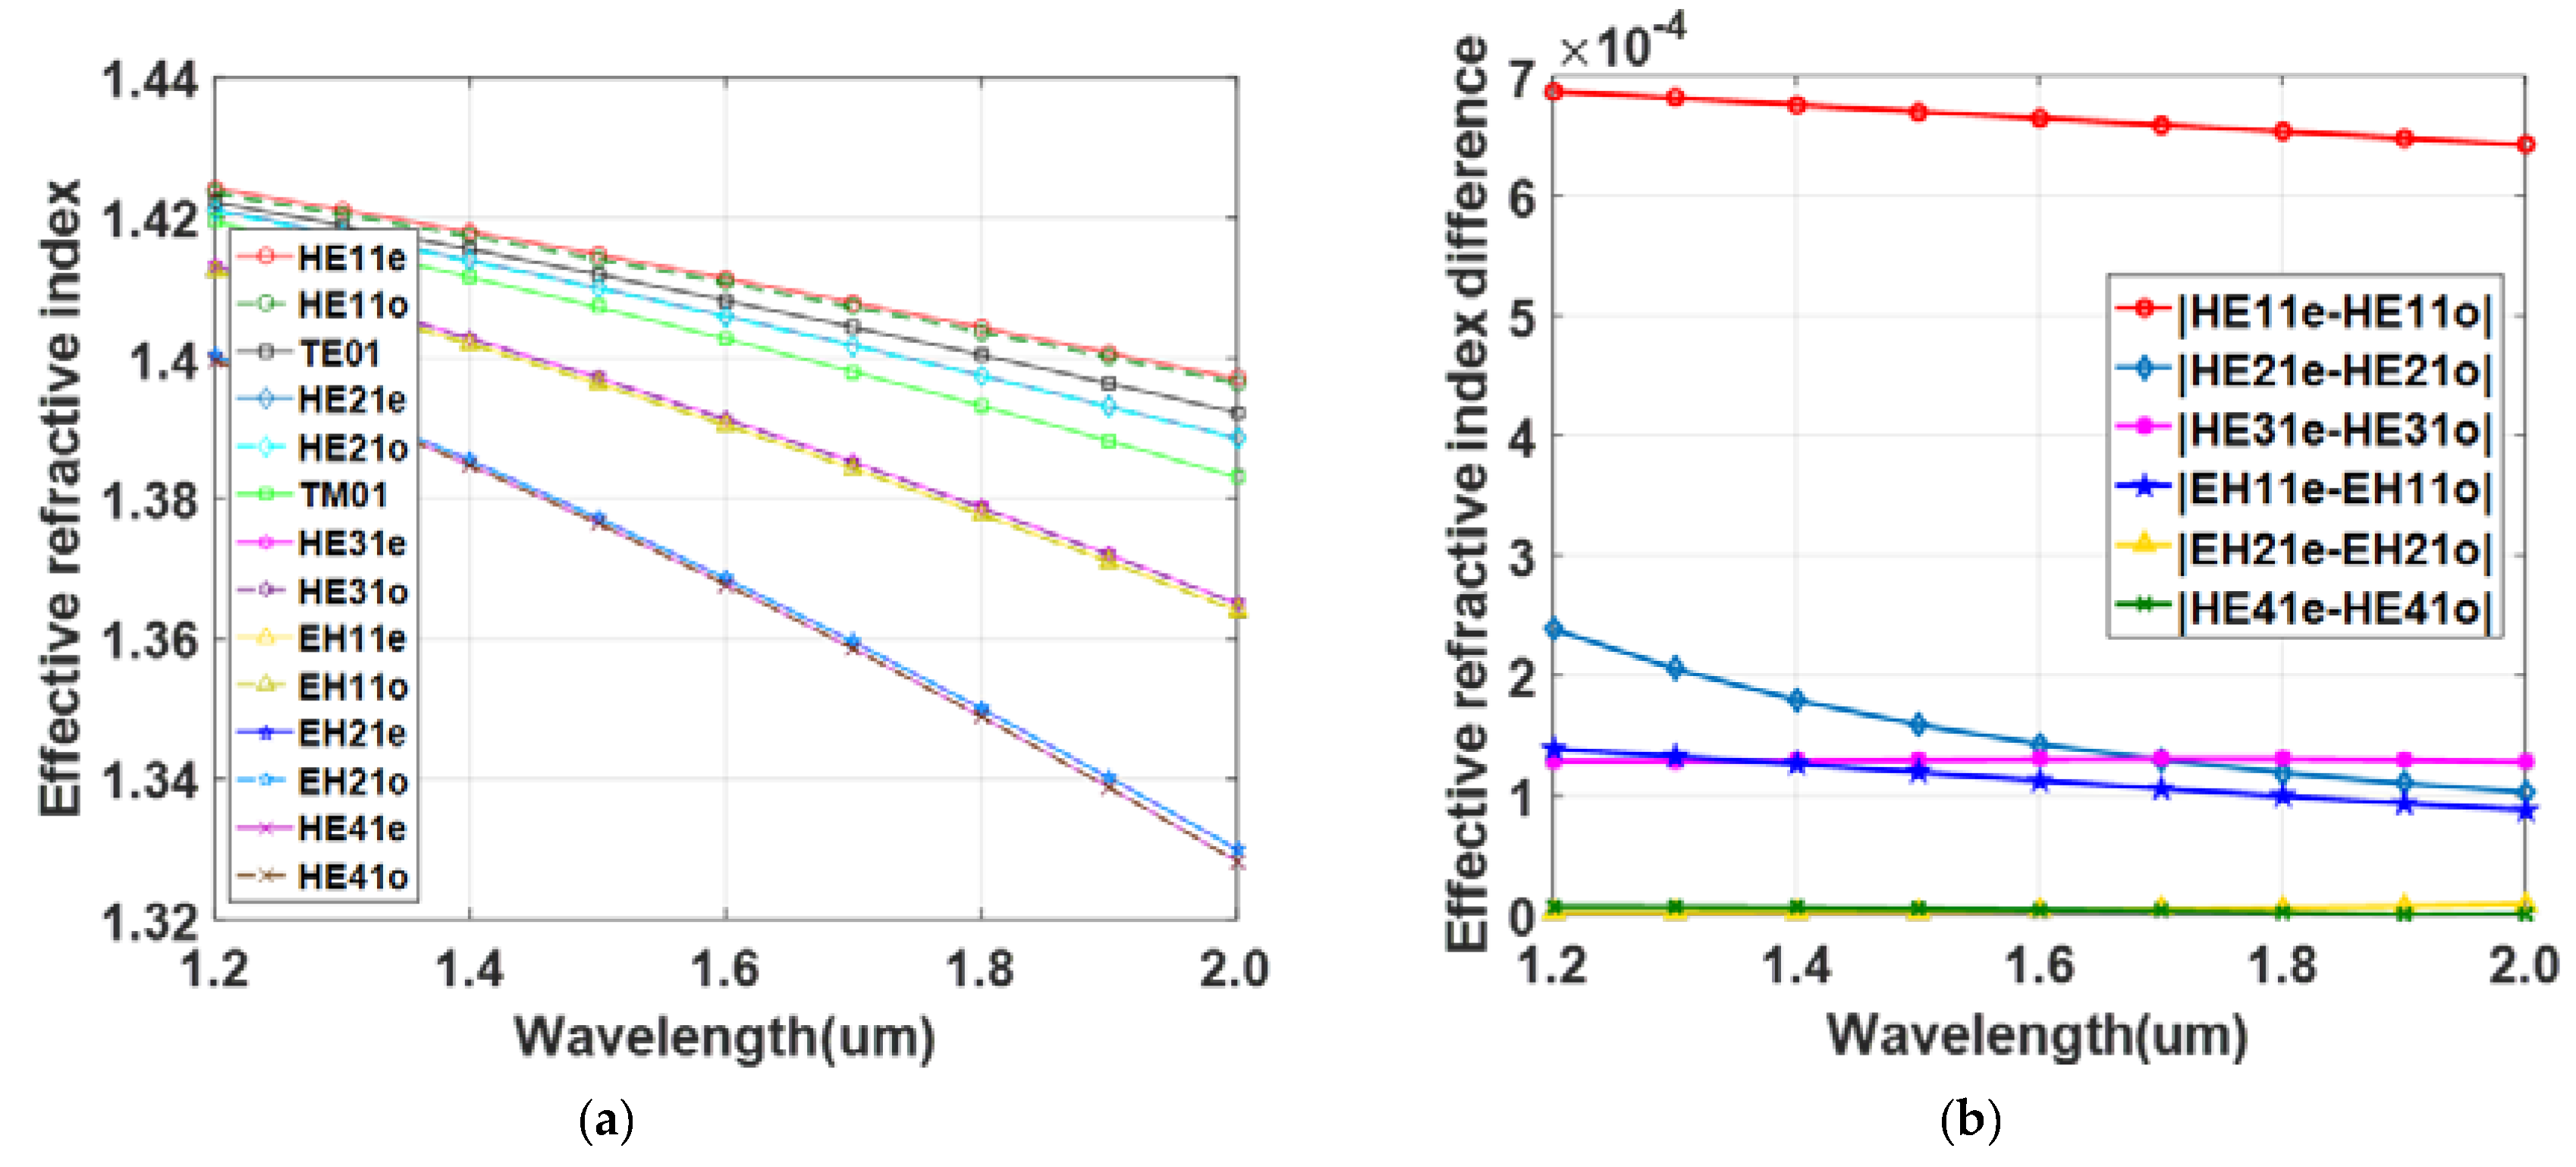
Figure 5.
The normalized intensity distribution of HE31 under 1–200 MPa stress in the y direction.

Figure 6.
Intensity distribution of the axis cross-section in HE31 mode under the 1–200 MPa stress in the y direction.
Figure 6.
Intensity distribution of the axis cross-section in HE31 mode under the 1–200 MPa stress in the y direction.

Figure 7.
The normalized intensity distribution for the even mode of HE31 under 1–200 MPa stress in the y direction.
Figure 7.
The normalized intensity distribution for the even mode of HE31 under 1–200 MPa stress in the y direction.
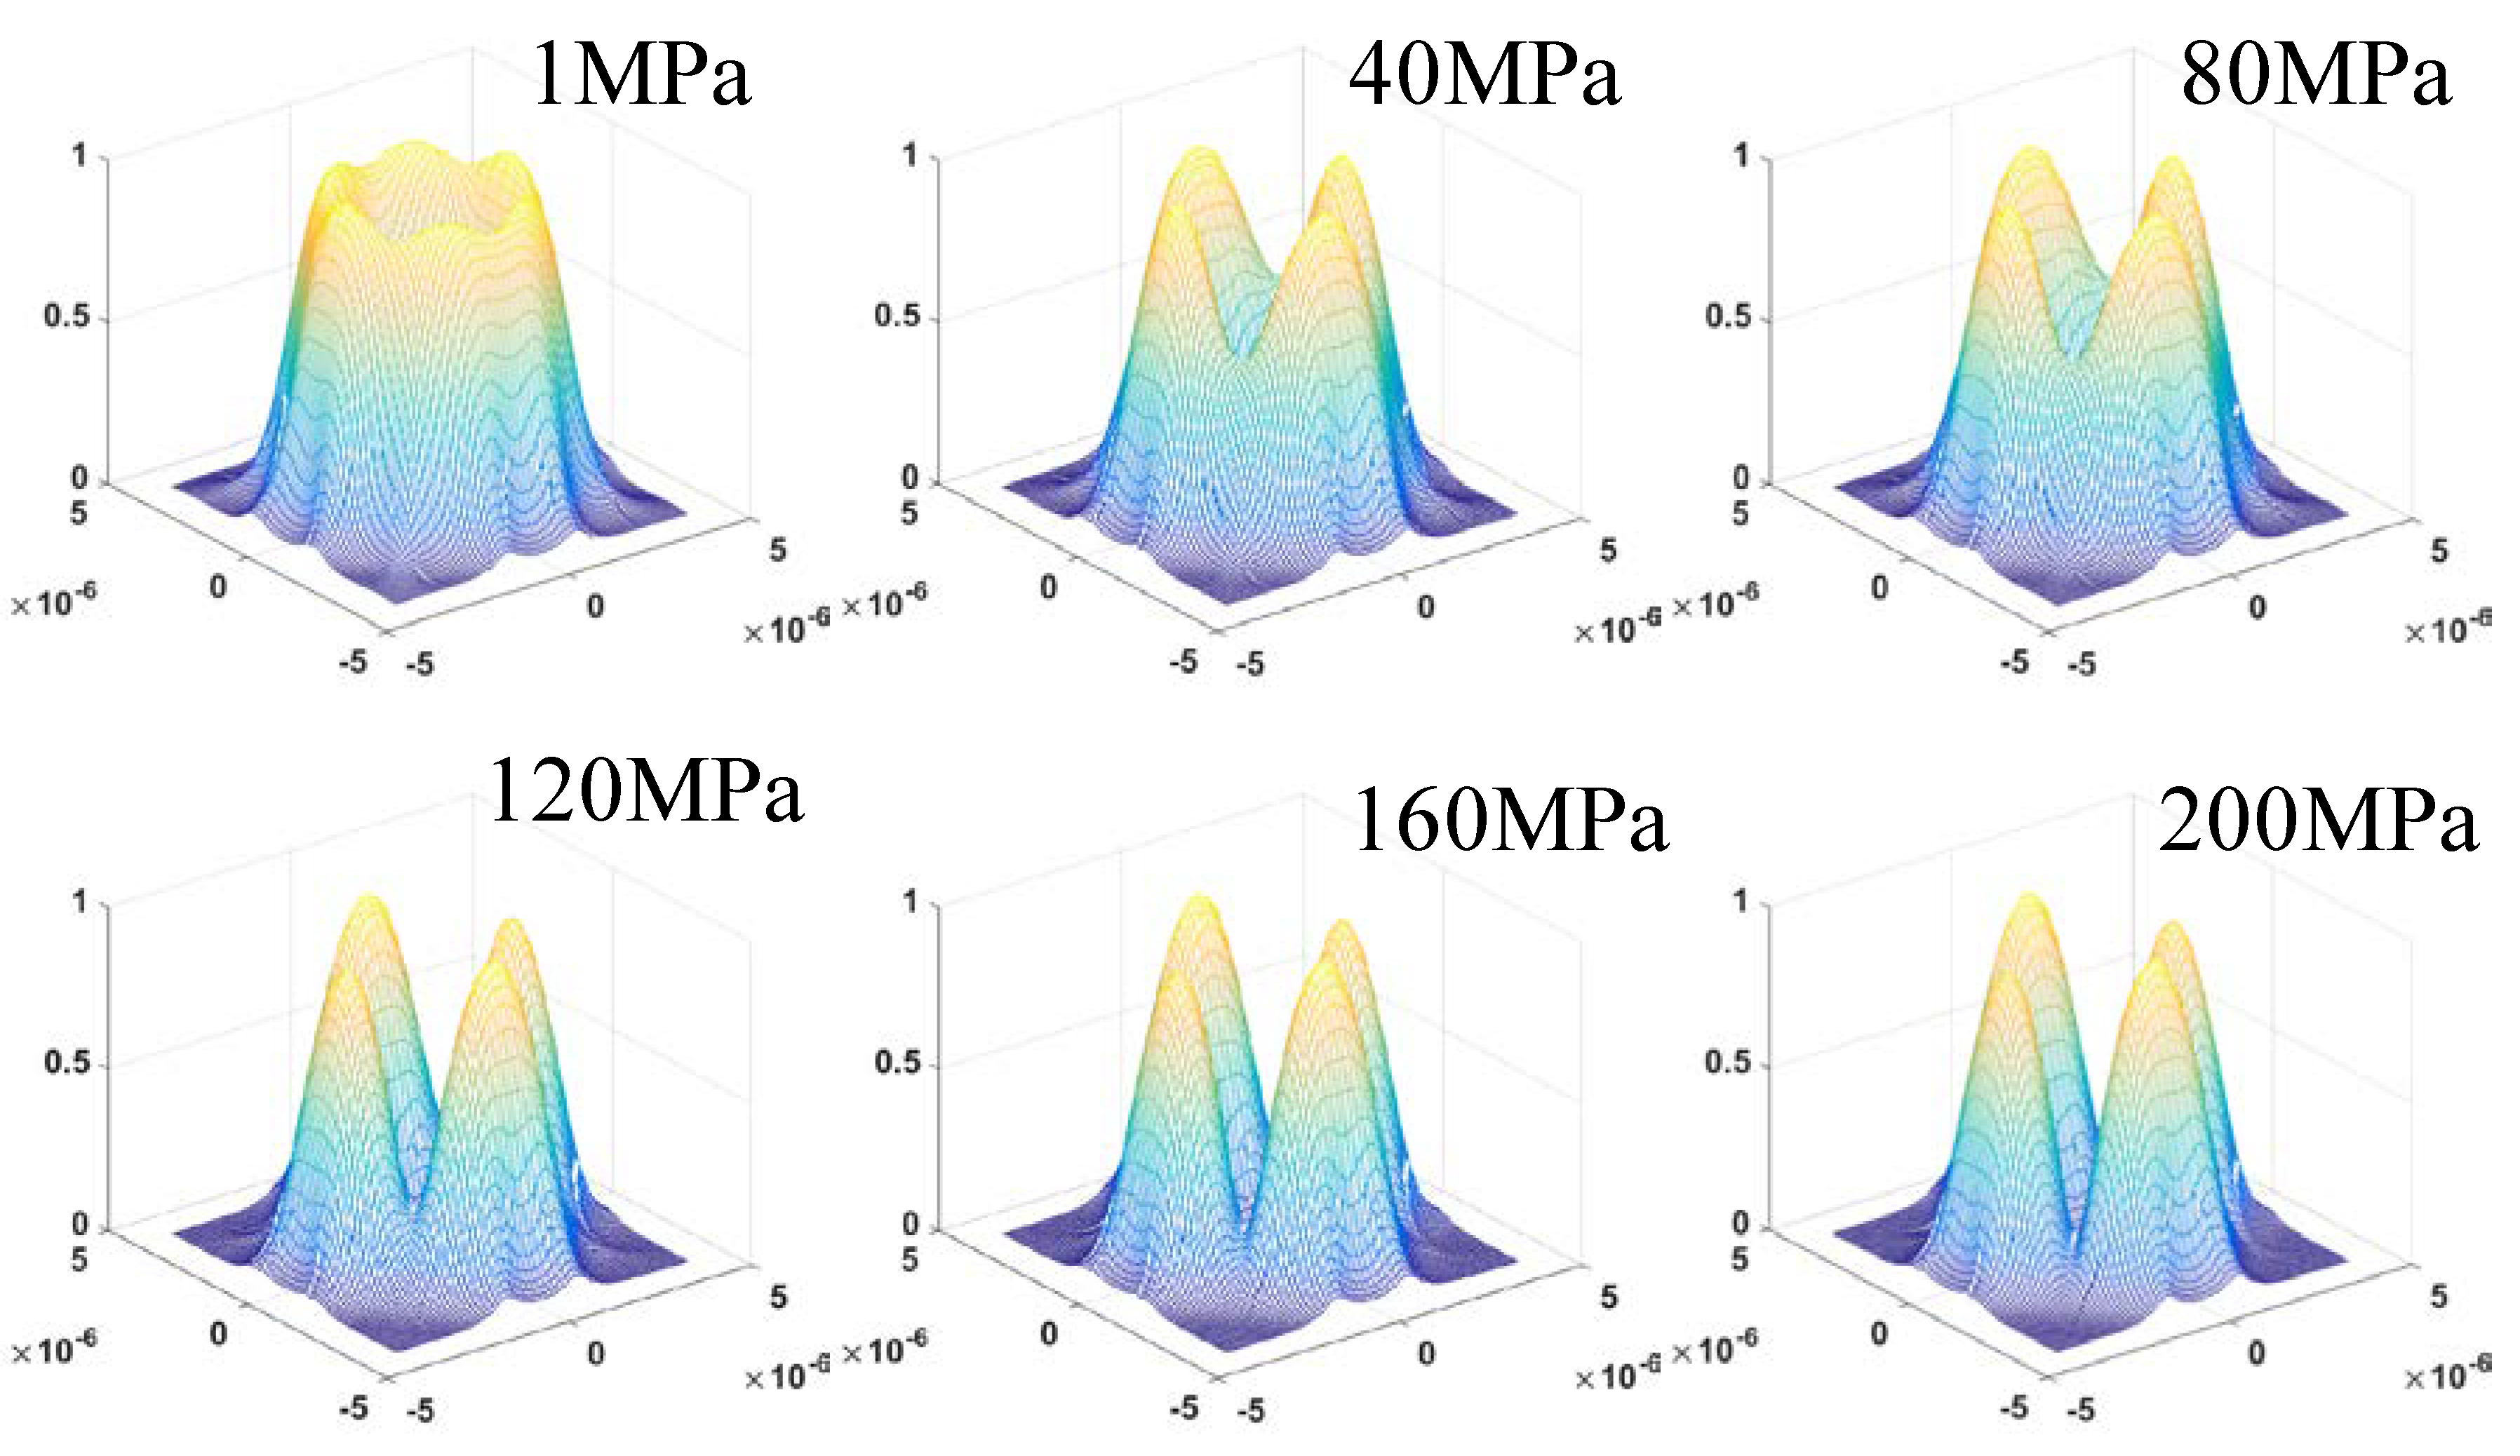
Figure 8.
The normalized intensity distribution for the odd mode of HE31 under 1–200 MPa stress in the y direction.
Figure 8.
The normalized intensity distribution for the odd mode of HE31 under 1–200 MPa stress in the y direction.

Figure 9.
The intensity distribution of the axis cross-section in even and odd modes of HE31 under 1–200 MPa stress in the y direction.
Figure 9.
The intensity distribution of the axis cross-section in even and odd modes of HE31 under 1–200 MPa stress in the y direction.

Figure 10.
Phase distribution of HE31 under 1–200 MPa stress in the y direction.
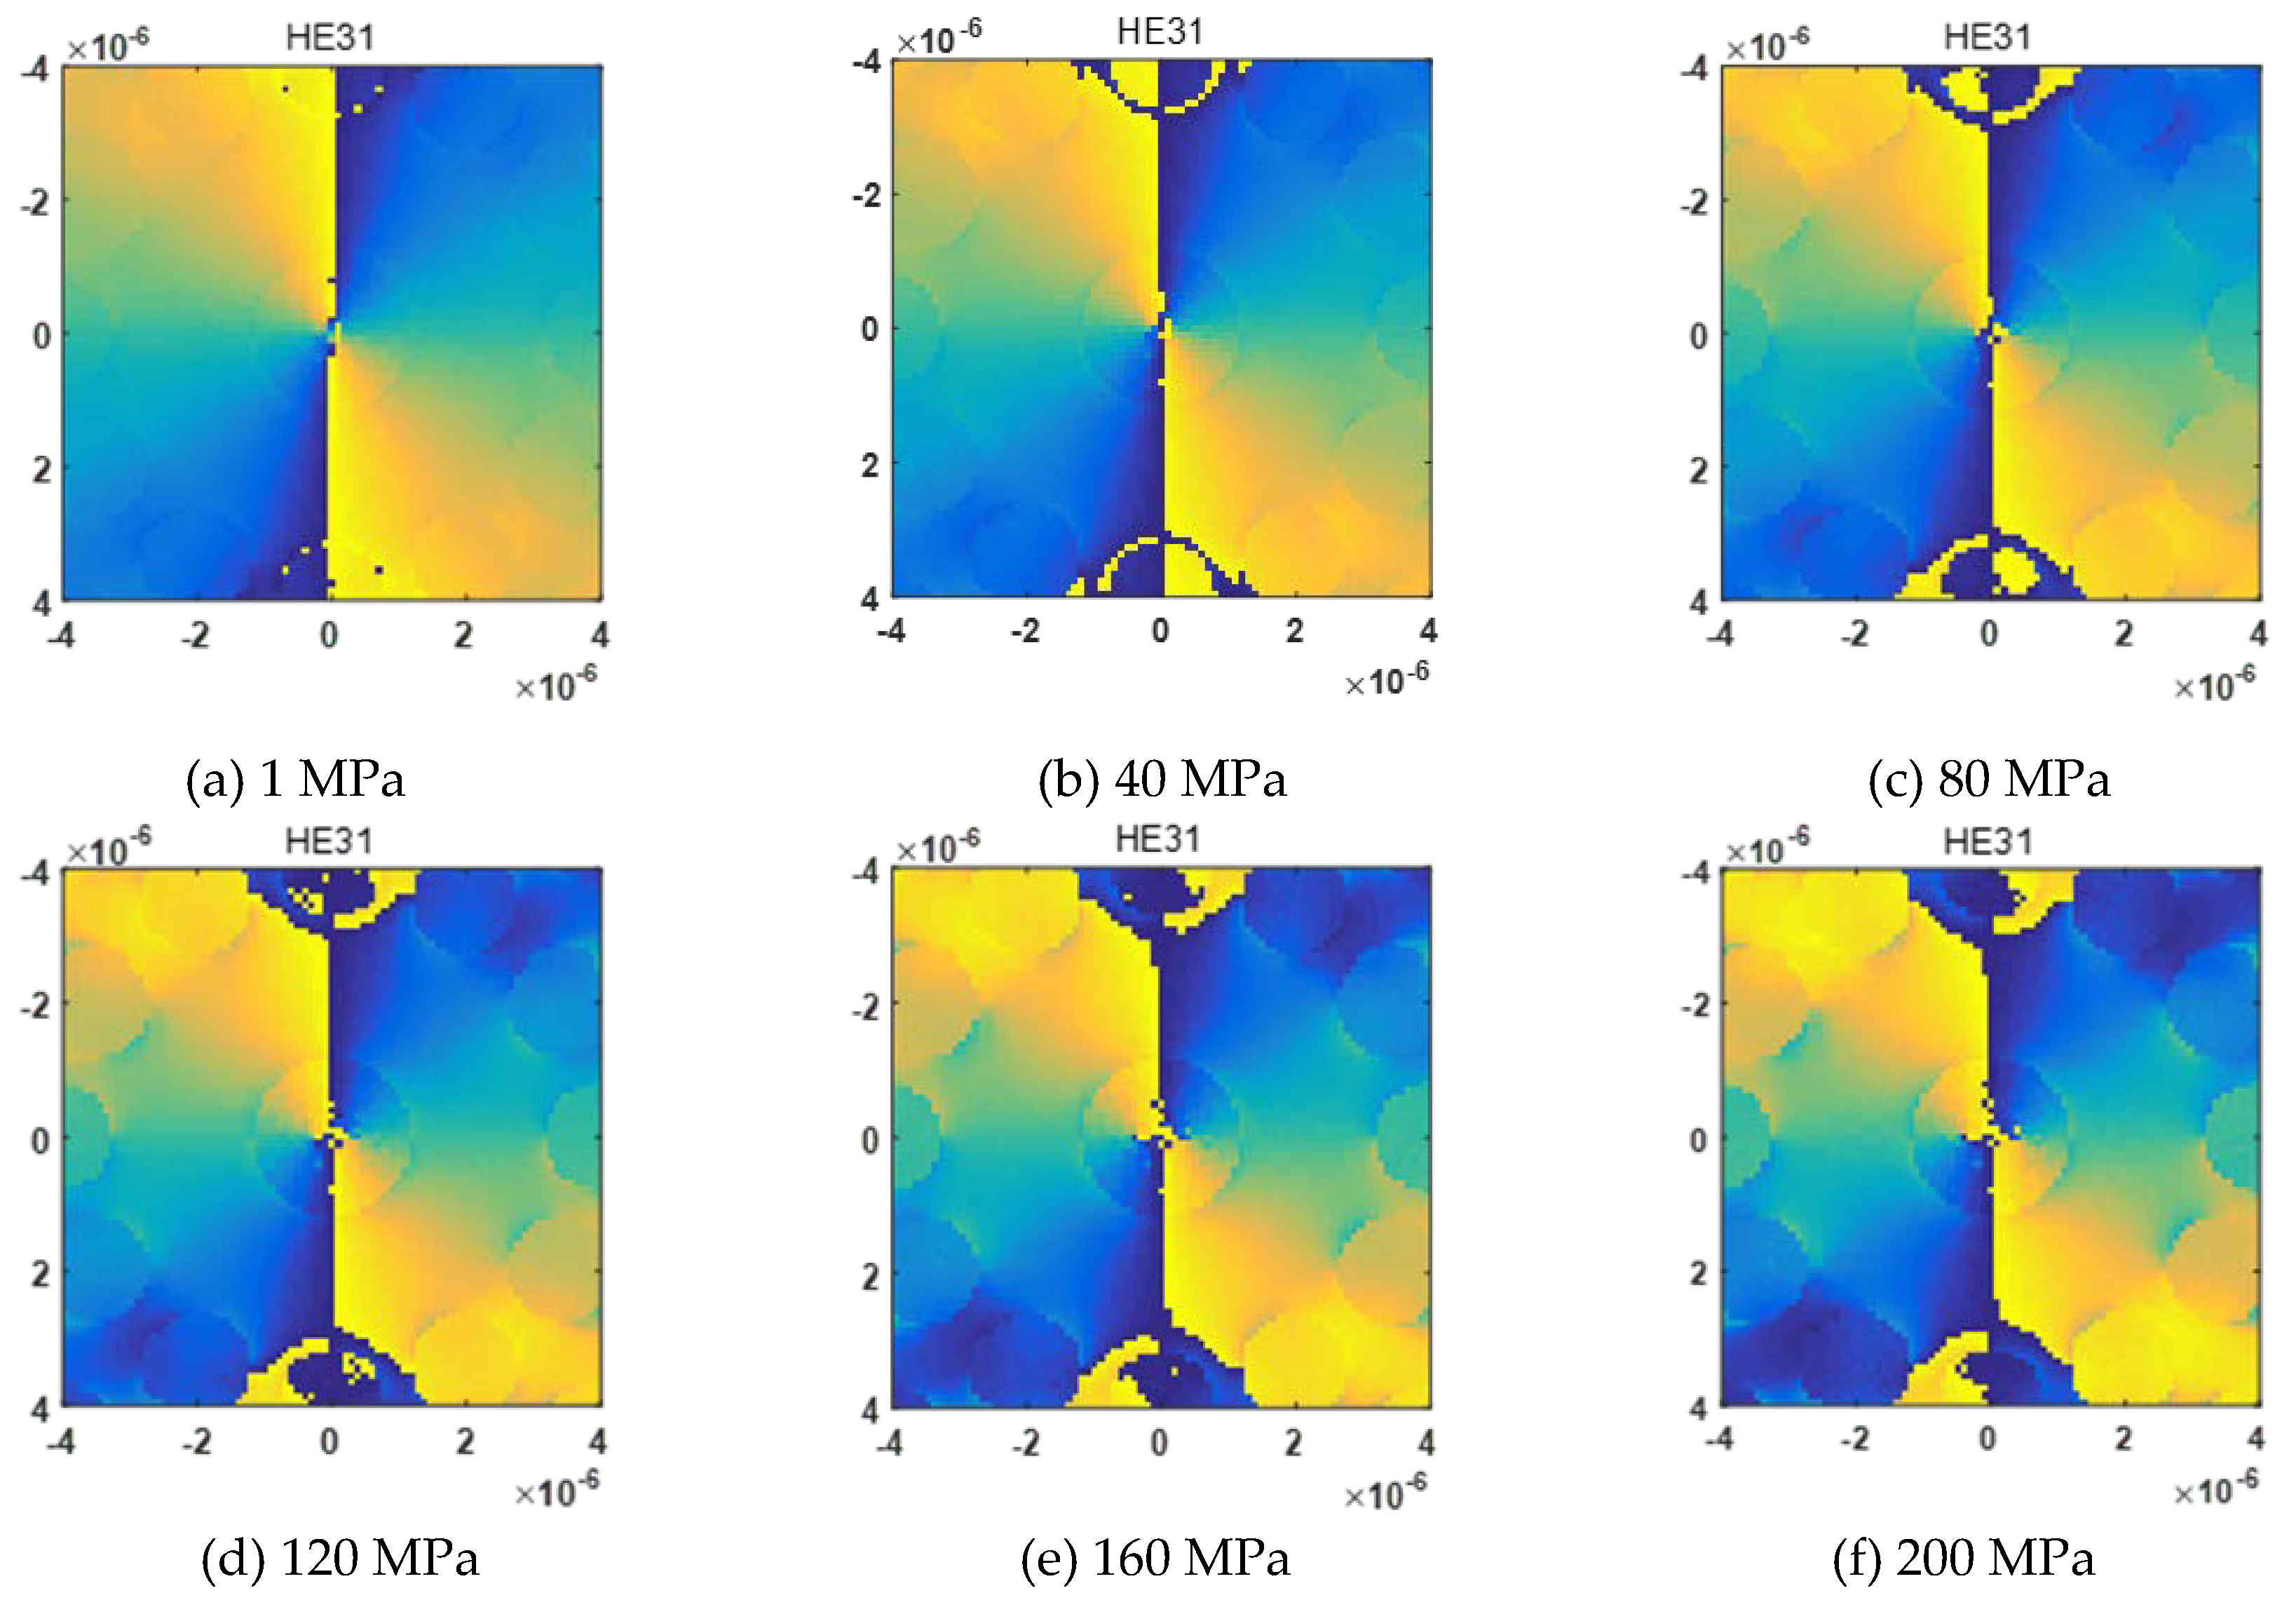
Figure 11.
Phase distribution of HE31 even and odd modes under the stress from 1 MPa to 200 MPa in the y direction.
Figure 11.
Phase distribution of HE31 even and odd modes under the stress from 1 MPa to 200 MPa in the y direction.
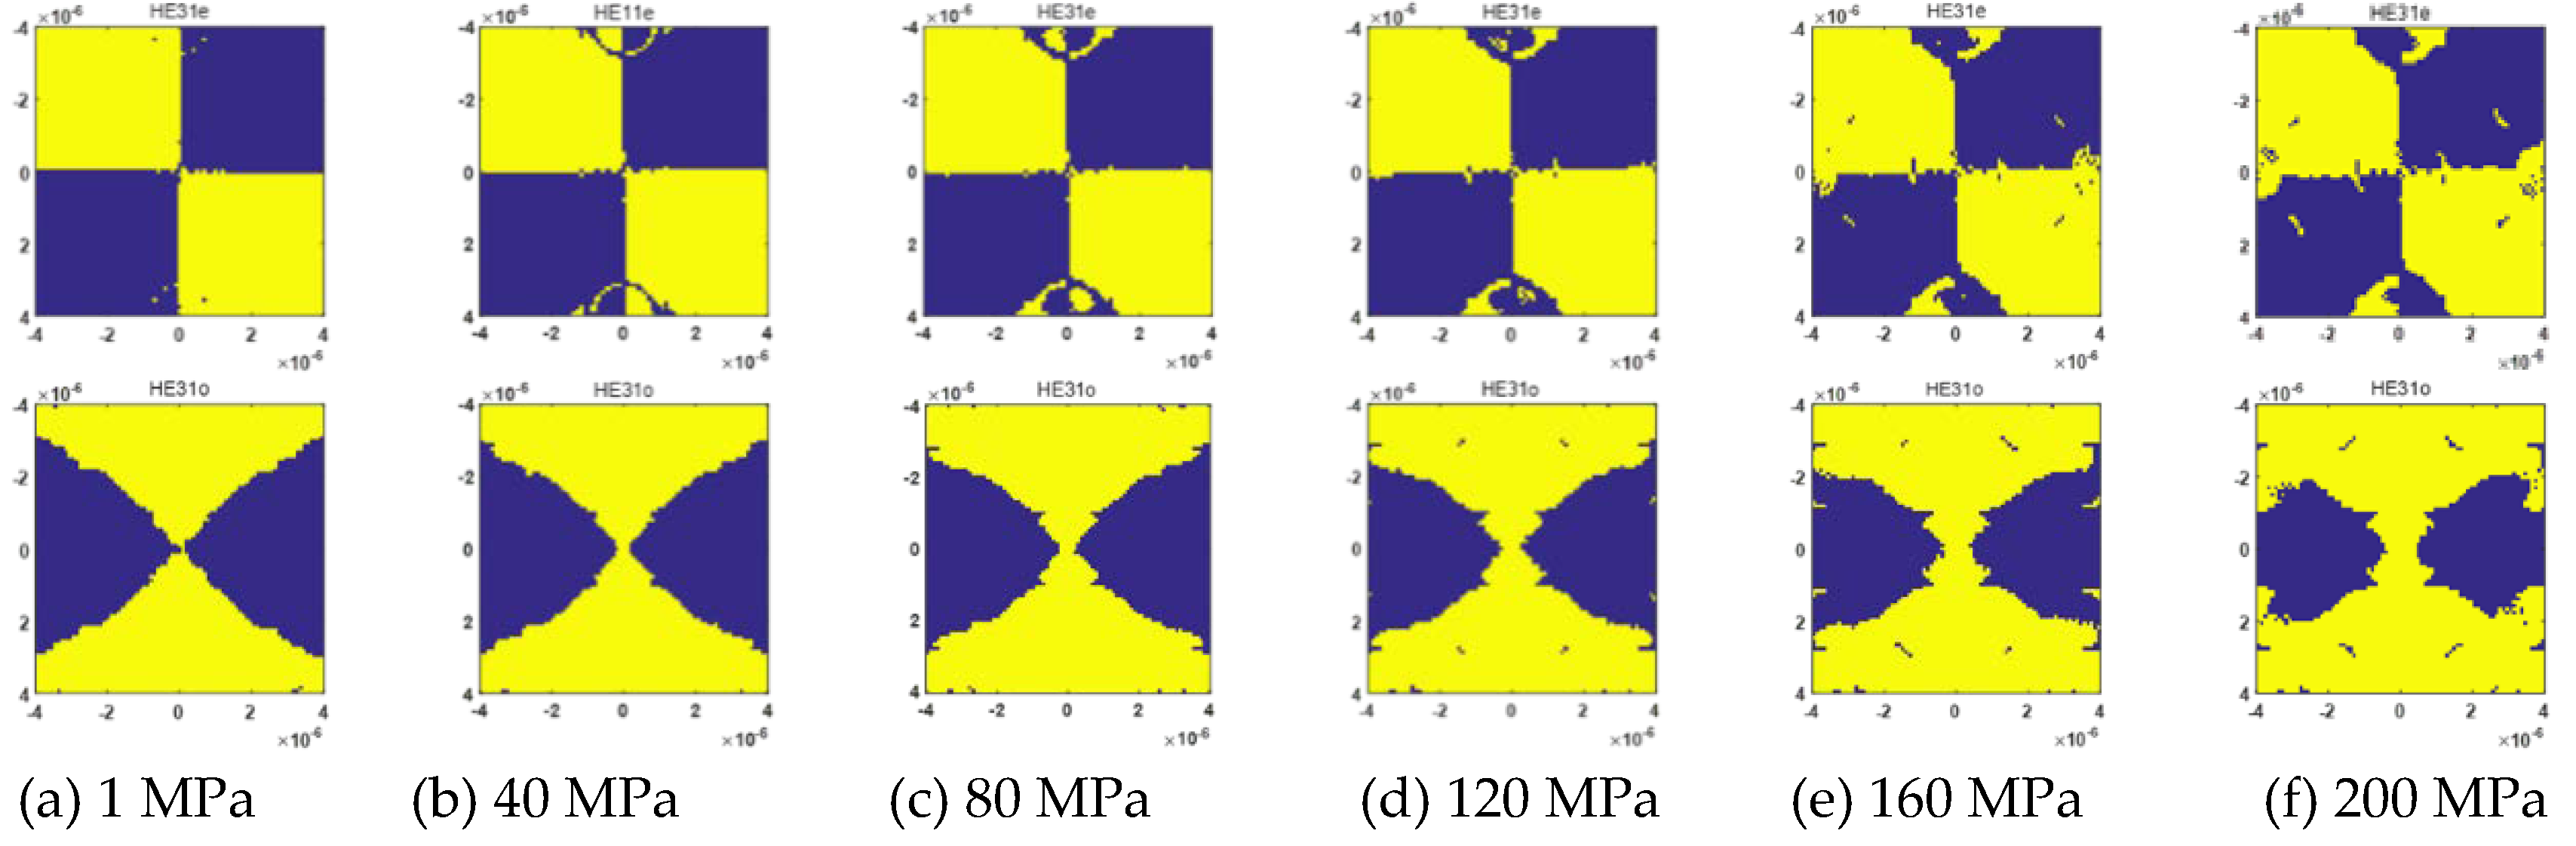
Figure 12.
Polarization distribution of HE31 mode under stress from 1MPa to 200 MPa in the y direction.
Figure 12.
Polarization distribution of HE31 mode under stress from 1MPa to 200 MPa in the y direction.

Figure 13.
Dispersion as a function of wavelength for different modes.
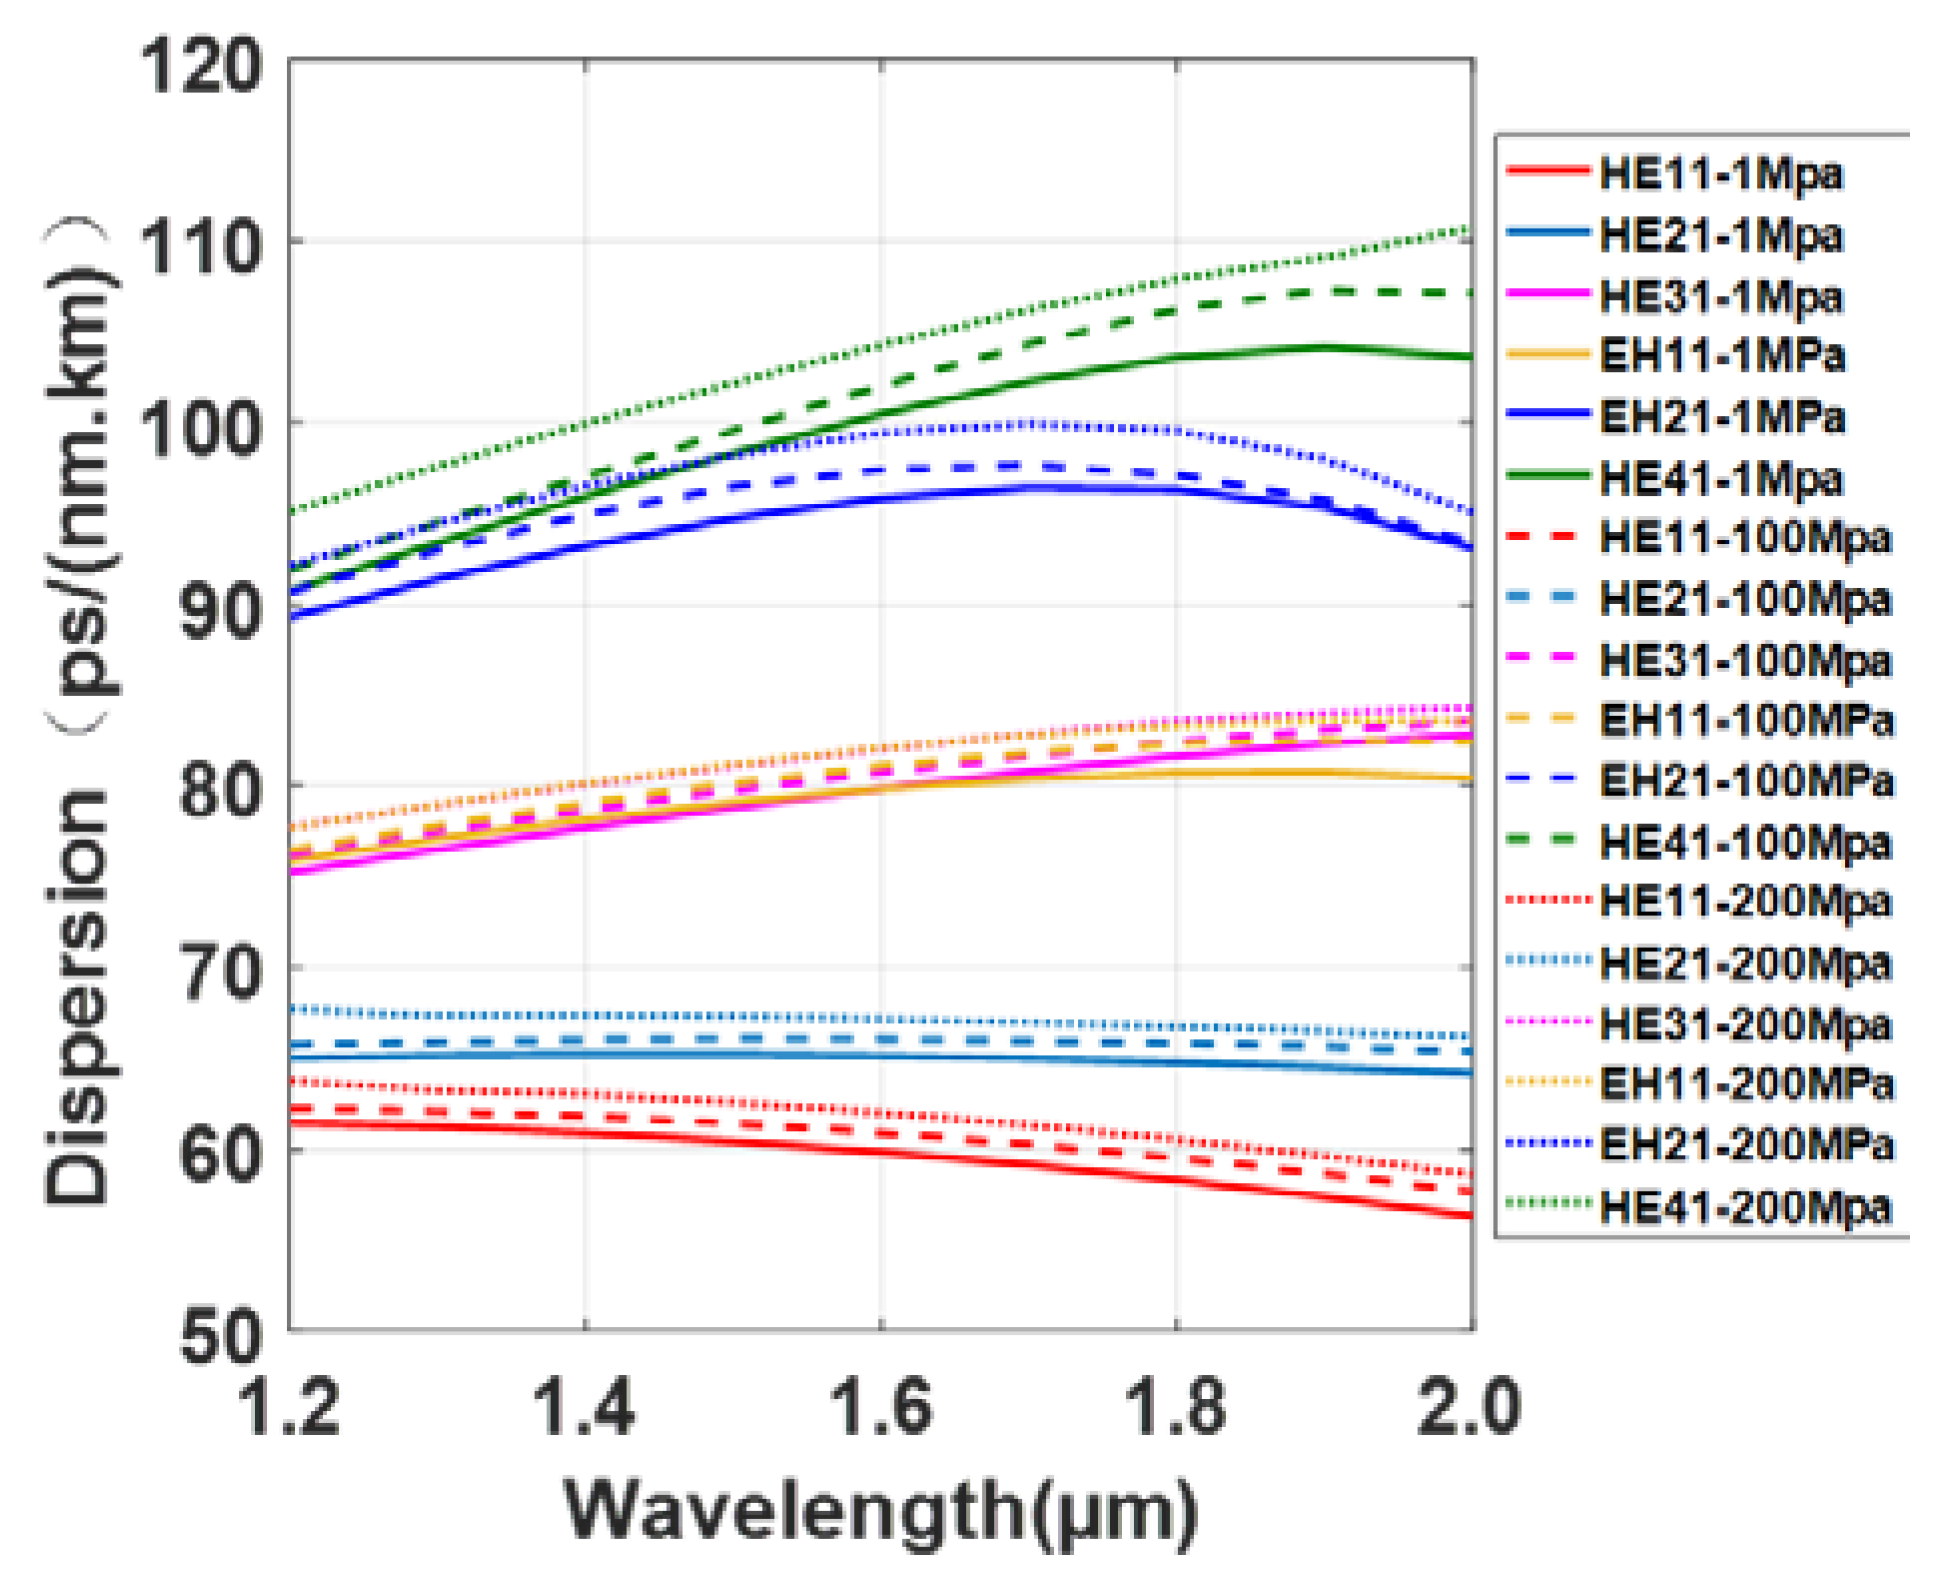
Figure 14.
(a) Confinement loss as a function of stress for different modes, and (b) confinement loss as a function of length for different modes under 100 MPa stress in the y direction.
Figure 14.
(a) Confinement loss as a function of stress for different modes, and (b) confinement loss as a function of length for different modes under 100 MPa stress in the y direction.

Figure 15.
(a) Effective mode area as a function of stress for different modes, and (b) effective mode area as a function of wavelength for different modes under 100 MPa stress in the y direction.
Figure 15.
(a) Effective mode area as a function of stress for different modes, and (b) effective mode area as a function of wavelength for different modes under 100 MPa stress in the y direction.

Figure 16.
(a) Nonlinear parameter as a function of stress for different modes, and (b) nonlinear parameter as a function of wavelength for different modes under 100 MPa stress in the y direction.
Figure 16.
(a) Nonlinear parameter as a function of stress for different modes, and (b) nonlinear parameter as a function of wavelength for different modes under 100 MPa stress in the y direction.
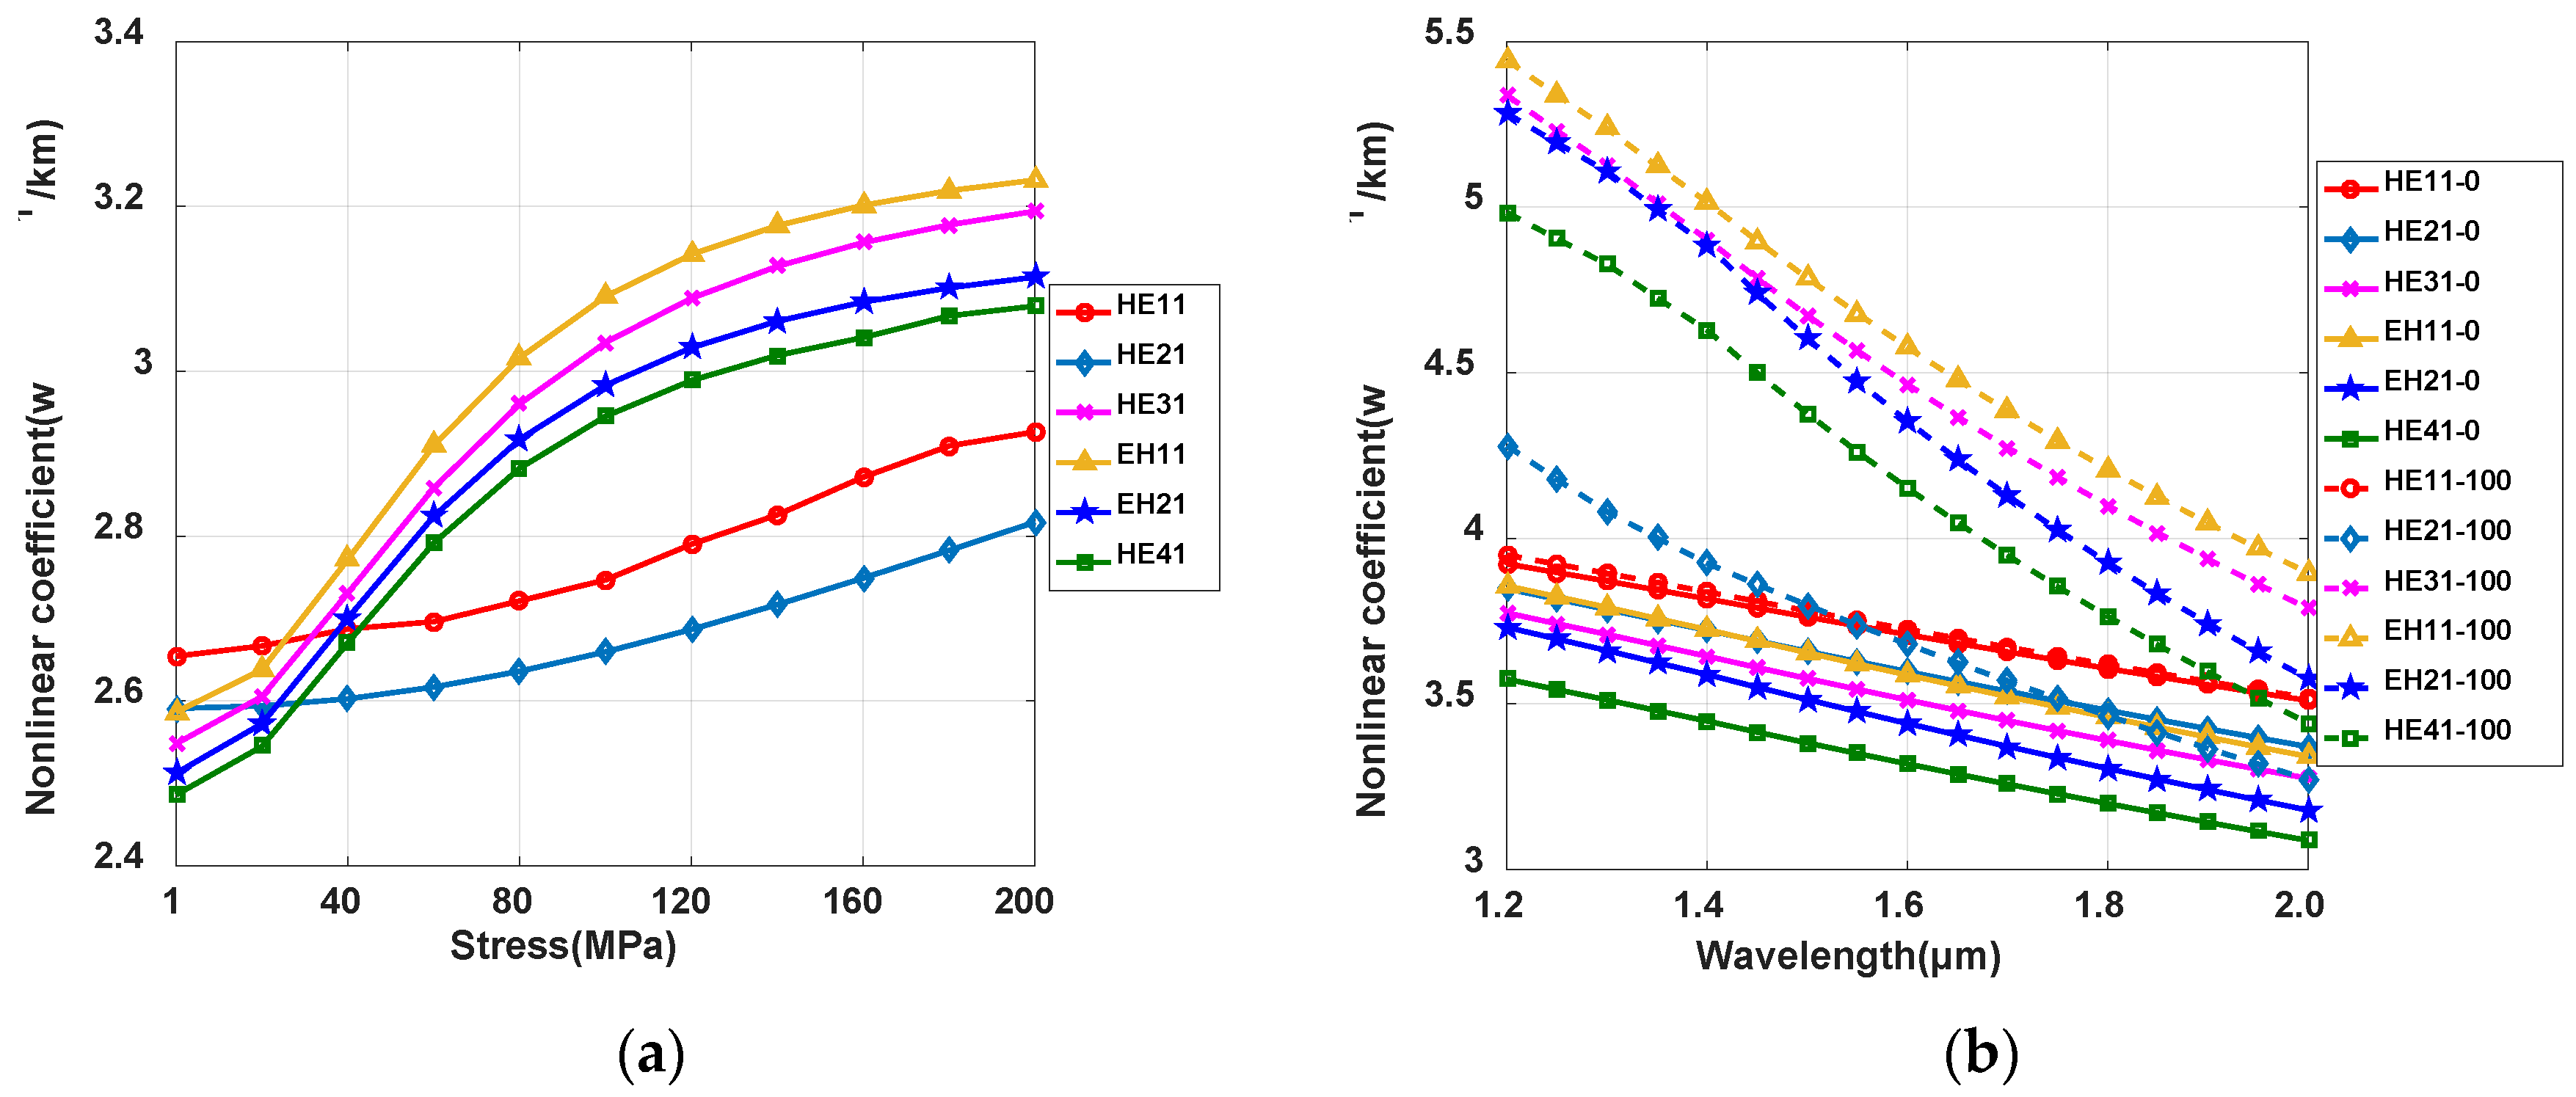
Figure 17.
Modal birefringence of vector modes as a function of stress in the y direction.


Table 1.
Main parameter settings in the simulation.
| parameter | Value | Units |
|---|---|---|
| Refractive index | 1.444 | — |
| Young’s modulus | 7.8×10¹⁰ | Pa |
| Poisson's ratio | 0.17 | — |
| wavelength | 1.55 | μm |
© 2019 by the authors. Licensee MDPI, Basel, Switzerland. This article is an open access article distributed under the terms and conditions of the Creative Commons Attribution (CC BY) license (http://creativecommons.org/licenses/by/4.0/).
Share and Cite
MDPI and ACS Style
Yang, J.; Zhang, H.; Zhang, X.; Li, H.; Xi, L. Analysis of the Transmission Characteristic and Stress-Induced Birefringence of Hollow-Core Circular Photonic Crystal Fiber. Crystals 2019, 9, 128. https://doi.org/10.3390/cryst9030128
AMA Style
Yang J, Zhang H, Zhang X, Li H, Xi L. Analysis of the Transmission Characteristic and Stress-Induced Birefringence of Hollow-Core Circular Photonic Crystal Fiber. Crystals. 2019; 9(3):128. https://doi.org/10.3390/cryst9030128
Chicago/Turabian StyleYang, Jingxuan, Hu Zhang, Xiaoguang Zhang, Hui Li, and Lixia Xi. 2019. "Analysis of the Transmission Characteristic and Stress-Induced Birefringence of Hollow-Core Circular Photonic Crystal Fiber" Crystals 9, no. 3: 128. https://doi.org/10.3390/cryst9030128
Note that from the first issue of 2016, this journal uses article numbers instead of page numbers. See further details here.