Dielectric Relaxor and Conductivity Mechanism in Fe-Substituted PMN-32PT Ferroelectric Crystal
by
 and
and
Xiaojuan Li
1,2,*, 
Xing Fan
1,2,
Zengzhe Xi
1,2,
Peng Liu
3,
Wei Long
1,2,
Pinyang Fang
1,2,
Feifei Guo
1,2 and
Ruihua Nan
1,2 1
School of Materials and Chemical Engineering, Xi’an Technological University, Xi’an 710032, China
2
Shaanxi Key Laboratory of Photoelectric Functional Materials and Devices, Xi’an 710032, China
3
School of Physics and Information Technology, Shaanxi Normal University, Xi’an 710062, China
*
Author to whom correspondence should be addressed.
Crystals 2019, 9(5), 241; https://doi.org/10.3390/cryst9050241
Submission received: 15 March 2019
/
Revised: 3 May 2019
/
Accepted: 4 May 2019
/
Published: 7 May 2019
(This article belongs to the Special Issue Synthesis and Characterization of Ferroelectrics)
Abstract
:Fe-substituted PMN-32PT relaxor ferroelectric crystals were grown by a high-temperature flux method. The effects of charged defects on the dielectric relaxor and conductivity mechanism were discussed in detail. The Fe-substituted PMN-32PT crystal showed a high coercive field (Ec = 765 V/mm), due to domain wall-pinning, induced by charged defect dipoles. Three dielectric anomaly peaks were observed, and the two dielectric relaxation peaks at low temperature were associated with the diffusion phase transition, while the high temperature one resulted from the short-range hopping of oxygen vacancies. At temperature T ≤ 150 °C, the dominating conduction carriers were electrons coming from the first ionization of oxygen vacancies. For the temperature range from 200 to 500 °C, the conductivity was composed of the bulk and interface between sample and electrode, and the oxygen vacancies were suggested to be the conduction mechanism. Above 550 °C, the trapped electrons from the Ti3+ center were excited and played a major role in electrical conduction. Our results are helpful for better understanding the relationship between dielectric relaxation and the conduction mechanism.
1. Introduction
Relaxor-PbTiO3 ferroelectric single crystals with morphotropic phase boundary (MPB), such as (1−x)Pb(Mg1/3Nb2/3)O3-xPbTiO3 (PMN-xPT) and (1−x)Pb(Zn1/3Nb2/3)O3-xPbTiO3 (PZN-xPT), have attracted much attention due to their superior electric properties (piezoelectric coefficient d33 ≈ 2500 pC/N, permittivity ε ≈ 5000–7000, and strain S ≈ 1.7%) [1,2,3]. Recently, studies have shown that the ultrahigh electrical properties in relaxation ferroelectrics might derive from the local structure heterogeneity [3,4,5,6]. For example, Li et al. [5] found the contribution of polar nanoregions to the room-temperature dielectric and piezoelectric properties was up to 80% in relaxor-PT crystals. This opinion was further certified in PMN-29PT piezoelectric ceramics. By introducing the rare-earth element, samarium, to change the local structure, the piezoelectric coefficient d33 of PMN-29PT ceramics was significantly increased from 300 to 1500 pC/N [7]. This discovery provided a new insight into improving material properties.
Heterogeneous ionic substitution was widely applied in relaxor-PT ferroelectrics to regulate their properties. It is well known that the PMN-PT is a typical "soft" piezoelectric material with a low coercive field (Ec ≈ 200 V/mm), which greatly limits their application in high-power equipment [8,9]. In order to overcome their "softness", acceptor ionic substitution is considered an effective way to make the material "harden". For example, acceptor doping Fe3+ and Mn2+ ions substituted for Ti4+ leads to a significant increase in the coercive field for PMN-xPT systems [9,10]. Unfortunately, the permittivity was decreased. Recent reports declared that the acceptor doping could improve not only the pyroelectric coefficient but also the mechanical quality factor of ferroelectric crystals [11,12]. The variations of electrical properties were attributed to the formation of charged defects, such as oxygen vacancies, A-site and/or B-site cation defects, electrons, and holes etc., due to the introduction of foreign ions [9,10,11,12].
The presence of charged defects is bound to change the local structure of ferroelectric material, resulting in the changes of dielectric relaxation [5,7,12,13,14]. Considerable studies have been performed in ferroelectric ceramics, and several possible physical mechanisms have been proposed, such as: (i) A defects dipole model related to oxygen vacancy [12,13,14,15]; (ii) Maxwell–Wagner (MW) model associated with charge of interface [16,17]; and (iii) competition between dielectric relaxation and conduction relaxation [13,18]. Compared with the ferroelectric ceramics, the effects of charged defects on the dielectric relaxation of PMN-xPT ferroelectric single crystals, especially in the conductivity mechanism, are seldom reported [19,20,21]. In this work, the piezoelectric, ferroelectric, and dielectric properties of Fe-substituted PMN-32PT single crystals grown by the high temperature flux method were investigated. The effects of charged defects on dielectric relaxation and conduction mechanisms of the crystals were analyzed systematically, based on complex impedance spectroscopy. Our research will be helpful for better understanding the relationship between charged defects and electrical properties in PMN-32PT ferroelectric single crystals.
2. Experiment
1.7 mol% Fe-substituted PMN-32PT ferroelectric single crystals were grown by the flux method. The detailed process can be found in reference [22]. A [001]-oriented crystal plate with 3 mm × 3 mm × 0.5 mm was cut and polished, and then silver paste was daubed on two sides and fired as electrodes at 750 °C for 30 minutes. A TF2000 ferroelectric test system was used to obtain the hysteresis loop at room temperature. The sample was poled under a 1 kV/mm DC electric field for 5 min at room temperature, and the piezoelectric coefficient (d33 = 997 pC/N) was obtained by using the quasi-static meter (ZJ-6A, Institute of Acoustics, Chinese Academy of Sciences). The dielectric properties were investigated using a precision LCR meter (Agilent E4980A; Santa Rosa, CA, USA) at the temperature range of 30 to 500 °C, corresponding to the frequency range of 100 Hz to 1 MHz. The complex impedance spectroscopy and conductivity were measured using a broadband dielectric spectrometer (BDS40, Novocontrol GmbH, Montabaur, Germany) between 0.1 Hz and 3 MHz.
3. Results and Discussion
Figure 1 shows the powder XRD and Energy Dispersive System (EDS, see inset) of the Fe-substituted PMN-32PT crystal. X-ray powder diffraction pattern of Figure 1 contains only reflections typical for perovskite structure, indicating the Fe ions might enter the crystal. The EDS spectrum further indicates the presence of Fe element in the sample.
Figure 2 shows the hysteresis loop of Fe-substituted PMN-32PT crystal at room temperature. It can be seen that the coercive field Ec is 765 V/mm, which is almost three times larger than that of the pure PMN-PT crystal [8,9,10]. This result indicates that Fe ions effectively make PMN-xPT crystal "harden". One can notice that the center of the hysteresis loop shifts toward the right, leading to coercive field Ec− = 765 V/mm and Ec+ = 721 V/mm, which might be related to the internal bias induced by charged defects in the crystal [23].
The B-site of PMN-xPT crystal is occupied unsystematically by Nb5+, Mg2+, and Ti4+ ions. According to principles of defect chemistry, Fe3+ () substitute for Ti4+ () and result in the presence of charged defects. The reaction can be expressed as Equation (1):
In addition, during the process of high temperature sintering, oxygen vacancies and lead vacancies are created due to their volatilization, as shown in Equations (2) and (3).
The defect dipoles such as 2 − may be formed, which result in an internal bias to inhibit the movement of the domain wall, accompanied by the increase of coercive field and decrease of piezoelectric coefficient [9,10,11,12], as shown in Figure 2.
Figure 3 describes the temperature dependence of DC conductivity for Fe-substituted PMN-32PT crystals. The activation energy Econd was calculated based on the Arrhenius formula (Equation (4)).
Where σ0 is a constant and kB is the Boltzmann constant. Three Econd are obtained for different temperature ranges. At low temperature T < 200 °C, the Econd = 0.18 eV is very close to the first ionization energy of oxygen vacancy (0.1–0.2 eV) [15], showing that the thermal ionization electrons of oxygen vacancy play a major role for the conduction mechanism. For the 500 °C > T > 200 °C temperature range, the Econd increases to 0.86 eV. It was reported that the migration energy of oxygen vacancies was about 1 eV in ABO3 perovskite oxides [24]. Therefore, we suggested that oxygen vacancies should be responsible for the conduction mechanism. With increasing temperature above 550 °C, the activation energy Econd is up to 1.2 eV. Previous research suggested that the oxygen vacancies are still the dominant carriers [19,21,25]. However, our experiment results suggest that the electrons at the interface of the sample/electrode contribute to the high temperature conduction, which will be discussed in detail below.
Figure 4 displays the temperature dependence of permittivity (εr) for Fe-substituted PMN-32PT single crystal at different frequencies. Two obvious dielectric anomalies are observed, corresponding to peak I and peak II. Based on previous studies [26], peak I is assigned to the rhombohedral (R)–tetragonal (T) phase transition, and peak II is from the phase transformation of tetragonal (T)–cubic (C). Fe-substituted PMN-32PT crystal shows the increased phase transition temperature of rhombohedral–tetragonal (TT-R = 90 °C) compared with the PMN-32PT single crystal (TT-R ~ 70 °C) [27], which is attributed to the domain wall-pinning induced by the internal bias field [23]. At the phase transition temperature Tm = 143 °C, the permittivity εr shows a strong frequency dependence. As frequency increases, the permittivity decreases, and peak II moves to a high temperature, indicating the relaxation property of the crystal. It’s worth mentioning that there is a dielectric abnormality at high temperature 400 °C, labeled peak III. This dielectric anomaly occurs at 400 °C higher than Burns temperature TB ~ 330 °C of PMN-PT crystal [28]. Therefore, this anomaly is independent of the diffuse ferroelectric phase transition, and is known as the pseudo-dielectric relaxation [21]. When the temperature is higher than 500 °C, we observe a sharp increase in permittivity at low frequency 10 Hz, which may be associated with space charge polarization [29]. The dielectric anomaly at peak III is more obvious in the dielectric loss (see the inset of Figure 4). With the increasing of frequency, the dielectric anomaly shifts toward high temperature, indicating the dielectric relaxor.
Although the high-temperature dielectric anomaly peak III can be observed in Figure 4, it is difficult to extract the accurate location of abnormal peaks, which limits our insight into the mechanism of high-temperature dielectric relaxation. Considering the relationship between dielectric modulus (M*) and permittivity (ε*), as in the following Equation (5), we can obtain some information about the dielectric relaxation mechanism by analysis of dielectric modulus M*.
Figure 5 shows the dielectric modulus imaginary M″ as a function of frequency (f) in the temperatures ranging from 200 to 700 °C. Only one peak is observed, and the peak gradually moves to high frequency with increasing temperature, which is a typical dielectric relaxation induced by thermal activation [25]. In order to analyze its physical nature, we accurately extracted the position of the relaxation peak by Gaussian fitting, and calculated the relaxation activation energy Erelax (see inset of Figure 5), based on the Arrhenius formula (Equation (6)).
It can be seen that the relaxation activation energy Erelax is 1.2 eV, indicating that the high-temperature dielectric relaxation peak III is related to the short-range hopping of oxygen vacancies [13,20,21,24]. At this point, oxygen vacancy acts as a polaron, and its hopping process can be regarded as the reorientation of the dipole, which leads to dielectric relaxation.
In order to understand the relationship between dielectric relaxation and electrical conduction, Figure 6 shows the impedance imaginary Z″ of Fe-substituted PMN-32PT crystal as a function of frequency (f) at different temperatures. Two abnormal peaks in Z″(f) curves are observed in Figure 6a, corresponding to a high-frequency Ph peak and a low-frequency Pl peak, respectively. Usually, the high-frequency Ph peak is related to the bulk, while the low-frequency Pl peak is associated with interface, and they can be described by an equivalent circuit with two pairs of parallel R–C series [13,20]. With decreasing temperature from 700 to 250 °C, the position of the Ph peak shifts gradually toward low frequency, indicating its relaxation characteristics. It is unfortunate that, when temperature is below 200 °C, the relaxor peak is out of this measured range and cannot be observed (see inset of Figure 6a). The intensity of the Ph peak decreases gradually with the temperature increasing, showing a thermal activation. Compared with the high-frequency Ph relaxation peak, the variation of the low-frequency Pl peak is more complex (see Figure 6b). When the temperature is increased from 300 to 400 °C, the Pl peak moves to the high frequency, accompanied by the decrease of peak intensity, which is in agreement with the Ph peak. Some subtle changes are captured in the illustration. The intensity of the Pl peak is higher than that of the Ph peak at 300 °C, indicating that the interface’s contribution to the complex impedance is greater than that of the bulk. However, the intensity of the Pl peak decreases gradually with increasing temperature, and it can be hardly observed at 450 °C. It is very interesting that the Pl peak rises again when the temperature is above 500 °C, but the frequency where the Z” is up to maximum almost does not change with increasing temperature, except for when the peak intensity decreases. The phenomena suggest that the Pl peak depends on temperature rather than frequency in the temperature range from 500 to 700 °C. Therefore, the conduction mechanism controlled by oxygen vacancy hopping is ruled out [13,14,15,16,17,20,21].
To explore the physical mechanism of the Pl and Ph peaks, we extracted the position of the Ph peak (250–650 °C) and Pl peak (300–400 °C) from Figure 6b. Based on the Arrhenius formula (Equation (6)), the relationship between the frequency and temperature was plotted, as shown in Figure 7. It can be seen that the relaxor activation energy of Ph peaks is 1.2 eV, which is in agreement with Figure 5, indicating that the dielectric relaxation and electrical conduction in bulk derive from the same physical mechanism, that is, oxygen vacancies [13,21]. For the low-frequency Pl peak (300-400 °C), the relaxor activation energy is 1.28 eV, close to the migration energy of oxygen vacancy. Therefore, we suggest that the conduction mechanism of the interface arises from the oxygen vacancy in the temperature range from 300 to 400 °C [20].
For the high-temperature region (500 < T < 700 °C) in Figure 6b, as mentioned above, the Pl peak shows a negative temperature resistance coefficient (NTRC) and thermal activation feature. In addition, the Pl peak is independent of frequency, indicating that the interface system is a non-dispersive transport of the free charged carriers process [20]. In order to certify the view, the conductivity as a function of frequency was plotted in the temperature range 500 < T < 700 °C, as shown in Figure 8. One can see that the conductivity remains almost constant when the frequency is less than 103 Hz, indicating the DC conduction. Wan et al. reported that the partial Fe3+ might transform into Fe2+ when the high concentration iron ions were introduced into PMN-PT crystal [11], which resulted in the formation of holes. Generally, these holes are trapped by negatively charged centers, such as vacancies, and they act as carriers to form the p-type conduction at high temperature, as shown in Equation (7).
where is the negatively charged center with a trapped hole. Previous study showed that the enthalpy of Equation (7) determined from the temperature dependence of the p-type conductivity is about 0.92 eV [30]. Based on Figure 2, we knew that the activation energy Econd was up to 1.2 eV at T > 500 °C. Therefore, we propose the holes might be excluded. However, the Ti3+ center was calculated to be highly localized on the Ti 3d orbital and quite deep, at least 1 eV below the conduction-band edge [31]. Zhao et al. [20] reported that this activation energy corresponding to the excitation of trapped electrons from the Ti3+ center is about 1.1 ± 0.03 eV in PMN-PT crystal. For the interface region between the sample and electrode, the cathodic region contains a high concentration of migrated oxygen vacancies, and they are compensated by electrons. The compensated electrons may be trapped by the Ti4+ to form color centers, which leads to the Ti4+ transformation into Ti3+. Therefore, we speculate that the excitation of trapped electrons from the Ti3+ center might dominate the high-temperature conduction mechanism [20].
The impedance Z″ reflects the material’s resistance information, while the modulus M″ reflects the material’s capacitance information [13,18]. When the positions of Mmax″ and Zmax″ are identical, they show the dominance of long-range carrier migration. Conversely, the short-range movement of carriers may play a major role in contributing to the material’s properties [18]. In order to further demonstrate the carrier migration, the M″(f) and Z″(f) curves were contrasted at different temperatures, as shown in Figure 9. It can be clearly seen that the Zmax″ and Mmax″ occur at different frequencies, as shown by the black dotted line in Figure 9a,b, which indicates that the short-range hopping of oxygen vacancies is responsible for the dielectric relaxation. With increasing temperature, the difference of frequency between Zmax″ and Mmax″ decreases gradually (see Figure 9d), suggesting the dominance of oxygen vacancies’ long-range migration. The long-range migration of carriers promotes conduction, resulting in the decrease of resistivity and the increase of the leakage current, as shown in Figure 6b.
4. Conclusions
The dielectric, piezoelectric, ferroelectric, relaxation and electrical conduction were investigated in an Fe-substituted PMN-32PT relaxation ferroelectric single crystal, grown by the flux method. Fe ions effectively improved the coercive field Ec of PMN-32PT crystal, and the Ec was up to 765 V/mm, which is three times larger than that of un-doped PMN-32PT crystal. Fe-substituted PMN-32PT showed a piezoelectric coefficient d33 = 997 pC/N. These variations of electrical properties were attributed to the domain wall-pinning by defect dipoles. The low-temperature dielectric relaxation was associated with the diffuse phase transition, while the high-temperature dielectric relaxation was attributed to the oxygen vacancies. The analysis of conductivity showed that the conduction mechanism was mainly electrons resulting from ionization of oxygen vacancies at low-temperature range T ≤ 150 °C, while the migration of oxygen vacancies dominated the conduction mechanism for moderate temperatures, 200 < T < 500 °C. As the temperature increased by 550 °C, the excitation of the trapped electrons from the Ti3+ center below the edge of the conduction band contributed to the high-temperature conduction.
Author Contributions
Conceptualization, Z.X. and P.L.; methodology, X.L.; formal analysis, X.L.; investigation, X.F. and W.L.; resources, P.L.; writing—original draft preparation, X.L.; writing—review and editing, P.F.; F.G.; and R.N.; supervision, Z.X.
Funding
This work received financial support from the Nation Natural Science Foundation of China (Grant No. 51602242, 51772235, 11704249), and Natural Science Basic Research Plan in Shaanxi Province of China (Grant No. 2018JM5097). The authors thank the condensed matter physics laboratory of Shaanxi Normal University for the test of the broadband dielectric spectrometer.
Conflicts of Interest
The authors declare no conflict of interest.
References
- Park, S.E.; Shrout, T.R. Ultrahigh strain and piezoelectric behavior in relaxor based ferroelectric single crystals. J. Appl. Phys. 1997, 82, 1804–1811. [Google Scholar] [CrossRef]
- Sun, E.; Cao, W. Relaxor-based ferroelectric single crystals: Growth, domain engineering, characterization and applications. Prog. Mater. Sci. 2014, 65, 124–210. [Google Scholar] [CrossRef] [PubMed] [Green Version]
- Qiu, C.; Liu, J.; Li, F.; Xu, Z. Thickness dependence of dielectric and piezoelectric properties for alternating current electric-field-poled relaxor-PbTiO3 crystals. J. Appl. Phys. 2019, 125, 014102. [Google Scholar] [CrossRef]
- Xu, G.; Wen, J.; Stock, C.; Gehring, P.M. Phase instability induced by polar nanoregions in a relaxor ferroelectric system. Nature Mater. 2008, 7, 562–566. [Google Scholar] [CrossRef] [PubMed] [Green Version]
- Li, F.; Zhang, S.J.; Yang, T.; Xu, Z.; Zhang, N.; Liu, G.; Wang, J.; Cheng, Z.; Ye, Z.G.; Luo, J.; Shrout, T.R.; Chen, L.Q. The origin of ultrahigh piezoelectricity in relaxor-ferroelectric solid solution crystals. Nature. Commun. 2016, 7, 13807. [Google Scholar] [CrossRef] [Green Version]
- Manley, M.E.; Lynn, J.W.; Abernathy, D.L.; Specht, E.D.; Delaire, O.; Bishop, A.R.; Sahul, R.; Budai, J.D. Phonon localization drives polar nanoregions in a relaxor ferroelectric. Nature Commun. 2014, 5, 3683. [Google Scholar] [CrossRef] [Green Version]
- Li, F.; Lin, D.B.; Chen, Z.B.; Cheng, Z.X.; Wang, J.L.; Li, C.C.; Xu, Z.; Huang, Q.W.; Liao, X.Z.; Chen, L.Q.; Shrout, T.R.; Zhang, S.J. Ultrahigh piezoelectricity in ferroelectric ceramics by design. Nature Mater. 2018, 17, 349–354. [Google Scholar] [CrossRef]
- Zhang, T.F.; Tang, X.G.; Ge, P.Z.; Liu, Q.X.; Jiang, Y.P. Orientation related electrocaloric effect and dielectric phase transitions of relaxor PMN-PT single crystals. Ceram. Int. 2017, 43, 16300–16305. [Google Scholar] [CrossRef]
- Oh, H.T.; Joo, H.J.; Kim, M.C.; Lee, H.Y. Thickness–Dependent Properties of Undoped and Mn-doped (001) PMN–29PT[Pb(Mg1/3Nb2/3)O3-29PbTiO3] Single Crystals. J. Korean Ceram. Soc. 2018, 55, 290–298. [Google Scholar] [CrossRef]
- Luo, L.H.; Wang, F.F.; Tang, Y.X.; Zhu, Y.J.; Wang, J.; Luo, H.S. Fe-doped 0.71Pb(Mg1/3Nb2/3)O3–0.29PbTiO3 single crystals. J. Phys. D: Appl. Phys. 2008, 41, 205401. [Google Scholar] [CrossRef]
- Wan, X.M.; Chew, K.H.; Chan, H.L.W.; Choy, C.L.; Zhao, X.Y.; Luo, H.S. The effect of Fe substitution on pyroelectric properties of 0.62Pb(Mg1/3Nb2/3)O3–0.38PbTiO3 single crystals. J. Appl. Phys. 2005, 97, 064105. [Google Scholar] [CrossRef]
- Zheng, L.M.; Yang, L.Y.; Li, Y.R.; Lu, X.Y.; Huo, D.; Lü, W.M.; Zhang, R.; Yang, B.; Cao, W.W. Origin of Improvement in Mechanical Quality Factor in Acceptor-Doped Relaxor-Based Ferroelectric Single Crystals. Phys. Rev. Appl. 2018, 9, 064028. [Google Scholar] [CrossRef]
- Li, X.J.; Jing, Q.; Xi, Z.Z.; Liu, P.; Long, W.; Fang, P.Y. Dielectric relaxation and electrical conduction in (BixNa1−x)0.94Ba0.06TiO3 ceramics. J. Am. Ceram. Soc. 2018, 101, 789–799. [Google Scholar] [CrossRef]
- Elissalde, C.; Ravez, J. Ferroelectric ceramics: defects and dielectric relaxations. J. Mater. Chem. 2001, 11, 1957–1967. [Google Scholar] [CrossRef]
- Chen, A.; Zhi, Y.; Cross, L.E. Oxygen-vacancy-related low-frequency dielectric relaxation and electrical conduction. Phys. Rev. B 2000, 62, 228–236. [Google Scholar]
- Xie, X.C.; Zhou, Z.Y.; Wang, T.Z.; Liang, R.H.; Dong, X.L. High temperature impedance properties and conduction mechanism of W6+–doped CaBi4Ti4O15 Aurivillius piezoceramics. J. Appl. Phys. 2018, 124, 204101. [Google Scholar] [CrossRef]
- Zhao, L.L.; Xu, R.X.; Wei, Y.X.; Han, X.; Zhai, C.X.; Zhang, Z.X.; Qi, X.F.; Cui, B.; Jonesc, J.L. Giant dielectric phenomenon of Ba0.5Sr0.5TiO3/CaCu3Ti4O12 multilayers due to interfacial polarization for capacitor applications. J. Eur. Ceram. Soc. 2019, 39, 1116–1121. [Google Scholar] [CrossRef]
- Wang, C.C.; Zhang, M.N.; Xu, K.B.; Wang, G.J. Origin of high-temperature relaxor-like behavior in CaCu3Ti4O12. J. Appl. Phys. 2012, 112, 034109. [Google Scholar] [CrossRef]
- Wu, X.; Liu, L.H.; Li, X.B.; Zhao, X.Y.; Lin, D.; Luo, H.S.; Huang, Y.L. The influence of defects on ferroelectric and pyroelectric properties of Pb(Mg1/3Nb2/3)O3–0. 28PbTiO3 single crystals. Mater. Chem. Phys. 2012, 132, 87–90. [Google Scholar] [CrossRef]
- Zhao, S.; Zhang, S.J.; Liu, W.; Donnelly, N.J.; Xu, Z.; Randall, C.A. Time dependent dc resistance degradation in lead-based perovskites: 0.7PbMg1/3Nb2/3O3−0.3PbTiO3. J. Appl. Phys. 2009, 105, 053705. [Google Scholar] [CrossRef]
- Wang, C.C.; Zhang, M.N.; Xia, W. High-Temperature Dielectric Relaxation in Pb(Mg1/3Nb2/3)O3–PbTiO3 Single Crystals. J. Am. Ceram. Soc. 2013, 96, 1521–1525. [Google Scholar] [CrossRef]
- He, A.G.; Xi, Z.Z.; Li, X.J.; Long, W.; Fang, P.Y.; Zhao, J.; Yu, H.B.; Kong, Y.L. Optical properties of Ho3+- and Ho3+/Yb3+-modified PSN-PMN-PT crystals. Mater. Lett. 2018, 219, 64–67. [Google Scholar] [CrossRef]
- Luo, N.N.; Zhang, S.J.; Li, Q.; Yan, Q.F.; Zhang, Y.L.; Ansella, T.; Luo, J.; Shrout, T.R. Crystallographic Dependence of Internal Bias in Domain Engineered Mn–doped Relaxor–PbTiO3 Single Crystals. J. Mater. Chem. C 2016, 4, 4568–4576. [Google Scholar] [CrossRef]
- Islam, M.S.J. Ionic transport in ABO3 perovskite oxides: a computer modelling tour. Mater. Chem. 2000, 10, 1027–1038. [Google Scholar] [CrossRef]
- Liu, X.; Fang, B.J.; Deng, J.; Deng, H.; Yan, H.; Yue, Q.W.; Chen, J.W.; Li, X.B.; Ding, J.N.; Zhao, X.Y.; Luo, H.S. Phase transition behavior and defect chemistry of [001]-oriented 0.15Pb(In1/2Nb1/2)O3−0.57Pb(Mg1/3Nb2/3)O3−0.28PbTiO3-Mn single crystals. J. Appl. Phys. 2015, 117, 244102. [Google Scholar] [CrossRef]
- Li, X.J.; Xi, Z.Z.; Liu, P.; Long, W.; Fang, P.Y. Stress and temperature-induced phase transitions and thermal expansion in (001)-cut PMN-31PT single crystal. J. Alloys Compound. 2015, 652, 287–291. [Google Scholar] [CrossRef]
- Noheda, B.; Cox, D.E.; Shirane, G.; Gao, J.; Ye, Z.G. (1−x)PbMg1/3Nb2/3O3−xPbTiO3. Phys. Rev. B 2002, 66, 054104. [Google Scholar] [CrossRef]
- Gridnev, S.A.; Glazunov, A.A.; Tsotsorin, A.N. Temperature Evolusion of the Local Order Parameter in Relaxor Ferroelectrics (1−x)PMN−xPZT. Phys. Stat. Sol. A 2005, 202, R121–R124. [Google Scholar] [CrossRef]
- Liu, L.J.; Huang, Y.M.; Su, C.X.; Fang, L.; Wu, M.X.; Hu, C.Z.; Fan, H.Q. Space-charge relaxation and electrical conduction in K0.5Na0.5NbO3 at high temperatures. Appl. Phys. A 2011, 104, 1047–1051. [Google Scholar] [CrossRef]
- Raymond, M.V.; Smyth, D.M. Defects and charge transport in perovskit ferroelectrics. J. Ph, Che. Sohds. 1996, 10, 1507–1511. [Google Scholar] [CrossRef]
- Robertson, J.; Warren, W.L.; Tuttle, B.A.; Dimos, D.; Smyth, D.M. Shallow Pb3+ hole traps in lead zirconate titanate ferroelectrics. Appl. Phys. Lett. 1993, 63, 1519. [Google Scholar] [CrossRef]
Figure 1.
Powder XRD of Fe-substituted PMN-32PT crystal, and Energy Dispersive System (EDS) spectrum (inset).
Figure 1.
Powder XRD of Fe-substituted PMN-32PT crystal, and Energy Dispersive System (EDS) spectrum (inset).

Figure 2.
P–E loop of Fe-substituted PMN-32PT ferroelectric crystal at room temperature.

Figure 3.
Arrhenius plots of DC conductivity as a function of temperature for Fe-substituted PMN-32PT ferroelectric crystal.
Figure 3.
Arrhenius plots of DC conductivity as a function of temperature for Fe-substituted PMN-32PT ferroelectric crystal.

Figure 4.
Temperature dependence of permittivity for Fe-substituted PMN-32PT ferroelectric crystal at different frequencies.
Figure 4.
Temperature dependence of permittivity for Fe-substituted PMN-32PT ferroelectric crystal at different frequencies.

Figure 5.
The frequency dependence of the electric modulus (M″) for Fe-substituted PMN-32PT ferroelectric crystal at different temperature, and relaxor activation energy (Erelax) (inset).
Figure 5.
The frequency dependence of the electric modulus (M″) for Fe-substituted PMN-32PT ferroelectric crystal at different temperature, and relaxor activation energy (Erelax) (inset).

Figure 6.
The frequency (f) dependence of the impedance imaginary part (Z″) for Fe-substituted PMN-32PT ferroelectric crystal at different temperatures (a), and the larger version (b). The insets show respectively the Z″ (f) curves and equivalent circuit.
Figure 6.
The frequency (f) dependence of the impedance imaginary part (Z″) for Fe-substituted PMN-32PT ferroelectric crystal at different temperatures (a), and the larger version (b). The insets show respectively the Z″ (f) curves and equivalent circuit.

Figure 7.
Arrhenius plots of the impedance imaginary part (Z″) for Fe-substituted PMN-32PT ferroelectric crystal.
Figure 7.
Arrhenius plots of the impedance imaginary part (Z″) for Fe-substituted PMN-32PT ferroelectric crystal.
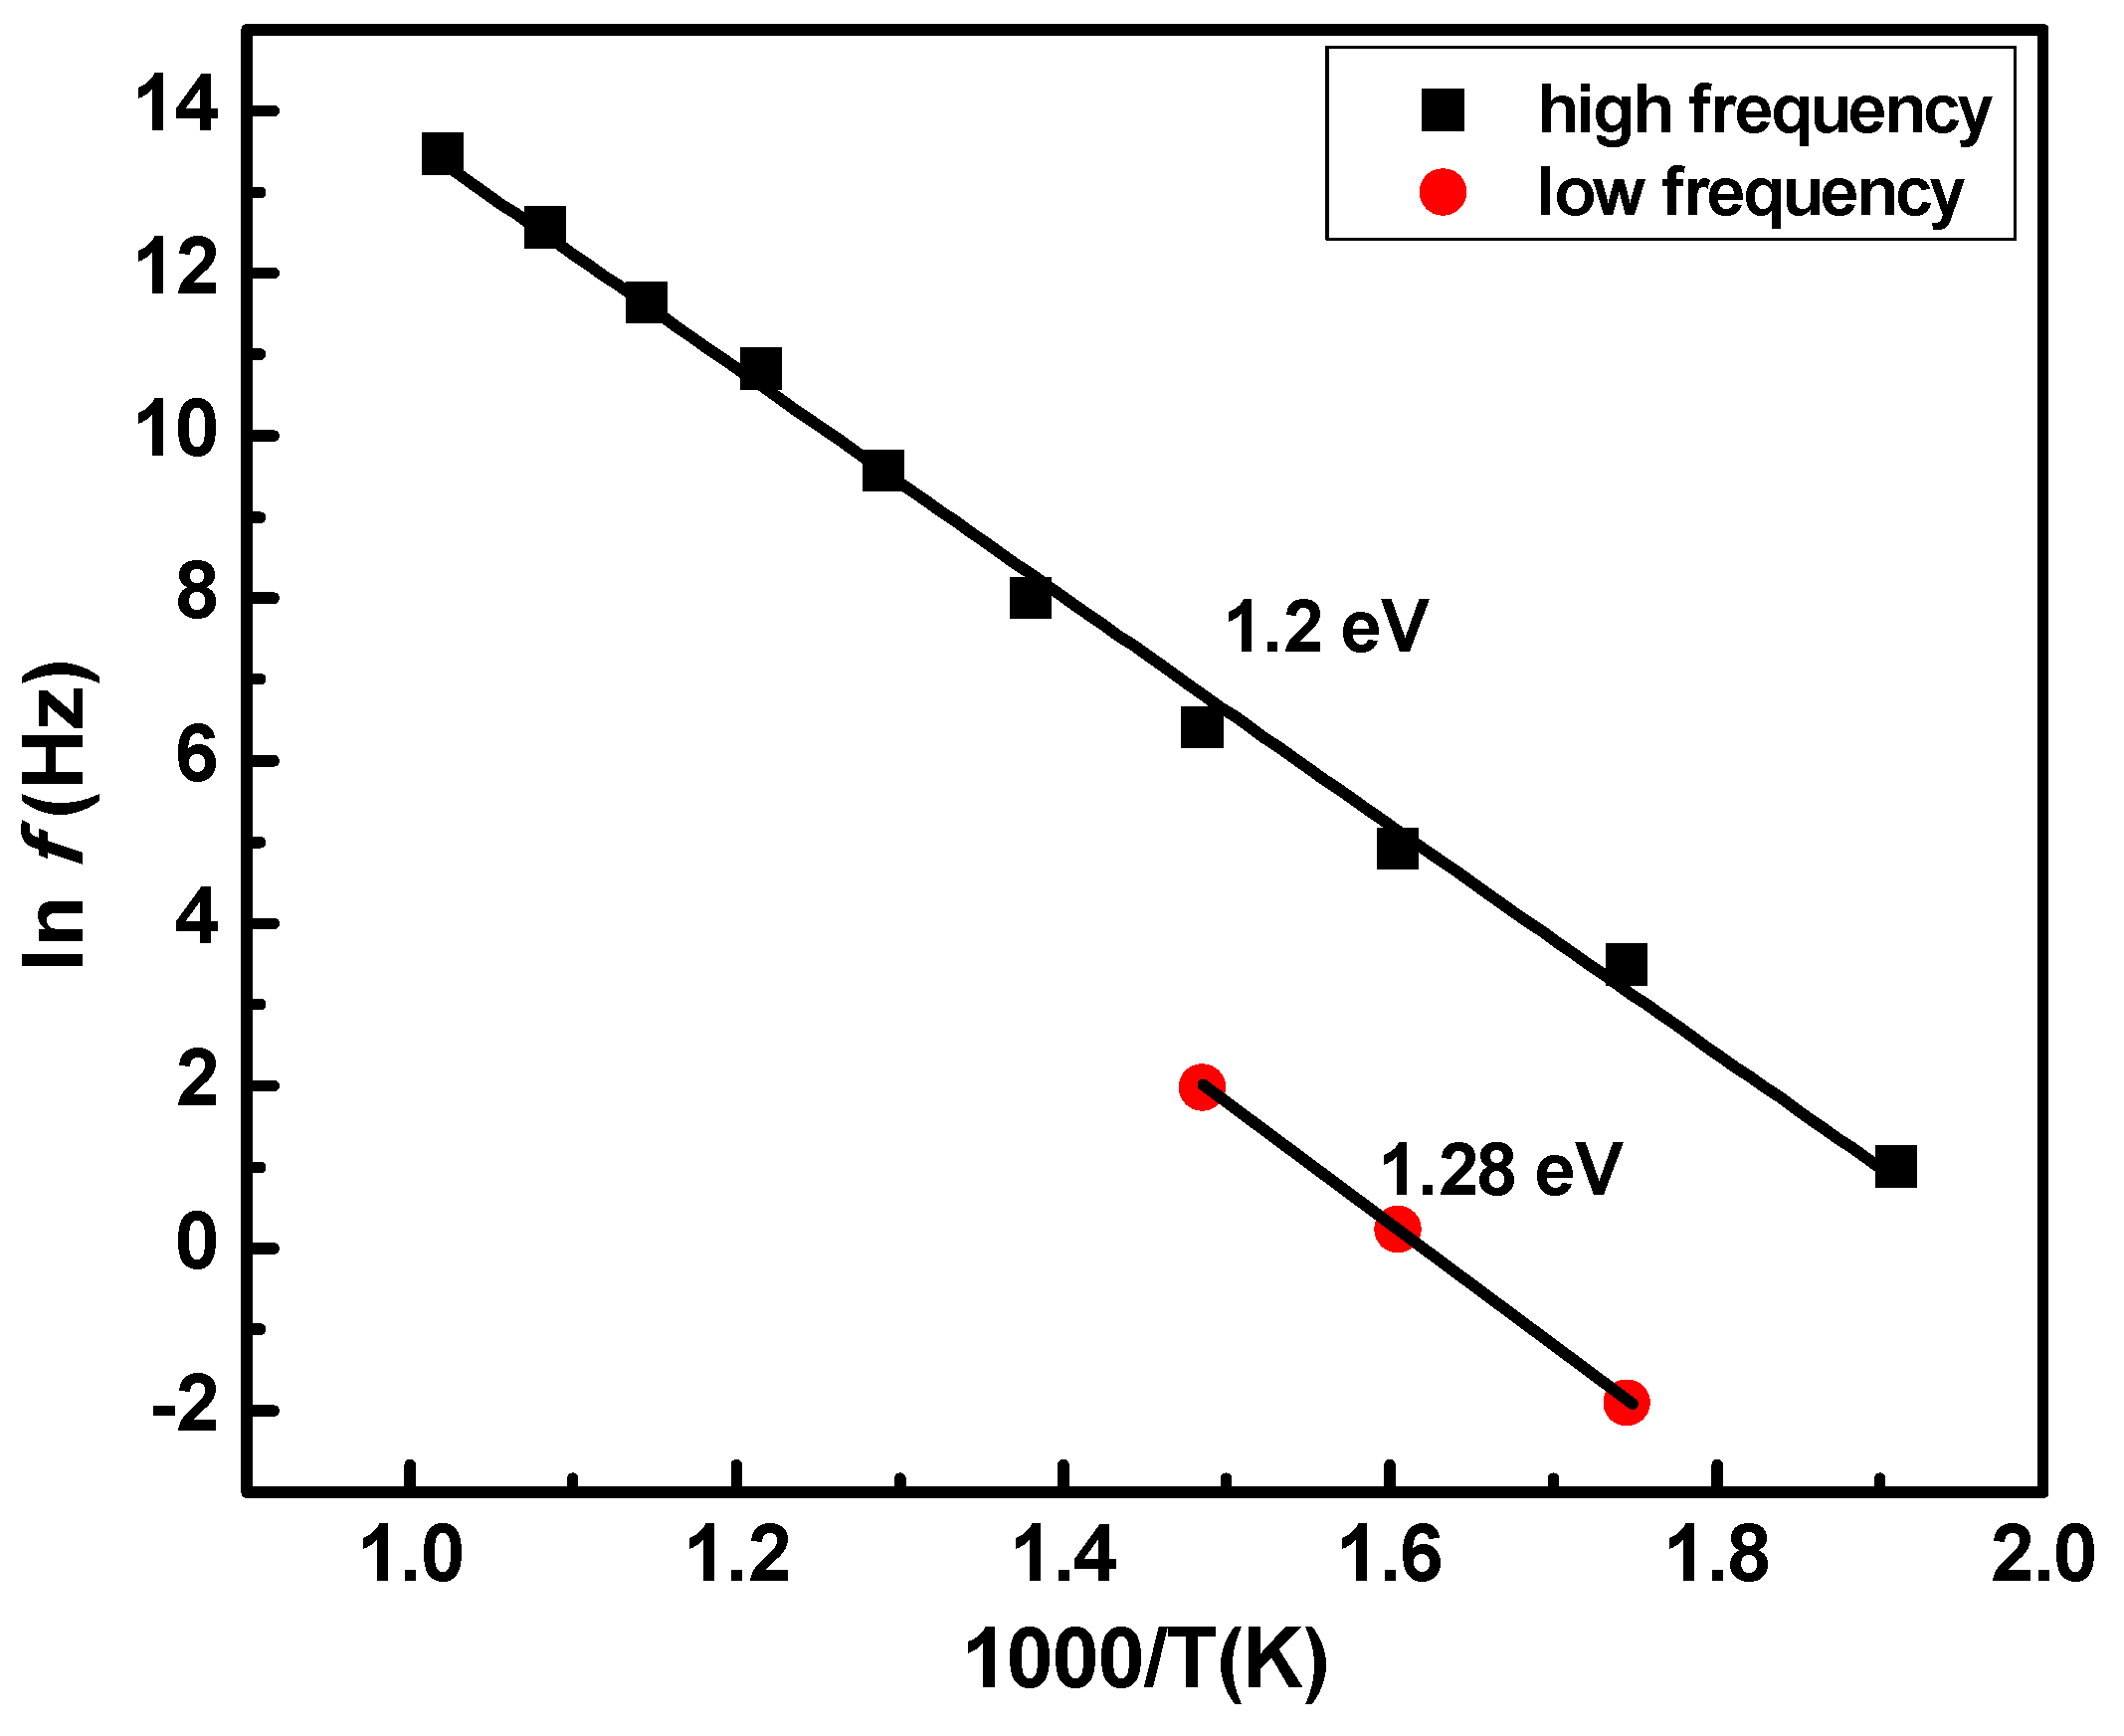
Figure 8.
The ac conductivity of Fe-substituted PMN-32PT relaxor ferroelectric crystals as a function of frequency at different temperatures.
Figure 8.
The ac conductivity of Fe-substituted PMN-32PT relaxor ferroelectric crystals as a function of frequency at different temperatures.

Figure 9.
Comparison between Z″ and M″ for Fe-substituted PMN-32PT ferroelectric crystal at different temperatures (a) 300 °C; (b) 350 °C; (c) 550 °C and (d) 650 °C.
Figure 9.
Comparison between Z″ and M″ for Fe-substituted PMN-32PT ferroelectric crystal at different temperatures (a) 300 °C; (b) 350 °C; (c) 550 °C and (d) 650 °C.

© 2019 by the authors. Licensee MDPI, Basel, Switzerland. This article is an open access article distributed under the terms and conditions of the Creative Commons Attribution (CC BY) license (http://creativecommons.org/licenses/by/4.0/).
Share and Cite
MDPI and ACS Style
Li, X.; Fan, X.; Xi, Z.; Liu, P.; Long, W.; Fang, P.; Guo, F.; Nan, R. Dielectric Relaxor and Conductivity Mechanism in Fe-Substituted PMN-32PT Ferroelectric Crystal. Crystals 2019, 9, 241. https://doi.org/10.3390/cryst9050241
AMA Style
Li X, Fan X, Xi Z, Liu P, Long W, Fang P, Guo F, Nan R. Dielectric Relaxor and Conductivity Mechanism in Fe-Substituted PMN-32PT Ferroelectric Crystal. Crystals. 2019; 9(5):241. https://doi.org/10.3390/cryst9050241
Chicago/Turabian StyleLi, Xiaojuan, Xing Fan, Zengzhe Xi, Peng Liu, Wei Long, Pinyang Fang, Feifei Guo, and Ruihua Nan. 2019. "Dielectric Relaxor and Conductivity Mechanism in Fe-Substituted PMN-32PT Ferroelectric Crystal" Crystals 9, no. 5: 241. https://doi.org/10.3390/cryst9050241
Note that from the first issue of 2016, this journal uses article numbers instead of page numbers. See further details here.