A pH-Sensing Film from Tamarind Seed Polysaccharide with Litmus Lichen Extract as an Indicator

Abstract
:
1. Introduction
2. Materials and Methods
2.1. Materials
2.2. Experimental Procedures
2.2.1. Extraction Procedure
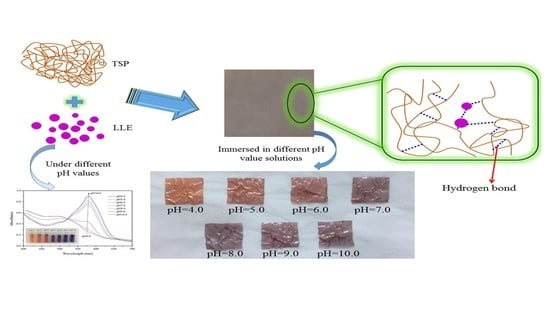
2.2.2. Development of pH-Sensing Films
2.3. Characterization
2.3.1. Mechanical Properties
2.3.2. Water Vapor Permeability
2.3.3. UV–Vis Spectroscopy
2.3.4. FTIR Spectroscopy
2.3.5. SEM Observation
2.3.6. Color Response Analysis
2.3.7. Application of the Developed Film in the Detection of Full Cream Milk Spoilage
2.3.8. Statistical Analysis
3. Results and Discussion
3.1. Mechanical Properties of the pH-Sensing Films
3.2. WVP of the pH-Sensing Films
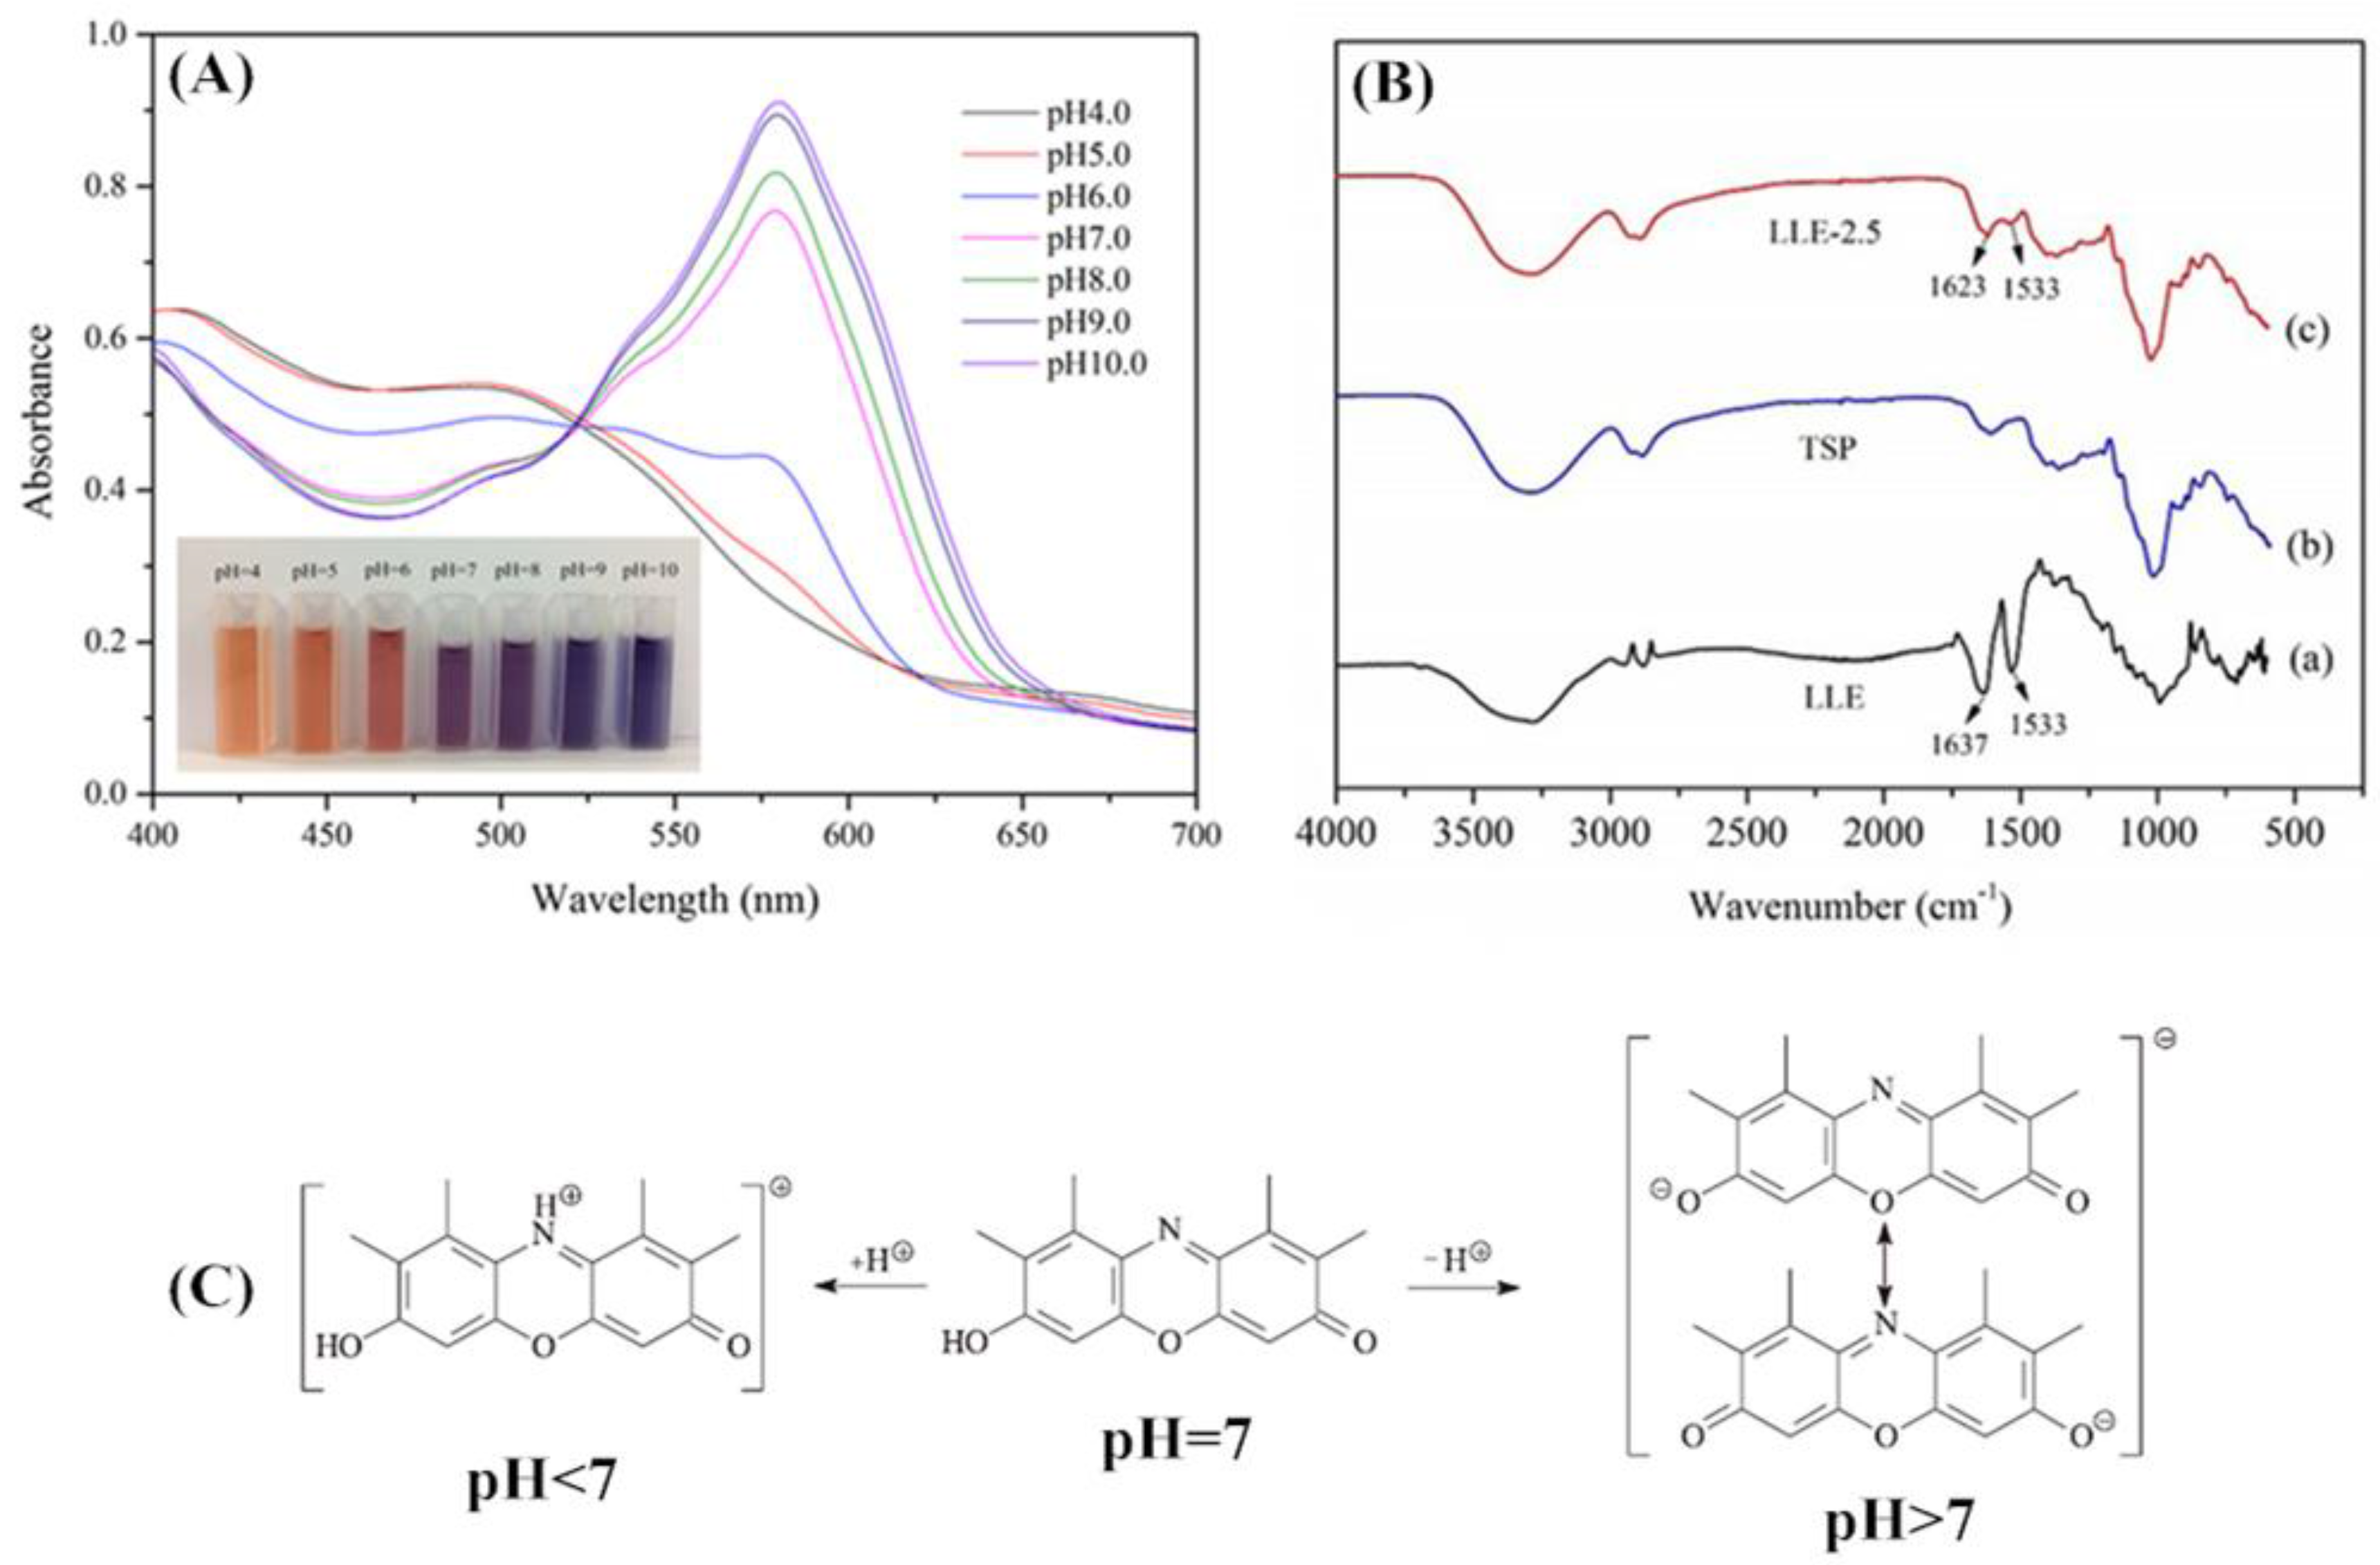
3.3. UV–Vis Spectroscopy of LLE Solutions at Various pH Ranges
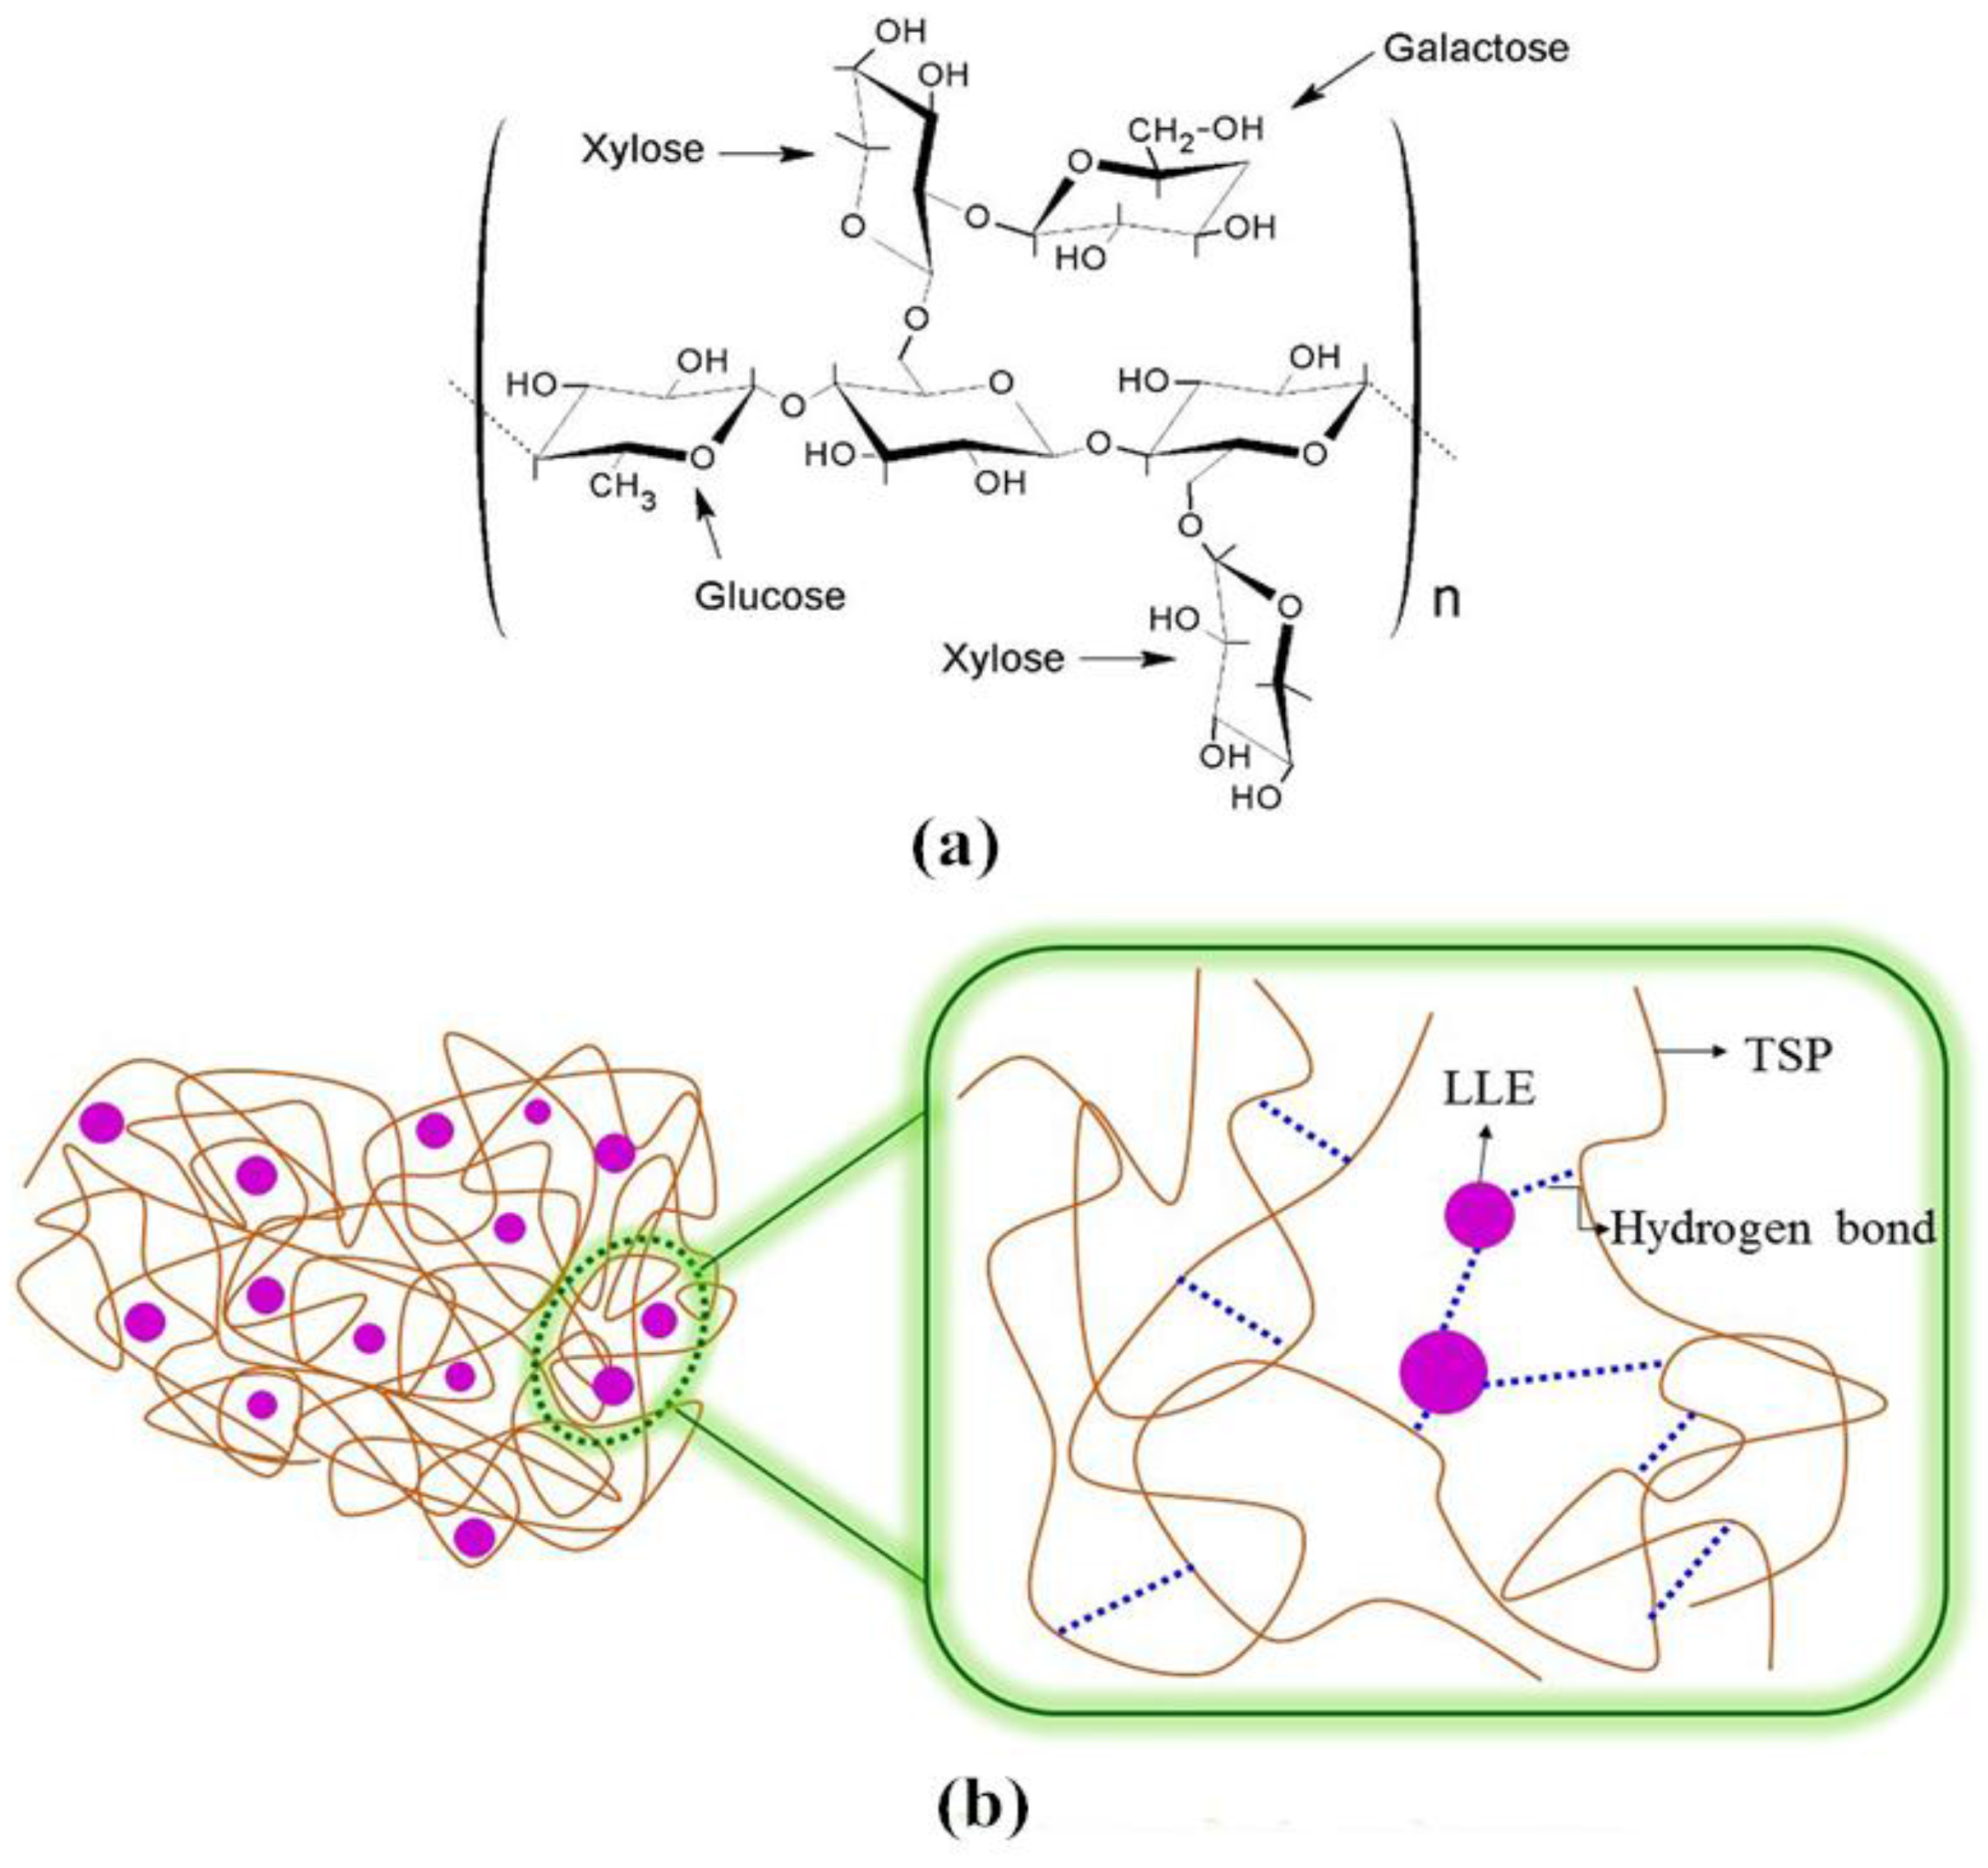
3.4. FTIR Spectra of the pH-Sensing Films
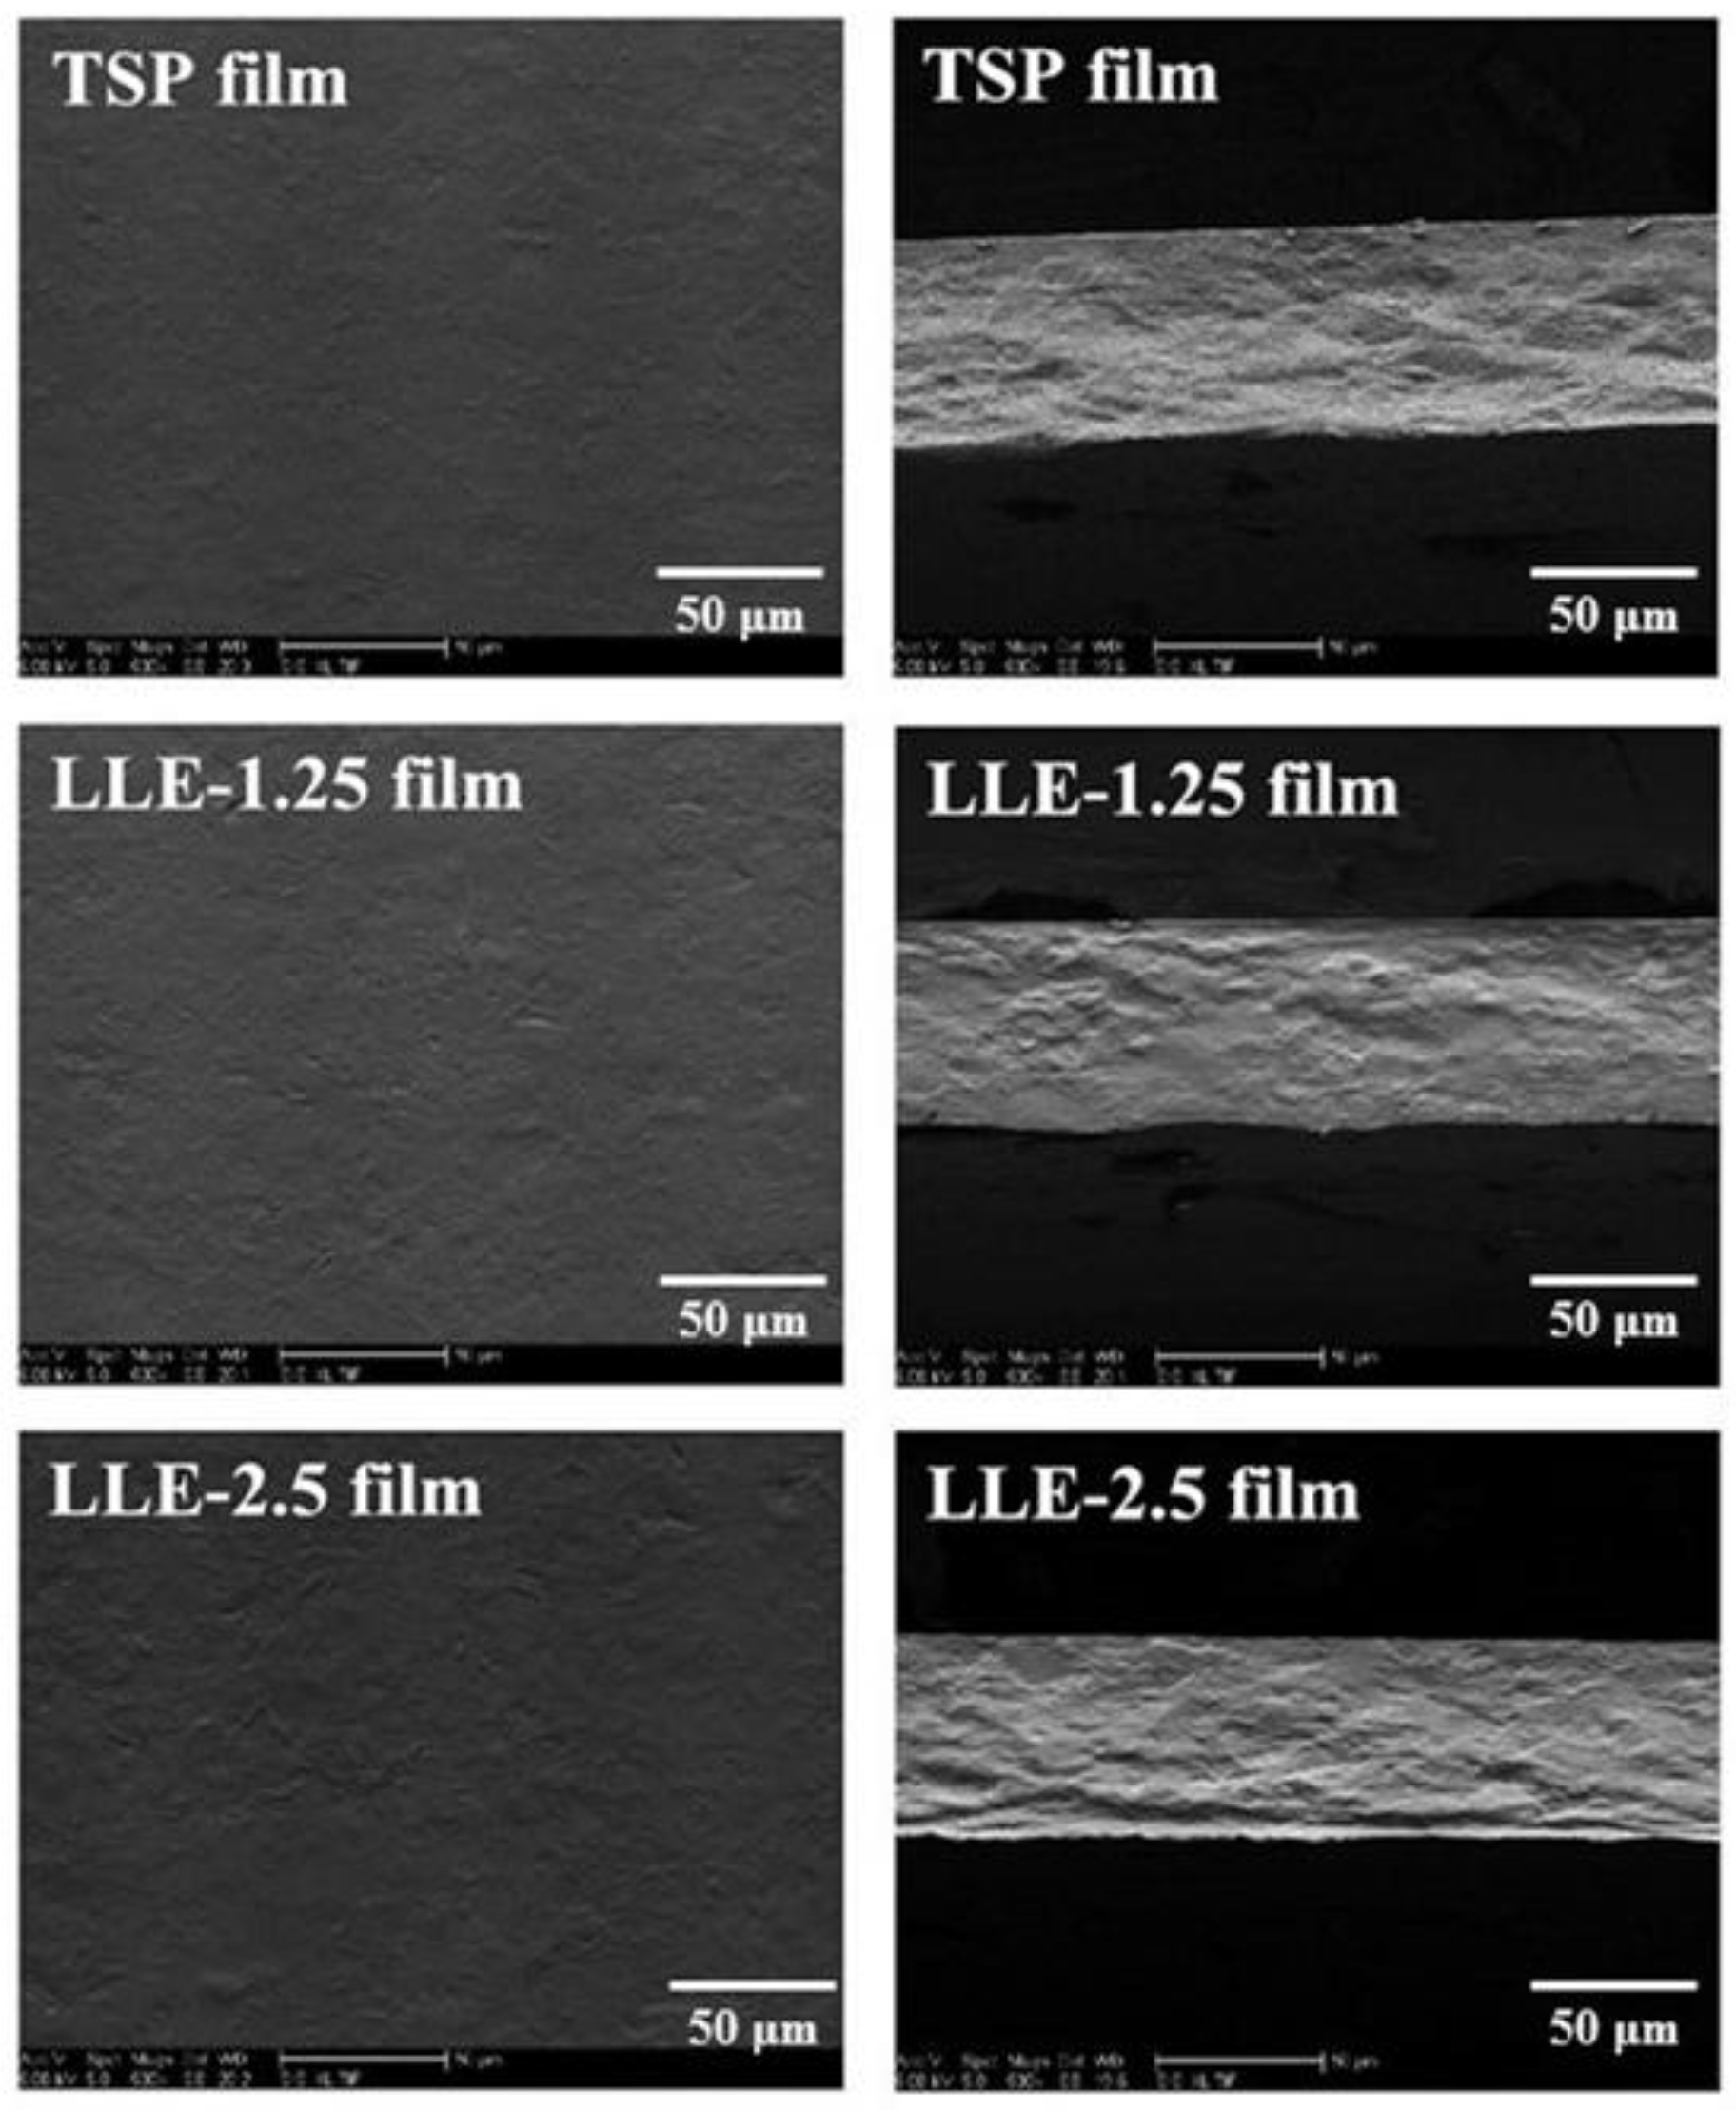
3.5. SEM Observation
3.6. Color Response Analysis of the pH-Sensing Films
3.7. Full Cream Milk Spoilage Detection by the pH-Sensing Films
4. Conclusions
Acknowledgments
Author Contributions
Conflicts of Interest
References
- Phan, T.D.; Debeaufort, F.; Luu, D.; Voilley, A. Functional properties of edible agar-based and starch-based films for food quality preservation. J. Agric. Food Chem. 2005, 53, 973–981. [Google Scholar] [CrossRef] [PubMed]
- Yoshida, C.M.P.; Maciel, V.B.V.; Mendonça, M.E.D.; Franco, T.T. Chitosan biobased and intelligent films: Monitoring pH variations. LWT-Food Sci. Technol. 2014, 55, 83–89. [Google Scholar] [CrossRef]
- Maciel, V.B.V.; Yoshida, C.M.P.; Franco, T.T. Chitosan/pectin polyelectrolyte complex as a pH indicator. Carbohydr. Polym. 2015, 132, 537–545. [Google Scholar] [CrossRef] [PubMed]
- Rindlav-Westling, Å.; Gatenholm, P. Surface composition and morphology of starch, amylose, and amylopectin films. Biomacromolecules 2003, 4, 166–172. [Google Scholar] [CrossRef] [PubMed]
- Antoniou, J.; Liu, F.; Majeed, H.; Zhong, F. Characterization of tara gum edible films incorporated with bulk chitosan and chitosan nanoparticles: A comparative study. Food Hydrocoll. 2015, 44, 309–319. [Google Scholar] [CrossRef]
- Ma, Q.Y.; Wang, L.J. Preparation of a visual pH-sensing film based on tara gum incorporating cellulose and extracts from grape skins. Sens. Actuators B Chem. 2016, 235, 401–407. [Google Scholar] [CrossRef]
- Kaur, H.; Yadav, S.; Ahuja, M.; Dilbaghi, N. Synthesis, characterization and evaluation of thiolated tamarind seed polysaccharide as a mucoadhesive polymer. Carbohydr. Polym. 2012, 90, 1543–1549. [Google Scholar] [CrossRef] [PubMed]
- Nayak, A.K.; Pal, D.; Santra, K. Tamarind seed polysaccharide-gellan mucoadhesive beads for controlled release of metformin HCl. Carbohydr. Polym. 2014, 103, 154–163. [Google Scholar] [CrossRef] [PubMed]
- Sumathi, S.; Ray, A.R. Release behaviour of drugs from tamarind seed polysaccharide tablets. J. Pharm. Pharm. Sci. 2002, 5, 12–18. [Google Scholar] [PubMed]
- Aboshosha, M.H.; Ibrahim, N.A.; Allam, E.; Elzairy, E. Preparation and characterization of polyacrylic acid/karaya gum and polyacrylic acid/tamarind seed gum adducts and utilization in textile printing. Carbohydr. Polym. 2008, 74, 241–249. [Google Scholar] [CrossRef]
- Gupta, B.D.; Sharma, S. A long-range fiber optic pH sensor prepared by dye doped sol-gel immobilization technique. Opt. Commun. 1998, 154, 282–284. [Google Scholar] [CrossRef]
- Golasz, L.B.; Silva, J.D.; Silva, S.B.D. Film with anthocyanins as an indicator of chilled pork deterioration. Food Sci. Technol. 2013, 33, 155–162. [Google Scholar] [CrossRef]
- Kato, E.T., Jr.; Yoshida, C.M.; Reis, A.B.; Melo, I.S.; Franco, T.T. Fast detection of hydrogen sulfide using a biodegradable colorimetric indicator system. Polym. Int. 2011, 60, 951–956. [Google Scholar] [CrossRef]
- Maciel, V.B.V.; Yoshida, C.M.P.; Franco, T.T. Development of a prototype of a colourimetric temperature indicator for monitoring food quality. J. Food Eng. 2012, 111, 21–27. [Google Scholar] [CrossRef]
- Makote, R.; Collinson, M.M. Organically modified silicate films for stable pH sensor. Anal. Chim. Acta 1999, 394, 195–200. [Google Scholar] [CrossRef]
- Andreou, V.G.; Clonis, Y.D. A portable fiber-optic pesticide biosensor based on immobilized cholinesterase and sol-gel entrapped bromcresol purple for in-field use. Biosens. Bioelectron. 2002, 17, 61–69. [Google Scholar] [CrossRef]
- Dong, S.; Luo, M.; Peng, G.; Cheng, W. Broad range pH sensor based on sol-gel entrapped indicators on fibre optic. Sens. Actuators B Chem. 2008, 129, 94–98. [Google Scholar] [CrossRef]
- Srivastava, S.; Sinha, R.; Roy, D. Toxicological effects of malachite green. Aquat. Toxicol. 2004, 66, 319–329. [Google Scholar] [CrossRef] [PubMed]
- Pávai, M.; Mihály, J.; Paszternák, A. pH and CO2 sensing by curcumin-coloured cellophane test strip. Food Anal. Meth. 2015, 8, 2243–2249. [Google Scholar] [CrossRef] [Green Version]
- Choi, I.; Lee, J.Y.; Lacroix, M.; Han, J. Intelligent pH indicator film composed of agar/potato starch and anthocyanin extracts from purple sweet potato. Food Chem. 2017, 218, 122–128. [Google Scholar] [CrossRef] [PubMed]
- Zhang, X.; Lu, S.; Chen, X. A visual pH sensing film using natural dyes from bauhinia blakeana dunn. Sens. Actuators B Chem. 2014, 198, 268–273. [Google Scholar] [CrossRef]
- Beecken, H.; Gottschalk, E.M.; Gizycki, V.U.; Krämer, H.; Maassen, D.; Matthies, H.G.; Musso, H.; Rathjen, C.; Zdhorszky, U. Orcein and litmus. Biotech. Histochem. 2003, 78, 289–302. [Google Scholar] [CrossRef] [PubMed]
- National Pharmacopoeia Committee. Pharmacopoeia of People’s Republic of China, 2010 ed.; Chinese Pharmacopoeia Commission: Beijing, China, 2010. [Google Scholar]
- Kiruthika, A.V.; Priyadarzini, T.R.K. Preparation, properties and application of tamarind seed gum reinforced banana fibre composite materials. Fiber. Polym. 2012, 13, 51–56. [Google Scholar] [CrossRef]
- Wang, H.X.; Hu, D.Y.; Ma, Q.Y.; Wang, L.J. Physical and antioxidant properties of flexible soy protein isolate films by incorporating chestnut (castanea mollissima) bur extracts. LWT-Food Sci. Technol. 2016, 71, 33–39. [Google Scholar] [CrossRef]
- Lakade, A.J.; Sundar, K.; Shetty, P.H. Nanomaterial-based sensor for the detection of milk spoilage. LWT-Food Sci. Technol. 2017, 75, 702–709. [Google Scholar] [CrossRef]
- Zhao, Y.B.; Zhu, L.P.; Chen, J.S.; Ma, D.G. Improving color stability of blue/orange complementary white oleds by using single-host double-emissive layer structure: Comprehensive experimental investigation into the device working mechanism. Org. Electron. 2012, 13, 1340–1348. [Google Scholar] [CrossRef]
- Musso, H.; Rathjen, C. Orcein dyes. X. Light absorption and chromophore of litmus. Chem. Ber. 1959, 92, 751–753. [Google Scholar] [CrossRef]
- Musso, H.; Beecken, H. Orcein pigments. XII. Syntheses of α-hydroxyorcein. Chem. Ber. 1961, 94, 585–600. [Google Scholar] [CrossRef]
- Arrais, A.; Diana, E.; Gervasio, G.; Gobetto, R.; Marabello, D.; Stanghellini, P.L. Synthesis, structural and spectroscopic characterization of four [(η6-pah)cr(CO)3 ] complexes (pah = pyrene, perylene, chrysene, 1,2-benzanthracene). Eur. J. Inorg. Chem. 2004, 1505–1513. [Google Scholar] [CrossRef]
- Stanghellini, P.L.; Diana, E.; Arrais, A.; Rossin, A.; Kettle, S.F. Benzene and tropilium metal complexes. Intra-and intermolecular interaction evidenced by vibrational analysis: The blue-shift hydrogen bond. Organometallics 2006, 25, 5024–5030. [Google Scholar] [CrossRef]
- Hong, J.; Chen, R.J.; Zeng, X.A.; Han, Z. Effect of pulsed electric fields assisted acetylation on morphological, structural and functional characteristics of potato starch. Food Chem. 2015, 192, 15–24. [Google Scholar] [CrossRef] [PubMed]
- Mohan, C.C.; Rakhavan, K.R.; Sudharsan, K.; Krishnan, K.R.; Babuskin, S.; Sukumar, M. Design and characterization of spice fused tamarind starch edible packaging films. LWT-Food Sci. Technol. 2016, 68, 642–652. [Google Scholar] [CrossRef]
- Priyadarshini, R.; Nandi, G.; Changder, A.; Chowdhury, S.; Chakraborty, S.; Ghosh, L.K. Gastroretentive extended release of metformin from methacrylamide-g-gellan and tamarind seed gum composite matrix. Carbohydr. Polym. 2016, 137, 100–110. [Google Scholar] [CrossRef] [PubMed]
- Nayak, A.K.; Pal, D.; Hasnain, S.M. Development, optimization and in vitro-in vivo evaluation of pioglitazone-loaded jackfruit seed starch-alginate beads. Curr. Drug Deliv. 2013, 10, 608–619. [Google Scholar] [CrossRef] [PubMed]
- Elhefian, E.A.; Nasef, M.M.; Yahaya, A.H. Preparation and characterization of chitosan/agar blended films: Part 1. chemical structure and morphology. E-J. Chem. 2012, 9, 1431–1439. [Google Scholar] [CrossRef]


| Sample | Thickness (mm) | TS (MPa) | EAB (%) | WVP (g·s−1·m−1·Pa−1 × 10⁻⁹) |
|---|---|---|---|---|
| TSP film | 0.082 ± 0.011 b | 30.20 ± 2.62 a | 69.73 ± 5.20 a | 0.399 ± 0.061 a |
| LLE-1.25 | 0.077 ± 0.003 a,b | 30.16 ± 0.24 a | 68.13 ± 5.91 a | 0.400 ± 0.060 a |
| LLE-2.5 | 0.076 ± 0.003 a | 29.97 ± 1.25 a | 60.13 ± 1.42 a | 0.434 ± 0.087 b |
| pH Value | L* | a* | b* | Pictures |
|---|---|---|---|---|
| 4.0 | 64.39 ± 0.47 c | 15.45 ± 0.26 g | 8.22 ± 0.28 e |  |
| 5.0 | 61.87 ± 0.78 b | 12.23 ± 0.45 f | 2.24 ± 0.37 d |  |
| 6.0 | 61.88 ± 1.04 b | 9.66 ± 0.38 e | −1.27 ± 0.70 c |  |
| 7.0 | 59.67 ± 1.40 a,b | 5.48 ± 0.29 d | −6.37 ± 0.23 b |  |
| 8.0 | 61.76 ± 1.57 a,b | 4.06 ± 0.21 c | −7.24 ± 1.12 a,b |  |
| 9.0 | 59.59 ± 1.53 a | 2.43 ± 0.04 a | −7.45 ± 0.03 a |  |
| 10.0 | 60.74 ± 1.17 a,b | 3.11 ± 0.17 b | −8.11 ± 0.11 a |  |
| Time (h) | L* | a* | b* | pH Value | Acidity (°T) |
|---|---|---|---|---|---|
| 0 | 51.33 ± 0.517 a | 9.22 ± 0.252 a | −4.13 ± 0.229 a | 6.78 | 16.35 |
| 6 | 54.10 ± 0.907 a | 9.38 ± 0.283 a | −3.64 ± 0.092 a,b | 6.62 | 16.36 |
| 7 | 55.03 ± 1.175 a | 10.04 ± 0.670 a,b | −3.38 ± 0.303 b | 6.54 | 18.03 |
| 8 | 53.82 ± 0.664 a | 10.48 ± 0.014 b,c | −3.08 ± 0.140 b | 6.32 | 20.55 |
| 9 | 50.92 ± 0.573 a | 11.21 ± 0.417 c | −1.01 ± 0.205 c | 5.98 | 27.26 |
| 10 | 54.11 ± 2.833 a | 11.35 ± 0.295 c | −0.82 ± 0.365 c | 5.49 | 35.23 |
© 2017 by the authors. Licensee MDPI, Basel, Switzerland. This article is an open access article distributed under the terms and conditions of the Creative Commons Attribution (CC BY) license (http://creativecommons.org/licenses/by/4.0/).
Share and Cite
Liang, T.; Wang, L. A pH-Sensing Film from Tamarind Seed Polysaccharide with Litmus Lichen Extract as an Indicator. Polymers 2018, 10, 13. https://doi.org/10.3390/polym10010013
Liang T, Wang L. A pH-Sensing Film from Tamarind Seed Polysaccharide with Litmus Lichen Extract as an Indicator. Polymers. 2018; 10(1):13. https://doi.org/10.3390/polym10010013
Chicago/Turabian StyleLiang, Tieqiang, and Lijuan Wang. 2018. "A pH-Sensing Film from Tamarind Seed Polysaccharide with Litmus Lichen Extract as an Indicator" Polymers 10, no. 1: 13. https://doi.org/10.3390/polym10010013