Article

Effects of Particle Size and Surface Chemistry on the Dispersion of Graphite Nanoplates in Polypropylene Composites

1
Institute for Polymers and Composites/I3N, University of Minho, Campus de Azurém, 4800-058 Guimarães, Portugal
2
Leibniz Institute for Polymer Research Dresden, Hohe Strasse 6, D-01069 Dresden, Germany
*
Authors to whom correspondence should be addressed.
Polymers 2018, 10(2), 222; https://doi.org/10.3390/polym10020222
Submission received: 8 December 2017 / Revised: 14 February 2018 / Accepted: 21 February 2018 / Published: 24 February 2018
(This article belongs to the Special Issue Polymer Nanocomposites)

Abstract

:
Carbon nanoparticles tend to form agglomerates with considerable cohesive strength, depending on particle morphology and chemistry, thus presenting different dispersion challenges. The present work studies the dispersion of three types of graphite nanoplates (GnP) with different flake sizes and bulk densities in a polypropylene melt, using a prototype extensional mixer under comparable hydrodynamic stresses. The nanoparticles were also chemically functionalized by covalent bonding polymer molecules to their surface, and the dispersion of the functionalized GnP was studied. The effects of stress relaxation on dispersion were also analyzed. Samples were removed along the mixer length, and characterized by microscopy and dielectric spectroscopy. A lower dispersion rate was observed for GnP with larger surface area and higher bulk density. Significant re-agglomeration was observed for all materials when the deformation rate was reduced. The polypropylene-functionalized GnP, characterized by increased compatibility with the polymer matrix, showed similar dispersion effects, albeit presenting slightly higher dispersion levels. All the composites exhibit dielectric behavior, however, the alternate current (AC) conductivity is systematically higher for the composites with larger flake GnP.

Graphical Abstract

1. Introduction

Polymer matrix-based nanocomposites have attracted intensive research and development effort, due to their potential for developing novel, cost-effective, and high-performance products for advanced engineering applications, for example, in aerospace, automotive, construction, and medicine. The development of nanocomposites with high thermal and electrical conductivity, which are normally based on the incorporation of conductive carbon nanostructures (graphite and its derivatives, graphene, carbon nanotubes, and fullerenes) [1,2], motivates particular attention given their promising applications in single molecule gas detection, transparent conducting electrodes, energy storage (supercapacitors and lithium ion batteries), transportation devices, refractory and fire-proof materials, etc. [3,4,5].
Graphite is the most thermodynamically stable and softest (1 in the Mohs hardness scale) form of carbon with high stiffness (1 TPa), and good electrical (>103 S·m−1) and in-plane thermal (~2000 W·m−1·K−1) conductivities [4,5]. Intercalation of graphite by electron donors (alkali metals) or electron acceptors (acids, halogens, and halide ions) allows for increasing the interlayer spacing and weakening the van der Waals interactions, yielding expanded graphite, with particle sizes around 300–500 µm [6,7]. This is a material of high interest for fire protection [8]. When submitted to a critical temperature or microwave radiation, intercalated graphite can expand hundreds of times relative to its initial volume, due to vaporization of the intercalate, forming exfoliated graphite (EG) [9]. In turn, ultrasonication of the latter in specific solvents or surfactant solutions results in stable suspensions (with particle sizes typically lower than 50 µm), usually designated as graphite nanoplates (GnP) [10].
In order to reach its optimal effect as composite reinforcement, graphite should be exfoliated as much as possible into its separate layers. In practice, the effective dispersion of GnP in polymeric matrices remains difficult, not only due to their inherent tendency to form cohesive clusters [11], but also because the chemical inertia of GnP precludes the development of strong interfaces with polymers. Surface modification of the nanoparticles may minimize these limitations. It can be achieved via non-covalent or covalent approaches [12]. Covalent functionalization allows the formation of strong and stable interfaces with polymeric matrices by chemical bonding of functional groups to the aromatic carbon lattice of graphene. The prevalent strategy consists on the chemical oxidation of the graphene surfaces as described by Brodie [13], Staudenmaier [14], and Hummers [15]. However, these procedures disturb the conjugated nature of the graphitic lattice by local bonding of oxygen-containing groups, shifting its hybridization state from sp2 to sp3, as indicated by Raman spectroscopy studies [16,17]. Reactions involving the cycloaddition to the π-electrons of the graphene lattice were successfully applied to carbon nanotubes [18,19], carbon nanofillers [20], and graphite nanoplates [3] under mild conditions, leading to little or no damage of their structural integrity.
Currently, it is well accepted that the dispersion of carbon nanoparticles into polymeric matrices and the electrical percolation threshold of nanocomposites are strongly dependent on nanoparticle surface chemistry [3,21,22], agglomerate density and strength [23,24], size [25], aspect ratio [26], purity [27], alignment [28,29], as well as on polymer type [30] and viscosity [31,32,33]. The influence of the majority of these parameters has been well documented for multi-walled carbon nanotubes/polymer composites, while studies with GnP/polymer composites are less abundant [3,11,25,29,34,35,36]. In particular, a thorough understanding of the dispersion and re-agglomeration phenomena of GnP in polymer melts is still lacking. Vilaverde et al. [11] investigated the dispersion and re-agglomeration of 2 and 10 wt % of GnP in polypropylene (PP) during flow under well-controlled conditions. A gradual decrease of the number and size of the GnP agglomerates was observed, regardless of the shear rate, but the magnitude of the changes was highly dependent on graphite concentration. At sufficiently low shear rates, interparticle interactions induced GnP re-agglomeration. Santos et al. [3] demonstrated that chemical modification of GnP via 1,3 dipolar cycloaddition enhanced the stability of dispersion and delayed re-agglomeration.
In this work, the effects of morphology and surface chemistry of GnP on dispersion and re-agglomeration in polypropylene are investigated. Composites containing 2 wt % of GnP with different morphology, as-received or functionalized, were prepared using a prototype small-scale extensional mixer coupled to a capillary rheometer, in order to generate well controlled flows in terms of volumetric rate and temperature. Samples of the composites were collected along the length of the mixer and cooled in liquid nitrogen for subsequent analysis. Dispersion and re-agglomeration were analyzed by microscopy, and the electrical conductivity of the composites was measured.

2. Experimental

2.1. Materials

Polypropylene copolymer (Icorene CO14RM®, from ICO Polymers, Inc., Allentown, PA, USA), in powder form, with a melt flow index of 13 g·10 min−1 (190 °C, 2.16 Kg) and a density of 0.9, was used as matrix. Three commercially available graphite nanoplates were obtained from XG Sciences (Lansing, MI, USA), their properties being summarized in Table 1 according to the company data sheets.
GnP were chemically functionalized via 1,3-dipolar cycloaddition (DCA) of an azomethine ylide, as reported elsewhere [18]. The reaction was carried out using N-benzyloxycarbonylglycine (Z-GLY-OH) 99% from Sigma Aldrich (St. Louis, MO, USA) and paraformaldehyde reagent grade, from Sigma Aldrich (St. Louis, MO, USA), homogeneously mixing with the GnP in powder form, and maintained at 250 °C for 3 h. The pyrrolidine groups formed at the surface of functionalized GnP were further covalently bonded to polypropylene-graft-maleic anhydride (PP-g-MA) containing 8–10 wt % of maleic anhydride, supplied by Sigma-Aldrich (St. Louis, MO, USA), to produce GnP covalently functionalized with PP-g-MA (fGnP-PP). The reaction was performed by refluxing in toluene during 3 h. Extensive washing with hot toluene was carried out to remove the excess PP-g-MA, and the remaining material was dried in an oven overnight at 100 °C.

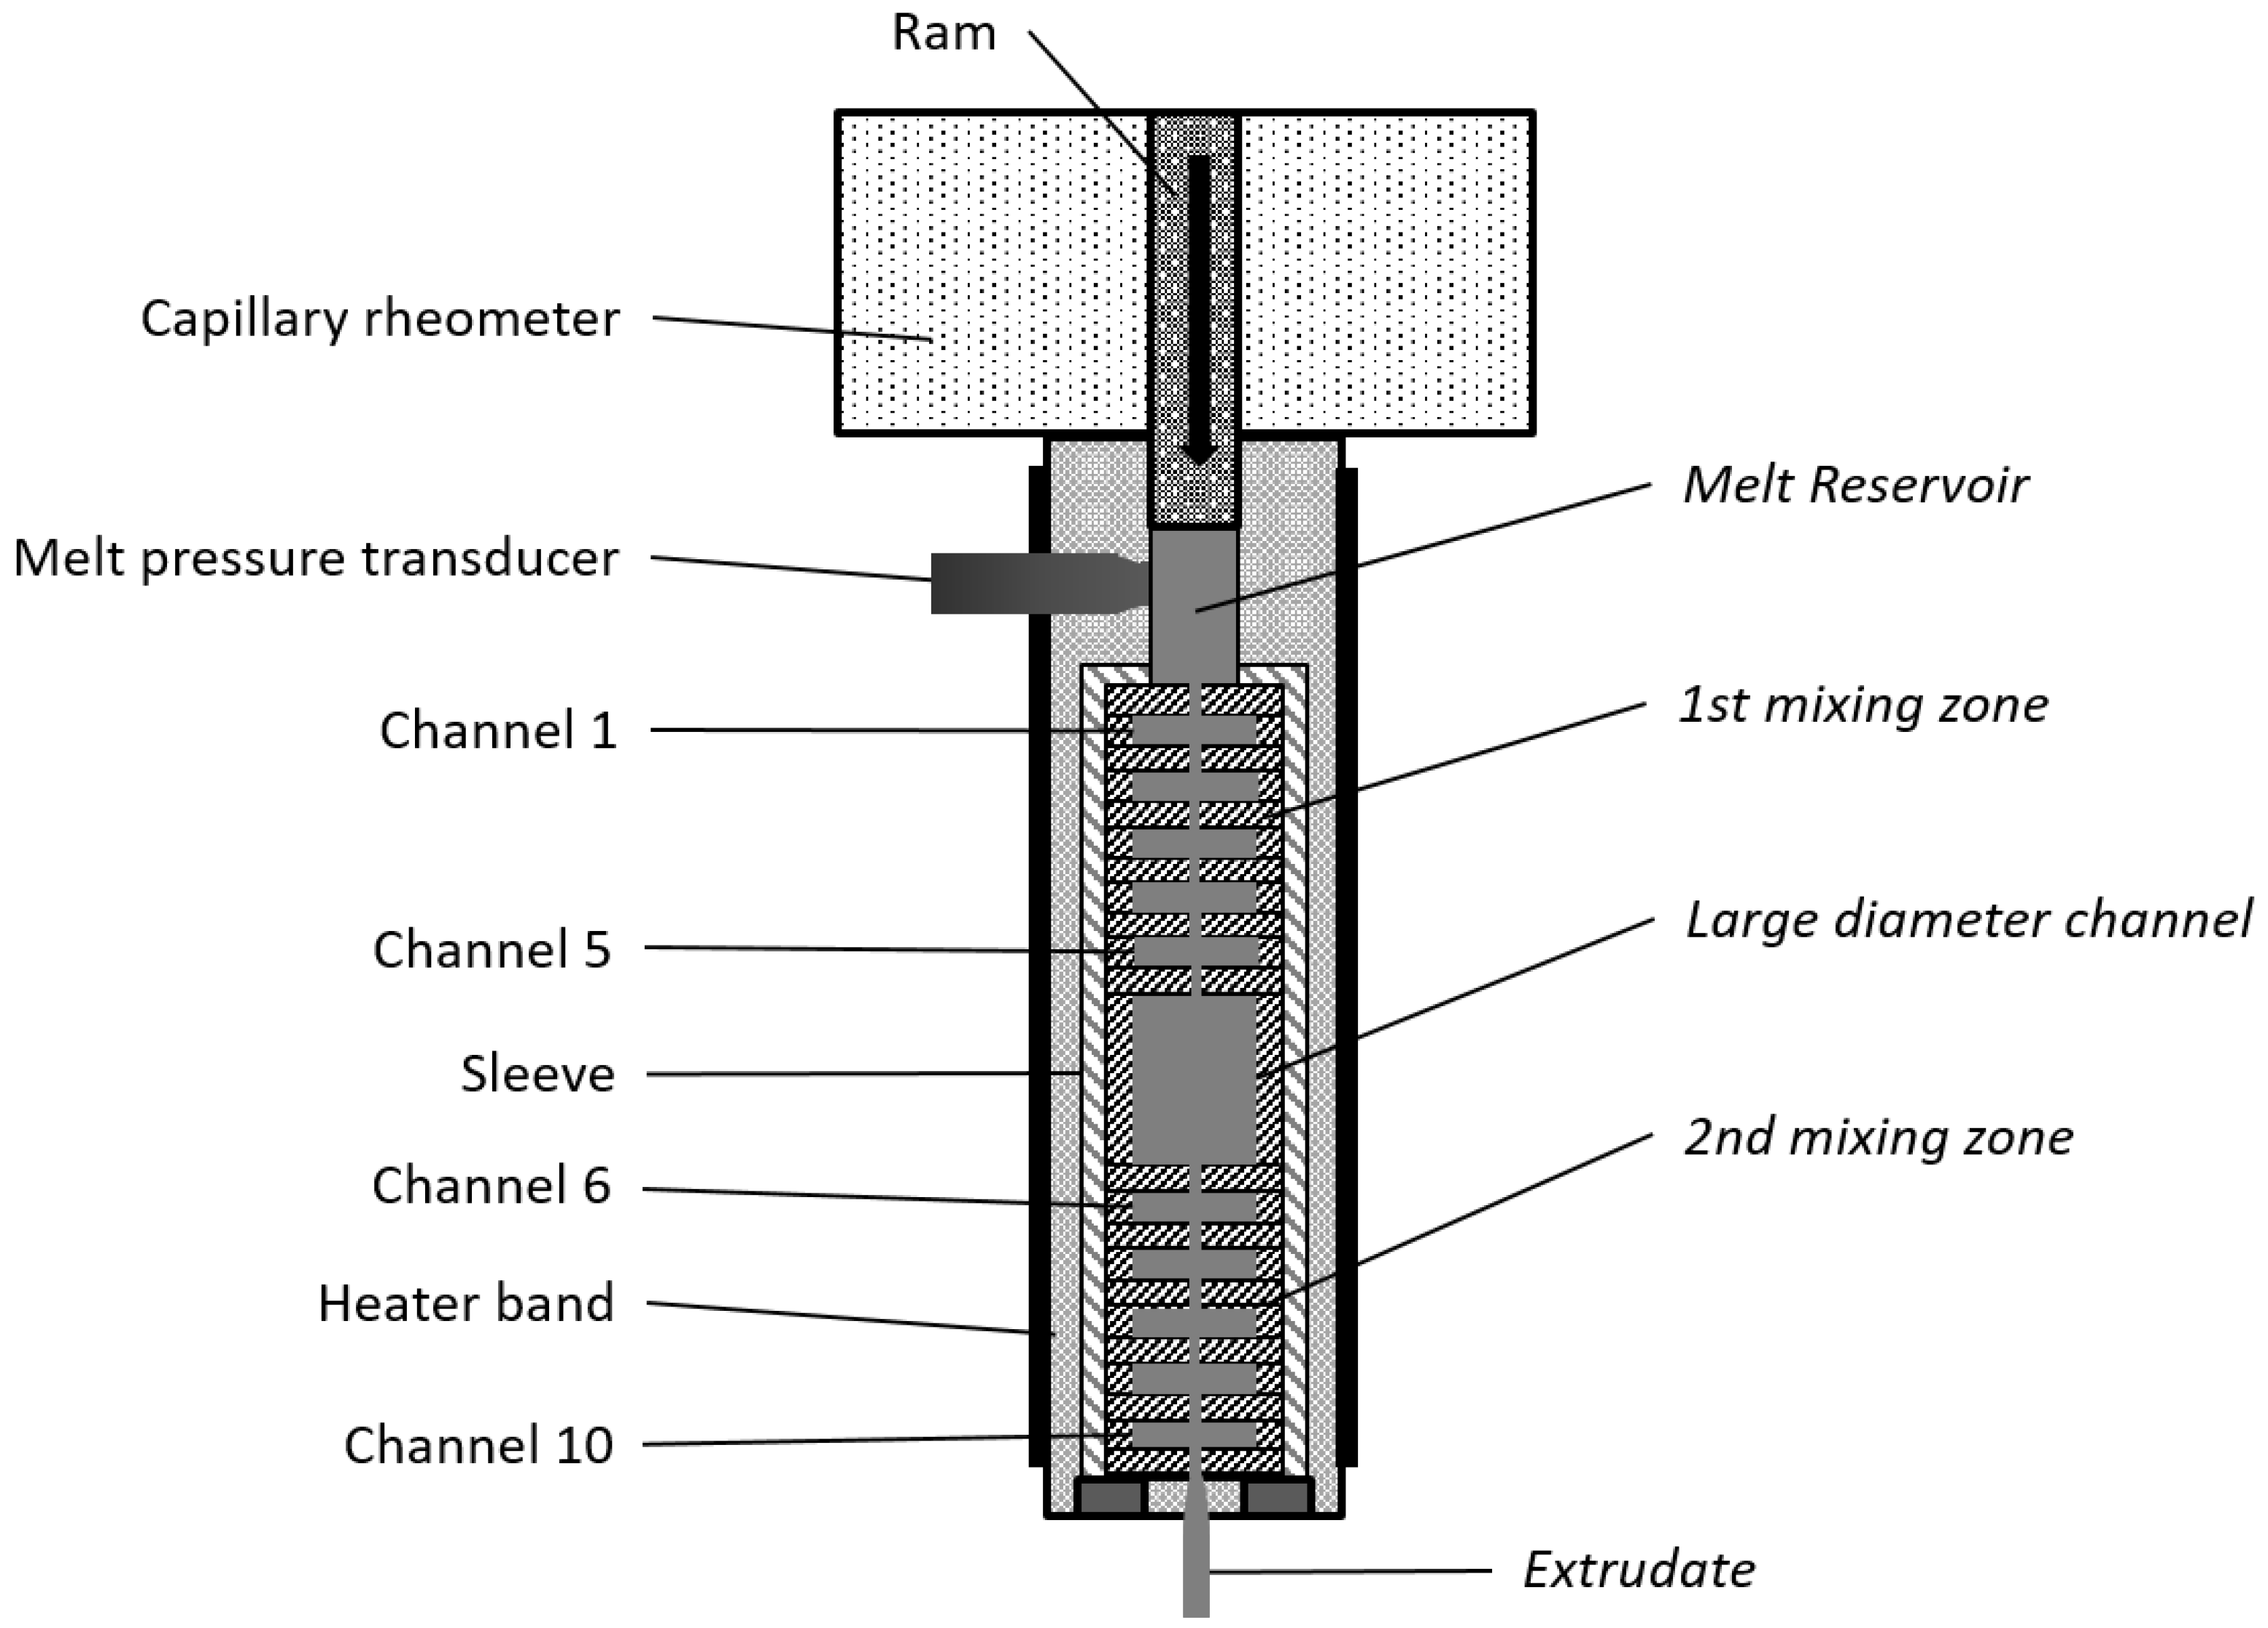
2.2. Processing of Nanocomposites

PP nanocomposites containing 2 wt % of as-received GnP or fGnP-PP, pre-mixed in powder form, were processed in a small-scale extensional mixer attached to a Rosand RH10 capillary rheometer (Malvern Instruments Limited, Malvern, UK), heated to a predefined temperature, and forced through the system at 50 mm·min−1, after preheating for 5 min. This GnP loading and flow rate were selected based on previous dispersion studies of 2 and 10 wt % GnP in PP [3,11], demonstrating that monitoring dispersion and re-agglomeration of nanocomposites containing high GnP concentrations was hindered by the large amount of agglomerates present. The temperature was adjusted so that the total pressure drop, i.e., the hydrodynamic stresses, would remain approximately uniform.
The mixer consists of three main sections (see Figure 1). Initially, the material streams through a sequence of 10 circular channels with alternating diameters, d (d = 1 and d = 8 mm, length = 2 mm) that create a series of converging/diverging flows, with a strong extensional component (this will be denoted as first mixing zone). The average shear rate attains approximately 1500 s–1 in the smaller channels. As demonstrated by Grace [37] for liquid suspensions, normal stresses are more efficient for dispersion than shear stresses. Consequently, at the outlet of this first mixing zone, extensive dispersion levels are anticipated. In order to assess the stability of the dispersion achieved, the material enters the second section of the mixer, which contains a larger cylindrical channel (d = 18 mm and length = 24 mm) where shear rates are negligible (0.3 s−1 in the experiments performed). Stress relaxation occurs, and re-agglomeration could eventually develop. The third section of the mixer is identical to the first one (and denoted as second mixing zone). The aim here is to subject the composite to similarly high deformation rates, and again, induce dispersion. The set-up is of modular construction. It is not only possible to vary the number and geometry of the individual channels, but material samples can be collected from the larger channels (with d = 8 and d = 18 mm), as well as from the reservoir of the rheometer, cooled in liquid nitrogen, and subsequently characterized. It was shown that the levels of dispersion obtained with this device are comparable to those achieved with the frequently used twin screw extruder [22,38].

2.3. Characterization of Graphite Nanoplates

The area of the as-received GnP and fGnP-PP primary particle agglomerates was measured by optical microscopy (OM) using a BH2 Olympus microscope attached to a Leica DFC 280 digital camera (Hamburg, Germany). Samples were prepared by hand mixing a small amount of GnP in epoxy resin, spreading a thin layer on a glass slide, and curing it at room temperature overnight. At least 130 optical micrographs were analyzed for each powder type. The morphology of the as-received GnP and fGnP-PP was characterized by transmission electron microscopy (TEM), by means of a JEOL (Peabody, MA, USA) JEM1010 equipped with a CCD Orius camera and a tungsten filament as electron source, at an acceleration voltage of 100 kV (GnPC and GnPH), and a Philips CM20 with EDS system at an acceleration voltage of 200 kV (GnPH). Particles were previously dispersed in a dilute butyl alcohol solution (1.2 g·L−1), submitted to ultrasonication for two hours, deposited on a carbon coated copper grid, and dried under a lamp.

2.4. Characterization of Nanocomposites

PP/GnP nanocomposite sections with a thickness of 10 µm were cut perpendicularly and parallel to the flow direction with a Leitz 1401 microtome at room temperature, using glass knives with an angle of 45°. Optical micrographs were acquired using a Leica DFC 280 digital camera coupled to a BH2 Olympus microscope. For each composite, at least 12 micrographs were analyzed using ImageJ® software (open source), leading to an investigated total area of 4.2 mm2. The area of the agglomerates larger than 5 µm2 was measured, implying that smaller agglomerate areas were not accounted for in the statistical study. The total number of agglomerates measured for the analysis (N) was identified. The average agglomerate area (Aav) was calculated, as well as its variance within a confidence interval of 95%. The parameters used to describe the degree of GnP dispersion were the agglomerate area ratio (Ar) and the number of agglomerates per unit area (NA). Ar is defined as the ratio between the sum of the areas of all agglomerates (∑GnP) and the total composite area analyzed (AT), as indicated in Equation (1),
A r = GnP A T × 100
thus providing a convenient overall dispersion index. A cumulative distribution of the agglomerate areas can be defined as
C A j = i = 1 j A i GnP × 100
where ∑Ai is the summation of the areas of the individual agglomerates i in ascending area order. CAj provides detailed information about the size distribution of the surviving agglomerates. For example, it allows for the comparison of the agglomerate area populations of the composites collected along the mixer.
TEM analysis of the GnPC composite was carried out in a Libra 120 microscope (Carl Zeiss Microscopy GmbH, Oberkochen, Germany) at 120 kV. The specimens were cut into approx. 80 nm thin sections with a diamond knife (DiATOME AG, Biel, Switzerland) using an Ultracut UC6 ultramicrotome (Leica Microsystems GmbH, Wetzlar, Germany).
The alternate current (AC) electrical conductivity of PP/GnP nanocomposites was measured with a Quadtech (Sussex, WI, USA) 1920 Precision LCR meter directly on the disks collected from the last flow channel, near to the mixer outlet. Experiments were performed at room temperature at a voltage of 1 V, in the frequency range of 5 × 10²–1 × 10⁶ Hz. Circular contacts with a diameter of 6 mm and a thickness of 50 nm were produced by magnetron sputtering of gold/palladium.

3. Results and Discussion

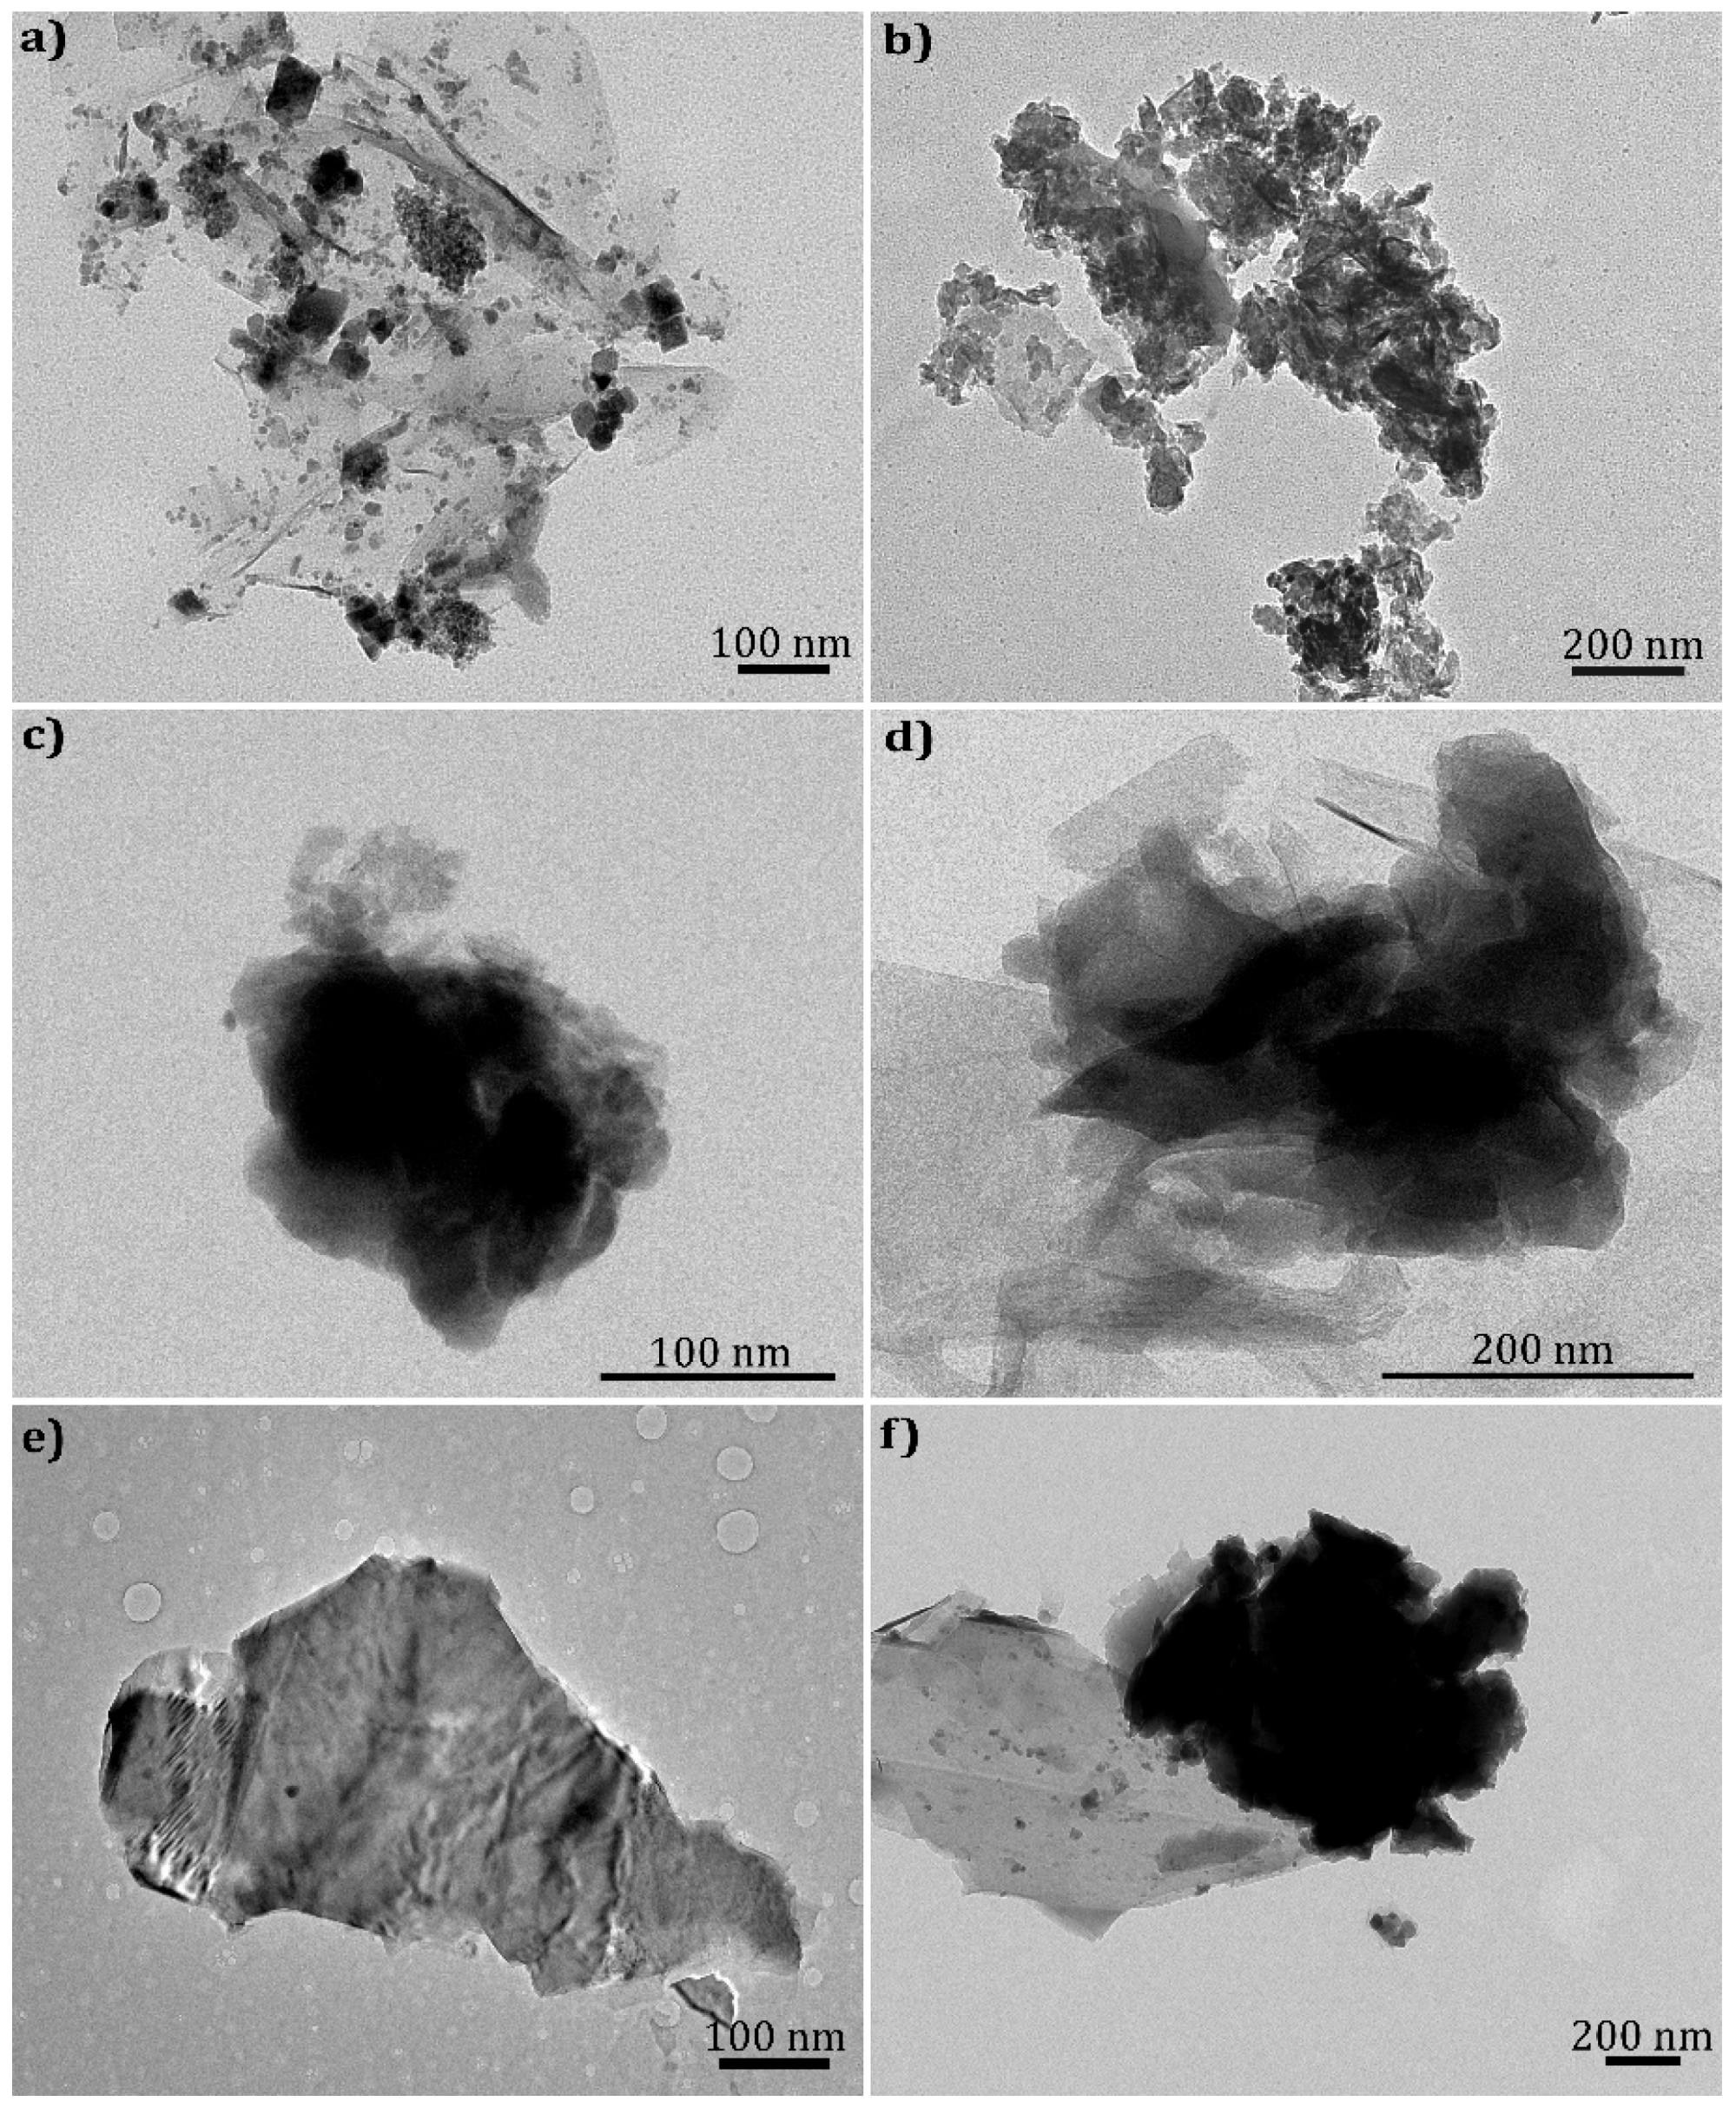
3.1. Graphite Nanoplates Size and Morphology

Graphite nanoplates with different widths and thicknesses (see Table 1) were supplied in powder form. Typically, their primary nanoparticles form agglomerates with high cohesive strength, which has practical consequences on the rate and intensity of dispersion in the polymer melt during nanocomposite processing. The average area of the as-received GnP and fGnP-PP primary nanoparticle agglomerates, and the significance within a 95% confidence interval, was calculated and is presented in Table 2. Different average areas were measured for each GnP type, and it was consistently observed that the nanoparticles functionalized with PP-g-MA formed larger agglomerates. Figure 2 depicts TEM micrographs of all powders used in this work, showing their flake morphology. As-received GnPC is composed of smaller flakes compared to GnPM and GnPH. After surface chemical modification, the morphology of all graphite nanoplates seems to be maintained, despite the increase in size, suggesting that the method carried out under the conditions described does not induce damage of the GnP structure.

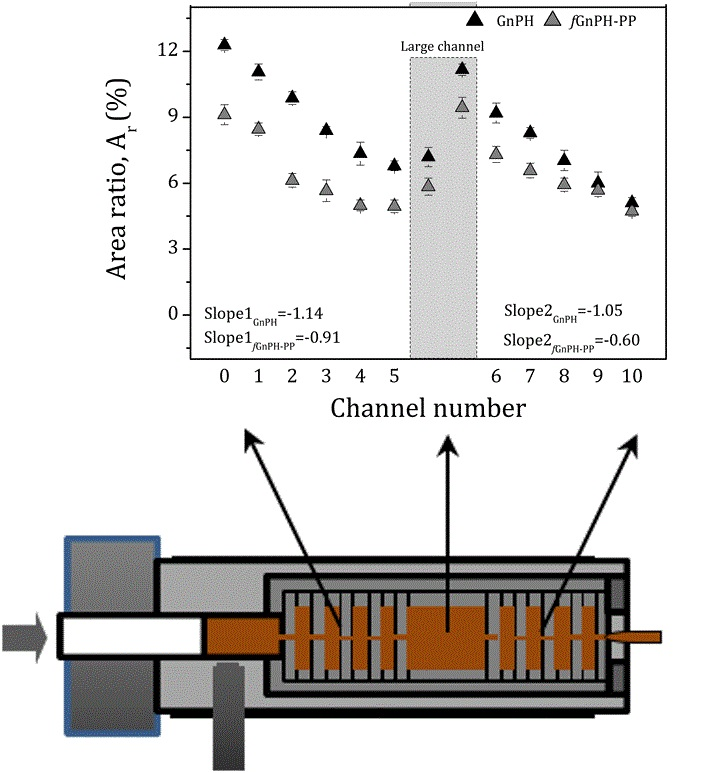
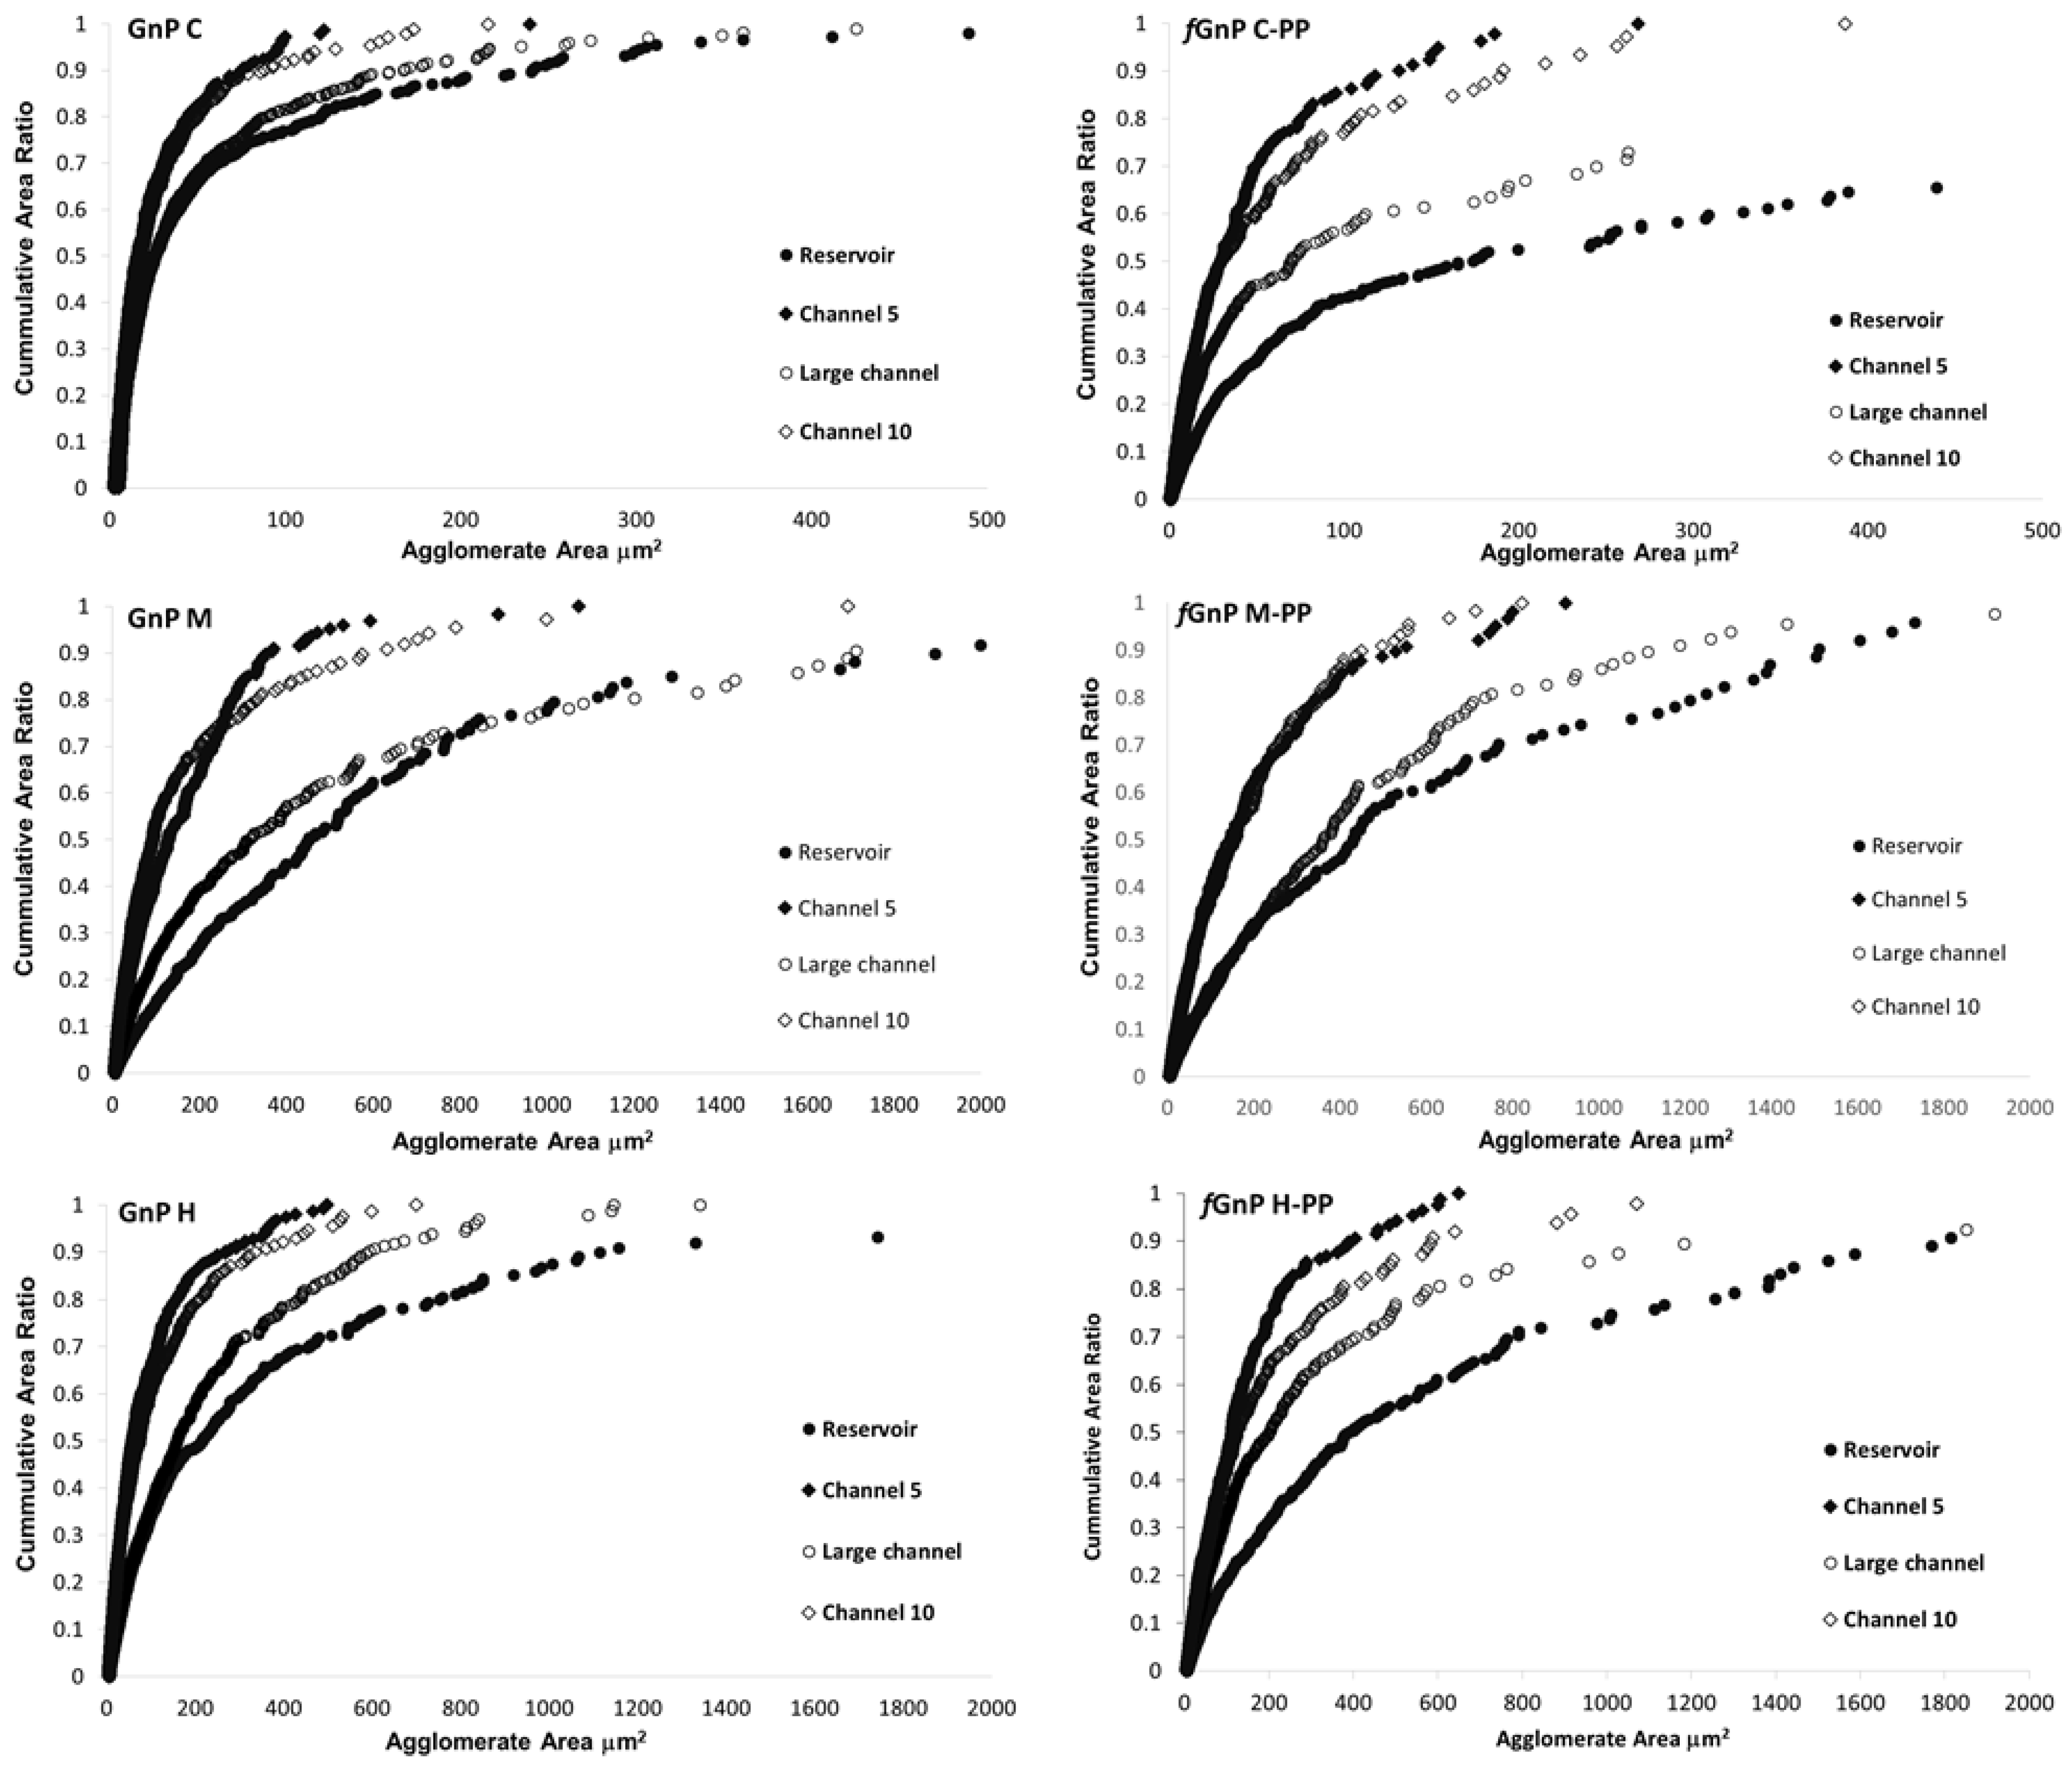
3.2. Dispersion of the Graphite Nanoplates in Polypropylene

Optical micrographs illustrating the morphology of the GnP agglomerates for as-received and functionalized GnP in the PP nanocomposites are presented in Figure 3. The images depict the changes in GnP agglomerate size as the melt progresses along the extensional mixer, from the reservoir of the capillary rheometer to the exit of the mixer. In channel 3, the composite has been subjected to three converging/diverging flows. Channel 5 corresponds to the fifth and last converging/diverging sequence of the first mixing zone, before the material advances in the larger cylindrical channel into channel 8. The melt was again subjected to three converging/diverging flows. Finally, channel 10 induces the last converging/diverging sequence prior to the material exiting the mixer (thus, channels 8 and 10 belong to the second mixing zone). Differences in size of the agglomerates at the various locations along the mixer are readily identifiable, with a notorious increase in size in the long channel. Differences in the behavior of the various grades of GnP are also evident. TEM micrographs of the GnPC composites presented in Figure 4 illustrate the dispersion effect as observed at high magnification. At the nanometer scale, larger and denser agglomerates are observed at the reservoir, becoming smaller after channel 3, reforming inside the large channel (although appearing to be less dense), and decreasing in size again after passing channel 10.
The results of the OM analysis are summarized in Table 3, which presents, for the same locations of the mixer in Figure 3, and also at the reservoir of the rheometer, the average agglomerate areas (Aav) and their significance within a 95% confidence interval, the number of agglomerates per unit area of the composite sections analyzed (NA), and the total number of agglomerates measured for the analysis (N). Interestingly, the Aav of the as-received and functionalized GnP agglomerates in the composite collected from the reservoir are approximately three times smaller than the corresponding powder average area, for all GnP types (Table 2). This is indicative that pressing the powder and melting the polymer by heat conduction from the barrel of the rheometer and flow under low shear rate create enough thermomechanical stresses to initiate GnP agglomerate breakage. From the reservoir to channel 5, a decrease in GnP size, as well as in the number of agglomerates per unit area of composite cross-section, is evident for all GnP grades and functionalized equivalents. At the large cylindrical channel, where the average shear rate is very low (~0.3 s−1) and the local residence time is substantial, the GnP agglomerates reorganize and undergo re-agglomeration. The area of the agglomerates rises to values close to those of the agglomerates present inside the reservoir of the rheometer. Simultaneously, the number of agglomerates per unit area, NA, increases relative to those present in channel 5, although they are less than those in the reservoir, for all GnP types. This could suggest that the morphology/cohesiveness of the new agglomerates might be distinct from those in the melt in the reservoir. In the second mixing zone (from channel 6 to channel 10), the average size of the agglomerates reduces, demonstrating again that increasing the shear rate resets dispersion. The Aav reached in channel 10 is similar to that achieved in channel 5. These results are globally in line with those obtained for PP/MWCNT composites being processed and reprocessed under identical operating conditions [38,39].
Figure 5 displays the cumulative distribution of the agglomerate areas, CAi, for the as-received and chemically modified particles. For the sake of clarity, only the cumulative distributions of the agglomerate areas of the composites in the reservoir, channel 5 (end of first mixing zone), large channel (where nanoparticle re-agglomeration was observed), and channel 10 (end of second mixing zone) are represented. The composites with all GnP types, with and without functionalization, present a wide distribution of agglomerate areas with large agglomerates in the reservoir, while the narrower distributions with smaller agglomerates are mostly observed in channel 5. The large channel allows substantial re-agglomeration, reforming large agglomerates and presenting a wide distribution of agglomerate areas, although smaller than measured in the reservoir. Finally, in channel 10, at the exit of the second mixing zone, the agglomerates are smaller and form a narrow distribution, approaching that observed in channel 5. GnPC and fGnPC-PP form considerably smaller agglomerates compared to GnPM, fGnPM-PP, GnPH, and fGnPH-PP. The cumulative distributions of the agglomerates formed by GnPM and GnPH are of comparable width, with agglomerate sizes of similar magnitude. Functionalization of the nanoparticles did not significantly change the range of agglomerate sizes formed.
The state of dispersion of carbon nanoparticles is commonly associated to the inverse of Ar, i.e., complete dispersion at the microscopic level corresponds to Ar = 0, while composites containing a large number of agglomerates and/or large agglomerate areas present high values of Ar. The Ar values obtained for GnPC, GnP M, and GnPH and functionalized equivalents, are depicted in Figure 6. In all cases, Ar shows a consistent, almost linear, decrease from the reservoir to the end of the first mixing section (channel 5). Two samples from the large channel were collected and analyzed, one from a location near to its entrance, the other near to the exit. Figure 6 clearly demonstrates that a systematic increase of Ar along the relaxation chamber takes place, showing evidence for GnP or fGnP-PP re-agglomeration. The values of Ar attained approach those measured upstream in the reservoir (channel 0). However, as noted above, these new agglomerates could have distinct cohesiveness or shape, as these characteristics do not influence the values of Ar. When the composite melt is resubmitted between channels 6 to 10 to the shear rate conditions imposed along the first mixing zone, Ar decreases and reaches values similar to those attained at the outlet of channel 5.
The rate of Ar evolution along the equipment varies with GnP type, as perceived from the linear slopes indicated in Figure 6. These observations may be analyzed in light of the rupture and erosion dispersion mechanisms of agglomerated particles in melts postulated by Manas-Zloczower and co-workers [40,41]. These authors postulated that the route to dispersion depends on the magnitude of a fragmentation number, Fa, and on the on the probability for break-up, Pbreak. Fa balances the hydrodynamic stresses against the cohesive strength of the agglomerate. As Fa increases progressively above 1, erosion (2 ≤ Fa < 5) or rupture (Fa ≥ 5) will become gradually predominant. The quasi-linear progression of dispersion along the mixer seems to indicate that a single dispersion route is pursued, probably rupture, as erosion is known to be a slow process [42]. Pbreak is proportional to the residence time and agglomerate area. Thus, at constant stress, which is the case of the experiments performed (where the total pressure drop was kept approximately constant), the smaller the agglomerate, the longer the exposure time required to break it. As seen in Figure 6, the slopes follow the rank GnPH > GnPM > GnPC, consistent with the increase in the area-to-volume ratio for these nanoparticles which, according to the particle dimensions indicated by the producer, is approximately 0.13, 0.33, and 1.0 for GnPH, GnPM, and GnPC, respectively. Thus, Figure 6 shows that the smaller the nanoparticle (and thus, the larger its area-to-volume ratio), the slower is its kinetics of dispersion.
The discussion above remains valid for the various fGnP-PP. Nevertheless, two further observations seem relevant: (i) The overall dispersion level reached for fGnP-PP is systematically higher compared to as-received GnP; (ii) chemical modification of the GnP surface did not significantly change the re-agglomeration behavior.

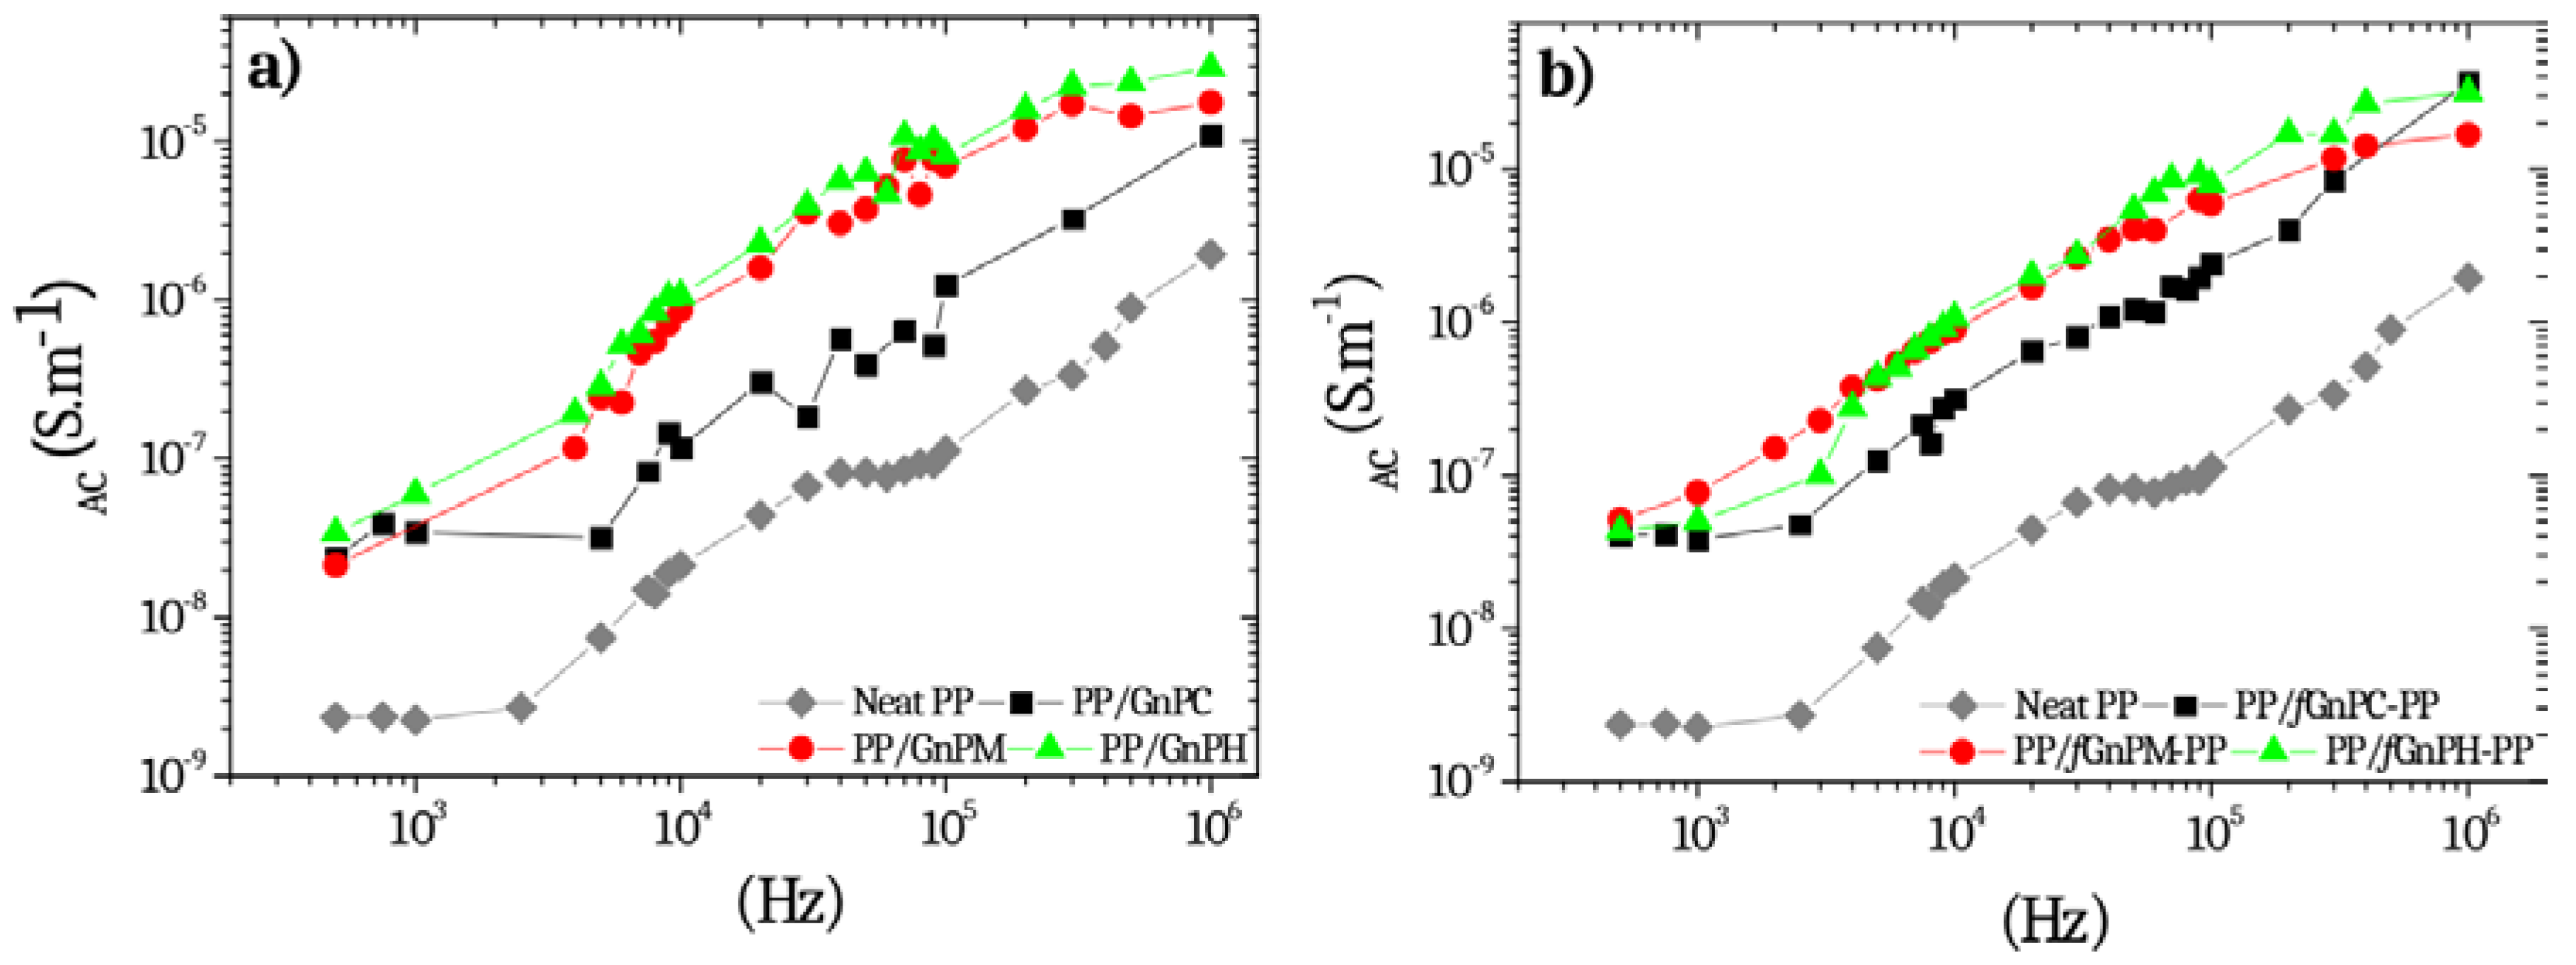
3.3. Electrical Conductivity of the Nanocomposites

The effects of size and surface chemistry of graphite nanoplates on the AC electrical conductivity of PP nanocomposites are shown in Figure 7a,b, respectively. PP shows a typical behavior of a dielectric material, the electrical conductivity increasing with the frequency in a logarithmic scale. The incorporation of 2 wt % of as-received GnP and fGnP-PP increased slightly the electrical conductivity of PP from 10−9 to 10−8 S/m at 1 KHz. However, nanocomposites still exhibit a frequency-dependent behavior, showing that the formation of an interconnected conductive network was not achieved. As shown elsewhere [3,11,35], even at filler loadings as high as 10 wt %, percolation may not be achieved. No significant differences on the AC conductivity of PP composites containing 2 wt % graphite nanoplates with different widths and thicknesses were found, however, the AC conductivity is systematically higher for the composites with larger GnP flake.

4. Conclusions

The dispersion of different GnP grades in a PP melt was carried out in a prototype extensional mixer under constant hydrodynamic stress conditions, in order to investigate the influence of the GnP flake size on dispersion rate and stability. GnP flakes with larger surface area (smaller flake size) and higher bulk density presented smaller agglomerate size in the powder form and final smaller average agglomerate area, as measured by OM in the PP composite, in contrast with the GnP with larger flakes and lower bulk density.
The degree of dispersion, as defined by the agglomerate area ratio, Ar, increased linearly along the mixer length, irrespective of the GnP morphology and bulk density; however, the dispersion rate along the mixer was lower for the smaller flakes with higher bulk density. Once a certain dispersion level is attained, if the composite is made to flow at sufficiently low shear rates during enough time, an increase of the Ar was observed for all the GnP types, indicating re-agglomeration of GnP, subjecting the composite to the same flow conditions as before induces dispersion, although at a slightly lower rate compared to the first mixing zone, which may be indicative of differences in the agglomerate cohesive forces before and after re-agglomeration.
Functionalization by covalent bonding polymer molecules to the GnP surface should increase the GnP/PP compatibility and interfacial strength; the functionalized GnP showed similar dispersion effects as observed for the pristine GnP, however, presenting slightly higher dispersion levels.
The 2 wt % GnP composites presented dielectric behavior, but the AC conductivity was systematically higher for the composites with larger GnP flakes (with and without functionalization).

Acknowledgments

This work was funded by National Funds through FCT-Portuguese Foundation for Science and Technology, Reference UID/CTM/50025/2013 and FEDER funds through the COMPETE 2020 Programme under the project number POCI-01-0145-FEDER-007688. We acknowledge Mrs. Uta Reuter from Leibniz-Institut für Polymerforschung Dresden e.V. for TEM specimen preparation and image acquisition for the composites.

Author Contributions

José A. Covas designed the extensional mixer, originated the overall motivation of the work and participated in the discussion of the results. Maria C. Paiva developed the functionalization methodology, performed the statistical analysis and contributed to the discussion of the results. Raquel M. Santos performed the experimental work. Petr Formánek contributed with the TEM analysis of the composites. Sacha T. Mould performed statistical analysis of some of the data.

Conflicts of Interest

The authors declare no conflict of interest.

References

  1. Geim, A.K.; Novoselov, K.S. The rise of graphene. Nat. Mater. 2007, 6, 183–191. [Google Scholar] [CrossRef] [PubMed]
  2. Sur, U.K. Graphene: A rising star on the horizon of materials science. Int. J. Electrochem. 2012, 2012, 1–12. [Google Scholar] [CrossRef]
  3. Santos, R.M.; Vilaverde, C.; Cunha, E.; Paiva, M.C.; Covas, J.A. Probing dispersion and re-agglomeration phenomena upon melt-mixing of polymer-functionalized graphite nanoplates. Soft Matter 2015, 12, 77–86. [Google Scholar] [CrossRef] [PubMed] [Green Version]
  4. Tian, X.; Itkis, M.E.; Bekyarova, E.B.; Haddon, R.C. Anisotropic thermal and electrical properties of thin thermal interface layers of graphite nanoplatelet-based composites. Sci. Rep. 2013, 3, 1710. [Google Scholar] [CrossRef]
  5. Randviir, E.P.; Brownson, D.A.C.; Banks, C.E. A decade of graphene research: Production, applications and outlook. Mater. Today 2014, 17, 426–432. [Google Scholar] [CrossRef]
  6. Jang, B.Z.; Zhamu, A. Processing of nanographene platelets (NGPs) and NGP nanocomposites: A review. J. Mater. Sci. 2008, 43, 5092–5101. [Google Scholar] [CrossRef]
  7. Bousmina, M. Study of intercalation and exfoliation processes in polymer nanocomposites. macromolecules 2006, 39, 4259–4263. [Google Scholar] [CrossRef]
  8. Steurer, P.; Wissert, R.; Thomann, R.; Mülhaupt, R. Functionalized graphenes and thermoplastic nanocomposites based upon expanded graphite oxide. Macromol. Rapid Commun. 2009, 30, 316–327. [Google Scholar] [CrossRef] [PubMed]
  9. Chung, D.D.L. Exfoliation of graphite. J. Mater. Sci. 1987, 22, 4190–4198. [Google Scholar] [CrossRef]
  10. Bianco, A.; Cheng, H.-M.; Enoki, T.; Gogotsi, Y.; Hurt, R.H.; Koratkar, N.; Kyotani, T.; Monthioux, M.; Park, C.R.; Tascon, J.M.D.; et al. All in the graphene family–A recommended nomenclature for two-dimensional carbon materials. Carbon 2013, 65, 1–6. [Google Scholar] [CrossRef]
  11. Vilaverde, C.; Santos, R.M.; Paiva, M.C.; Covas, J.A. Dispersion and re-agglomeration of graphite nanoplates in polypropylene melts under controlled flow conditions. Compos. A 2015, 78, 143–151. [Google Scholar] [CrossRef] [Green Version]
  12. Liu, J.; Tang, J.; Gooding, J.J. Strategies for chemical modification of graphene and applications of chemically modified graphene. J. Mater. Chem. 2012, 22, 12435–12452. [Google Scholar] [CrossRef]
  13. Brodie, B.C. On the Atomic Weight of Graphite. Philos. Trans. R. Soc. Lond. 1859, 149, 249–259. [Google Scholar] [CrossRef]
  14. Staudenmaier, L. Verfahren zur darstellung der graphitsäure. Eur. J. Inorg. Chem. 1898, 31, 1481–1487. [Google Scholar] [CrossRef]
  15. Hummers, W.S., Jr.; Offeman, R.E. Preparation of graphitic oxide. J. Am. Chem. Soc. 1958, 80, 1339. [Google Scholar] [CrossRef]
  16. Stankovich, S.; Dikin, D.A.; Piner, R.D.; Kohlhaas, K.A.; Kleinhammes, A.; Jia, Y.; Wu, Y.; Nguyen, S.T.; Ruoff, R.S. Synthesis of graphene-based nanosheets via chemical reduction of exfoliated graphite oxide. Carbon 2007, 45, 1558–1565. [Google Scholar] [CrossRef]
  17. Poh, H.L.; Sanek, F.L.; Sanek, F.; Ambrosi, A.; Zhao, G.; Sofer, Z.; Pumera, M. Graphenes prepared by staudenmaier, hofmann and hummers methods with consequent thermal exfoliation exhibit very different electrochemical properties. Nanoscale 2012, 4, 3515–3522. [Google Scholar] [CrossRef] [PubMed]
  18. Paiva, M.C.; Simon, F.; Novais, R.M.; Ferreira, T.; Proença, M.F.; Xu, W.; Besenbacher, F. Controlled functionalization of carbon nanotubes by a solvent-free multicomponent approach. ACS Nano 2010, 4, 7379–7386. [Google Scholar] [CrossRef] [PubMed]
  19. Georgakilas, V.; Kordatos, K.; Prato, M.; Guldi, D.M.; Holzinger, M.; Hirsch, A. Organic functionalization of carbon nanotubes. J. Am. Chem. Soc. 2002, 124, 760–761. [Google Scholar] [CrossRef] [PubMed]
  20. Araújo, R.; Fernandes, F.M.; Proença, M.F.; Silva, C.J.R.; Paiva, M.C. The 1,3-dipolar cycloaddition reaction in the functionalization of carbon nanofibers. J. Nanosci. Nanotechnol. 2007, 7, 3441–3445. [Google Scholar] [CrossRef] [PubMed]
  21. Liebscher, M.; Gartner, T.; Tzounis, L.; Micusik, M.; Pötschke, P.; Stamm, M.; Heinrich, G.; Voit, B. Influence of the MWCNT surface functionalization on the thermoelectric properties of melt-mixed polycarbonate composites. Compos. Sci. Technol. 2014, 101, 133–138. [Google Scholar] [CrossRef]
  22. Novais, R.M.; Covas, J.A.; Paiva, M.C. The effect of flow type and chemical functionalization on the dispersion of carbon nanofiber agglomerates in polypropylene. Compos. A 2012, 43, 833–841. [Google Scholar] [CrossRef]
  23. Pegel, S.; Pötschke, P.; Petzold, G.; Alig, I.; Dudkin, S.M.; Lellinger, D. Dispersion, agglomeration, and network formation of multiwalled carbon nanotubes in polycarbonate melts. Polymer 2008, 49, 974–984. [Google Scholar] [CrossRef]
  24. Krause, B.; Mende, M.; Pötschke, P.; Petzold, G. Dispersability and particle size distribution of CNTs in an aqueous surfactant dispersion as a function of ultrasonic treatment time. Carbon 2010, 48, 2746–2754. [Google Scholar] [CrossRef]
  25. Chatterjee, S.; Nafezarefi, F.; Tai, N.H.; Schlagenhauf, L.; Nuesch, F.A.; Chu, B.T.T. Size and synergy effects of nanofiller hybrids including graphene nanoplatelets and carbon nanotubes in mechanical properties of epoxy composites. Carbon 2012, 50, 5380–5386. [Google Scholar] [CrossRef]
  26. Guo, J.; Liu, Y.; Prada-Silvy, R.; Tan, Y.; Azad, S.; Krause, B.; Pötschke, P.; Grady, B.P. Aspect ratio effects of multi-walled carbon nanotubes on electrical, mechanical, and thermal properties of polycarbonate/MWCNT composites. J. Polym. Sci. B 2014, 52, 73–83. [Google Scholar] [CrossRef]
  27. Morcom, M.; Atkinson, K.; Simon, G.P. The effect of carbon nanotube properties on the degree of dispersion and reinforcement of high density polyethylene. Polymer 2010, 51, 3540–3550. [Google Scholar] [CrossRef]
  28. Versavaud, S.; Régnier, G.; Gouadec, G.; Vincent, M. Influence of injection molding on the electrical properties of polyamide 12 filled with multi-walled carbon nanotubes. Polymer 2014, 55, 6811–6818. [Google Scholar] [CrossRef] [Green Version]
  29. Kim, H.; Macosko, C.W. Processing-property relationships of polycarbonate/graphene composites. Polymer 2009, 50, 3797–3809. [Google Scholar] [CrossRef]
  30. Kasaliwal, G.R.; Villmow, T.; Pegel, S.; Pötschke, P. Polymer-Carbon Nanotube Composites, 1st ed.; Woodhead Publishing Series in Composites Science and Engineering; Elsevier: Cambridge, UK, 2011; pp. 92–132. ISBN 978-1-84569-761-7. [Google Scholar]
  31. Kasaliwal, G.R.; Göldel, A.; Pötschke, P.; Heinrich, G. Influences of polymer matrix melt viscosity and molecular weight on MWCNT agglomerate dispersion. Polymer 2011, 52, 1027–1036. [Google Scholar] [CrossRef]
  32. Socher, R.; Krause, B.; Müller, M.T.; Boldt, R.; Pötschke, P. The influence of matrix viscosity on MWCNT dispersion and electrical properties in different thermoplastic nanocomposites. Polymer 2012, 53, 495–504. [Google Scholar] [CrossRef]
  33. Bai, J.B.; Allaoui, A. Effect of the length and the aggregate size of MWNTs on the improvement efficiency of the mechanical and electrical properties of nanocomposites—Experimental investigation. Compos. A 2003, 34, 689–694. [Google Scholar] [CrossRef]
  34. Kalaitzidou, K.; Fukushima, H.; Askeland, P.; Drzal, L.T. The nucleating effect of exfoliated graphite nanoplatelets and their influence on the crystal structure and electrical conductivity of polypropylene nanocomposites. J. Mater. Sci. 2007, 43, 2895–2907. [Google Scholar] [CrossRef]
  35. Kalaitzidou, K.; Fukushima, H.; Drzal, L.T. A new compounding method for exfoliated graphite-polypropylene nanocomposites with enhanced flexural properties and lower percolation threshold. Compos. Sci. Technol. 2007, 67, 2045–2051. [Google Scholar] [CrossRef]
  36. Kalaitzidou, K.; Fukushima, H.; Drzal, L.T. Multifunctional polypropylene composites produced by incorporation of exfoliated graphite nanoplatelets. Carbon 2007, 45, 1446–1452. [Google Scholar] [CrossRef]
  37. Grace, H.P. Dispersion phenomena in high viscosity immiscible fluid systems and application of static mixers as dispersion devices in such systems. Chem. Eng. Commun. 1982, 14, 225–277. [Google Scholar] [CrossRef]
  38. Rodrigues, P.; Santos, R.M.; Paiva, M.C.; Covas, J.A. Development of dispersion during compounding and extrusion of Polypropylene/Graphite Nanoplates Composites. Int. Polym. Proc. 2017, 32, 614–622. [Google Scholar] [CrossRef]
  39. Jamali, S.; Paiva, M.C.; Covas, J.A. Dispersion and re-agglomeration phenomena during melt mixing of polypropylene with multi-wall carbon nanotubes. Polym. Test. 2013, 32, 701–707. [Google Scholar] [CrossRef]
  40. Scurati, A.; Feke, D.L.; Manas-Zloczower, I. Analysis of the kinetics of agglomerate erosion in simple shear flows. Chem. Eng. Sci. 2005, 60, 6564–6573. [Google Scholar] [CrossRef]
  41. Domingues, N.; Gaspar-Cunha, A.; Covas, J.A.; Camesasca, M.; Kaufman, M.; Manas-Zloczower, I. Modeling of agglomerate dispersion in single screw extruders. Model. Int. Polym. Process. 2010, 25, 188–198. [Google Scholar] [CrossRef]
  42. Alig, I.; Pötschke, P.; Lellinger, D.; Skipa, T.; Pegel, S.; Kasaliwal, G.R.; Villmow, T. Establishment, morphology and properties of carbon nanotube networks in polymer melts. Polymer 2012, 53, 4–28. [Google Scholar] [CrossRef]
Figure 1. Prototype small-scale mixer, with two mixing zones separated by a large diameter channel. Each mixing zone contains a series of circular channels with alternating diameters, creating sequences of converging/diverging flows. Removing the sleeve and separating the individual rings gives access to material samples for subsequent characterization.
Polymers 10 00222 g001
Figure 2. TEM micrographs of as-received GnPC, GnPM, and GnPH (a,c,e) and fGnPC-PP, fGnPM-PP, and fGnPH-PP (b,d,f).
Polymers 10 00222 g002
Figure 3. Optical micrographs of samples of PP nanocomposites containing GnP and fGnP-PP collected from a prototype small-scale extensional mixer.
Polymers 10 00222 g003
Figure 4. TEM micrographs of the GnPC composite collected along the extensional mixer.
Polymers 10 00222 g004
Figure 5. Representation of the cumulative agglomerate area distribution measured for the PP/GnP and PP/fGnP-PP composites collected along the mixer.
Polymers 10 00222 g005
Figure 6. Evolution of dispersion (in terms of Area Ratio, Ar) along the length of the extensional mixer of GnP and fGnP-PP in a PP melt matrix.
Polymers 10 00222 g006
Figure 7. AC electrical conductivity of PP nanocomposites with 2 wt % of (a) as-received GnP and (b) fGnP-PP.
Polymers 10 00222 g007
Table 1. Properties of the as-received graphite nanoplates.
xGnPCarbon purity (%)Bulk densityDensityWidth (µm)Thickness (nm)Surface area (m2·g−1)Electrical conductivity in plane/perpendicular to surface (S·m−1)
xGnP Grade C®98.00.20–0.402.0–2.251–22750Not available
xGnP Grade M®>99.50.03–0.102.2156-8120–150107/102
xGnP Grade H®>99.50.03–0.102.251560–80107/102
Table 2. Average area of the GnP primary nanoparticle agglomerates and significance within a 95% confidence interval.
GnP powderAverage area of the GnP powders (µm2)
GnPC45 ± 4
fGnPC-PP71 ± 12
GnPM326 ± 34
fGnPM-PP758 ± 123
GnPH194 ± 11
fGnPH-PP289 ± 17
Table 3. Characterization of dispersion and re-agglomeration of PP nanocomposites containing 2 wt % of as-received GnP and fGnP-PP during flow in a prototype small-scale extensional mixer.
Location in extensional mixerAav (µm2) *NA (mm−2)NAav (µm2) *NA (mm−2)N
PP/GnPCPP/fGnPC-PP
Reservoir15.0 ± 0.9240.7428924 ± 82000.31828
Channel 314 ± 2152.286212 ± 2275.41722
Channel 510.7 ± 0.774.93165010 ± 1131.51237
Large channel14.6 ± 0.8167.4398914 ± 4634.01170
Channel 818 ± 2139.5104612 ± 2279.11436
Channel 1014.6 ± 0.988.48129810 ± 1191.31335
PP/GnPMPP/fGnPM-PP
Reservoir131 ± 191895.1827120 ± 191510.4744
Channel 363 ± 6644.8124372 ± 8571.2880
Channel 551 ± 4367.4126856 ± 6530.1920
Large channel83 ± 41712.21288110 ± 141113.0800
Channel 847 ± 4543.4162664 ± 8745.2951
Channel 1040 ± 4575.1151160 ± 6498.0805
PP/GnPHPP/fGnPH-PP
Reservoir65 ± 71157.61975110 ± 171814.9975
Channel 338 ± 3297.4233157 ± 6476.4901
Channel 532 ± 2267.7219750 ± 5388.4994
Large channel56 ± 5606.0206771 ± 111182.81031
Channel 838 ± 3384.6195362 ± 8823.51034
Channel 1034 ± 3360.4158255 ± 7588.2862
* Average agglomerate area considering the N agglomerates measured with a confidence interval of 95%.

