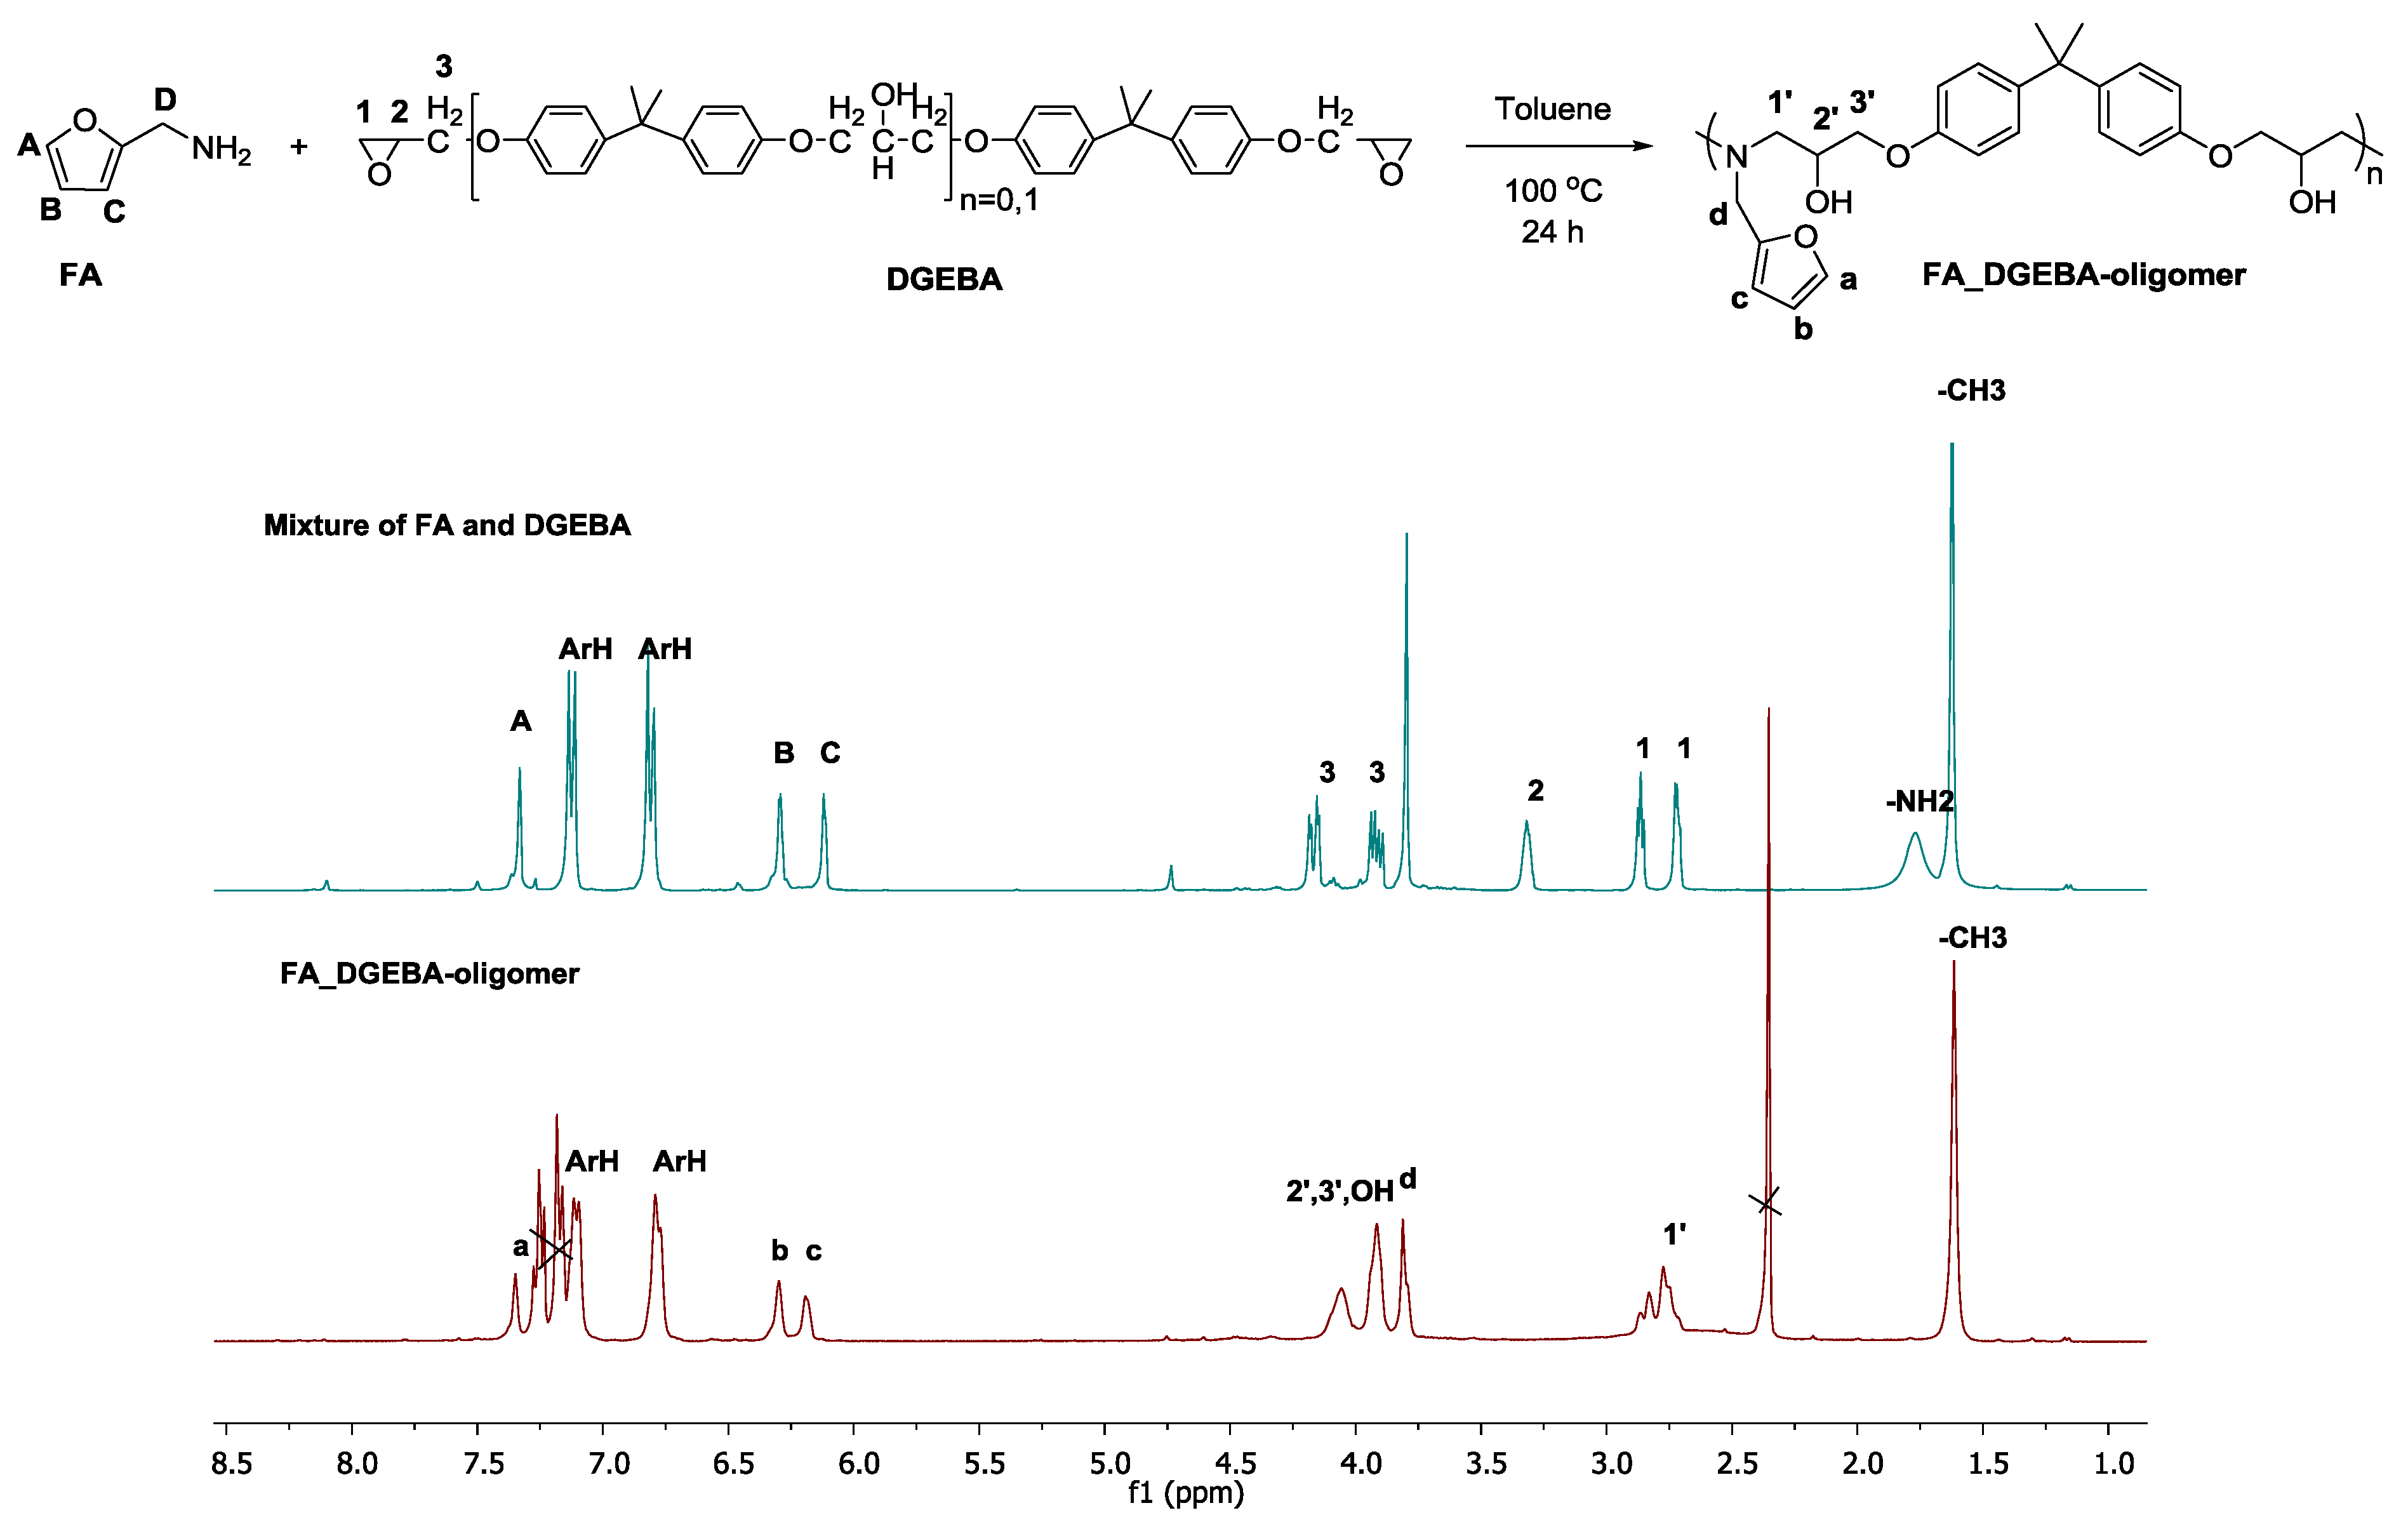
Figure 1.
1H NMR spectra of FA_DGEBA oligomer and its starting compounds as well as their assignations.
Figure 1.
1H NMR spectra of FA_DGEBA oligomer and its starting compounds as well as their assignations.
| Compound | Protons | σ(ppm)/CDCl3 |
|---|
| FA | A | 7.32 |
| B | 6.30 |
| C | 6.11 |
| D | 3.79 |
| NH2 | 1.75 |
| DGEBA | ArH | 7.11 and 6.80 |
| 1 (CH2 epoxy ring) | 2.87, 2.71 |
| 2 (CH epoxy ring) | 3.32 |
| 3 (-CH2-O-) | 4.16, 3.92 |
| -CH3 | 1.61 |
| FA_DGEBA-oligomer | a | 7.25 |
| b | 6.80 |
| c | 6.19 |
| d | 3.81 |
| 1′ (CH2 from epoxy ring) | 2.85–2.75 |
| 2′ (CH from epoxy ring) | 4.06 |
| 3′ (-CH2-O-) | 3.81, 3.92 |
| -OH | 4.06 |
| -CH3 | 1.61 |
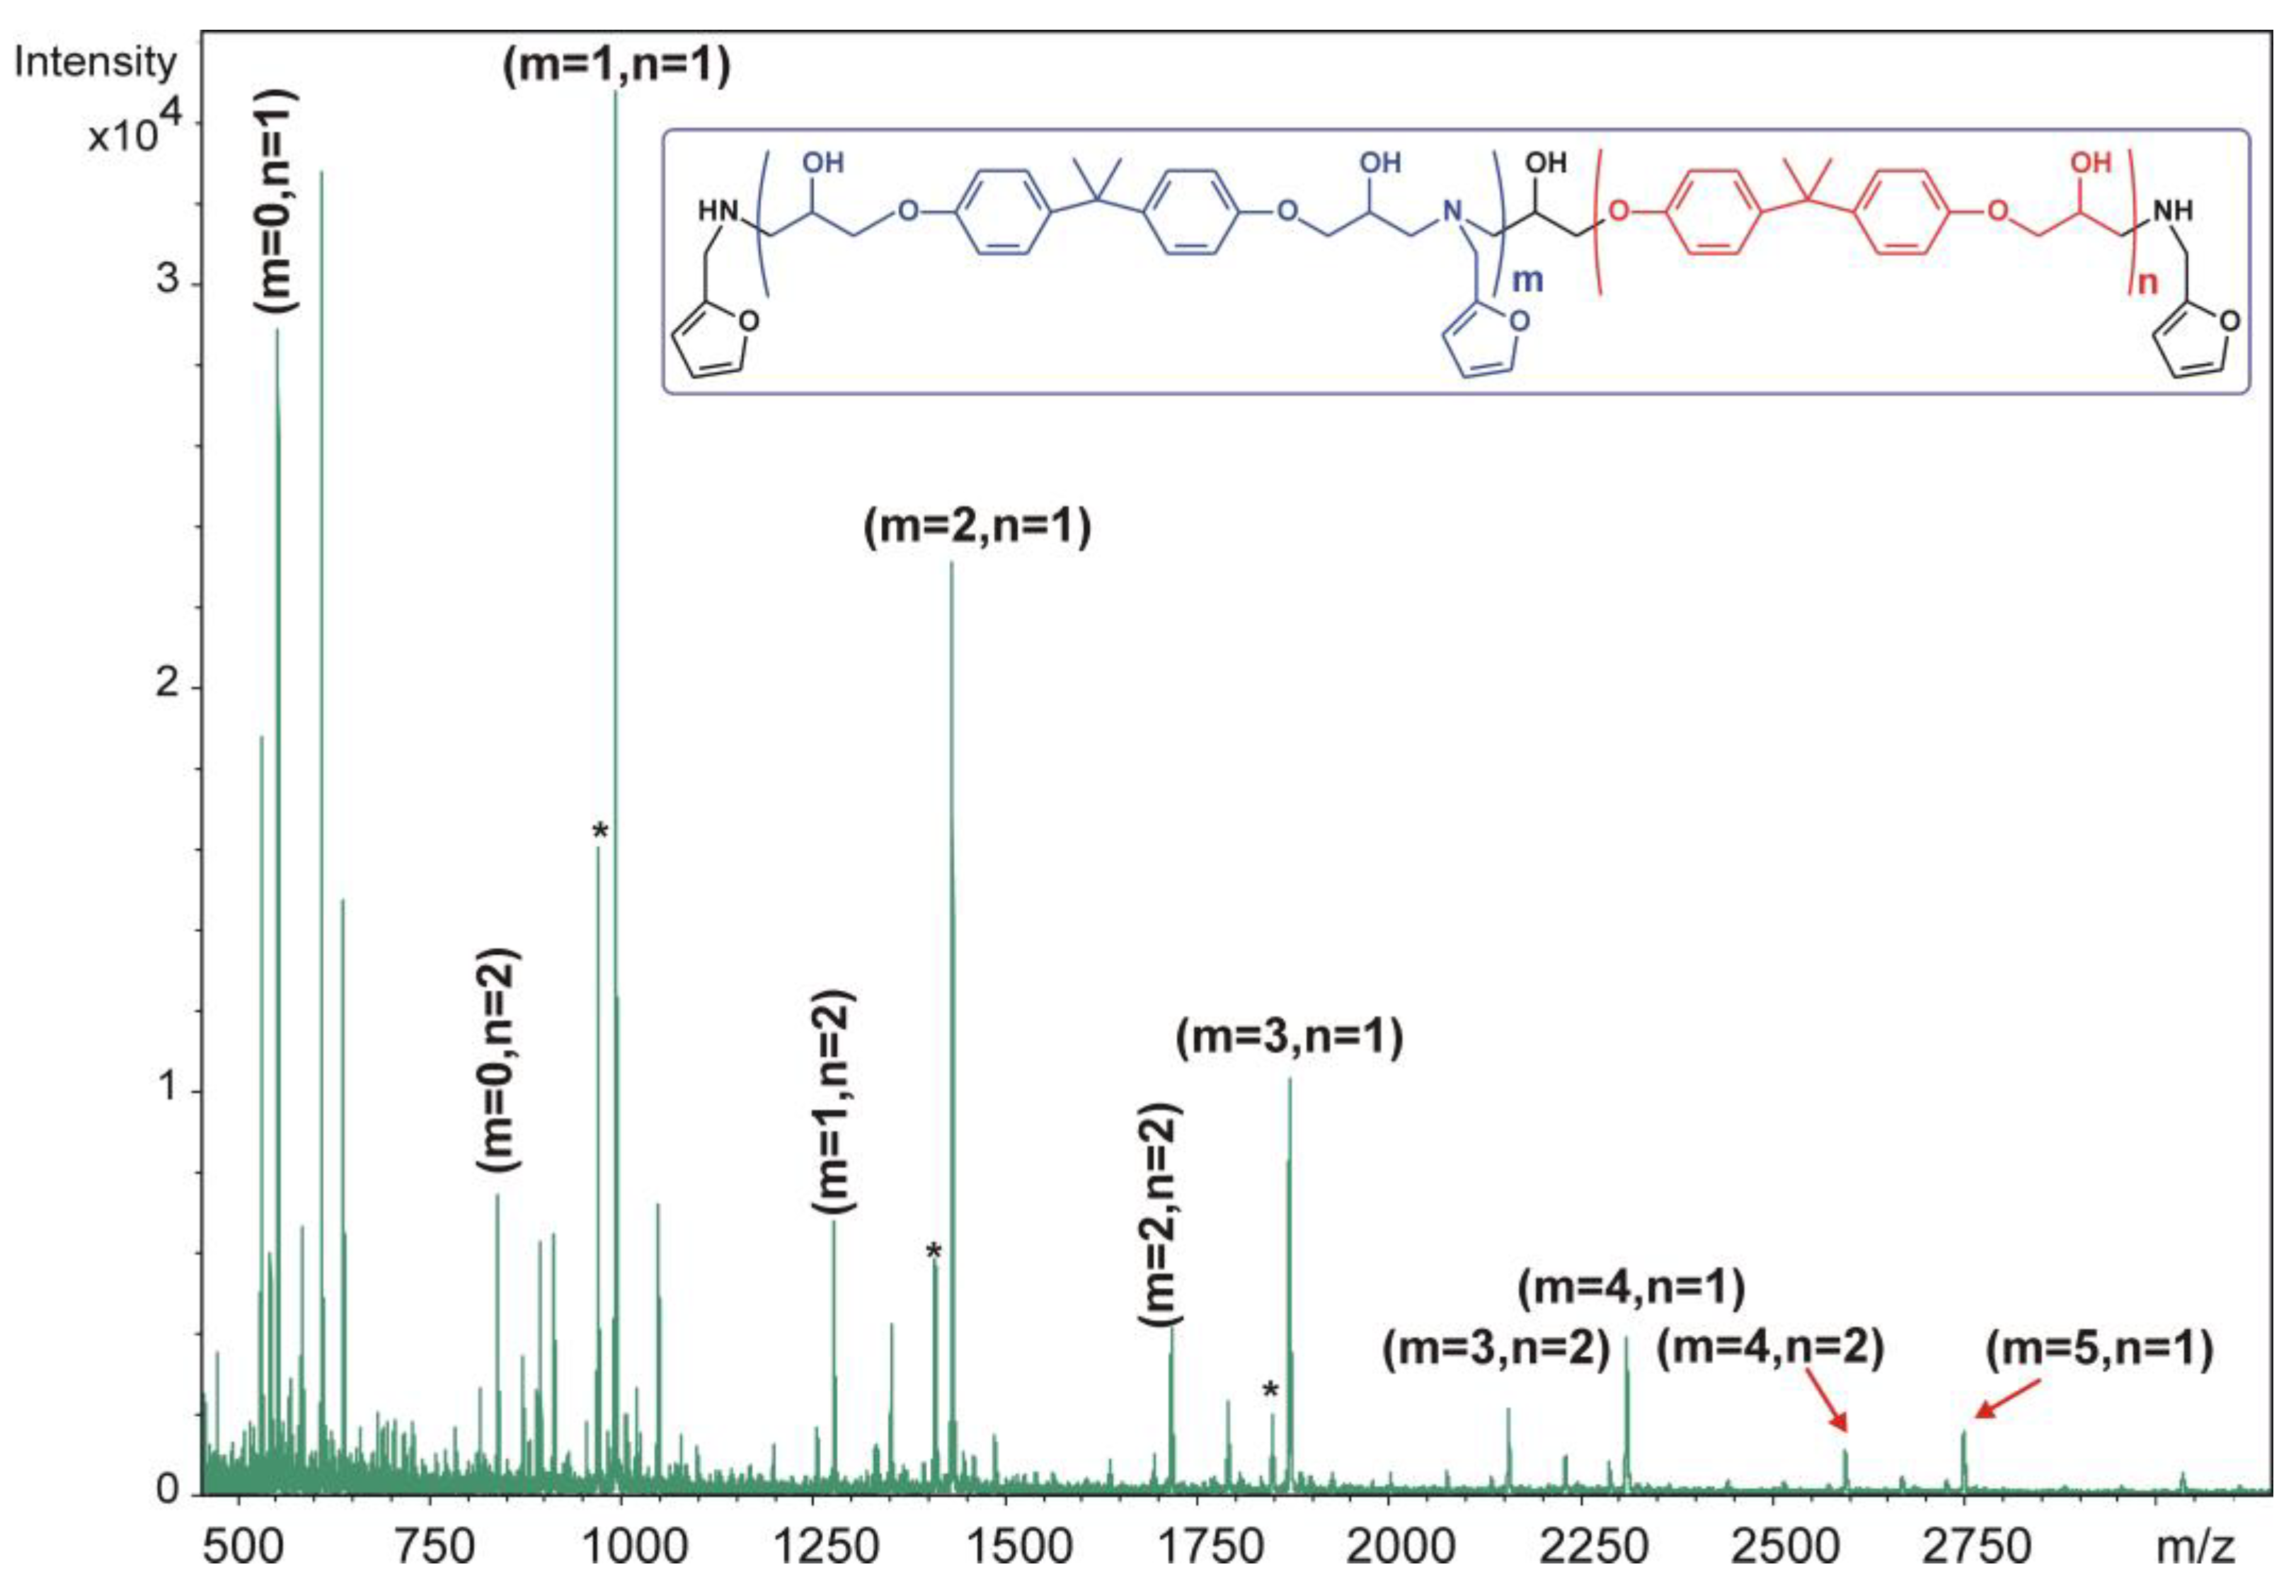
Figure 2.
MALDI-TOF MS spectrum of FA_DGEBA oligomer. The numbers at the top of the peaks stand for the number of repeat units. Peaks denoted by (*) are the protonated oligomers ([M + H]+).
Figure 2.
MALDI-TOF MS spectrum of FA_DGEBA oligomer. The numbers at the top of the peaks stand for the number of repeat units. Peaks denoted by (*) are the protonated oligomers ([M + H]+).
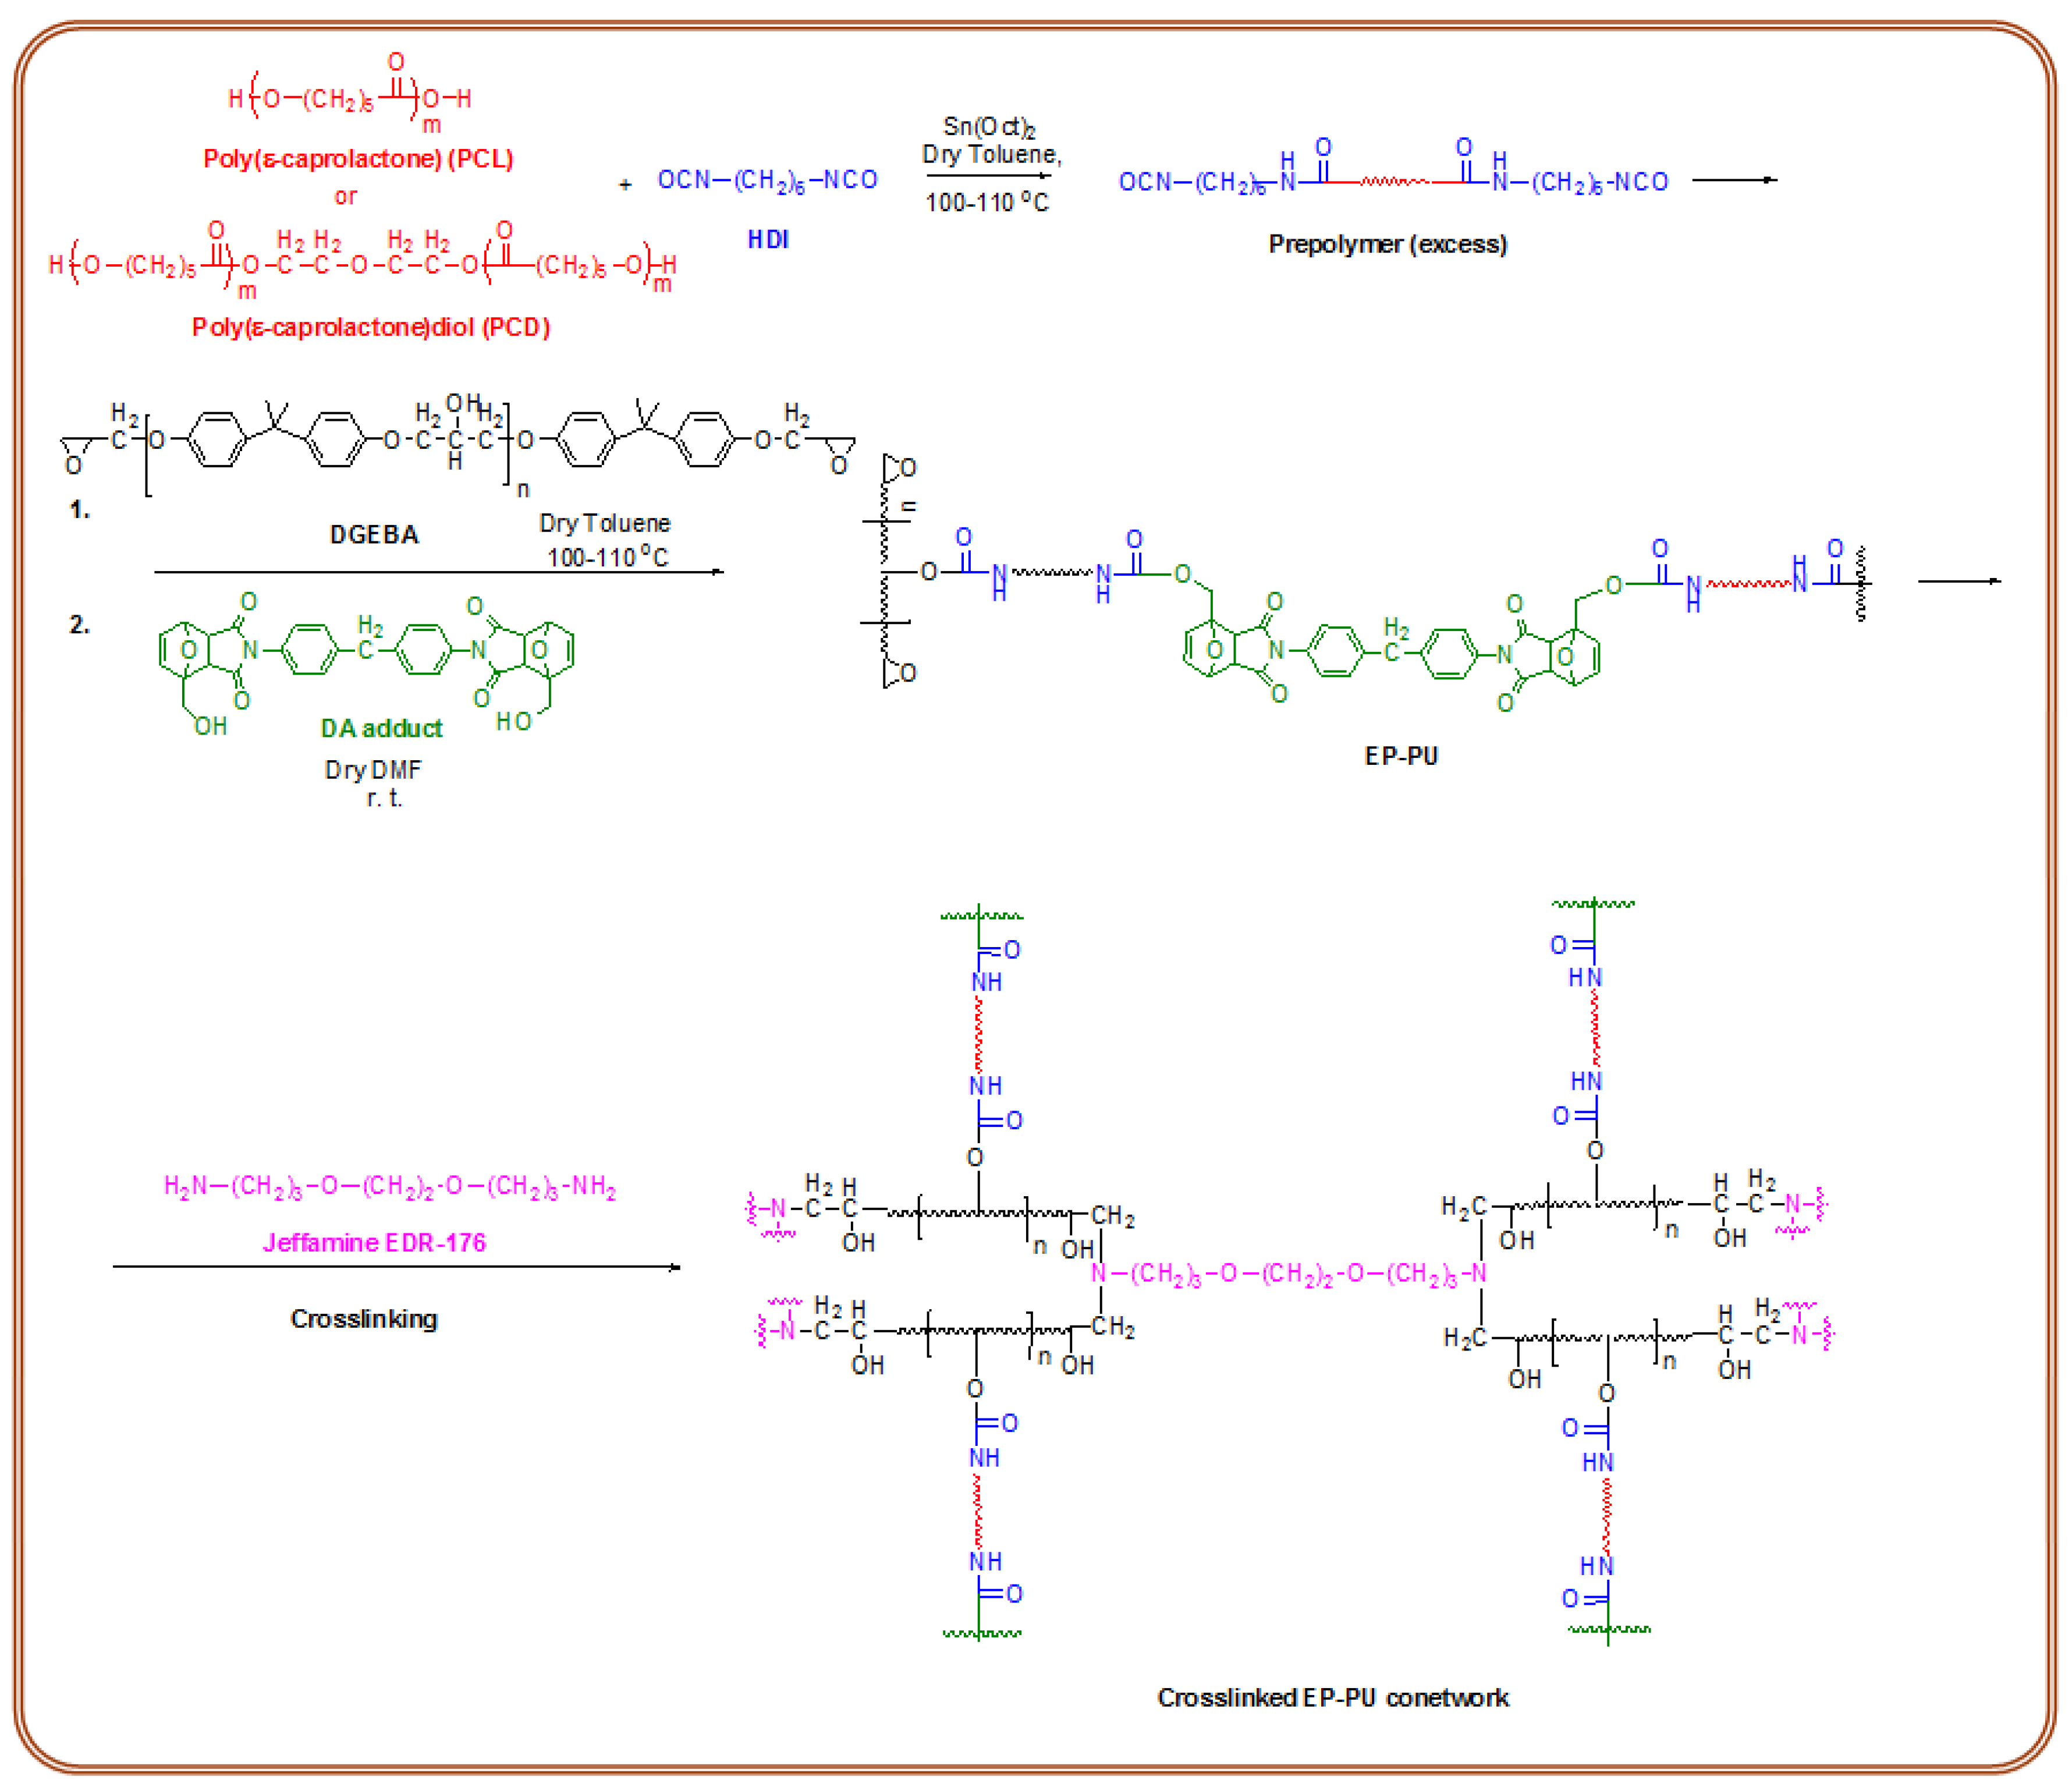
Scheme 1.
Synthetic pathway for the preparation of EP-PU co-networks (EP-PUs 1-15) containing DA-adducts.
Scheme 1.
Synthetic pathway for the preparation of EP-PU co-networks (EP-PUs 1-15) containing DA-adducts.
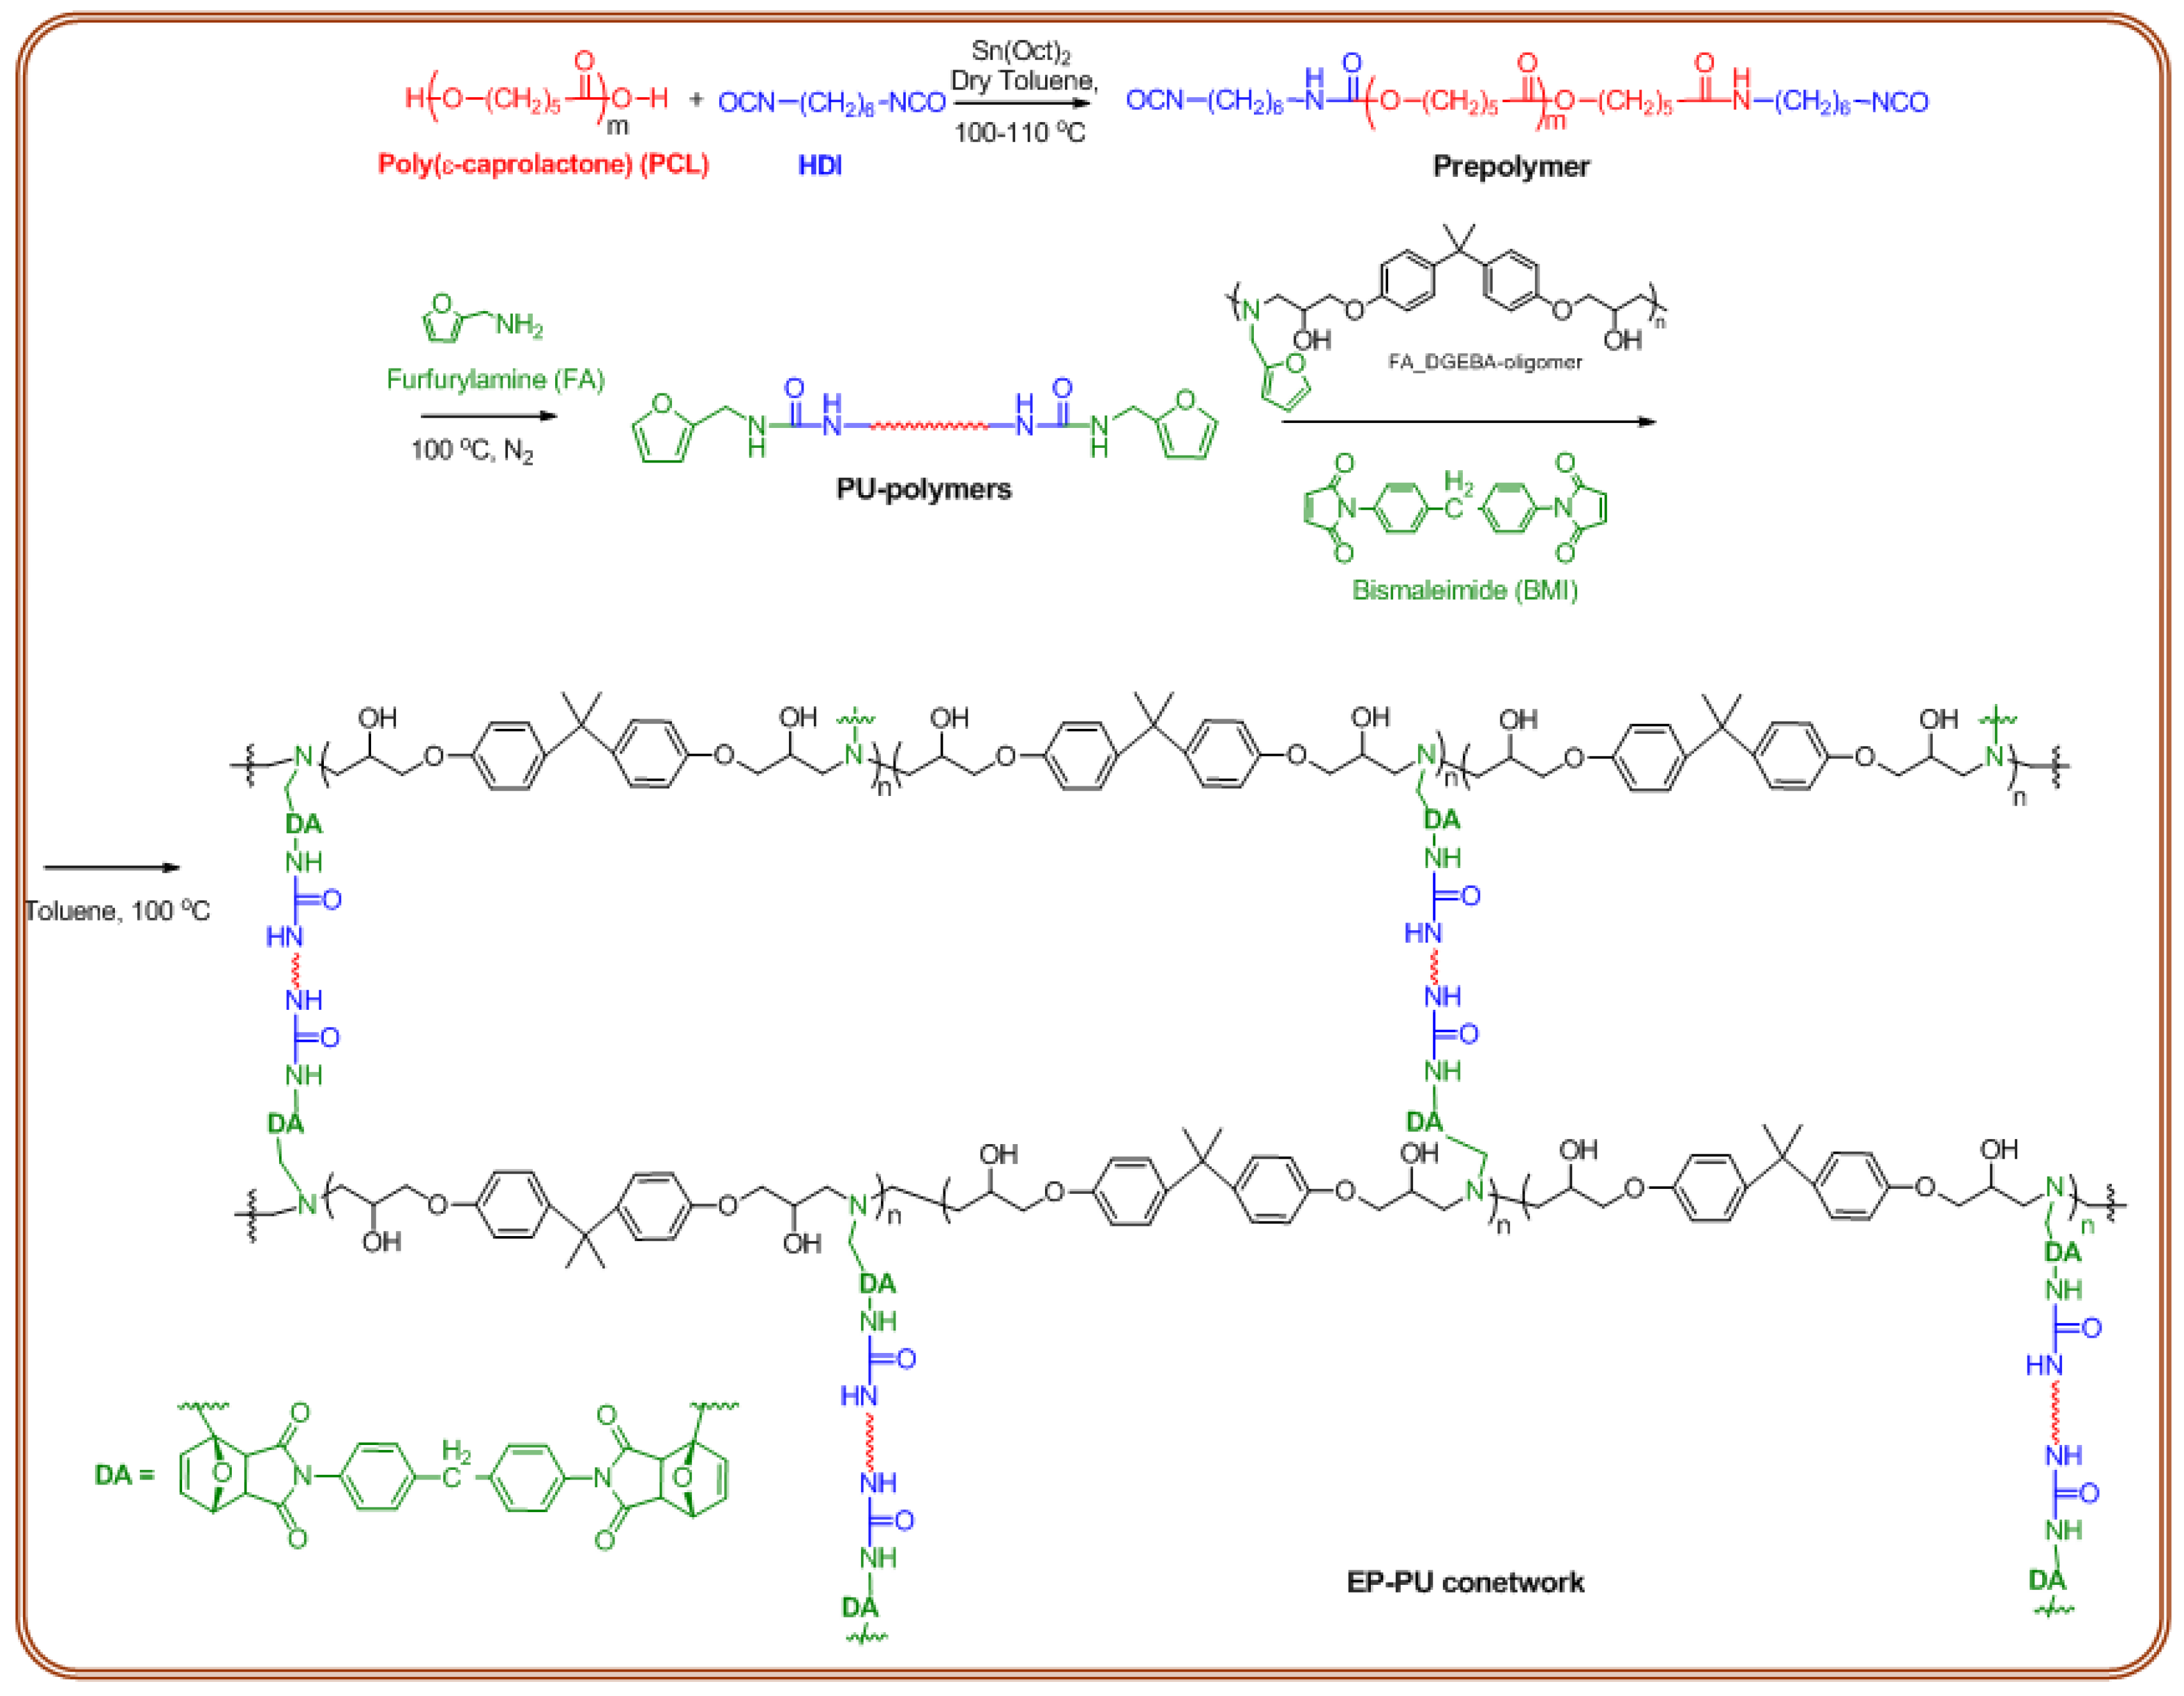
Scheme 2.
Synthetic pathway for the preparation of samples EP-PU 16–24 containing DA-adducts.
Scheme 2.
Synthetic pathway for the preparation of samples EP-PU 16–24 containing DA-adducts.
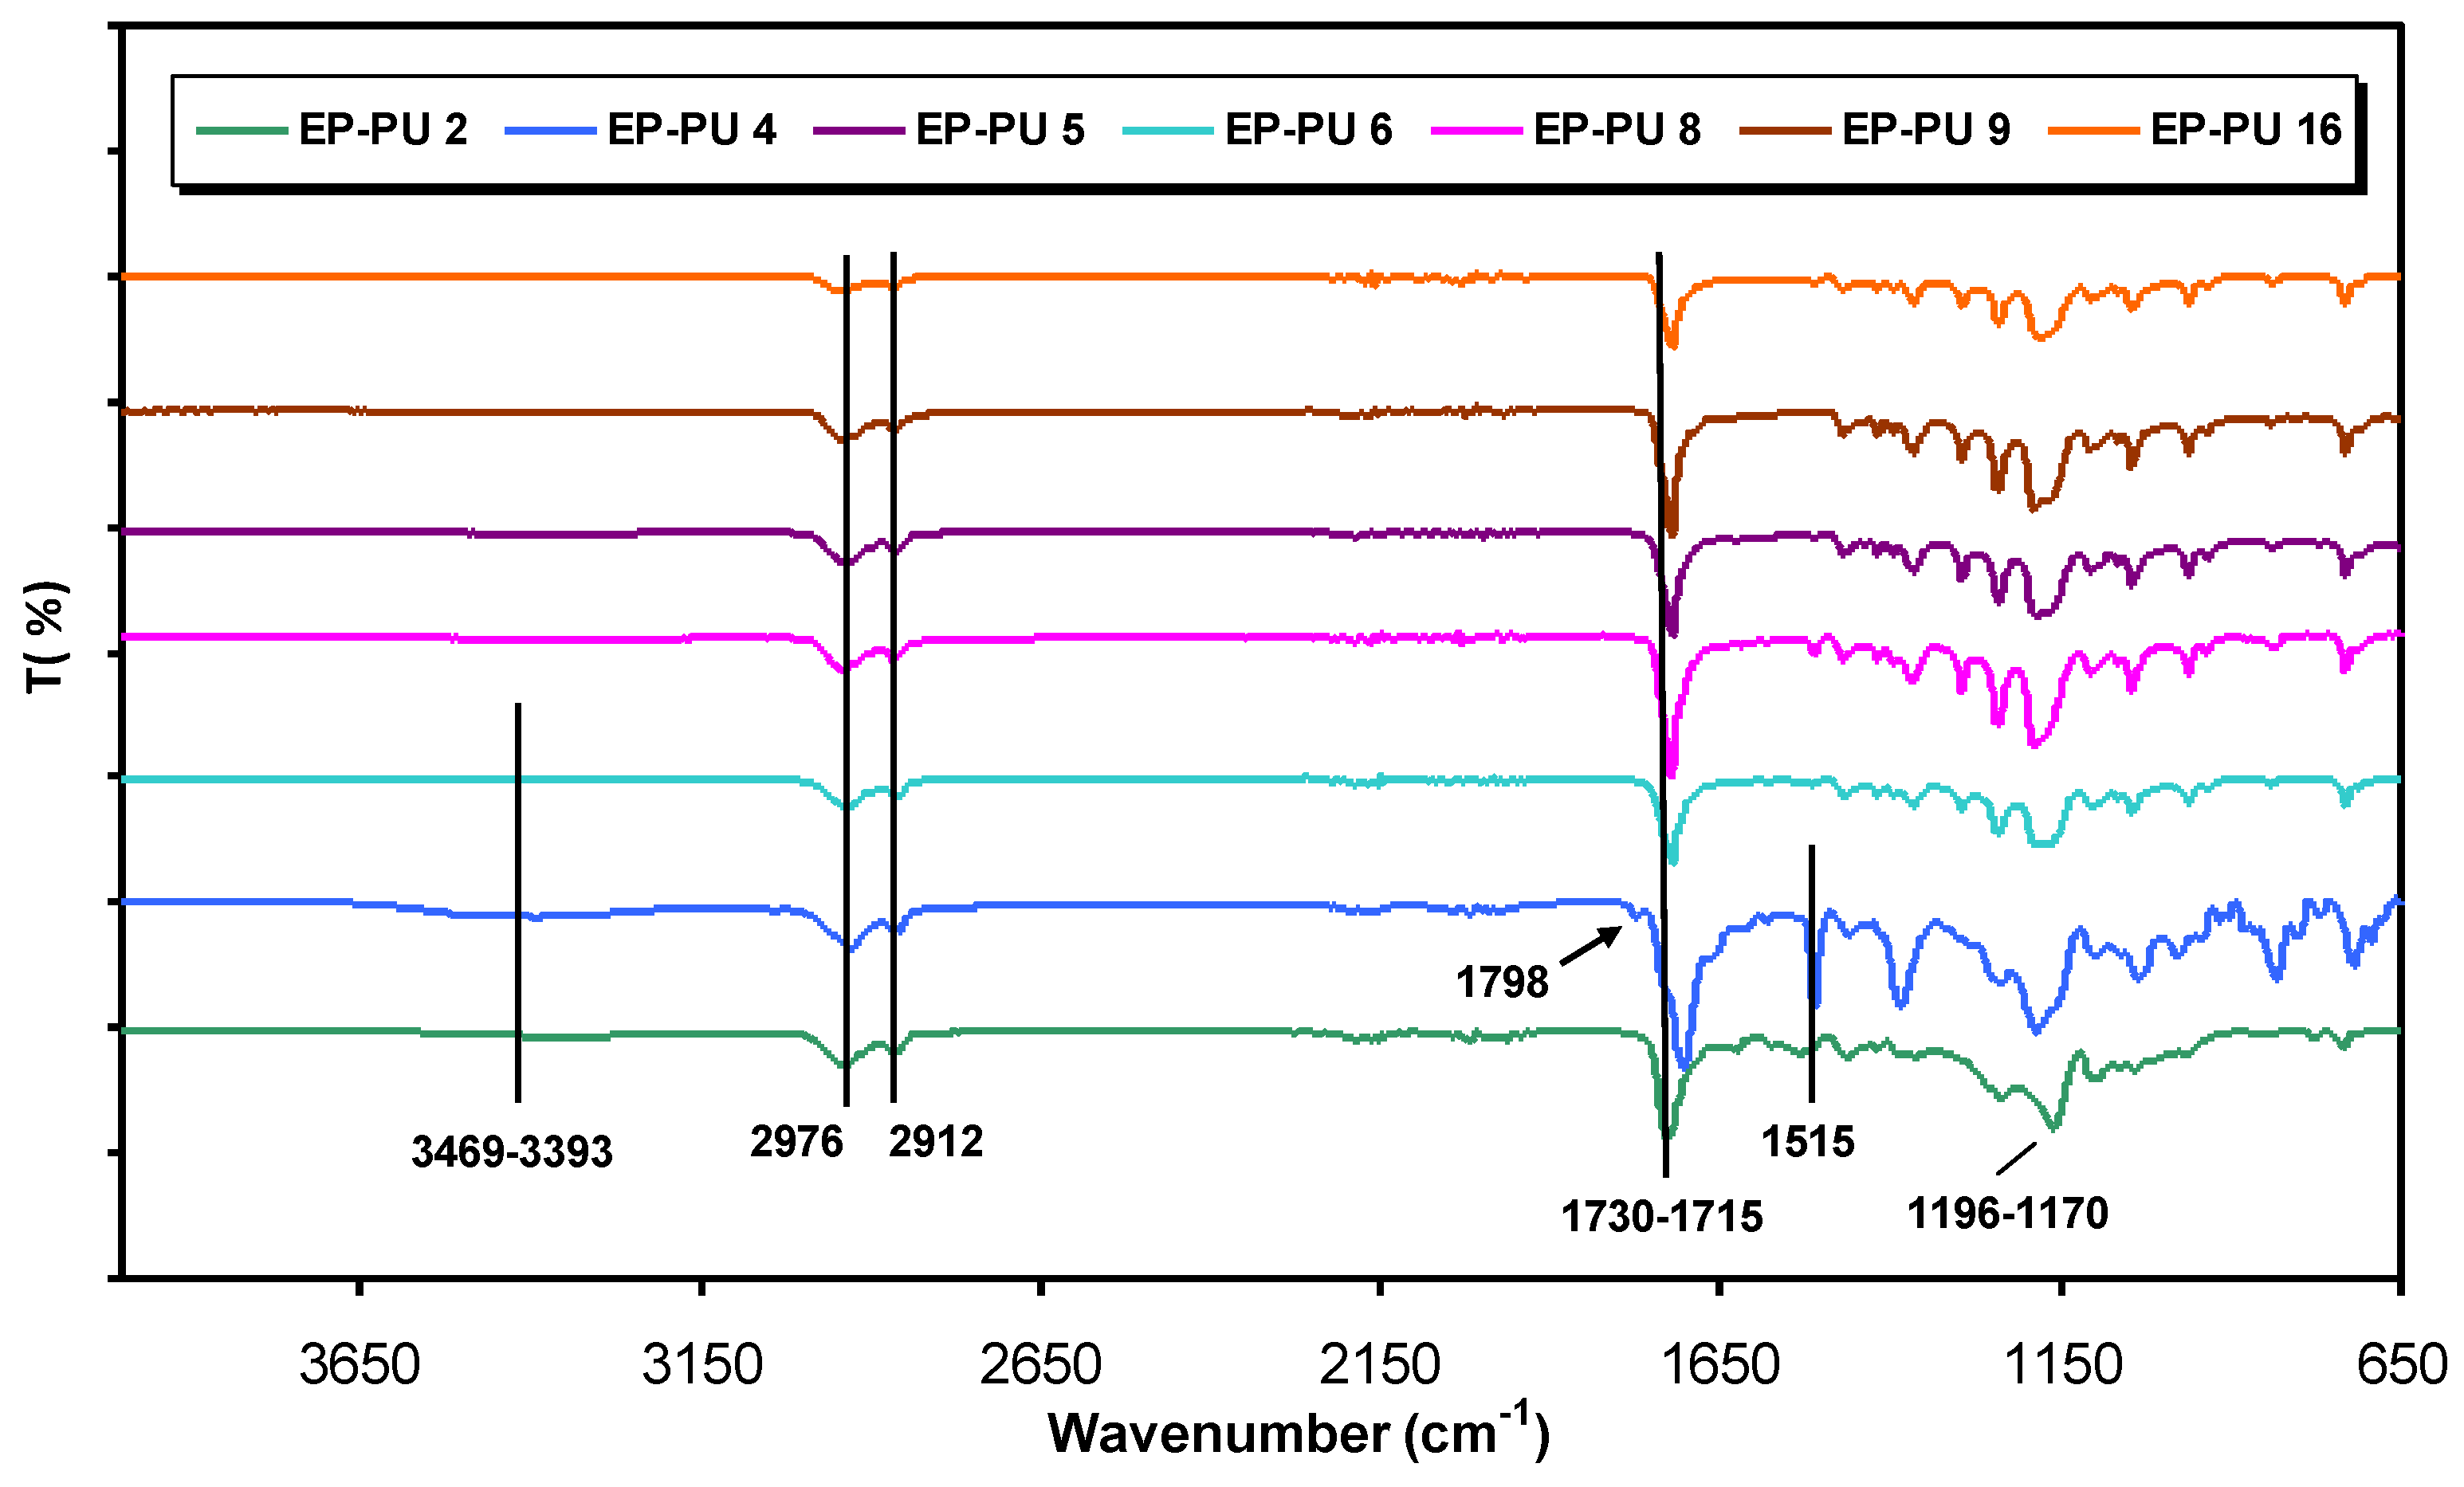
Figure 3.
ATR-FTIR spectra of EP-PUs 2, 4, 5, 6, 8, 9 and 16.
Figure 3.
ATR-FTIR spectra of EP-PUs 2, 4, 5, 6, 8, 9 and 16.
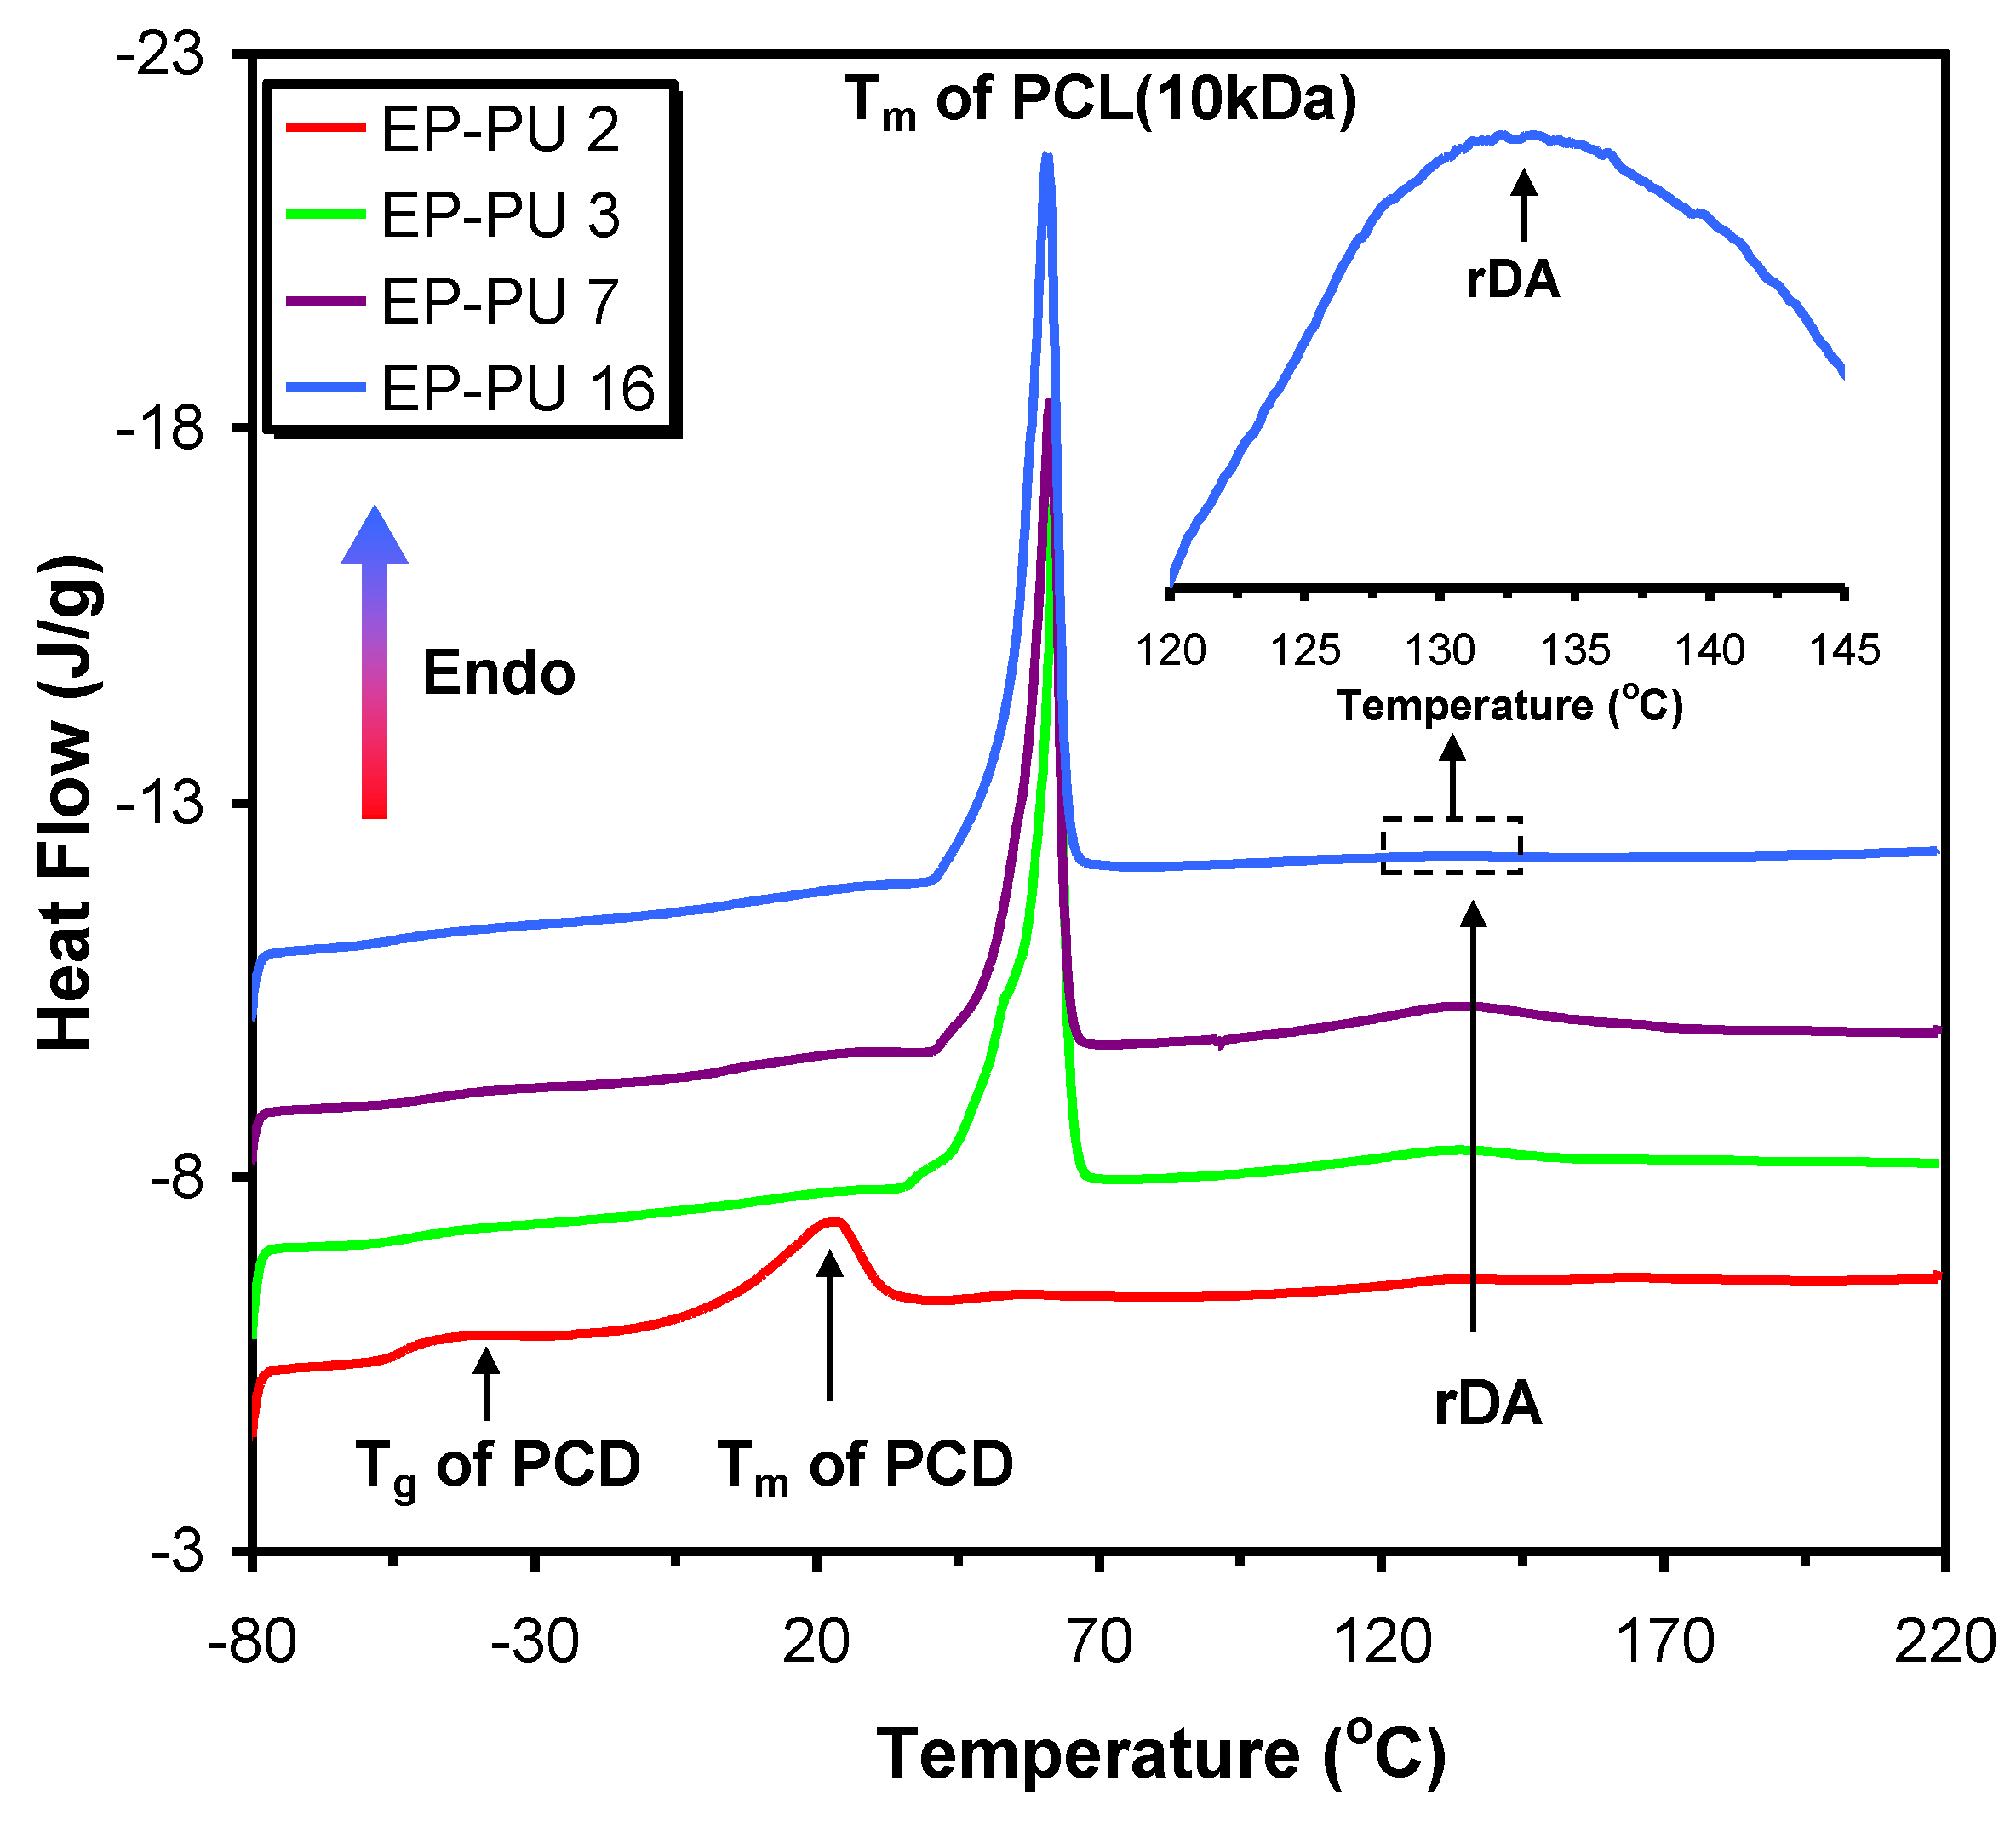
Figure 4.
DSC curves of EP-PUs 2, 3, 7 and 16. The inset shows the zoomed part of the DSC trace for the sample EP-PU 16 in the temperature range of 120–145 °C.
Figure 4.
DSC curves of EP-PUs 2, 3, 7 and 16. The inset shows the zoomed part of the DSC trace for the sample EP-PU 16 in the temperature range of 120–145 °C.
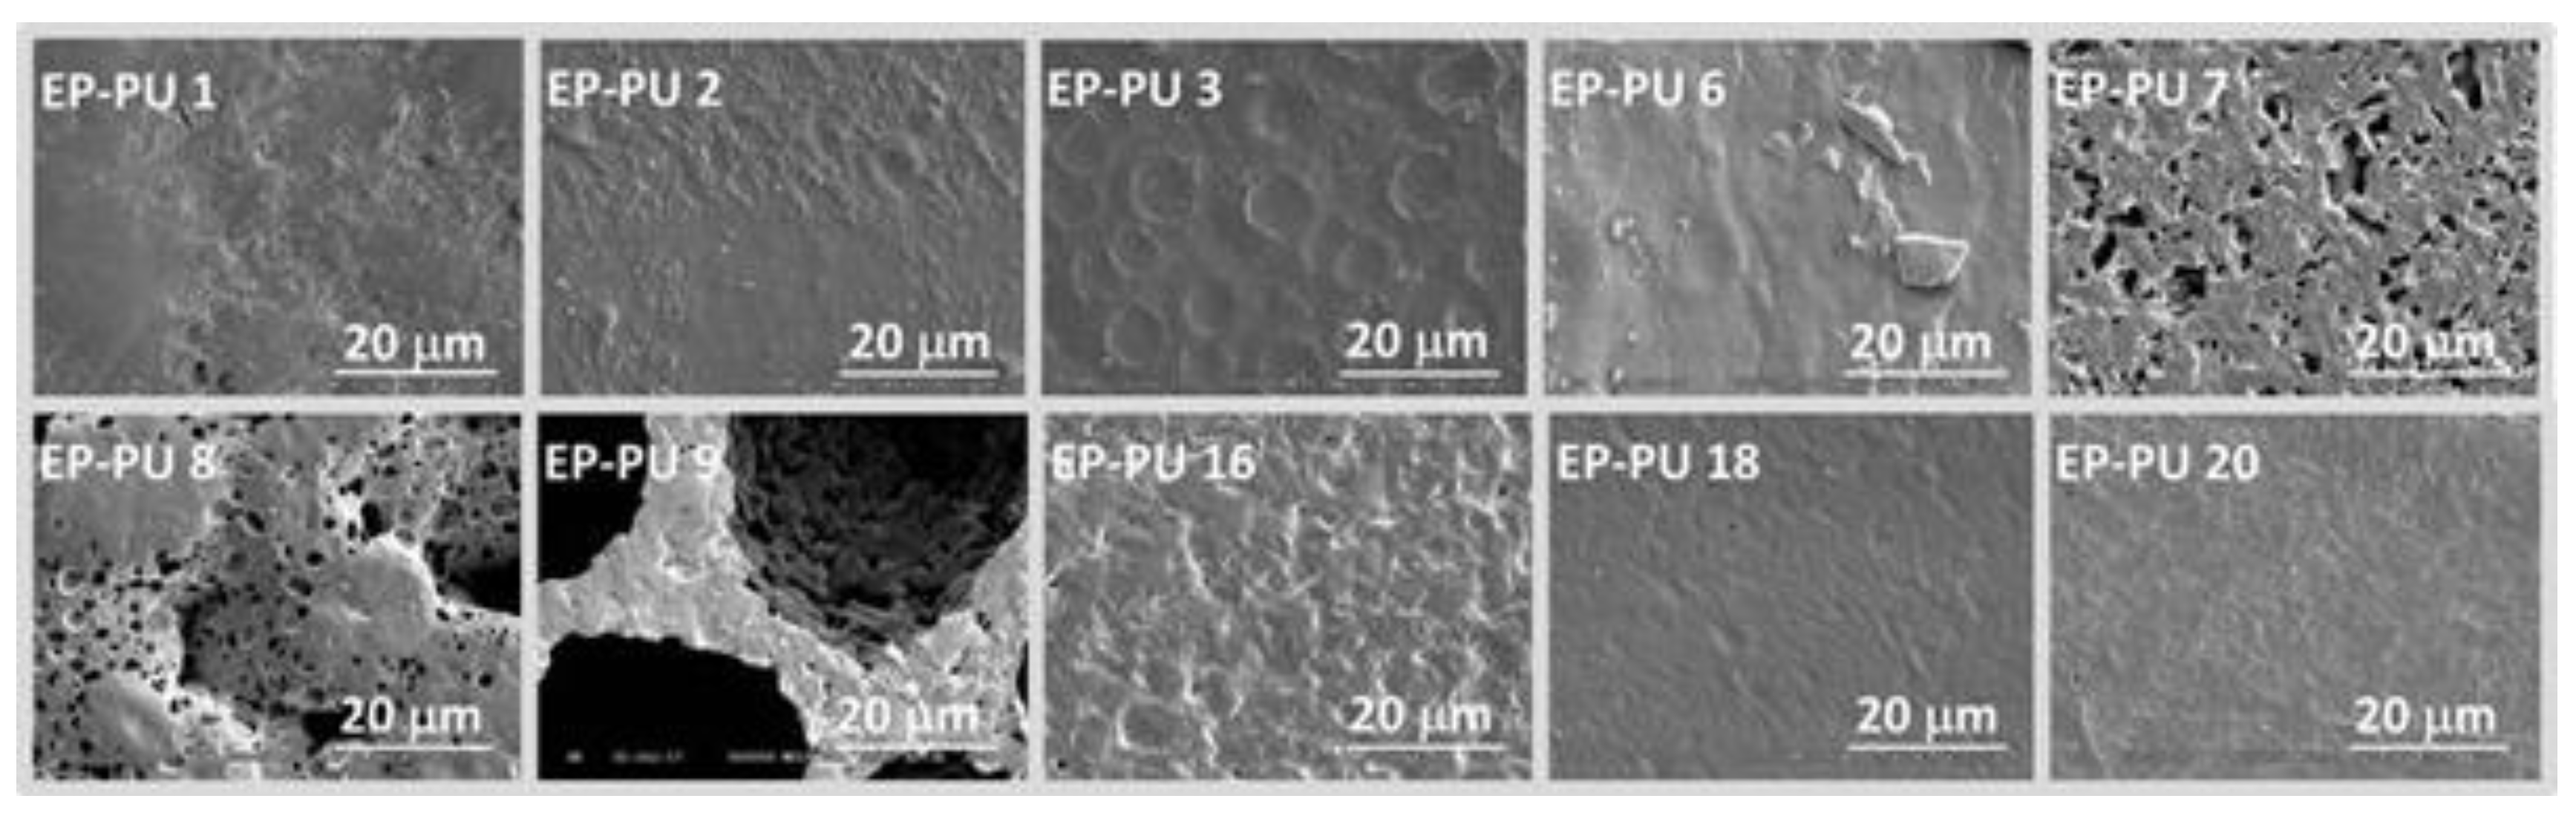
Figure 5.
SEM images of samples EP-PU 1, 2, 3, 6, 7, 8, 9, 16, 18 and 20.
Figure 5.
SEM images of samples EP-PU 1, 2, 3, 6, 7, 8, 9, 16, 18 and 20.
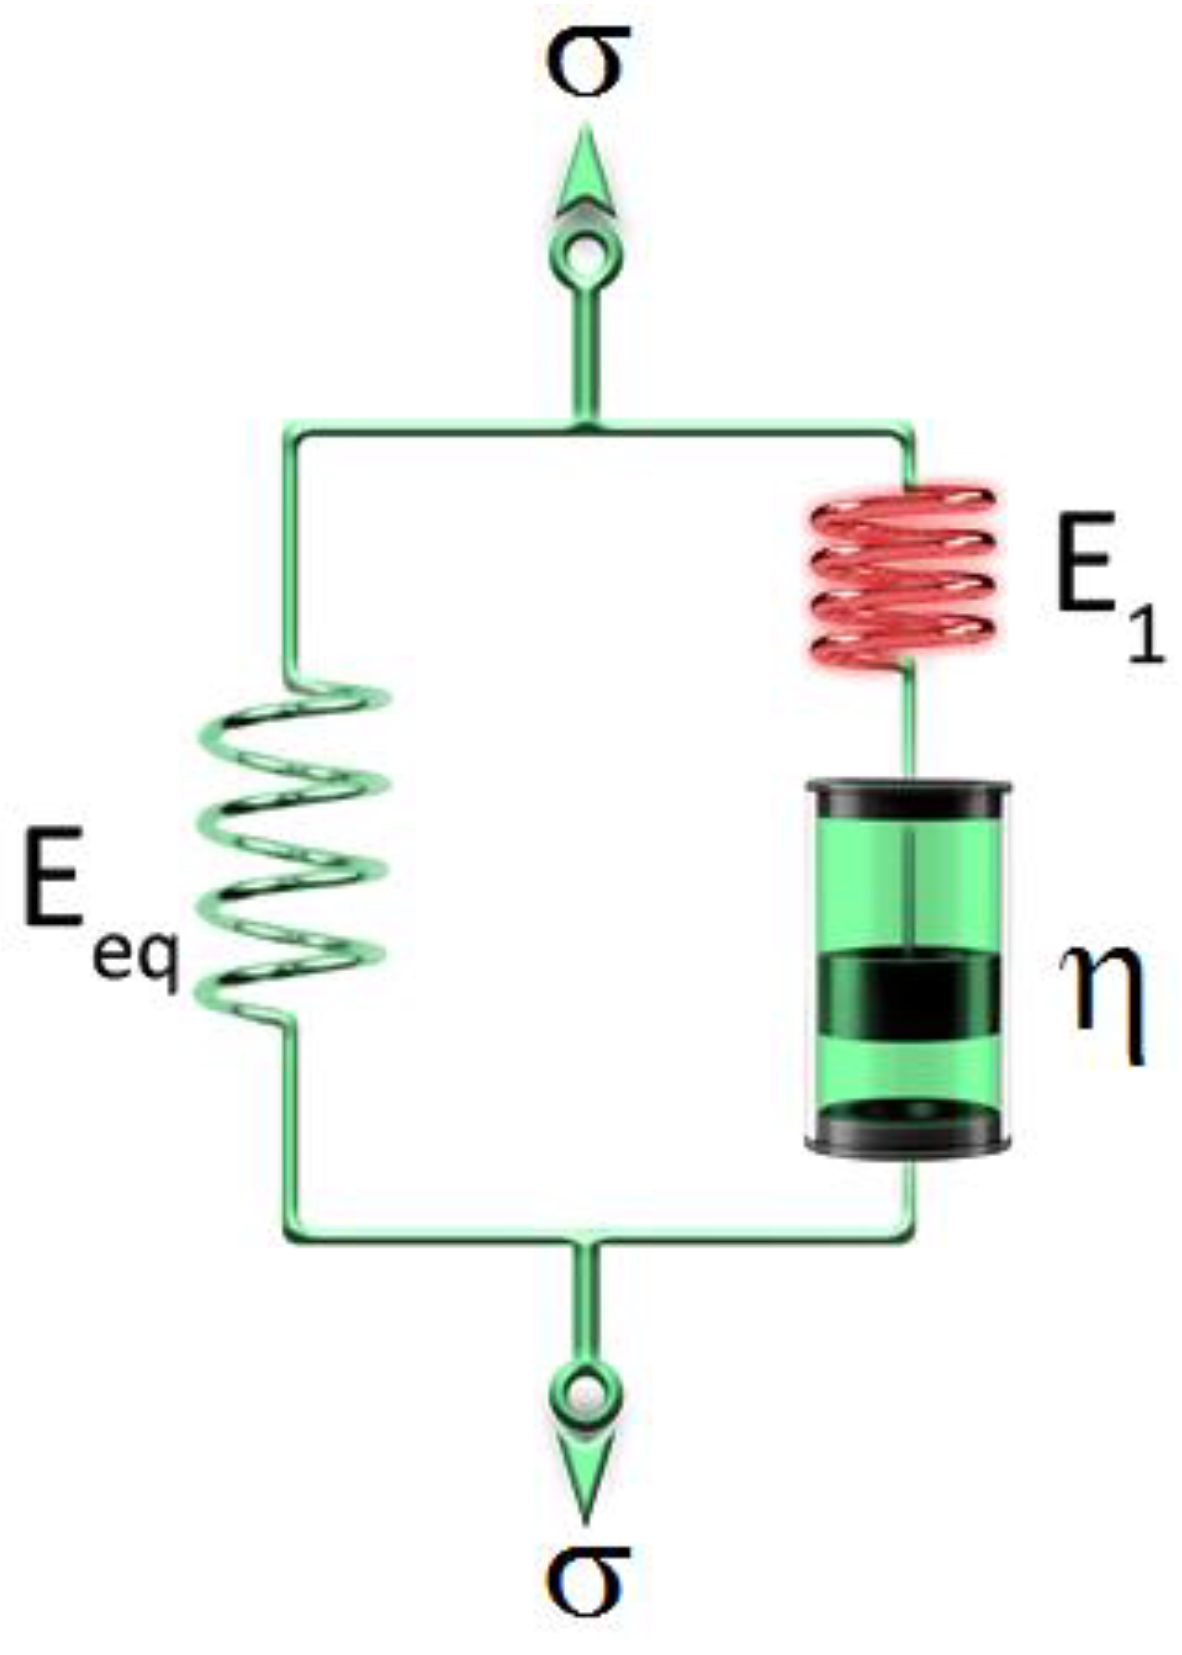
Figure 6.
The Standard Linear Solid (SLS) model. Eeq and E1 represent the equilibrium (rubbery) and the non-equilibrium (glassy) spring modulus, respectively, while η stands for the dynamic viscosity of the liquid in the dashpot.
Figure 6.
The Standard Linear Solid (SLS) model. Eeq and E1 represent the equilibrium (rubbery) and the non-equilibrium (glassy) spring modulus, respectively, while η stands for the dynamic viscosity of the liquid in the dashpot.
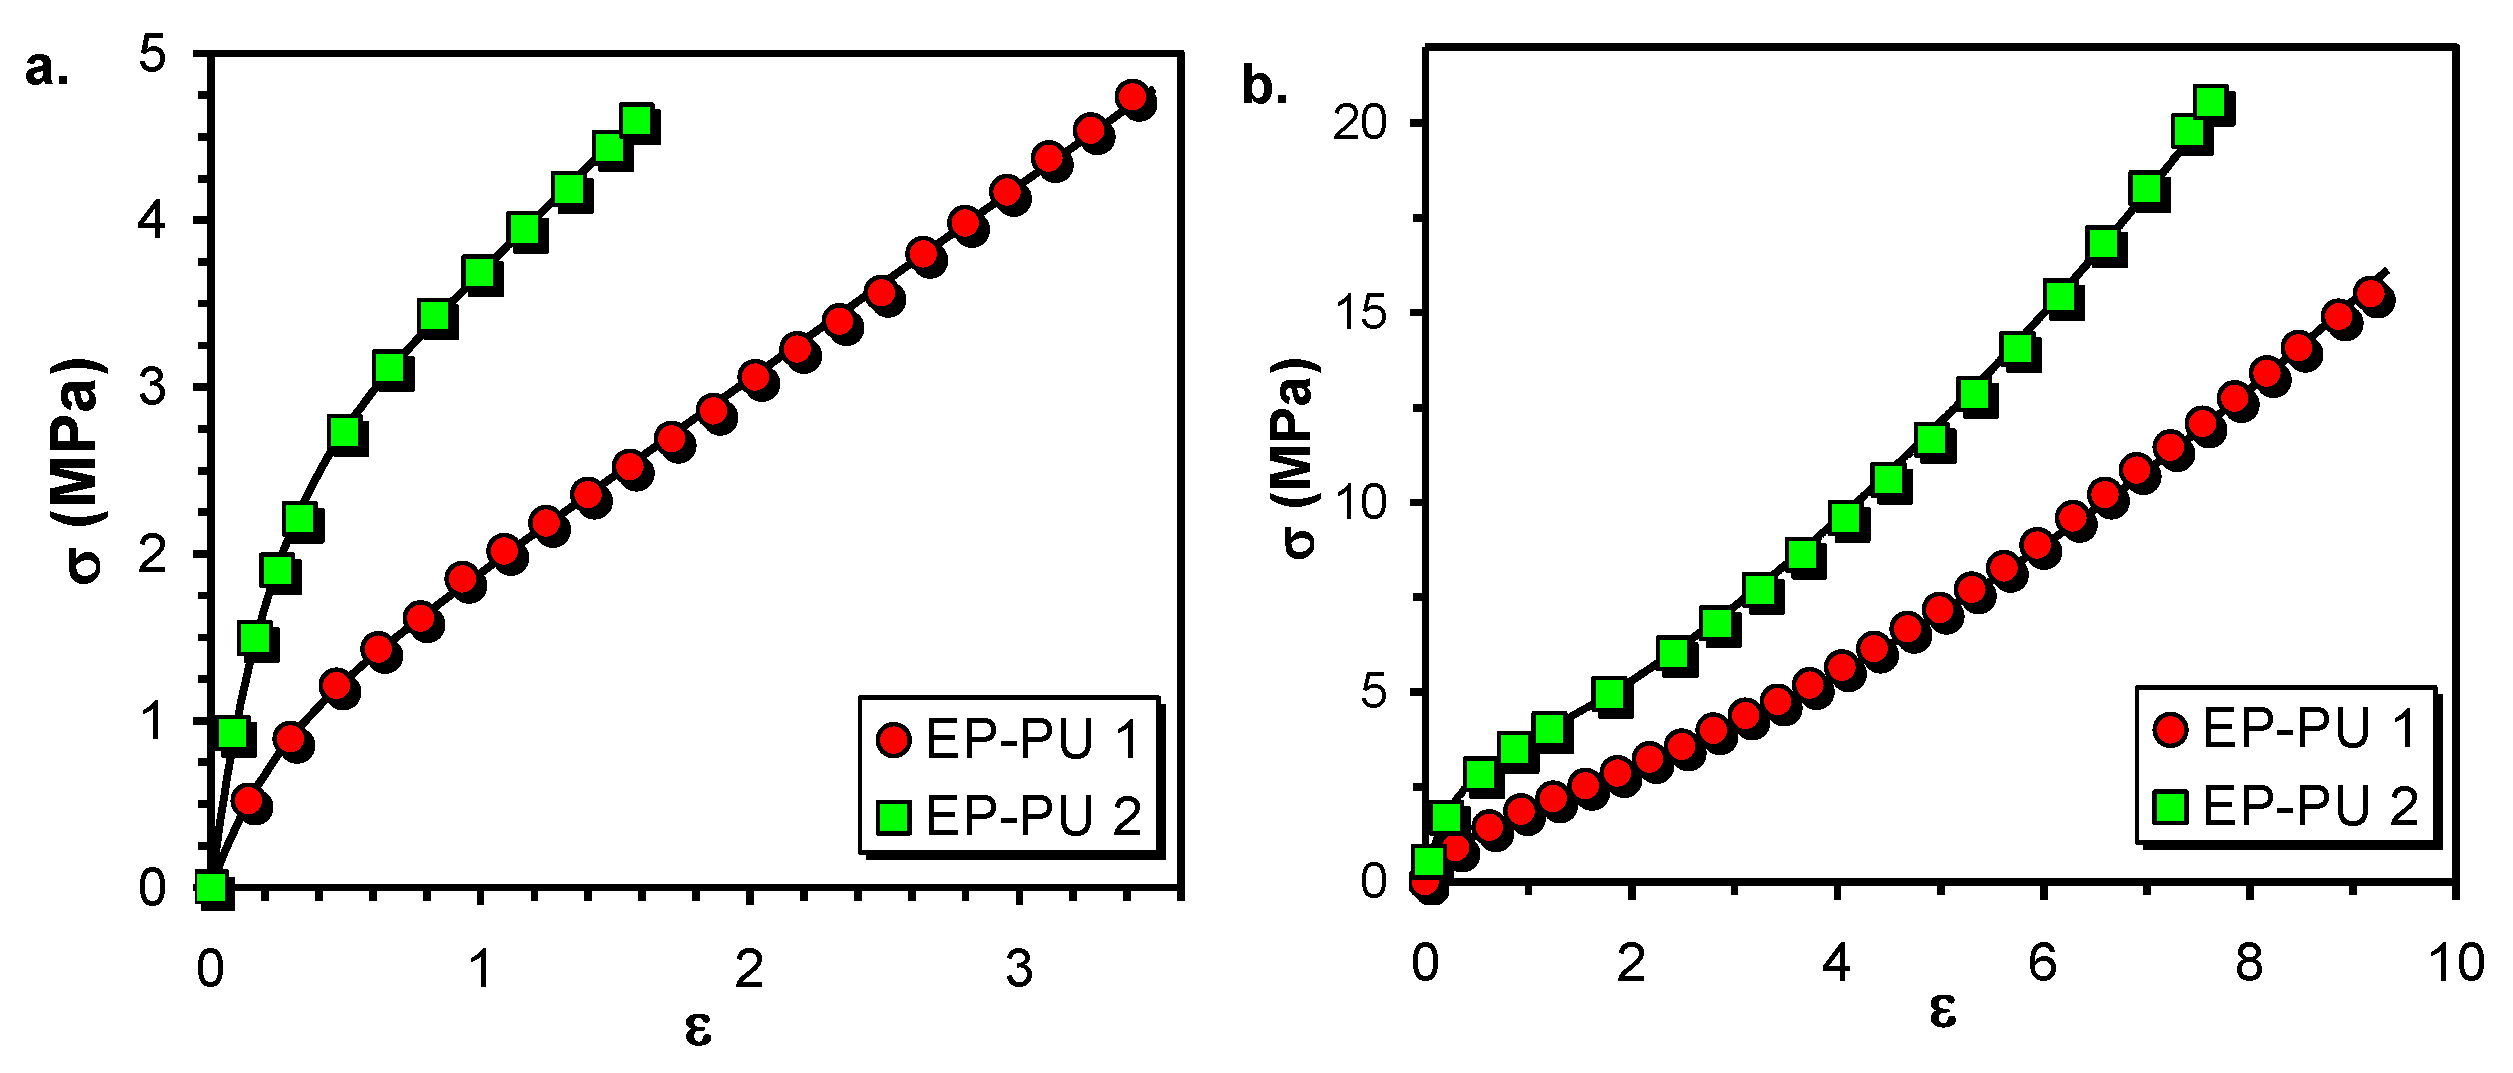
Figure 7.
Stress–strain curves for the samples EP-PUs 1 and 2: up to moderate strains (a); and up to elongation at break (b). The symbols and the solid lines represent the experimental data and the fitted curves, respectively. The fitted parameters for the sample EP-PU 1 are b1 = 1.16 MPa, b2 = 0.63 and b3 = 4.73 (i.e., (dε/dt)a1 = 0.21, a2 = 1.16 MPa, (dε/dt)a3 = 0.97 MPa and α = 0.089 MPa), while for the sample EP-PU 2 these parameters are b1 = 1.57 MPa, b2 = 1.36 and b3 = 5.17 (i.e., dε/dt)a1 = 0.19, a2 = 1.57 MPa, (dε/dt)a3 = 2.44 MPa and α = 0.15 MPa).
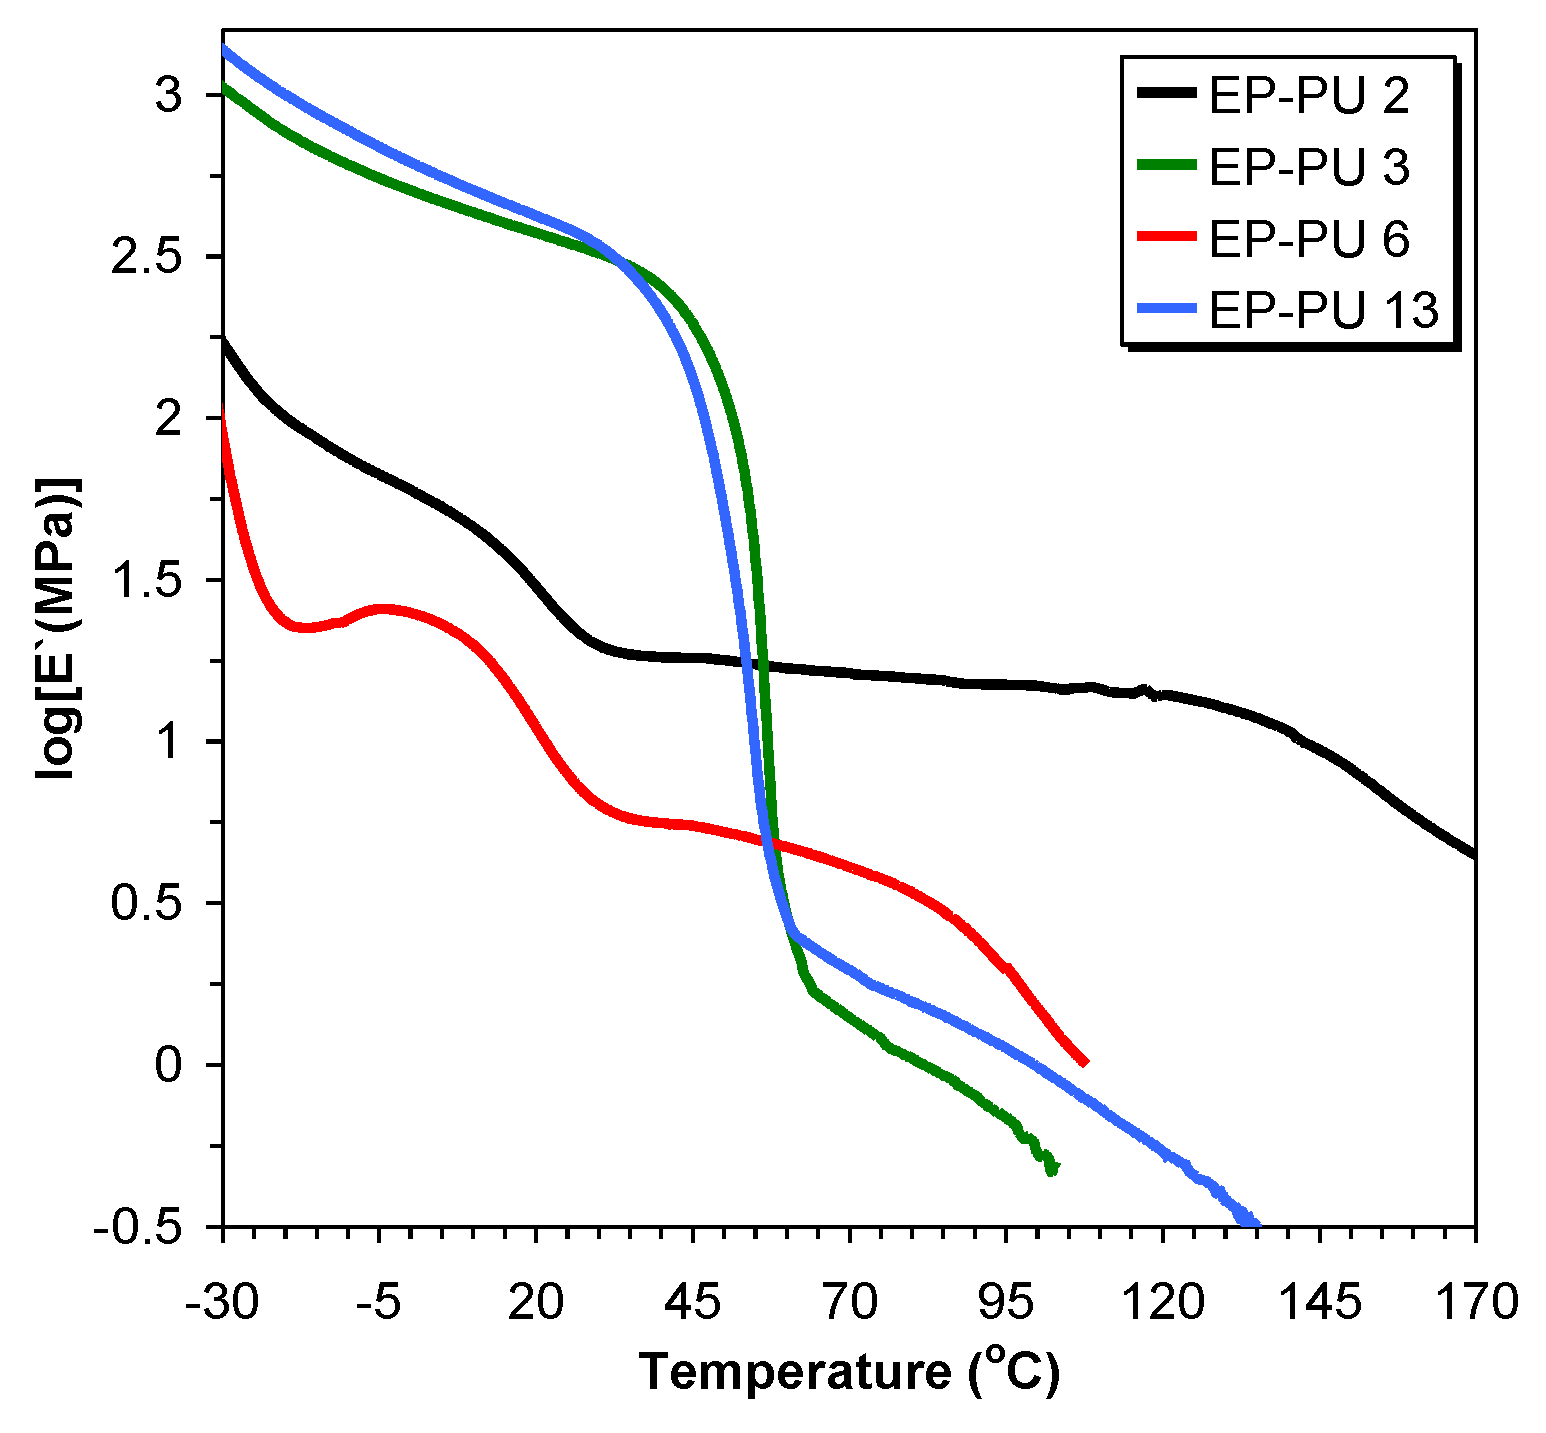
Figure 8.
Storage modulus as a function of temperature for samples EP-PU 2, 3, 6, and 13.
Figure 8.
Storage modulus as a function of temperature for samples EP-PU 2, 3, 6, and 13.
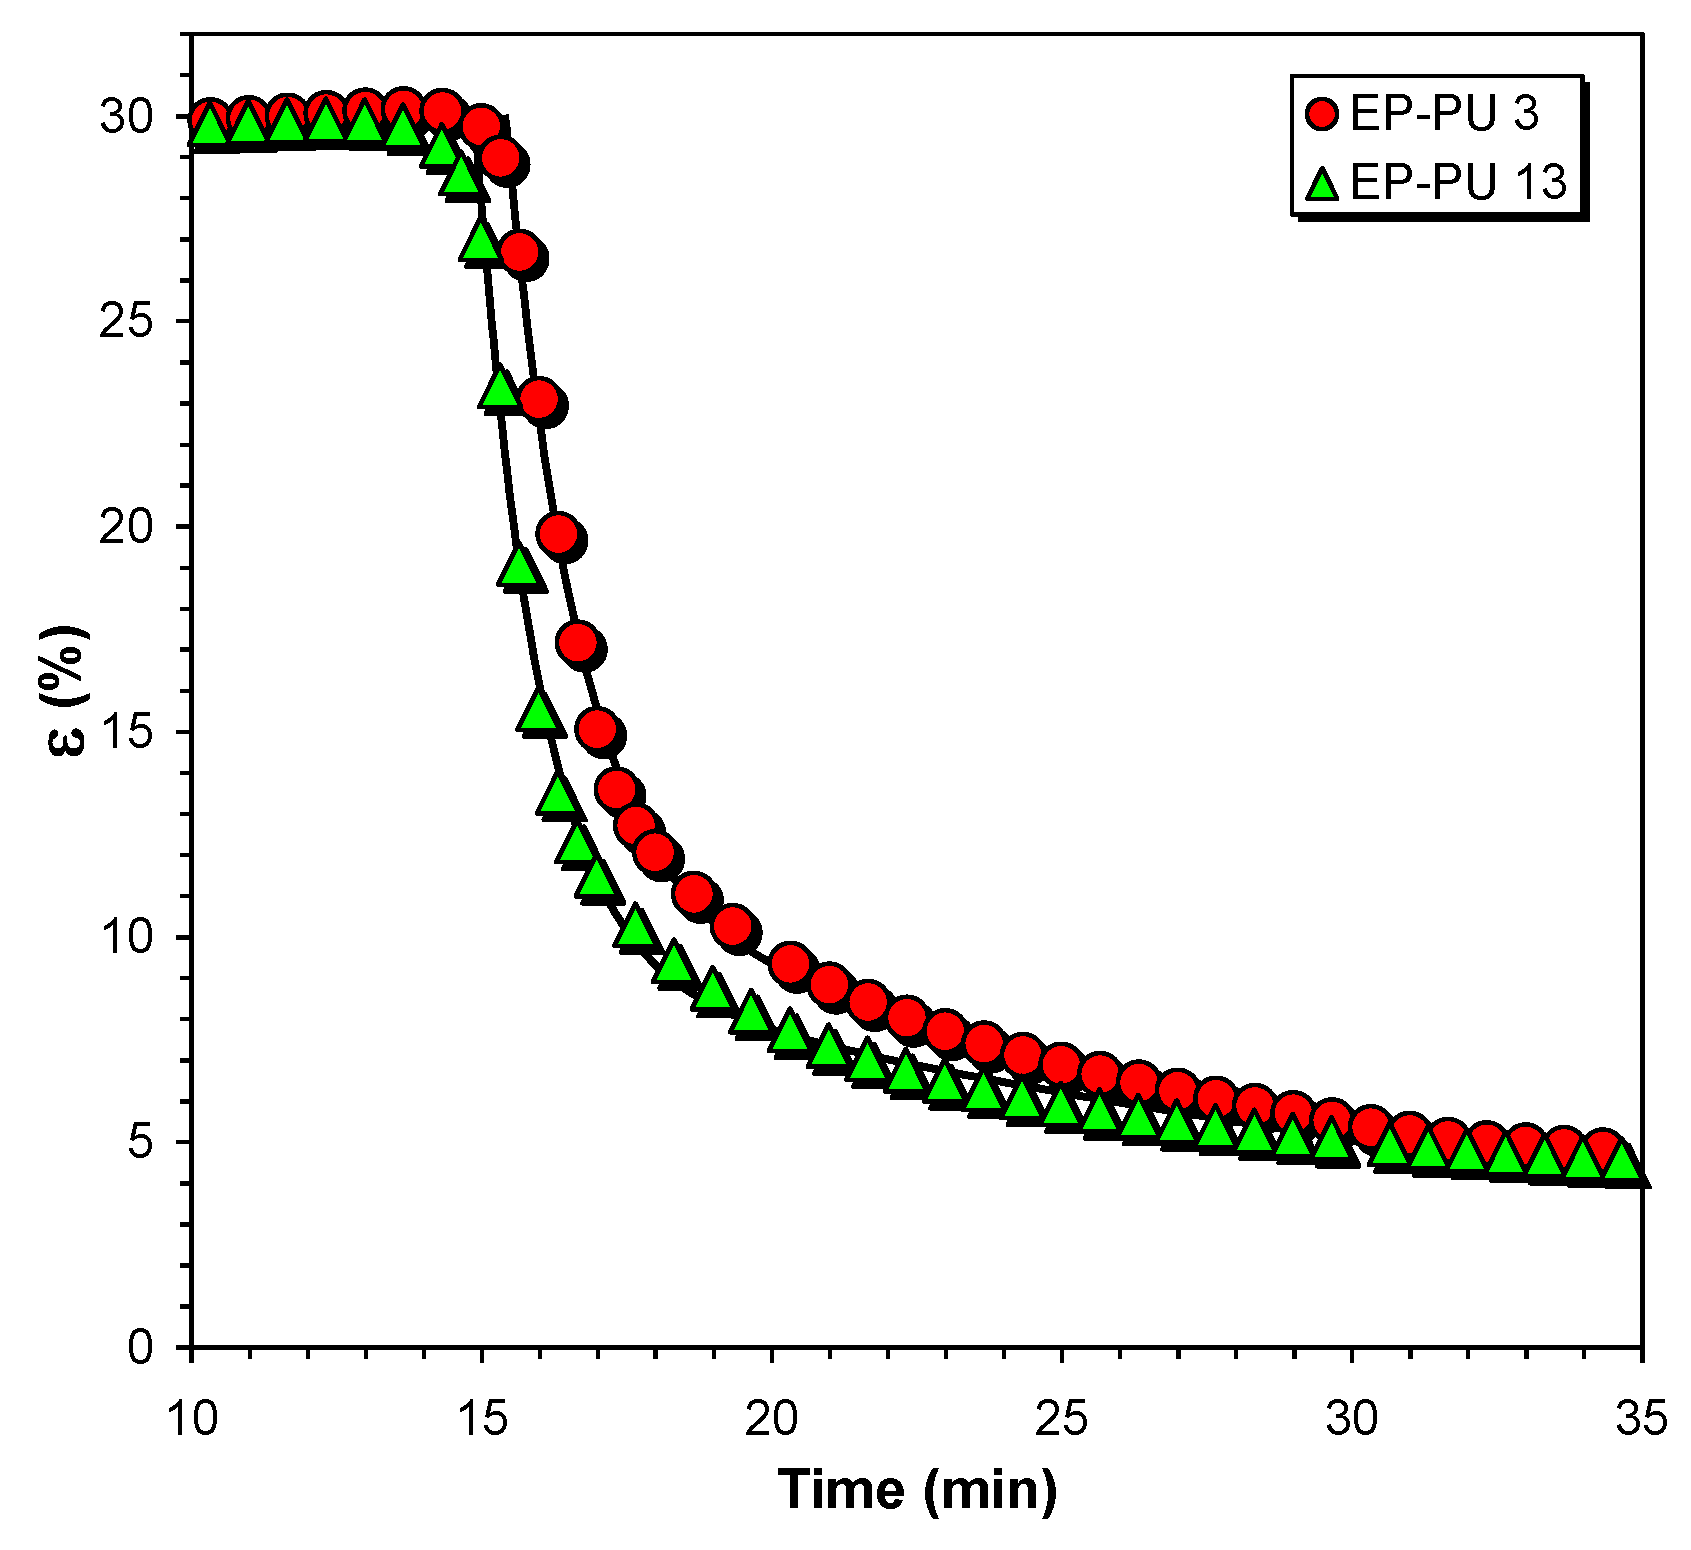
Figure 9.
Free recovery curves for the EP-PU 3 and EP-PU 13 samples. The symbols and solid lines represent the experimental data and the fitted curves calculated using double exponential functions, respectively. The fitting parameters of the curves are: A1 = 18.6, τ1 = 1.23 min−1 and A2 = 11.0, τ2 = 21.2 min−1 for the EP-PU 3, A1 = 17.1, τ1 = 1.1 min−1 and A2 = 9.2, τ2 = 25.0 min−1 for the EP-PU 13.
Table 1.
The corresponding molar ratios in the feed of the EP-PUs 1–15 synthesized. The number in the parenthesis represents the Mn of the PCD or PCL expressed in kg/mol unit.
Table 1.
The corresponding molar ratios in the feed of the EP-PUs 1–15 synthesized. The number in the parenthesis represents the Mn of the PCD or PCL expressed in kg/mol unit.
| Sample | Composition/Molar Ratios in the Feed |
|---|
| EP-PU 1 | PCD(2)-HDI-DA adduct-DGEBA/1:2:0.5:0.5 |
| EP-PU 2 | PCD(2)-HDI-DA adduct-DGEBA/1:2:1:1 |
| EP-PU 3 | PCL(10)-HDI-DA adduct-DGEBA/1:2:1:1 |
| EP-PU 4 | PCL(25)-HDI-DA adduct-DGEBA/1:2:1:1 |
| EP-PU 5 | PCL(50)-HDI-DA adduct-DGEBA/1:2:1:1 |
| EP-PU 6 | PCD(2)-HDI-DA adduct-DGEBA/1:2:2:2 |
| EP-PU 7 | PCL(10)-HDI-DA adduct-DGEBA/1:2:2:2 |
| EP-PU 8 | PCL(25)-HDI-DA adduct-DGEBA/1:2:2:2 |
| EP-PU 9 | PCL(50)-HDI-DA adduct-DGEBA/1:2:2:2 |
| EP-PU 10 | PCL(10)-HDI-DA adduct-DGEBA-JA/1:2:1:1:1 |
| EP-PU 11 | PCL(25)-HDI-DA adduct-DGEBA-JA/1:2:1:1:1 |
| EP-PU 12 | PCL(50)-HDI-DA adduct-DGEBA-JA/1:2:1:1:1 |
| EP-PU 13 | PCL(10)-HDI-DA adduct-DGEBA-JA/1:2:2:2:2 |
| EP-PU 14 | PCL(25)-HDI-DA adduct-DGEBA-JA/1:2:2:2:2 |
| EP-PU 15 | PCL(50)-HDI-DA adduct-DGEBA-JA/1:2:2:2:2 |
Table 2.
Composition and the corresponding molar ratios in the feed of the EP-PUs 16–24 synthesized. The number in the parenthesis represents the Mn of the PCL expressed in kg/mol unit.
Table 2.
Composition and the corresponding molar ratios in the feed of the EP-PUs 16–24 synthesized. The number in the parenthesis represents the Mn of the PCL expressed in kg/mol unit.
| Sample | Composition/Molar Ratios in the Feed |
|---|
| EP-PU 16 | PCL(10)-HDI-FA-FA_DGEBA oligomer-BMI/1:2:2:1:1 |
| EP-PU 17 | PCL(10)-HDI-FA-FA_DGEBA oligomer-BMI/1:2:2:1:2 |
| EP-PU 18 | PCL(10)-HDI-FA-FA_DGEBA oligomer-BMI/1:2:2:2:1 |
| EP-PU 19 | PCL(10)-HDI-FA-FA_DGEBA oligomer-BMI/1:2:2:2.5:1 |
| EP-PU 20 | PCL(10)-HDI-FA-FA_DGEBA oligomer-BMI/1:2:2:3:1 |
| EP-PU 21 | PCL(50)-HDI-FA-FA_DGEBA oligomer-BMI/1:2:2:5:1 |
| EP-PU 22 | PCL(50)-HDI-FA-FA_DGEBA oligomer-BMI/1:2:2:10:1 |
| EP-PU 23 | PCL(50)-HDI-FA-FA_DGEBA oligomer-BMI/1:2:2:12.5:1 |
| EP-PU 24 | PCL(50)-HDI-FA-FA_DGEBA oligomer-BMI/1:2:2:15:1 |
Table 3.
Glass transition temperature (Tg), melting temperature (Tm), melting enthalpy (ΔHm), crystallinity values and rDA temperatures from DSC measurements in the first heating cycle.
Table 3.
Glass transition temperature (Tg), melting temperature (Tm), melting enthalpy (ΔHm), crystallinity values and rDA temperatures from DSC measurements in the first heating cycle.
| Sample | Tg (°C) | Tm (°C) | ΔHm (J/g) | Crystallinity (%) | rDA (°C) |
|---|
| EP-PU 1 | −48.4 | 23.8 | 9.8 | 10.1 | 133.9 |
| EP-PU 2 | −53.1 | 22.9 | 19.4 | 23.3 | 136.8 |
| EP-PU 3 | - | 61.7 | 67.8 | 56.3 | 134.6 |
| EP-PU 4 | - | 65.3 | 89.95 | 69.7 | 139.8 |
| EP-PU 6 | −41.7 | 20.3 | 3.7 | 5.7 | 138.4 |
| EP-PU 7 | - | 61.3 | 67.6 | 60.7 | 135.3 |
| EP-PU 10 | - | 61.8 | 57.8 | 48.4 | 133.3 |
| EP-PU 11 | - | 63.2 | 73.1 | 56.9 | 136.4 |
| EP-PU 13 | - | 61.6 | 54.9 | 50.0 | 132.7 |
| EP-PU 16 | - | 60.9 | 64.2 | 58.6 | 133.7 |
| EP-PU 17 | - | 62.8 | 67.4 | 61.5 | 131.1 |
| EP-PU 18 | - | 62.2 | 67.0 | 66.5 | 130.8 |
| EP-PU 20 | - | 61.3 | 58.6 | 64.6 | 128.9 |
Table 4.
Tensile mechanical properties of the EP-PUs 1–15. Designations: E, elastic modulus; εR, ultimate elongation; σR, stress at break.
Table 4.
Tensile mechanical properties of the EP-PUs 1–15. Designations: E, elastic modulus; εR, ultimate elongation; σR, stress at break.
| Sample | E (MPa) | εR (%) | σR (MPa) |
|---|
| EP-PU 1 | 2 ± 0.2 | 837 ± 26 | 17 ± 2 |
| EP-PU 2 | 4 ± 1 | 627.5 ± 77 | 20 ± 2 |
| EP-PU 3 | 177 ± 14 | 974 ± 76 | 27 ± 3 |
| EP-PU 4 | 233 ± 5 | 4 ± 0.2 | 7.5 ± 0.5 |
| EP-PU 5 | 181 ± 12 | 794.5 ± 50 | 20 ± 3 |
| EP-PU 6 | 1 ± 0.2 | 910 ± 31 | 9 ± 1 |
| EP-PU 7 | 107 ± 10 | 30 ± 5 | 7 ± 0.2 |
| EP-PU 8 | 184 ± 13 | 5 ± 1 | 3 ± 1 |
| EP-PU 9 | 92 ± 16 | 298 ± 30 | 8.2 ± 0.5 |
| EP-PU 10 | 232 ± 5 | 851 ± 119 | 25 ± 1 |
| EP-PU 11 | 237 ± 29 | 457 ± 63 | 17 ± 1 |
| EP-PU 12 | 349 ± 20 | 907.5 ± 6 | 35 ± 0.3 |
| EP-PU 13 | 221 ± 29 | 604.5 ± 31 | 22.5 ± 0.7 |
| EP-PU 14 | 124.5 ± 16 | 243.5 ± 35 | 10 ± 0.7 |
| EP-PU 15 | 208 ± 19 | 549 ± 65 | 21 ± 1 |
Table 5.
Tensile mechanical properties of EP-PUs 16–24. For designations, see
Table 4.
Table 5.
Tensile mechanical properties of EP-PUs 16–24. For designations, see
Table 4.
| Sample | E (MPa) | εR (%) | σR (MPa) |
|---|
| EP-PU 16 | 387 ± 10 | 670 ± 113 | 22 ± 3 |
| EP-PU 17 | 388 ± 98 | 378 ± 83 | 21 ± 1 |
| EP-PU 18 | 392 ± 6 | 359 ± 8 | 14 ± 3 |
| EP-PU 19 | 470 ± 107 | 2 ± 0.3 | 10 ± 2 |
| EP-PU 20 | 648.5 ± 47 | 3.5 ± 0.5 | 15 ± 2 |
| EP-PU 21 | 477 ± 51.5 | 419 ± 42 | 23 ± 1 |
| EP-PU 22 | 366 ± 31 | 11 ± 2 | 13 ± 0.3 |
| EP-PU 23 | 294 ± 66 | 9 ± 1.4 | 10 ± 1 |
| EP-PU 24 | 305 ± 24 | 11.5 ± 3 | 11 ± 0.3 |
Table 6.
The E′ values and crosslink densities (νe) obtained from DMA results for samples EP-PU 2, 3, 6 and EP-PU 13. The temperature in the bracket after the value of νe is the rubbery onset temperature considered in the calculation.
Table 6.
The E′ values and crosslink densities (νe) obtained from DMA results for samples EP-PU 2, 3, 6 and EP-PU 13. The temperature in the bracket after the value of νe is the rubbery onset temperature considered in the calculation.
| Sample | E′ (MPa) | νe (moL/cm3) |
|---|
| EP-PU 2 | 18.2 | 2.3 × 10⁻³ (40 °C) |
| EP-PU 3 | 1.5 | 1.8 × 10⁻⁴ (67 °C) |
| EP-PU 6 | 5.6 | 7.2 × 10⁻⁴ (40 °C) |
| EP-PU 13 | 2.2 | 2.6 × 10⁻⁴ (65 °C) |
Table 7.
Shape fixity and shape recovery ratios for selected EP-PUs.
Table 7.
Shape fixity and shape recovery ratios for selected EP-PUs.
| Sample | Rf (%) | Rr (%) |
|---|
| EP-PU 2 | 35 | 77 |
| 63 * | 88 * |
| EP-PU 3 | 99 | 83 |
| EP-PU 10 | 99 | 84 |
| EP-PU 13 | 98 | 85 |


 ,
, 


