Color Tuning by Oxide Addition in PEDOT:PSS-Based Electrochromic Devices


1
CNRS, Univ. Bordeaux., ICMCB, UMR 5026, Bx INP, F-33600 Pessac, France
2
Aquitaine Sciences Transfert, 33405 Talence, France
*
Author to whom correspondence should be addressed.
Polymers 2019, 11(1), 179; https://doi.org/10.3390/polym11010179
Submission received: 12 December 2018
/
Revised: 9 January 2019
/
Accepted: 9 January 2019
/
Published: 21 January 2019
(This article belongs to the Special Issue Electrochromic Polymers)
Abstract
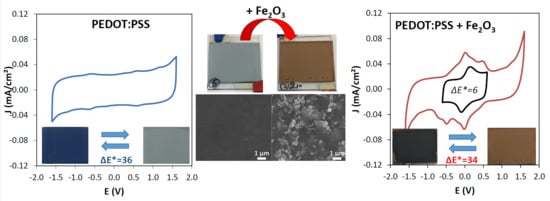
:Poly(3,4-ethylenedi-oxythiophene) (PEDOT) derivatives conducting polymers are known for their great electrochromic (EC) properties offering a reversible blue switch under an applied voltage. Characterizations of symmetrical EC devices, built on combinations of PEDOT thin films, deposited with a bar coater from commercial inks, and separated by a lithium-based ionic membrane, show highest performance for 800 nm thickness. Tuning of the color is further achieved by mixing the PEDOT film with oxides. Taking, in particular, the example of optically inactive iron oxide Fe2O3, a dark blue to reddish switch, of which intensity depends on the oxide content, is reported. Careful evaluation of the chromaticity parameters L*, a*, and b*, with oxidizing/reducing potentials, evidences a possible monitoring of the bluish tint.
1. Introduction
In recent years, electrochromic devices (ECDs), known for their ability to modify their optical properties under an applied voltage, have received growing interest [1,2,3]. ECDs are based on a combination of materials assembled in various configurations either in a transmittive or reflective mode and find applications in smart windows, rearview mirrors, and displays [4,5,6]. The list of electrochromic materials include inorganic systems (e.g., WO3, V2O5, NiO [7,8,9] and Prussian blue [10]) and organic ones (e.g., viologens, polyaniline, and poly(3,4-ethylenedioxythiophene)). Compared with inorganic electrochromic materials, organic electrochromic materials have advantages such as a broader color palette, higher coloration efficiency, and greater optical contrast [11,12,13,14,15,16]. In addition, recent studies have demonstrated the suitability of a large number of techniques, including spray coating, ink jet, and doctor blading, for deposition of thin films of conducting polymers with good control of the process [17,18,19,20,21,22,23]. Indeed, the choice of the processing method will affect not only the charge to activate the device but also their stability. Among π-conjugated polymers, polypyrrole (PPy), polyaniline (PANI), and polythiophene (PTP) are the most widely studied. In practical use, most of the inks commercially available are PEDOT-based. Thus, aiming at transferring our findings from lab scale to production, we choose to focus our attention on PEDOT-based devices. More precisely, we recently demonstrated activation of PEDOT-based ECDs using a smartphone for detection as counterfeit labels. PEDOT-based devices offer a color change from colorless or light blue, depending on film thickness, to dark blue. One means to widen the range of available colors is to combine PEDOT with oxides in such a ratio that the oxide color becomes predominant and the role of PEDOT is more as a conductive agent. This approach is more dependent on the oxide contribution and may largely modify the process. Aiming at an easy way to enlarge the color range of the commercially available PEDOT-based ink, the addition of a small quantity of oxides is currently investigated in our group. Herein, we particularly focus on Fe2O3 addition offering a reddish modulation of the usual blue color of PEDOT. Prior to the oxide addition, a detailed investigation of the influence of the PEDOT thickness on the EC behavior is carried out utilizing lithium-based symmetrical devices.
2. Materials and Methods
2.1. Electrochromic Ink Formulation
The electrochromic inks were formulated from commercial PEDOT:PSS ink Agfa Orgacon EL-P5015 (called hereinafter PEDOT:PSS paste). This high-viscosity commercial paste (>100,000 mPa·s) made for screen printing was first homogenized with a three-roll mill and then diluted with ethanol to lower the viscosity as follows.
For the PEDOT:PSS ink, a mixing ratio of 40 wt % of PEDOT:PSS paste and 60 wt % of ethanol was prepared. The resulting dilute solution was stirred for 15 min at room temperature, then dispersed using an ultrasonic bath for 15 min and stirred again for 15 min.
For the PEDOT:PSS+Fe2O3 ink, commercial Fe2O3-based pigment was employed (Rouge 110 purchased from Ocres de France, Fe2O3 content >97.1%). The Fe2O3 weight percentages were calculated from the PEDOT:PSS paste mass. Four premixes were prepared: weight ratio of (PEDOT:PSS paste)/(Fe2O3) = (100−x)/x, with x = 2%, 2.5%, 3%, and 3.5%. These preparations were then diluted with ethanol with a mixing ratio of 40 wt % of (PEDOT:PSS + Fe2O3) paste and 60 wt % of ethanol. The resulting dilute was stirred for 15 min at room temperature, then dispersed using an ultrasonic bath for 15 min and stirred again for 15 min.
2.2. Thin Film Deposition and Display Processing
The films were deposited with a bar coater (K control from RK PrintCoat Instruments, Erichsen RK controle, Valence, France) onto ITO-coated (In2O3:Sn) glass substrates (commercialized by SOLEMS with a resistance of 30 Ω □−1) and then dried at 120 °C/5 min on a hot plate. In order to vary the thickness of the PEDOT:PSS films, several bars were used for the process, numbered from 1 to 7, corresponding to wet film coating thickness of, respectively, 6 µm, 12 µm, 24 µm, 40 µm, 50 µm, 60 µm, and 80 µm. For the PEDOT:PSS + Fe2O3 films, bar n°5 was used.
The displays were made in a symmetric configuration, that is, for each device the same PEDOT:PSS/ITO/glass stack was employed for both working and counter electrochromic electrodes. An electrolytic membrane was then used to glue these two electrodes and to ensure the ionic conduction. This membrane was prepared and coated as follows. A commercial lithium-ionic-liquid-based solution of lithium bis(trifluoromethanesulfonyl)imide in 1-ethyl-3-methylimidazolium bis(trifluoromethanesulfonyl)imide containing 40 wt % of PMMA dissolved in butanone (EmimTFSI:LiTFSI (9:1 Molar Ratio), 40 wt % PMMA in butanone, 99.9%, Solvionic, Toulouse, France) was mixed with TiO2 powder (Titanium (IV) Oxide ≥99% Sigma Aldrich, Merck KGaA, Darmstadt, Germany) as a white opaque pigment in weight ratio of 90/10. The resulting mixture was stirred for 15 min at room temperature, then dispersed using an ultrasonic bath for 15 min and stirred again for 15 min. The electrolyte mixture was then deposited by bar coating (bar n°8, wet thickness 100 µm) on both PEDOT:PSS/ITO/glass electrodes. After 30 s of butanone evaporation, the two pieces were assembled and pressed manually. The obtained average thickness for the electrolytic membrane was 70 µm ± 10 µm. The final stack for each display presented in this article was glass/ITO/PEDOT:PSS/(EmimTFSI:LiTFSI + PMMA + TiO2)/PEDOT:PSS/ITO/glass. Combining various thicknesses, a set of seven electrochromic displays was prepared for the thickness optimization and four displays for the Fe2O3 addition.
2.3. Structure, Morphology, and Thickness Measurements
Powder X-ray diffraction (XRD) patterns were collected on a PANalitycal X’pert PRO MPD diffractometer (Malvern Panalytical, Almelo, The Netherlands) in Bragg–Brentano θ-θ geometry equipped with a secondary monochromator and X’Celerator multistrip detector. Each measurement was made within an angular range of 2θ = 8–80°. The Cu-Kα radiation was generated at 45 kV and 40 mA (λ = 0.15418 nm). Thickness measurements were performed using a Veeco Dektak 6M Stylus Profilometer (Veeco Instruments Inc., New York, NY, USA). The average thicknesses obtained with bars numbered from 1 to 7 were respectively 109 nm, 202 nm, 354 nm, 550 nm, 730 nm, 880 nm, 1106 nm, with a measurement uncertainty of 10%. The morphology of the layers was investigated using a JEOL JSM-840 (operating at 15 kV) scanning electron microscope (JEOL JSM-840, JEOL SAV-Europe, Croissy sur Seine, France).
2.4. Electrochromic Measurements
Concerning the PEDOT:PSS single layer on ITO/glass study, the electrochemical analyses were carried out in a three-electrode cell configuration using a BioLogic SP50 potentiostat/galvanostat apparatus (BioLogic SP50, Seyssinet Pariset, France). The counter electrode and reference electrode consisted of a platinum foil and saturated calomel electrode, SCE (ESCE = 0.234 V/NHE), respectively. The operating voltage was controlled between −1.3 V and +1.3 V for chronoamperometry analysis, in a commercial lithium-based ionic liquid, namely EmimTFSI:LiTFSI (9:1 Molar Ratio, Solvionic, 99.9%). All the electrochemical measurements were performed at room temperature. The optical transmittance of PEDOT:PSS thin films was measured in situ using a Varian Cary 5000 UV-vis-NIR spectrophotometer (Agilent, les Ulis, France) between 250 and 800 nm.
Concerning the PEDOT:PSS displays, electrochemical analysis was performed in a two-electrode configuration, using a BioLogic SP50 potentiostat/galvanostat apparatus (BioLogic SP50, Seyssinet Pariset, France). Colorimetry analysis was carried out using a Konica Minolta CM-700D spectrophotometer (Konica Minolta Sensing Europe B.V., Roissy, France), allowing the direct determination of colorimetric parameters of the CIE (L*a*b*) color space.
3. Results and Discussion
3.1. Optimization of the PEDOT:PSS Thickness
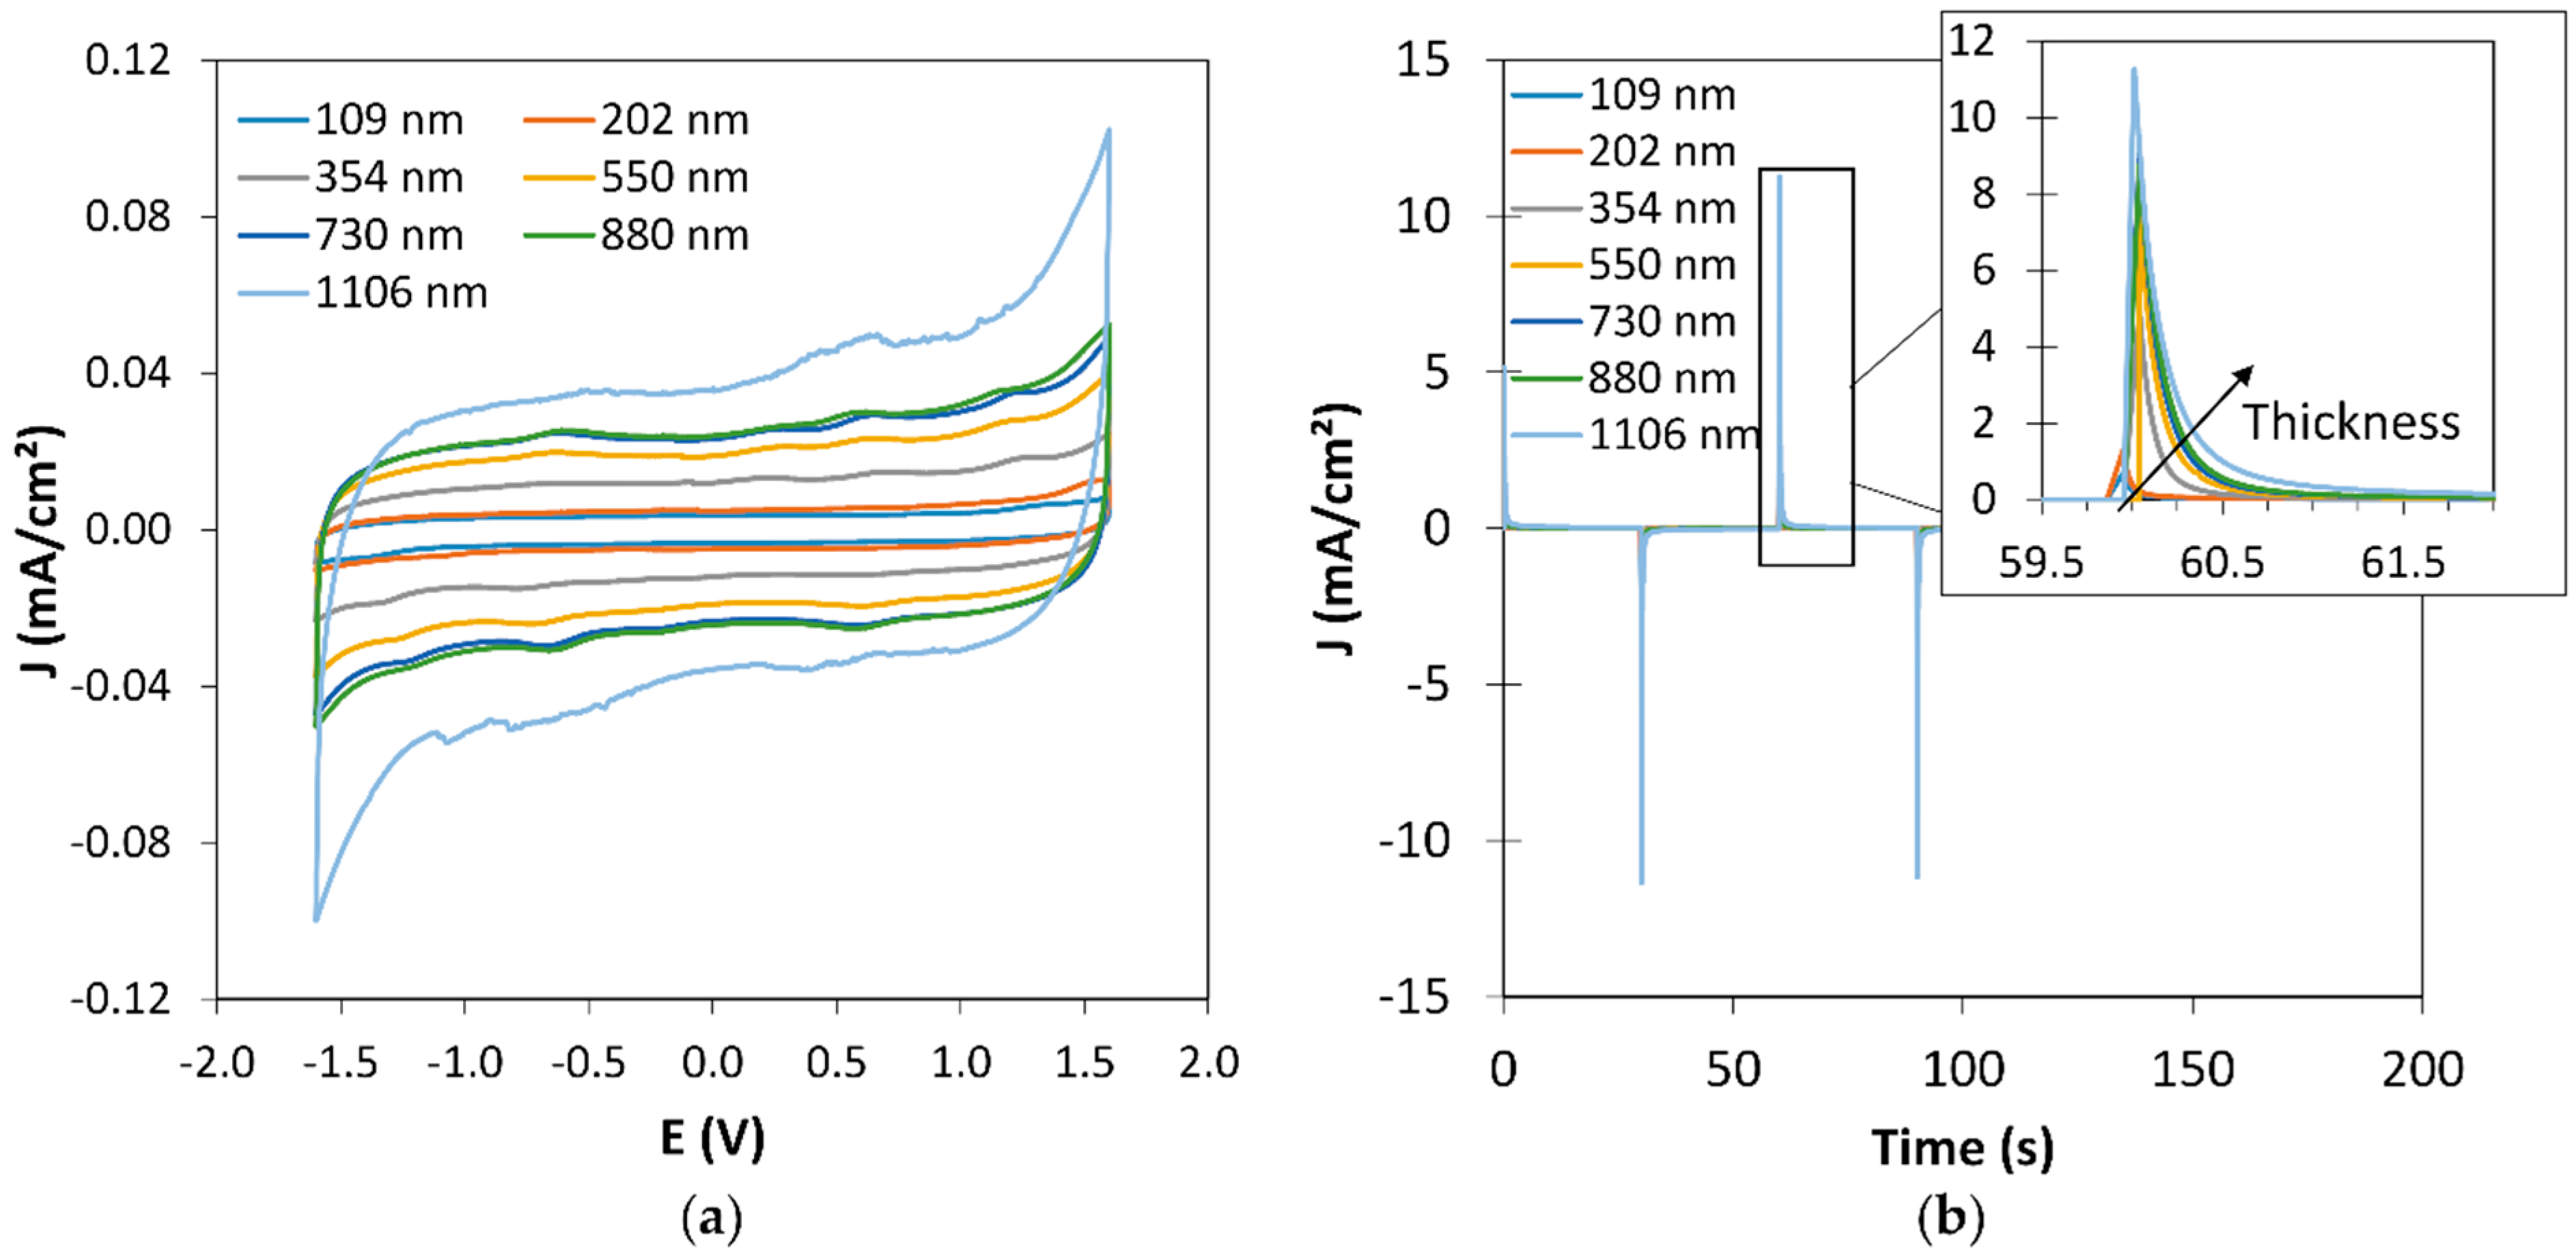
Figure 1 shows the electrochemical performances of the displays obtained from PEDOT:PSS thin films of different thicknesses. In Figure 1a, the second cycles of cyclic voltammetry measurements (CV) are presented. The operating voltage was controlled between −1.6 V and +1.6 V at a scan rate of 40 mV·s−1. A symmetric behavior is observed for both reduction and oxidation, due to the symmetric geometry of the stack. The rectangular-like shape of the CV is typical of a pseudo capacitive behavior. As expected, the capacity increases with the increase of the PEDOT:PSS thickness. The switching kinetic of the displays was investigated by chronoamperometry measurements. Figure 1b shows the current response (j-t) of the displays for potential steps of +1.6 V/30 s and −1.6 V/30 s. A symmetric behavior is also observed between oxidation and reduction. The display current response increases with thickness from 0.4 s for the thinnest film, to less than 1 s for the thickest one. Complementary information about the switching time calculation is given in Appendix A, in which the switching time is deduced from 95% drop of the current density. The increase of the film thickness leads to an increase of the capacity Q of the electrode, therefore of charge density, and causes an expected increase of the current response time. In addition, the nonlinearity of the switching time versus thickness well agrees with a decrease in the PEDOT resistance when increasing the thickness [24].
Figure 2 shows the photographs of the displays taken during the chronoamperometry measurements presented above. A clear color gradient is observed with the increase of thickness, in oxidized (bleached) state and mainly in reduced neutral (colored) state. Oxidized state graduates from whitish blue to light blue whereas the reduced state color graduates from light blue to dark blue. In conclusion, the thickness of the electrochromic layer is an easy way to tune the color of the display, as shown on the corresponding measured L*a*b* parameters mentioned next to each image.
In order to evaluate the impact of the PEDOT:PSS thickness on the color contrast and determine the optimum thickness, colorimetric measurements of L*, a*, b* chromaticity parameters were carried out during CA measurements for 30 cycles (Figure 3a). The optical contrast, herein the color contrast, ΔE* was then calculated from the L*, a*, b* values from the following formula:
Here, , , and represent color space parameters at the reduced state, and , , and correspondingly at the oxidized state. For films with a thickness below or equal to 200 nm, the color contrast continuously decreases, whereas for higher thickness, the contrast first increases for the 10 first cycles and then slightly decreases for the next 20 cycles (Figure 3a). In good agreement with the visual aspect of Figure 2, showing a more pronounced bluish color from the 354 nm thickness towards thicker film for the reduced state, a large increase in the color contrast is visible from this thickness threshold.
Figure 3 presents ΔE* as a function of the film thickness for the 10th CA cycle. Overall, the color contrast increases with increasing thickness from 109 to 1106 nm, with a maximum of ΔE* value around 36 at 880 nm. The “bell” shape of this plot is in good agreement with previous studies in the literature [17,25]. Compared to Kawahara’s study, also on PEDOT:PSS electrochromic displays, the optimal thickness is found at higher thickness in our case (i.e., 500–600 nm vs. 700–800 nm) [25]. However, Kawahara and coworkers always used the same thickness for the counter electrode in each of their devices that could change the color perception. These authors also emphasized the importance of having a transparent enough oxidized state favoring thinner thickness.
So as to further investigate the properties of the optimum thickness of PEDOT:PSS (i.e., 880 nm), display, electrochemical, and optical properties of the single layer deposited on ITO/glass were studied. On Figure 4a, chronoamperometry measurements, performed in a three-electrode configuration using ionic-liquid-based (0.3 M) Li-TFSI in EMI-TFSI as a supporting electrolyte, Platinum as counter electrode and Saturated Calomel Electrode as reference electrode (SCE) are presented. Potential was applied for 20 s at −1.3 V for reduction and 20 s at +1.3 V for oxidation. Both response times were approximately 3 s. The same potentials were applied for several minutes for in situ optical transmittance measurements. The corresponding spectra for the bleached and the colored states are shown in Figure 4b. The associated transmittance values at 600 nm are, for the bleached state, Tb ≈ 44% and, for the colored state, Tc ≈ 7%, corresponding to a total optical transmittance modulation of ∆T ≈ 37%. The electrochromic performance is commonly characterized by the optical density (OD) represented by the logarithmic ratio of the transmittance in the bleached state (Tb) to the transmittance in the colored state (Tc) and the coloration efficiency (CE) defined as the change in optical density per unit inserted charge. The ΔOD and CE are calculated using the following two relations:
ΔOD = log(Tb/Tc)
CE = ΔOD/Q
Here, Q is the amount of charge transferred per unit area. The calculated optical density ΔOD = 0.76 and the amount of charge Q = 0.01451 C.cm−2 leads to a coloration efficiency value of 52.4 cm2·C−1 The rather low CE value as compared to the ones reported in the literature [1,14,15,17] may originate from the wide potential range leading to large current values measured using chronoamperometry while the capacity is usually deduced from dynamic measurements using cyclic voltammetry.
In order to study the long-term performances of the display with the optimum PEDOT:PSS thickness, color contrast was measured during chronoamperometry cycling. An oxidizing potential of +1.6 V was applied for 30 s, and reducing potential of −1.6 V for 30 s, during 500 cycles. In situ colorimetric measurements were carried out every 50 cycles. The evolution of the color contrast upon cycling is presented in Figure 5. It should be noted that this display was already cycled around 50 times before this measurement, explaining the lower starting value of ΔE* of 27 as compared to the one of 34 (Figure 3b). During the 100 first cycles, the optical contrast is stable and then slowly decreases to a stable value of ΔE* ≈ 20 at 500 cycles.
3.2. Tuning of the PEDOT:PSS Color by Fe2O3 Pigment Addition
In the earlier section, we demonstrated that the electrochromic layer thickness could enable the tuning of the PEDOT:PSS tint. Another original way to change and adapt the PEDOT:PSS color is to add an inert color pigment to the electrochromic layer. Herein we present the results obtained by adding Fe2O3 red pigment into the PEDOT:PSS ink from 2 wt % to 3.5 wt %. The pigment ratios were chosen after previous empirical trials. As explained in Section 2.1, these percentages correspond to the mixing ratio of the pigment with the PEDOT:PSS paste. Therefore, after the thermal drying of the layer, the Fe2O3 ratio increases significantly. For convenience, the devices will be designated by the mixing ratio thereafter.
It is well known that Fe2O3 exhibits many different crystalline forms. The XRD pattern of the Fe2O3-based pigment corresponds to the α-Fe2O3 phase (Hematite) (Figure 6). In the literature, Fe2O3 electrochromic properties have been the subject of debates [26,27,28,29,30,31,32,33]. Gutiérrez and Beden have confirmed that FeOOH is responsible for the electrochromic effect, and also identified weak absorption peak under potential that could be attributed to γ-Fe2O3 and α-Fe2O3 [27]. However, later studies found that α-Fe2O3 did not present any electrochromic properties [29,31]. More recently, Garcia-Lobato proposed new insight into the electrochromic properties, showing that α-Fe2O3 can be, in some aqueous electrolytic conditions, a starting phase for the transformation to a Fe(OH)2 phase and subsequently γ-Fe2O3, topotactic redox reactions responsible for color changes [32,33]. Therefore, in the present study, considering the literature background, the hematite Fe2O3-based pigment can be considered electrochromically neutral.
The average thickness measured by mechanical profilometer for Fe2O3 contents of 2%, 2.5%, 3%, and 3.5% is 814 nm, 918 nm, 1090 nm, and 1235 nm, respectively. As discussed above, the effective Fe2O3 contents in the films are much higher, explaining the large increase of thickness for films deposited initially using a similar bar (i.e., bar n°5, wet thickness 50 µm).
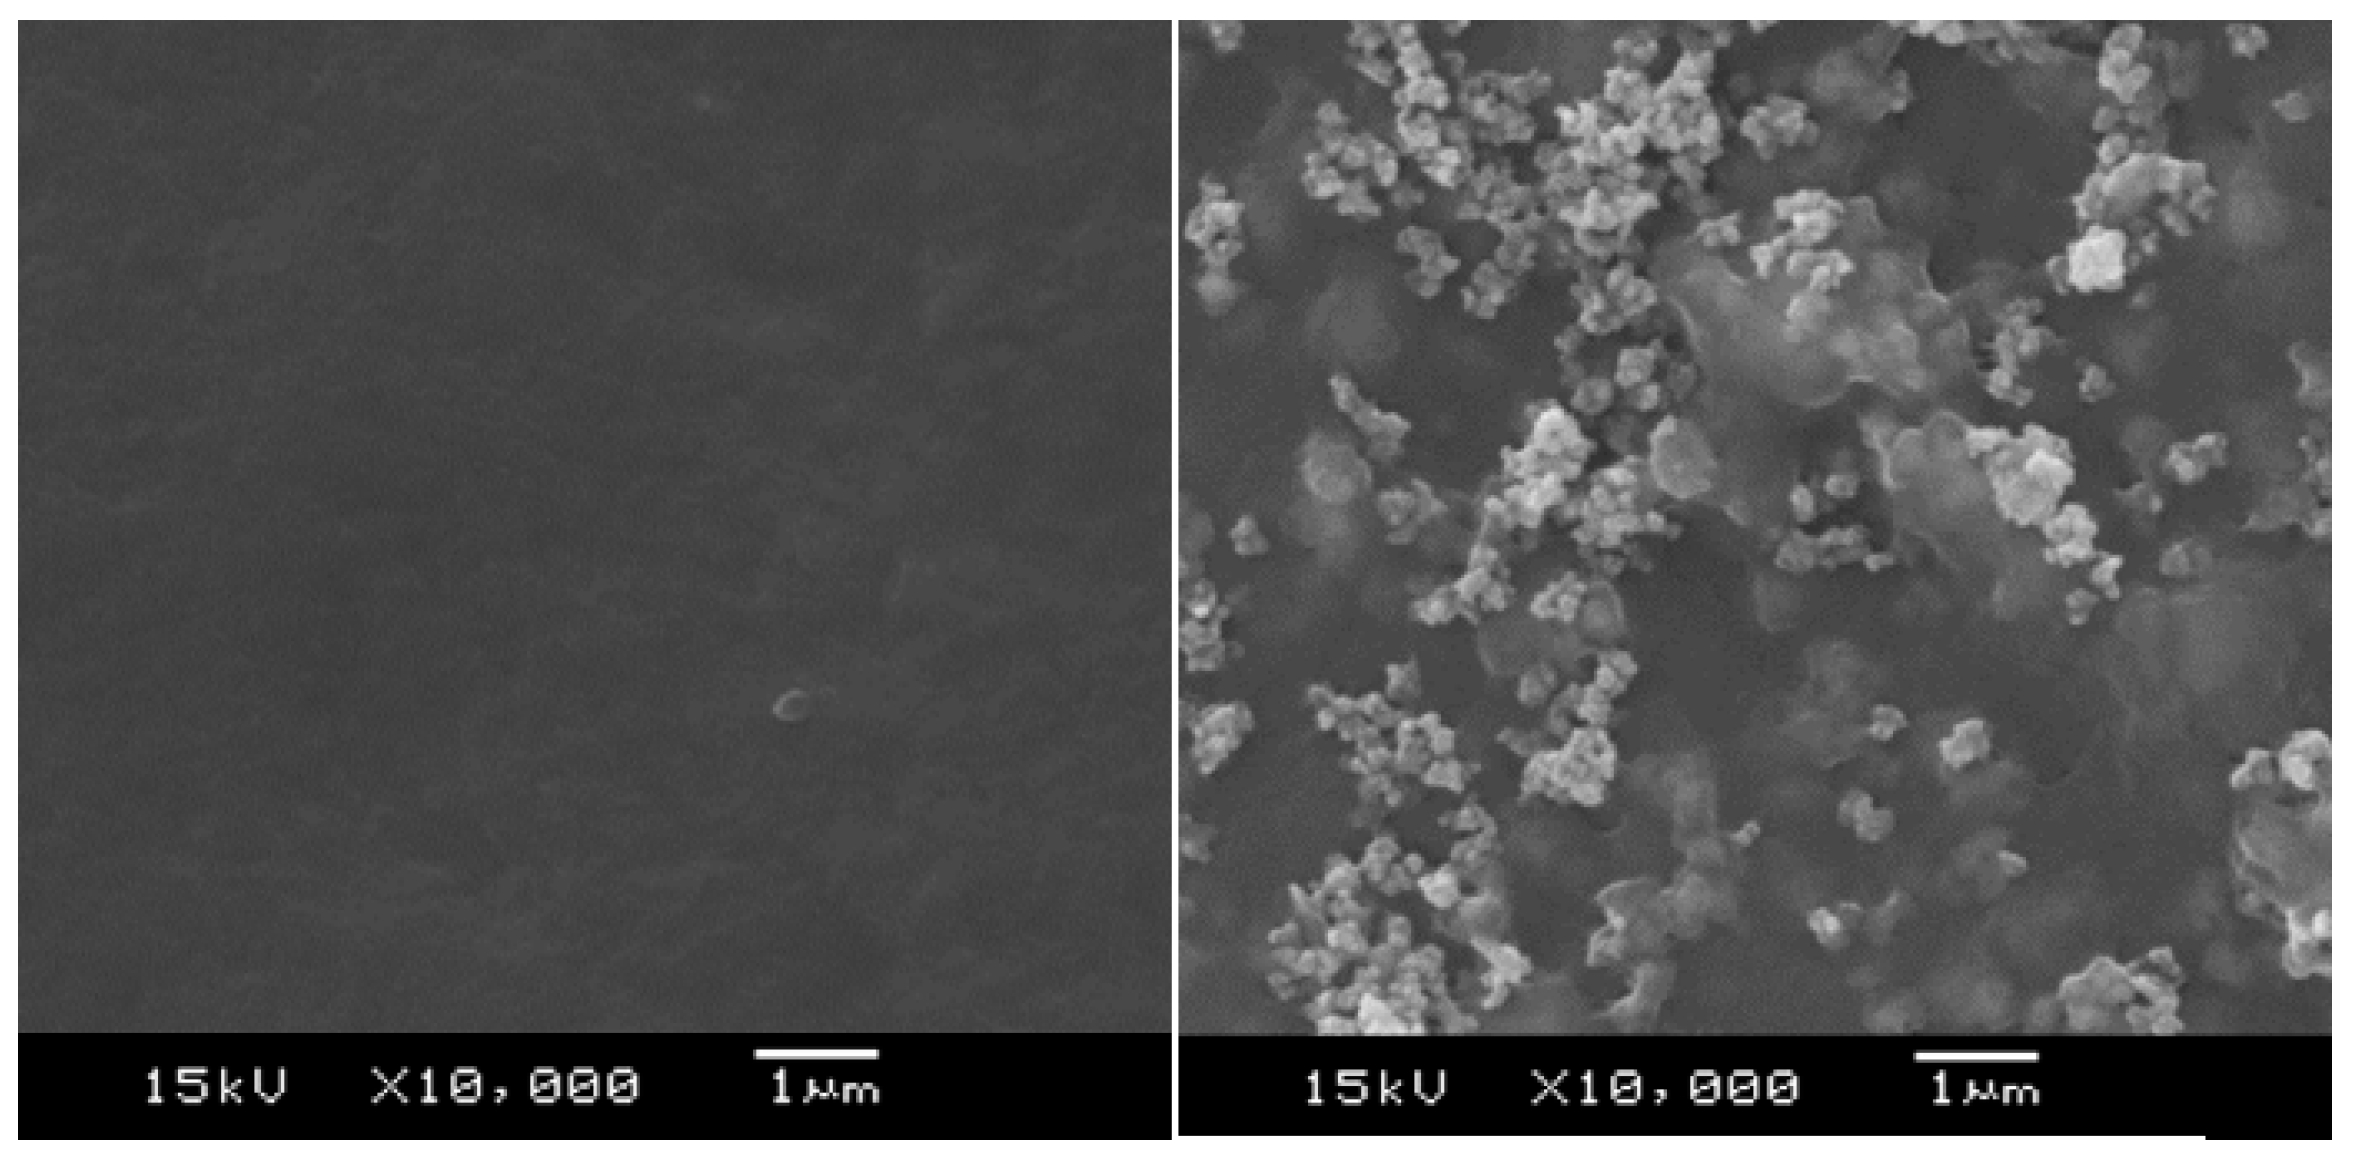
Figure 7 shows the SEM micrographs of the Fe2O3/PEDOT:PSS composite film and the one of the PEDOT:PSS single layer The Fe2O3 particles, of few hundreds of nanometers, are well dispersed in the PEDOT:PSS matrix. A significant increase of the film roughness from Ra = 74 nm (PEDOT) to 200 nm (PEDOT +2.5% Fe2O3) was measured by profilometry.
Symmetrical displays were built from combining PEDOT:PSS/% Fe2O3 thick films. The cyclic voltammograms of the displays show an evolution of the shape with the Fe2O3 pigment addition (Figure 8a). Indeed, an extra electrochemical response is measured in oxidation between −0.5 V and 0.8 V and symmetrically during reduction in the same potential range. The electrochemical response is not associated with an electrochromic phenomenon, as shown in Figure 8b, as a very low color contrast was measured between 0.6 V and −0.6 V. Campet et al. reported that Fe2O3 thin film electrodes exhibit an electrochemical response attributed to Li+ electrochemical (de)insertion in very fine-grained film or when the microcrystallites were finely dispersed in conductive polymers [28], that could explain this electrochemical response with the addition of Fe2O3. PEDOT:PSS oxidation and reduction peaks remain at the same potentials, respectively at +1.6 V and −1.6 V. Therefore, color switching of the displays was studied around these potentials in chronoamperometry.
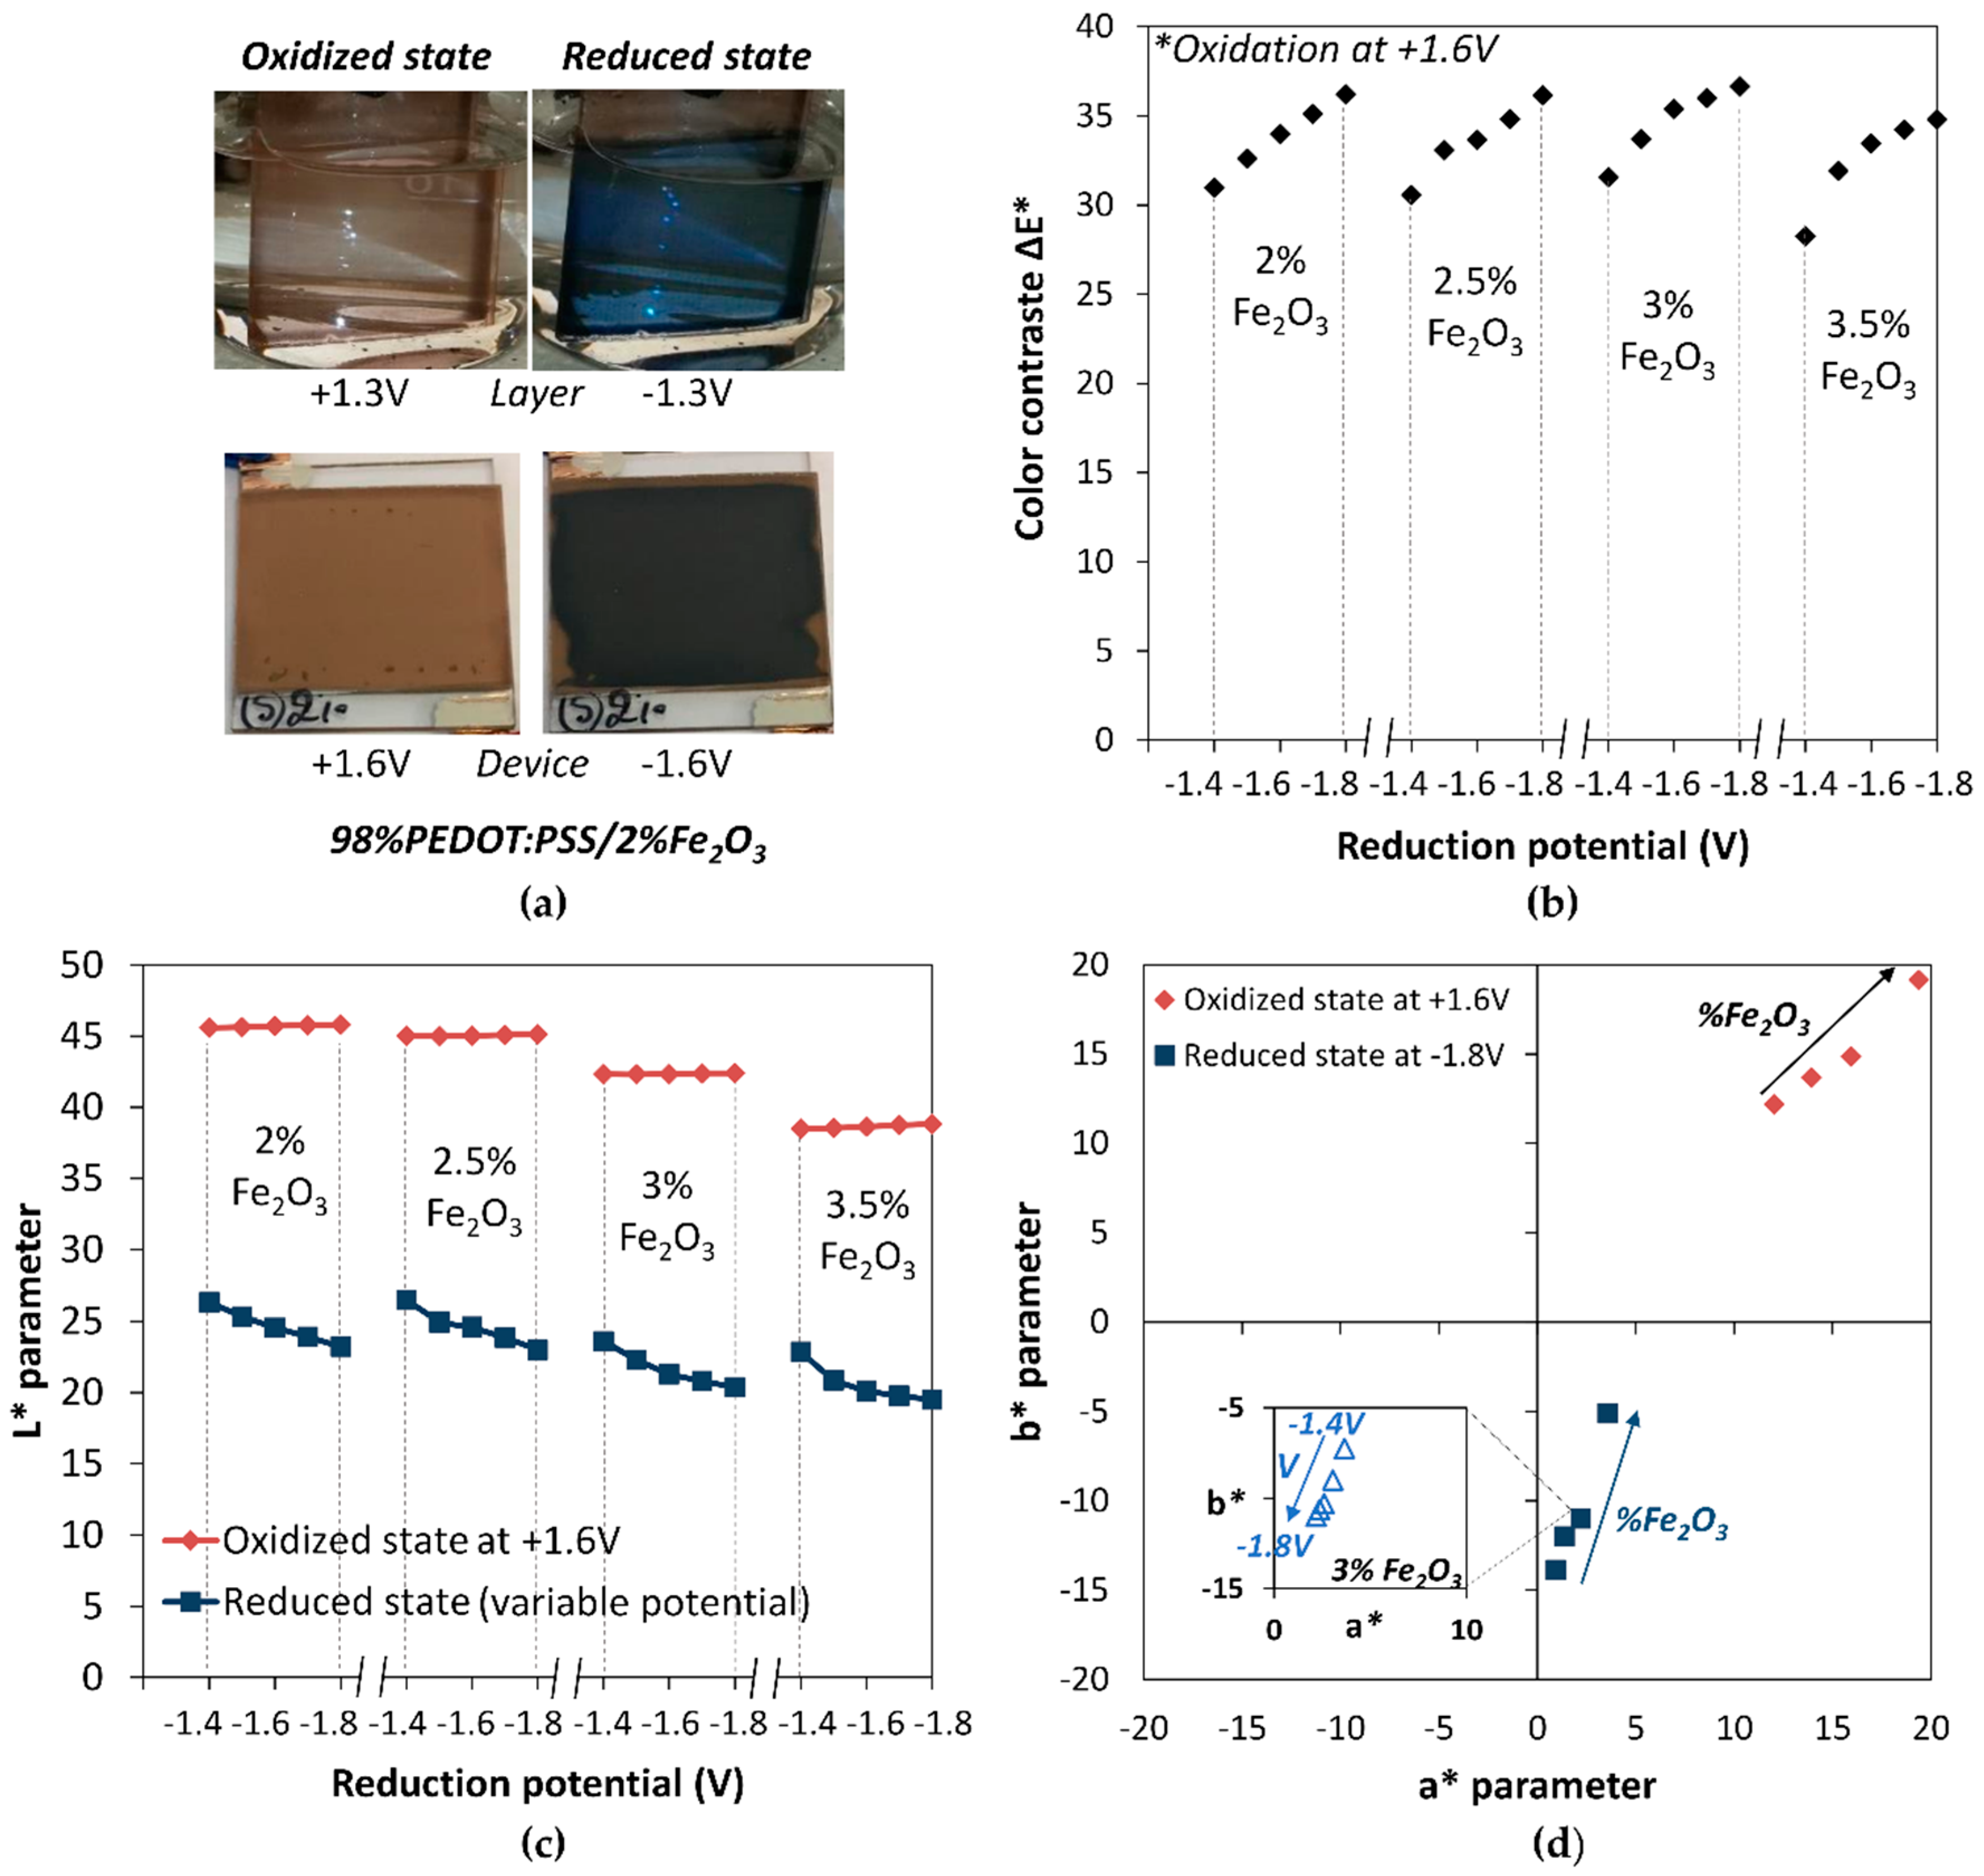
An example of the obtained colors at the oxidized and reduced states of PEDOT:PSS with 2% Fe2O3 content is shown in Figure 9a. The photographs were taken during CA measurements: on top images in three-electrode configuration at V = +1.3 V and V = −1.3 V using ionic-liquid-based (0.3 M) Li-TFSI in EMI-TFSI as a supporting electrolyte, Platinum as counter electrode, and Saturated Calomel Electrode as reference electrode, on bottom images in display configuration at V = +1.6 V and V = −1.6 V. On the oxidized state, due to the high tinting strength of Fe2O3 on the light blue color of PEDOT:PSS, the Fe2O3 addition induces a red color in both configurations. On the reduced state, the film color switches to dark blue; in this case, the PEDOT:PSS-reduced color takes over the Fe2O3 pigment.
The tint of the red and blue colors can then be tuned with the reducing potential and the Fe2O3 content, as shown in Figure 9b–d on the L*a*b* color space parameters. The colorimetric measurements were performed during CA measurements on displays with various Fe2O3 rates. Each time, the oxidation potential was applied at +1.6 V/30 s and the reduction potential was alternatively applied at +1.4 V/30 s to +1.8 V/30 s increasing by 0.1 V steps.
For each Fe2O3 content, the color contrast is similar and it increases with the reduction voltage, correlating the decrease of the L* parameter with the reduction potential. The color tints were studied by representation in the b* versus a* plan (Figure 9d). In one hand, by increasing the Fe2O3 contents, the oxidized state can be adjusted to deeper red colors. The chroma of the color C* was calculated as follows:
The increase of Fe2O3 from 2% to 3.5% increases the C* value from 17 to 27, with a haze of 45°. On the other hand, the reduced state can be adjusted to darker blue colors by decreasing the Fe2O3 contents, increasing the chroma value from 6 to 14 at −1.8 V, along the −b* axis. Moreover, by varying the reduction potential, the tint of the dark blue can be finely tuned to adapt the desired color tint, as shown for the 3% in the inset of Figure 9d.
4. Conclusions
PEDOT-PSS films were successfully deposited using a bar coater with thickness ranging from 100 to 1100 nm. Careful investigation of the relationship between the PEDOT:PSS layer thickness and electrochromic performances of symmetrical devices, built by separating the PEDOT:PSS layer with lithium electrolyte membrane, identified an optimized thickness of approximatively 880 nm. Meanwhile, the thickness modulation led to a nice control of the bluish tint in the reduced state. Further achievement in tuning the color of the EC device was suggested by oxide addition. EC device based on the mixture of PEDOT:PSS and Fe2O3 opens up the color modulation from red to blue. In the field of applications, our approach is a promising route for tuning the color of products based on PEDOT:PSS-based ink commercially available in large scale.
Author Contributions
Investigation, D.L.; Methodology, D.L., I.M. and T.R.; Supervision, A.R.; Writing–original draft, D.L.
Funding
This activity included in the SUPERSMART project has received funding from the European Institute of Innovation and Technology (EIT). This body of the European Union receives support from the European Union’s Horizon 2020 research and innovation programme. D. Levasseur wishes to thank the financial support of Aquitaine Science Transfert.
Conflicts of Interest
The authors declare no conflict of interest.
Appendix A
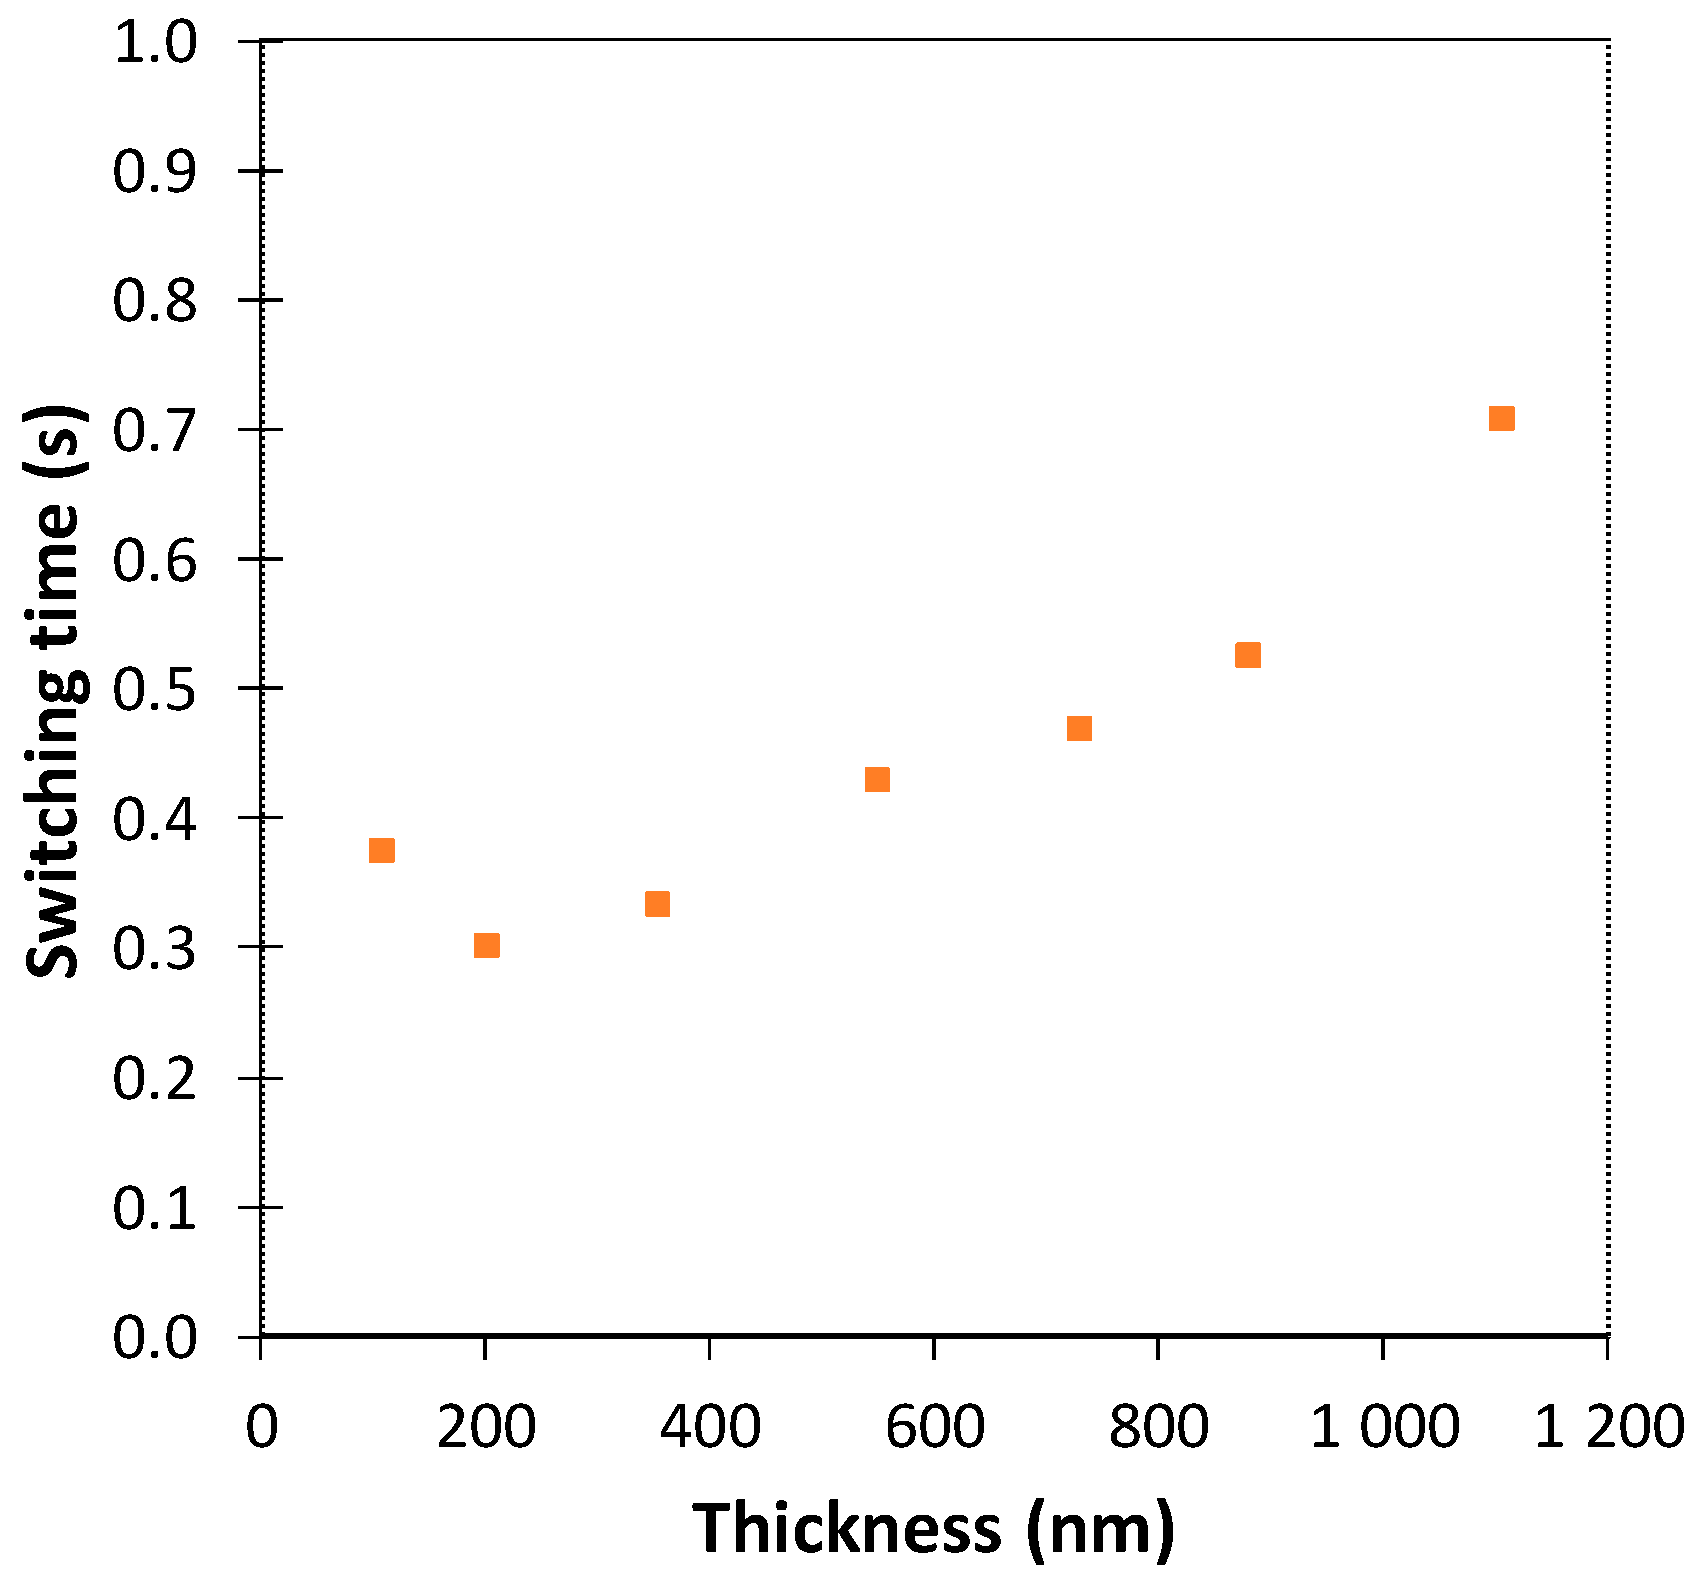
In order to quantify the switching time, current density versus time measurements showed in Figure 1b were used. We considered the current density peak maximum as ΔJmax and calculated the time necessary to reach 95% of the current drop. The corresponding current switching time as a function of thickness is presented in Figure A1.
Figure A1.
Current switching time as a function of PEDOT:PSS thickness in displays.
References
- Rauh, R.D.; Wang, F.; Reynolds, J.R.; Meeker, D.L. High coloration efficiency electrochromics and their application to multi-color devices. Electrochim. Acta 2001, 46, 2023–2029. [Google Scholar] [CrossRef]
- Granqvist, C.G. Oxide electrochromics: An introduction to devices and materials. Sol. Energy Mater. Sol. Cells 2012, 99, 1–13. [Google Scholar] [CrossRef]
- Granqvist, C.G.; Arvizu, M.A.; Qu, H.-Y.; Wen, R.-T.; Niklasson, G.A. Advances in electrochromic device technology: Multiple roads towards superior durability. Surf. Coat. Technol. 2019, 357, 619–625. [Google Scholar] [CrossRef]
- Invernale, M.A.; Ding, Y.; Sotzing, G.A. All-Organic Electrochromic Spandex. ACS Appl. Mater. Interfaces 2010, 2, 296–300. [Google Scholar] [CrossRef]
- Österholm, A.M.; Shen, D.E.; Kerszulis, J.A.; Bulloch, R.H.; Kuepfert, M.; Dyer, A.L.; Reynolds, J.R. Four Shades of Brown: Tuning of Electrochromic Polymer Blends Toward High-Contrast Eyewear. ACS Appl. Mater. Interfaces 2015, 7, 1413–1421. [Google Scholar] [CrossRef]
- Cai, G.; Eh, A.L.-S.; Ji, L.; Lee, P.S. Recent Advances in Electrochromic Smart Fenestration. Adv. Sustain. Syst. 2017, 1, 1700074. [Google Scholar] [CrossRef]
- Mjejri, I.; Manceriu, L.M.; Gaudon, M.; Rougier, A.; Sediri, F. Nano-vanadium pentoxide films for electrochromic displays. Solid State Ion. 2016, 292, 8–14. [Google Scholar] [CrossRef]
- Danine, A.; Cojocaru, L.; Faure, C.; Olivier, C.; Toupance, T.; Campet, G.; Rougier, A. Room Temperature UV treated WO3 thin films for electrochromic devices on paper substrate. Electrochim. Acta 2014, 129, 113–119. [Google Scholar] [CrossRef]
- Da Rocha, M.; He, Y.; Diao, X.; Rougier, A. Influence of cycling temperature on the electrochromic properties of WO 3//NiO devices built with various thicknesses. Sol. Energy Mater. Sol. Cells 2018, 177, 57–65. [Google Scholar] [CrossRef]
- Huang, L.-M.; Peng, C.-Y.; Hu, C.-W.; Lu, H.-C.; Chen, C.-H.; Yang, D.-J.; Kuo, C.-C.; Ho, K.-C. Spectroelectrochemical and adhesion properties of chemically synthesized ion conducting poly (vinyl butyral) in Prussian blue and poly (3,4-ethylenedioxythiophene) laminated electrochromic glazing. Sol. Energy Mater. Sol. Cells 2017, 171, 258–266. [Google Scholar] [CrossRef]
- Mortimer, R.J.; Dyer, A.L.; Reynolds, J.R. Electrochromic organic and polymeric materials for display applications. Displays 2006, 27, 2–18. [Google Scholar] [CrossRef] [Green Version]
- Maier, A.; Cheng, K.; Savych, J.; Tieke, B. Double-Electrochromic Coordination Polymer Network Films. ACS Appl. Mater. Interfaces 2011, 3, 2710–2718. [Google Scholar] [CrossRef] [PubMed]
- Österholm, A.M.; Shen, D.E.; Gottfried, D.S.; Reynolds, J.R. Full Color Control and High-Resolution Patterning from Inkjet Printable Cyan/Magenta/Yellow Colored-to-Colorless Electrochromic Polymer Inks. Adv. Mater. Technol. 2016, 1, 1600063. [Google Scholar] [CrossRef]
- Li, S.; Liu, G.; Ju, X.; Zhang, Y.; Zhao, J. Synthesis, Characterization and Application of Four Novel Electrochromic Materials Employing Nitrotriphenylamine Unit as the Acceptor and Different Thiophene Derivatives as the Donor. Polymers 2017, 9, 173. [Google Scholar] [CrossRef]
- He, J.; Mukherjee, S.; Zhu, X.; You, L.; Boudouris, B.W.; Mei, J. Highly Transparent Crosslinkable Radical Copolymer Thin Film as the Ion Storage Layer in Organic Electrochromic Devices. ACS Appl. Mater. Interfaces 2018, 10, 18956–18963. [Google Scholar] [CrossRef]
- Kuo, C.-W.; Wu, B.-W.; Chang, J.-K.; Chang, J.-C.; Lee, L.-T.; Wu, T.-Y.; Ho, T.-H. Electrochromic Devices Based on Poly(2,6-di(9H-carbazol-9-yl)pyridine)-Type Polymer Films and PEDOT-PSS. Polymers 2018, 10, 604. [Google Scholar] [CrossRef]
- Padilla, J.; Österholm, A.M.; Dyer, A.L.; Reynolds, J.R. Process controlled performance for soluble electrochromic polymers. Sol. Energy Mater. Sol. Cells 2015, 140, 54–60. [Google Scholar] [CrossRef]
- Andersson, P.; Forchheimer, R.; Tehrani, P.; Berggren, M. Printable All-Organic Electrochromic Active-Matrix Displays. Adv. Funct. Mater. 2007, 17, 3074–3082. [Google Scholar] [CrossRef]
- Shim, G.H.; Han, M.G.; Sharp-Norton, J.C.; Creager, S.E.; Foulger, S.H. Inkjet-printed electrochromic devices utilizing polyaniline–silica and poly(3,4-ethylenedioxythiophene)–silica colloidal composite particles. J. Mater. Chem. 2008, 18, 594–601. [Google Scholar] [CrossRef]
- Costa, C.; Pinheiro, C.; Henriques, I.; Laia, C.A.T. Inkjet Printing of Sol–Gel Synthesized Hydrated Tungsten Oxide Nanoparticles for Flexible Electrochromic Devices. ACS Appl. Mater. Interfaces 2012, 4, 1330–1340. [Google Scholar] [CrossRef]
- Shi, P.; Amb, C.M.; Dyer, A.L.; Reynolds, J.R. Fast Switching Water Processable Electrochromic Polymers. ACS Appl. Mater. Interfaces 2012, 4, 6512–6521. [Google Scholar] [CrossRef]
- Layani, M.; Darmawan, P.; Foo, W.L.; Liu, L.; Kamyshny, A.; Mandler, D.; Magdassi, S.; Lee, P.S. Nanostructured electrochromic films by inkjet printing on large area and flexible transparent silver electrodes. Nanoscale 2014, 6, 4572. [Google Scholar] [CrossRef] [PubMed]
- De Keersmaecker, M.; Lang, A.W.; Österholm, A.M.; Reynolds, J.R. All Polymer Solution Processed Electrochromic Devices: A Future without Indium Tin Oxide? ACS Appl. Mater. Interfaces 2018, 10, 31568–31579. [Google Scholar] [CrossRef]
- Sze, P.-W.; Lee, K.-W.; Huang, P.-C.; Chou, D.-W.; Kao, B.-S.; Huang, C.-J. The Investigation of High Quality PEDOT:PSS Film by Multilayer-Processing and Acid Treatment. Energies 2017, 10, 716. [Google Scholar] [CrossRef]
- Kawahara, J.; Ersman, P.A.; Engquist, I.; Berggren, M. Improving the color switch contrast in PEDOT:PSS-based electrochromic displays. Org. Electron. 2012, 13, 469–474. [Google Scholar] [CrossRef] [Green Version]
- Burke, L.D.; Lyons, M.E.G. The formation and stability of hydrous oxide films on iron under potential cycling conditions in aqueous solution at high pH. J. Electroanal. Chem. Interfacial Electrochem. 1986, 198, 347–368. [Google Scholar] [CrossRef]
- Gutiérrez, C.; Beden, B. UV-Visible differential reflectance spectroscopy of the electrochromic oxide layer on iron in 0.1 M NaOH. J. Electroanal. Chem. Interfacial Electrochem. 1990, 293, 253–259. [Google Scholar] [CrossRef]
- Campet, G.; Wen, S.J.; Han, S.D.; Shastry, M.C.R.; Portier, J.; Guizard, C.; Cot, L.; Xu, Y.; Salardenne, J. Reversible electrochemical insertion of lithium in fine-grained polycrystalline thin films of mixed-valency metal oxides: Application to Li_Fe203 thin film electrodes prepared by Film the sol-gel process. Mater. Sci. Eng. B 1993, 18, 201–208. [Google Scholar] [CrossRef]
- Orel, B.; Maček, M.; Švegl, F.; Kalcher, K. Electrochromism of iron oxide films prepared via the sol-gel route by the dip-coating technique. Thin Solids 1994, 246, 131–142. [Google Scholar] [CrossRef]
- Maruyama, T. Electrochromic Properties of Iron Oxide Thin Films Prepared by Chemical Vapor Deposition. J. Electrochem. Soc. 1996, 143, 1675. [Google Scholar] [CrossRef]
- Aegerter, M.A.; Avellaneda, C.O.; Pawlicka, A.; Atik, M. Electrochromism in materials prepared by the sol-gel process. J. Sol-Gel. Sci. Technol. 1997, 8, 689–696. [Google Scholar] [CrossRef]
- Garcia-Lobato, M.A.; Martinez, A.I.; Zarate, R.A.; Castro-Roman, M. New Insight into the Electrochromic Properties of Iron Oxides. Appl. Phys. Express 2010, 3, 115801. [Google Scholar] [CrossRef]
- Garcia-Lobato, M.A.; Martinez, A.I.; Perry, D.L.; Castro-Roman, M.; Zarate, R.A.; Escobar-Alarcon, L. Elucidation of the electrochromic mechanism of nanostructured iron oxides films. Sol. Energy Mater. Sol. Cells 2011, 95, 751–758. [Google Scholar] [CrossRef]
Figure 1.
(a) Cyclic voltammograms of the electrochromic symmetrical displays built from PEDOT:PSS thin films with varying thickness from 109 nm to 1106 nm, (b) chronoamperograms (CA) of the electrochromic symmetrical displays built from different PEDOT:PSS thicknesses. Potentials of +1.6 V and −1.6 V were applied for 30 s alternatively.

Figure 2.
Photographs of the electrochromic symmetrical displays built from PEDOT:PSS films with different thicknesses, showing an oxidized state for a potential of +1.6 V and a reduced (colored) state for a potential of −1.6 V. The corresponding measured L*a*b* parameters are mentioned at the top and bottom of the image for the oxidized (bleached) state and the neutral (colored) state, respectively.
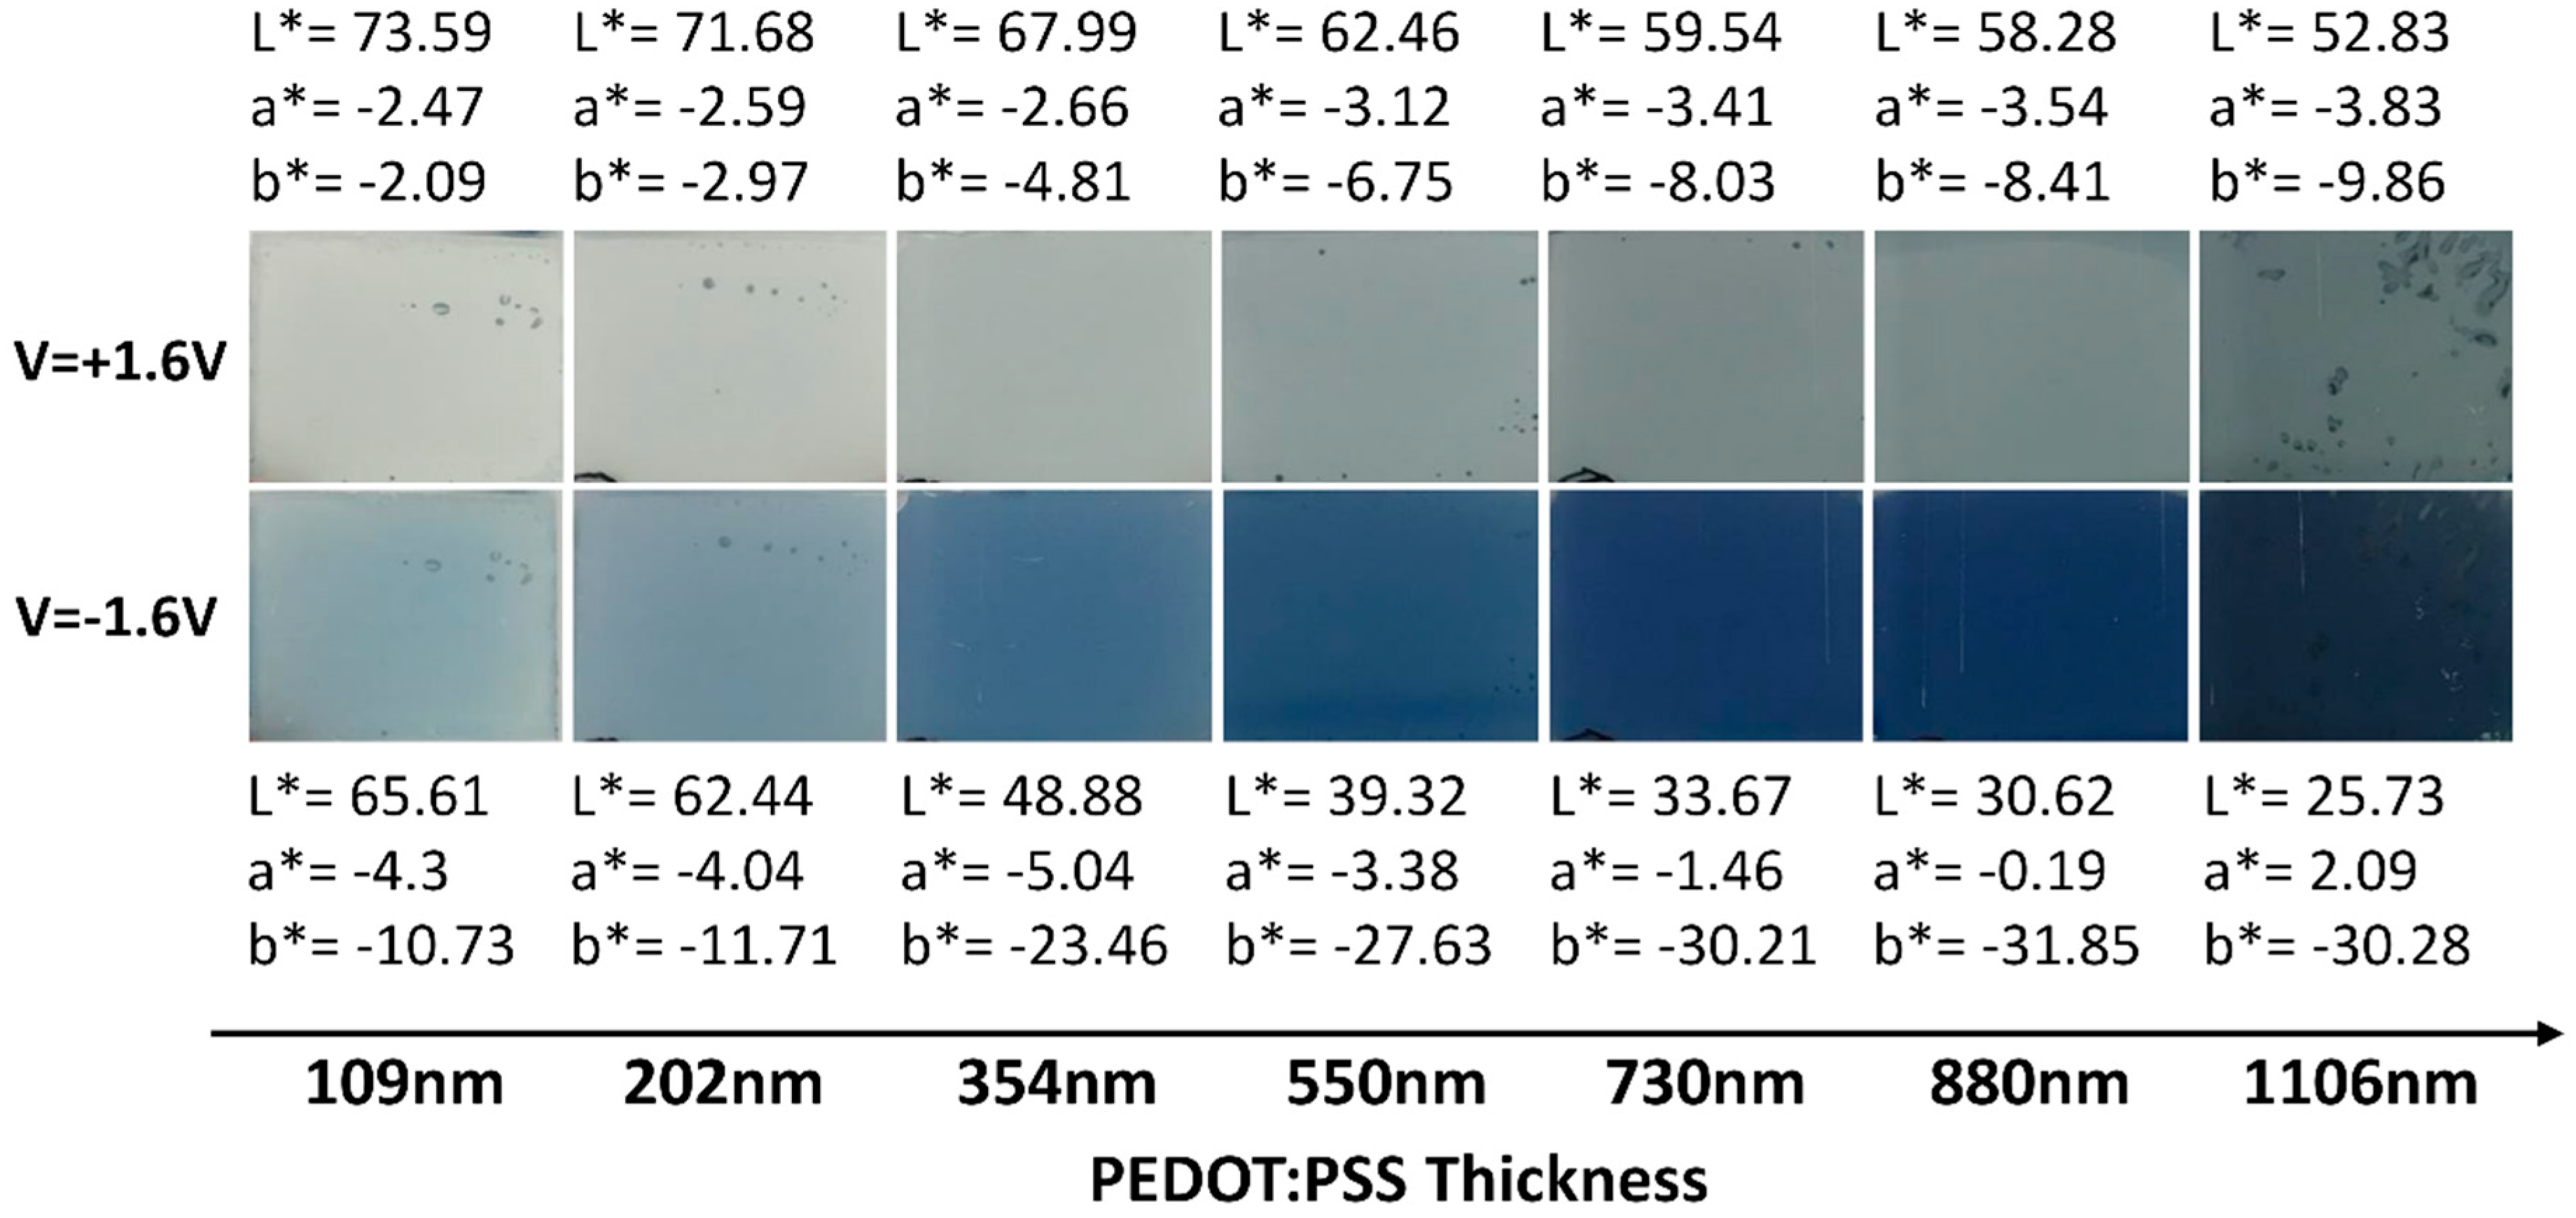
Figure 3.
(a) Color contrast as a function of the chronoamperometry cycles of electrochromic displays built from PEDOT:PSS thin films with varying thickness from 109 nm to 1106 nm, (b) color contrast as a function of PEDOT:PSS thickness, after 10 cycles of chronoamperometry. For both graphs, applied potentials were +1.6 V for 20 s, and 1.6 V for 20 s.
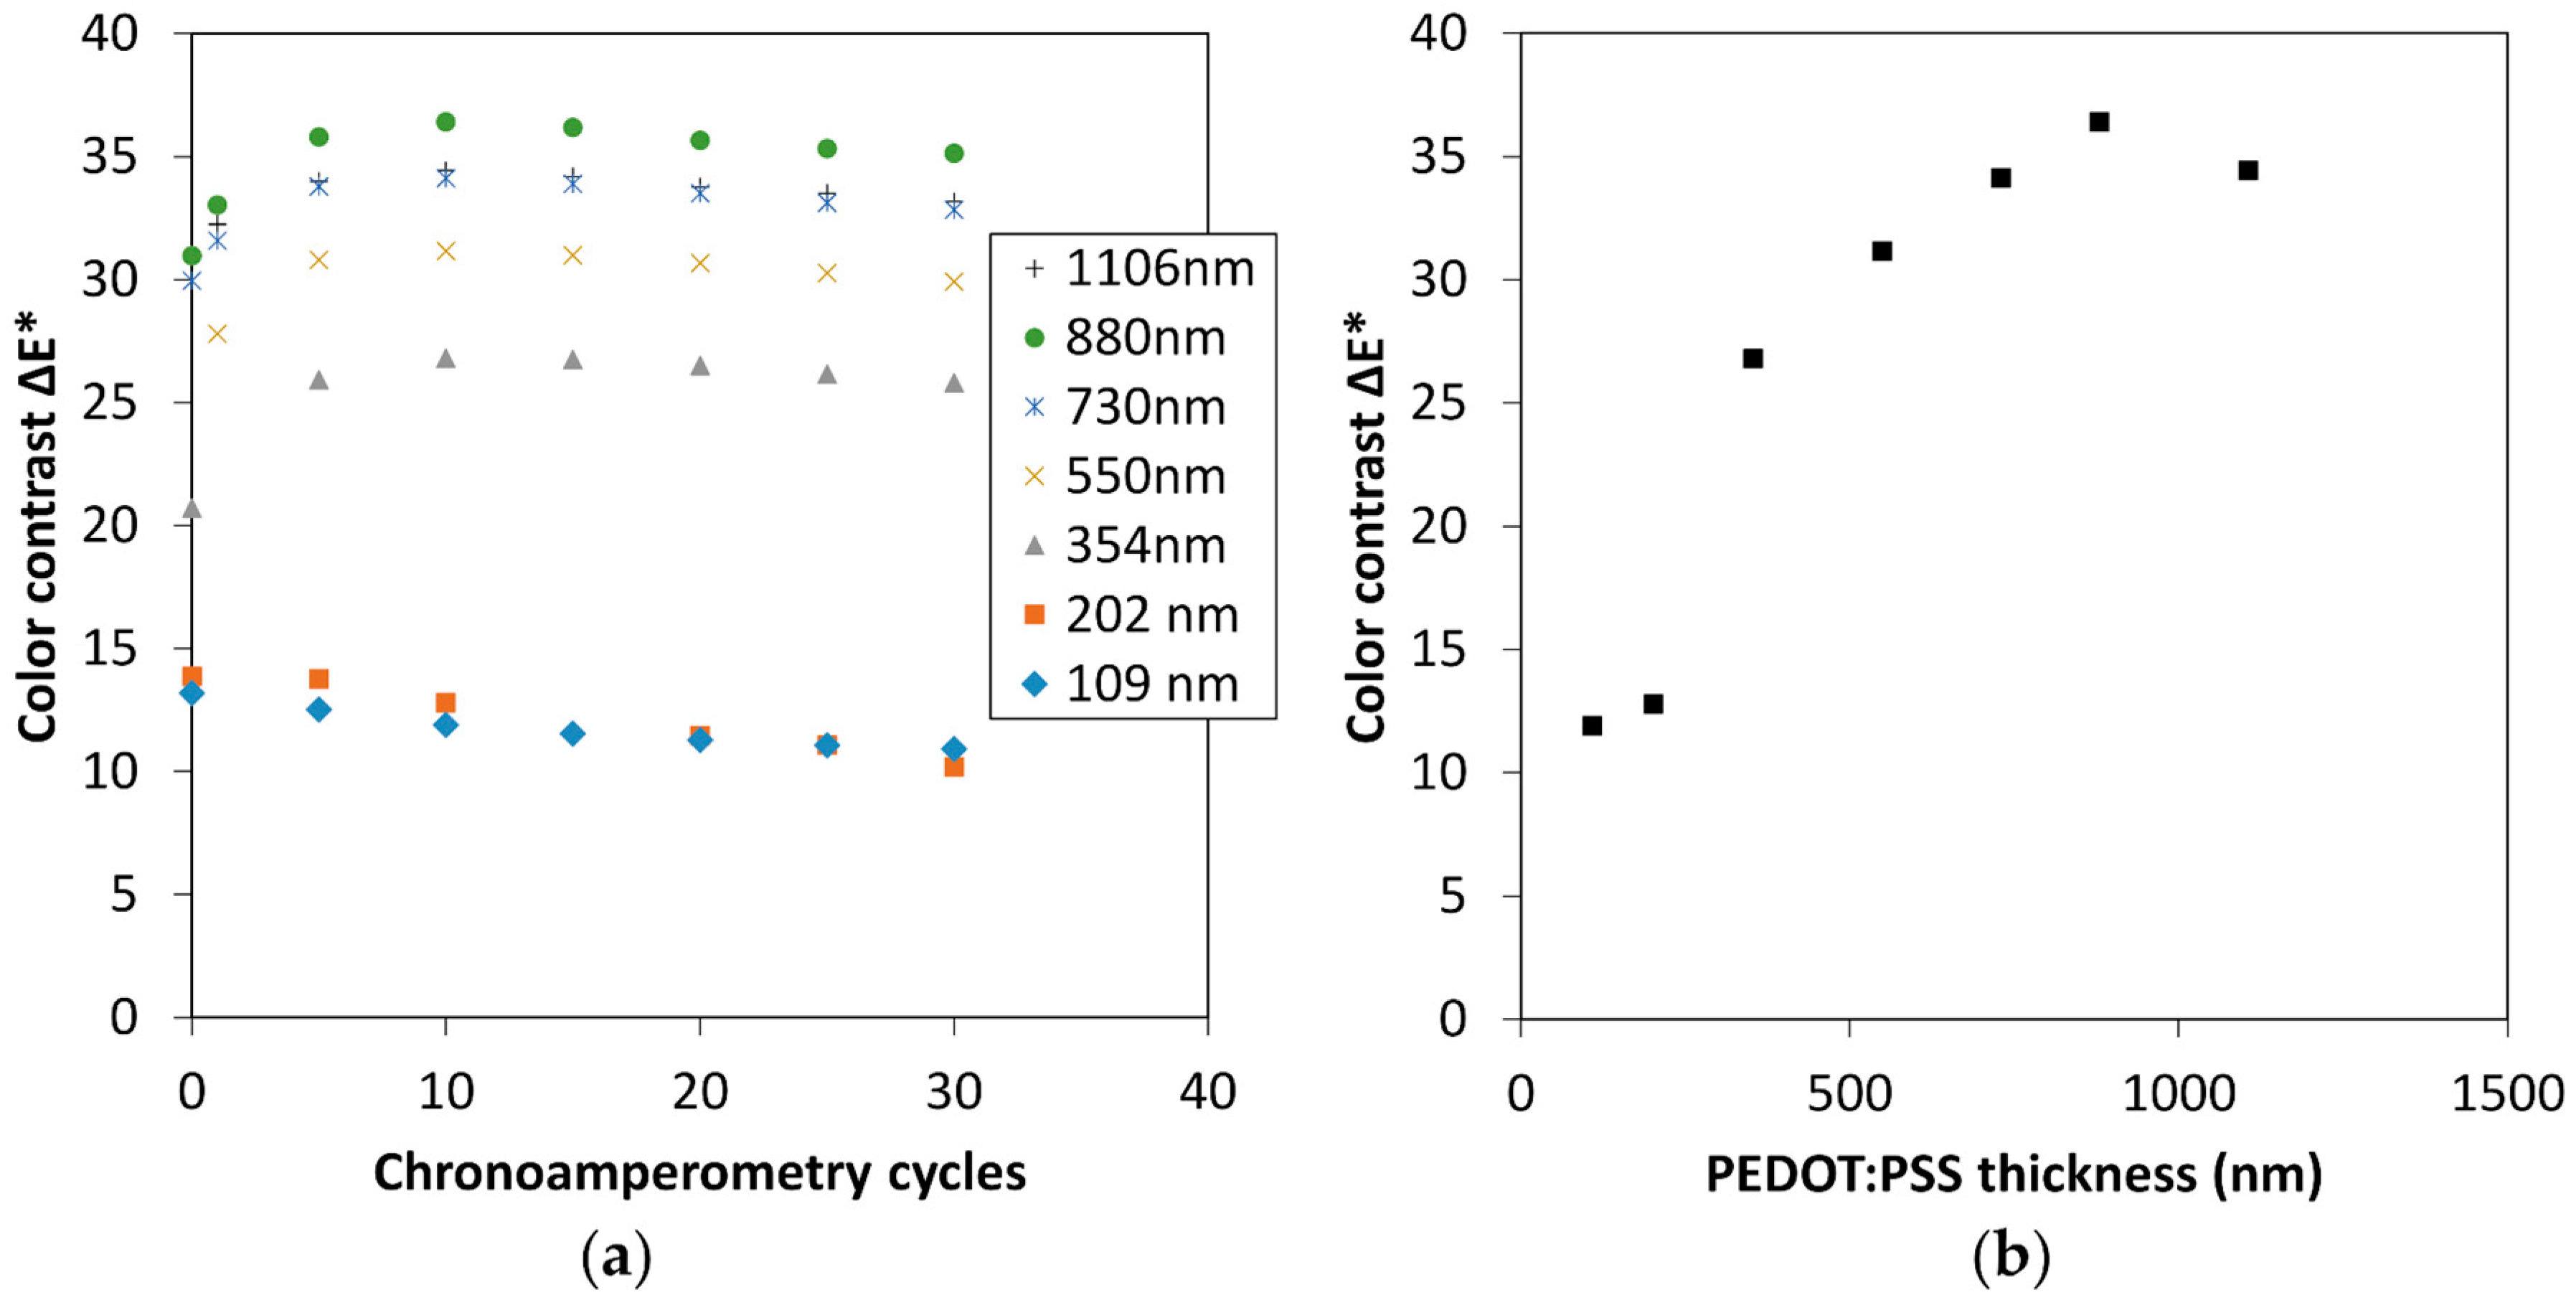
Figure 4.
(a) Chronoamperograms in a three-electrode cell configuration at −1.3 V for 20 s and +1.3 V for 20 s of the PEDOT:PSS layer at the optimized thickness of 880 nm, (b) corresponding optical transmittance spectra at oxidized and reduced states of PEDOT:PSS layer at the optimized thickness of 880 nm (the pictures of the thin films during the test are presented in the inset).
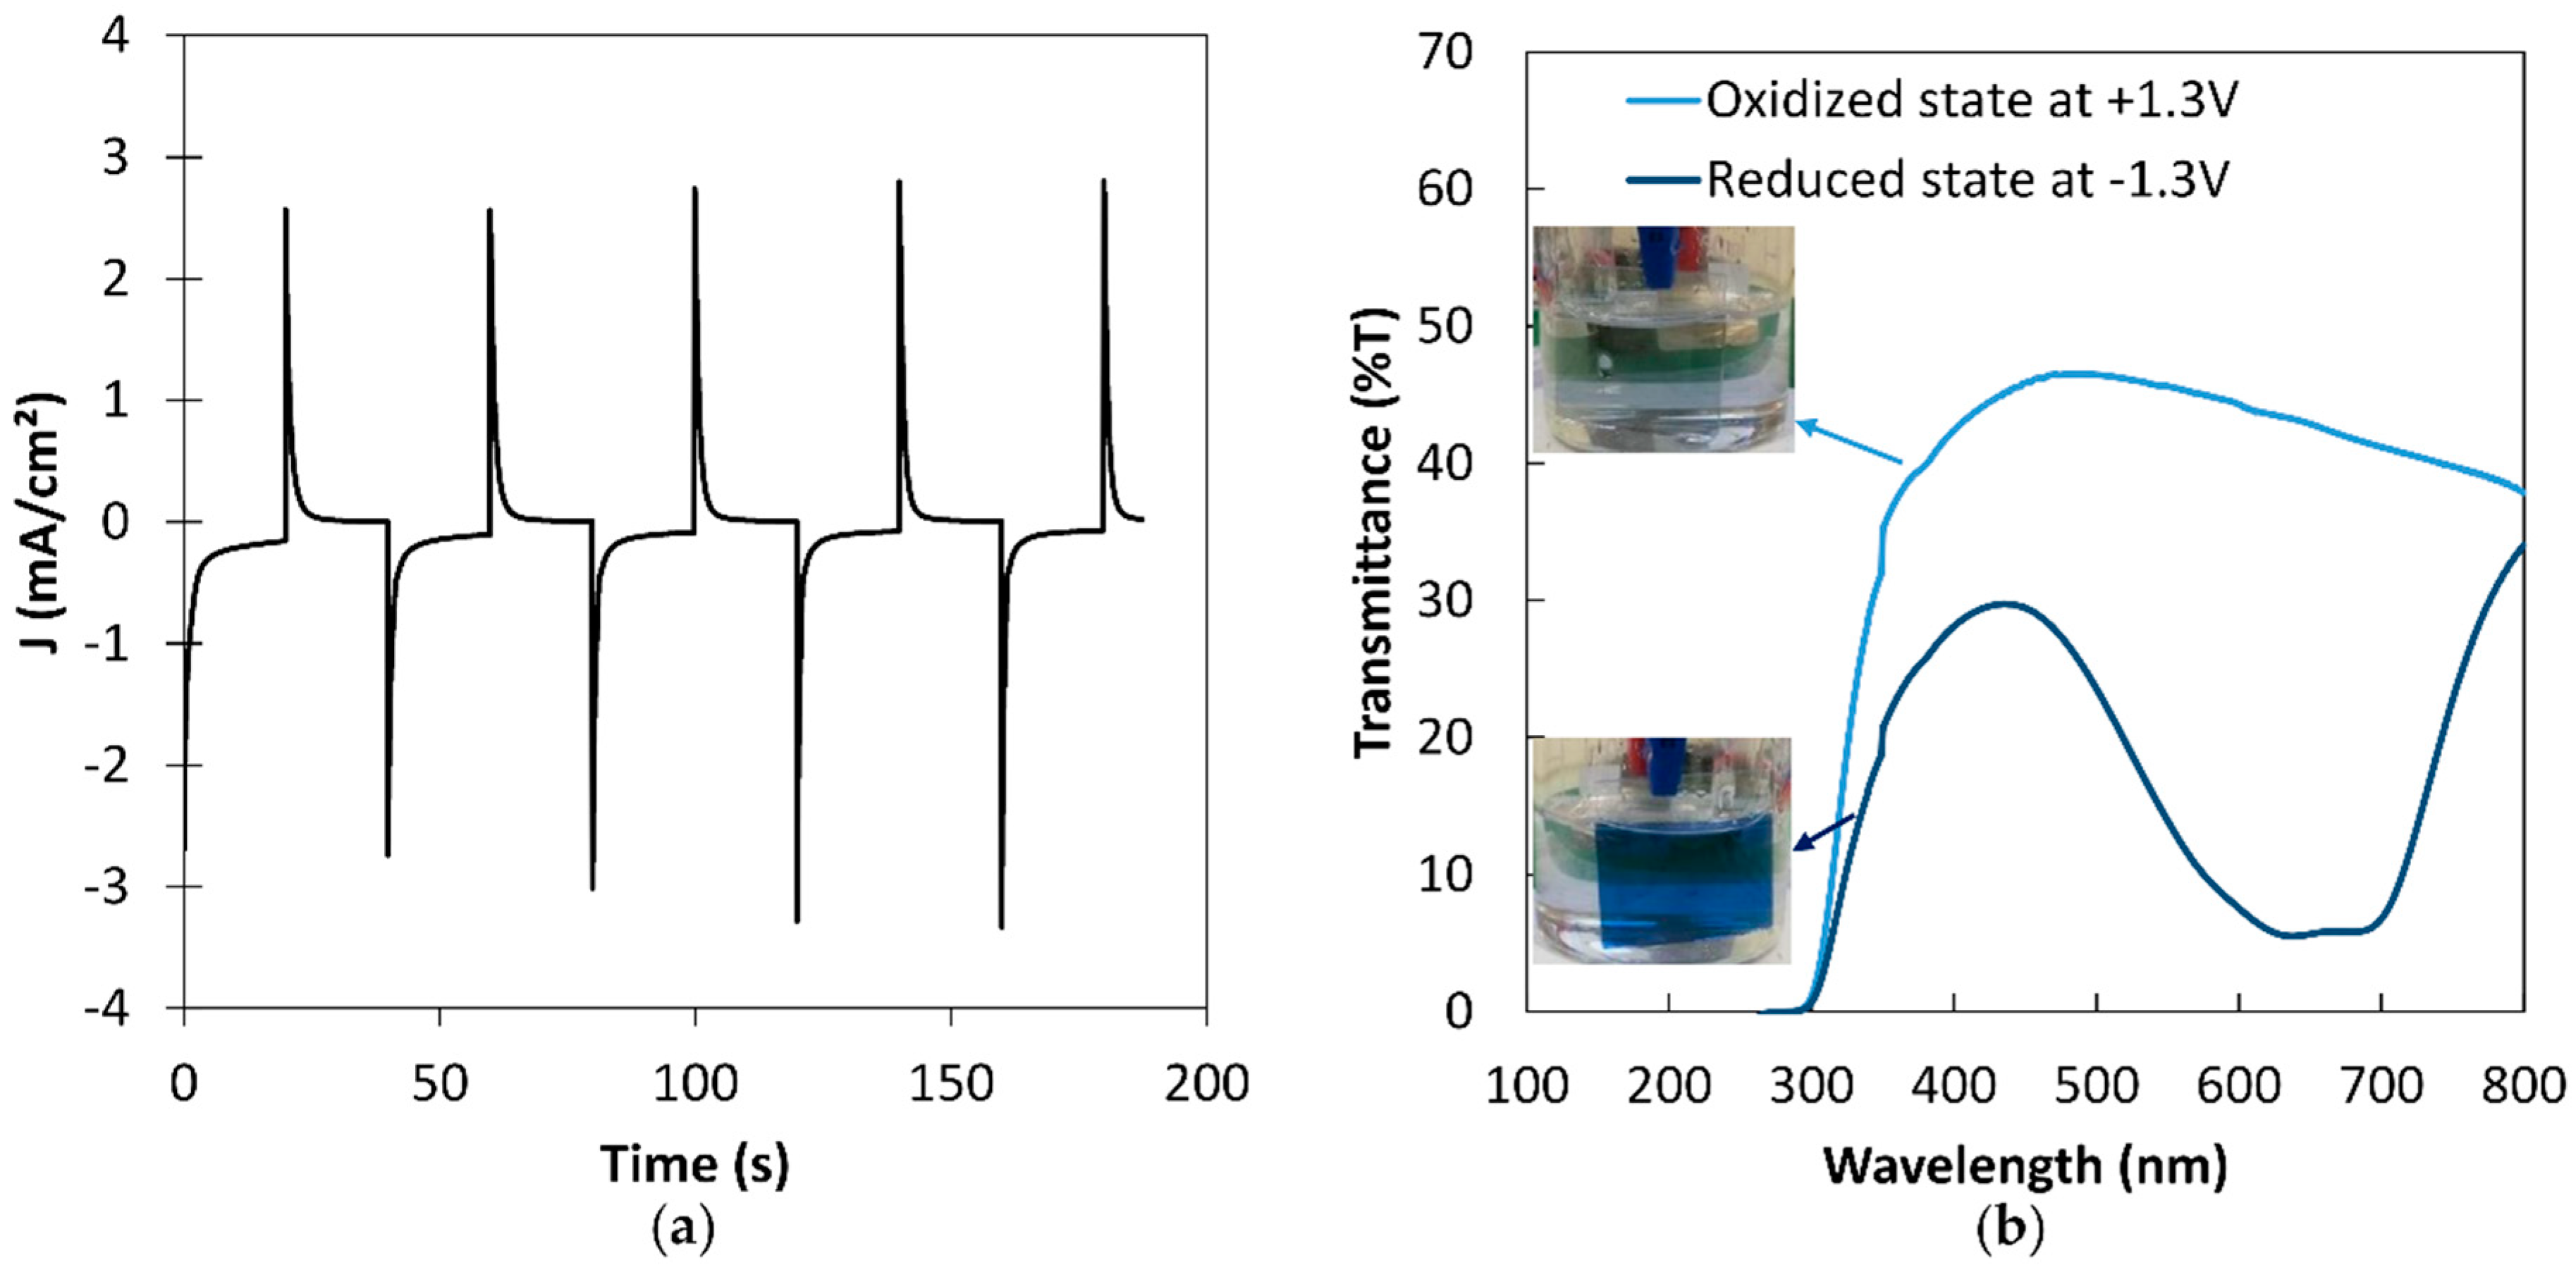
Figure 5.
Color contrast ΔE* as a function of the number of chronoamperometry cycles, measured on an electrochromic symmetrical display built from 880 nm PEDOT:PSS thick film.
Figure 5.
Color contrast ΔE* as a function of the number of chronoamperometry cycles, measured on an electrochromic symmetrical display built from 880 nm PEDOT:PSS thick film.
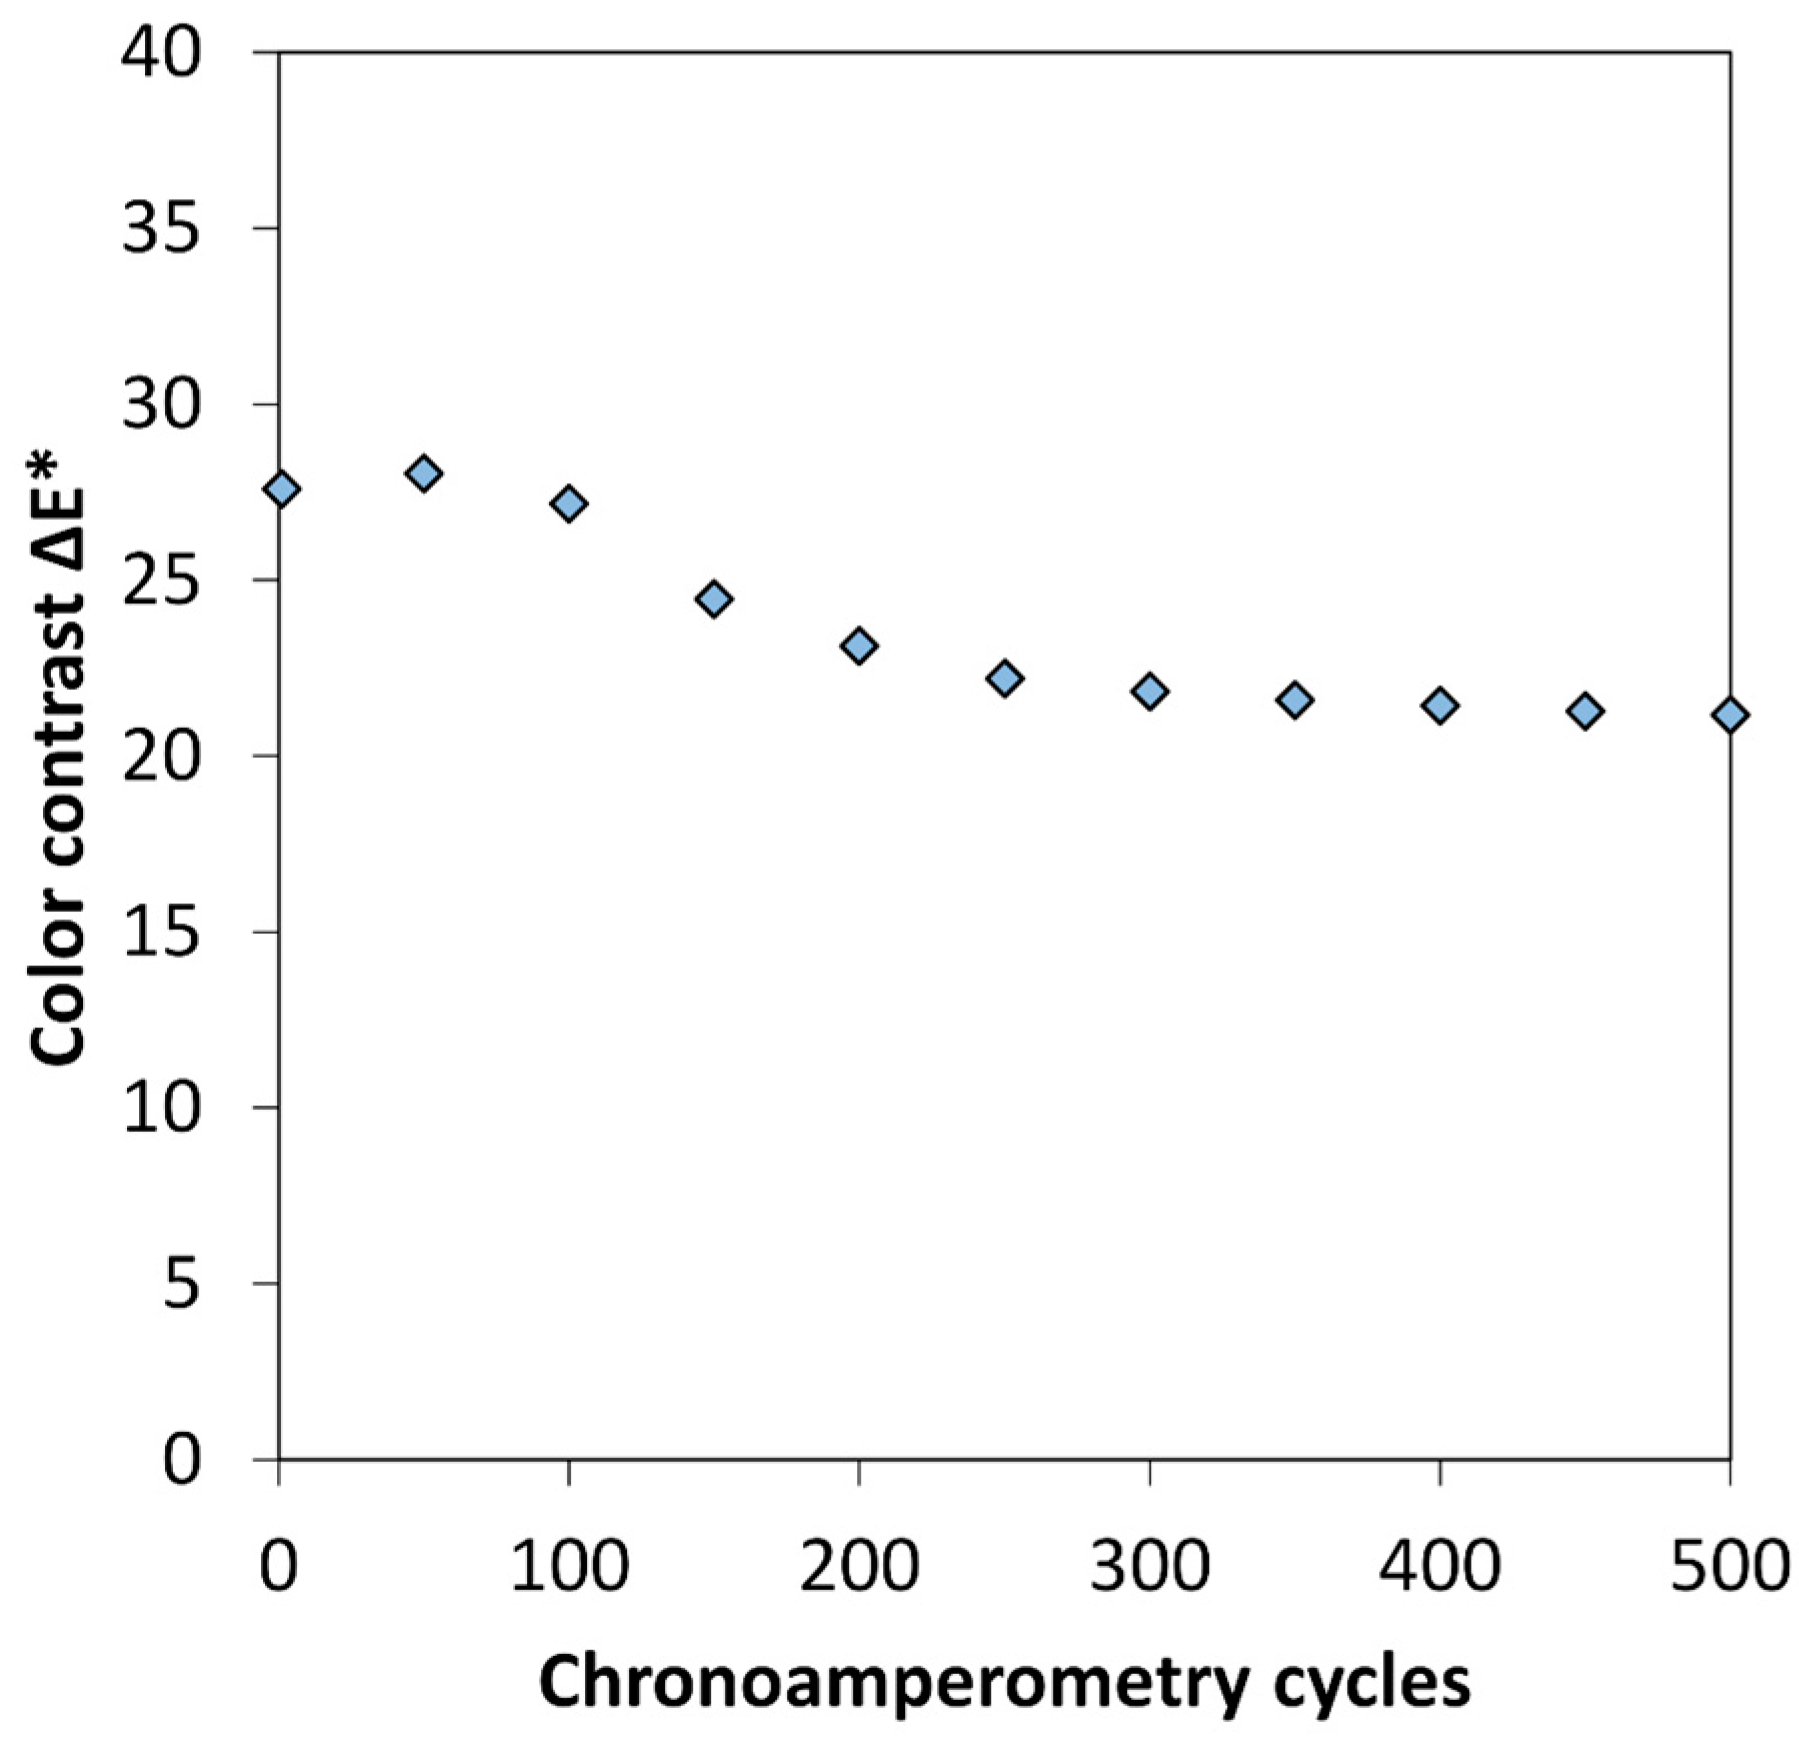
Figure 6.
XRD pattern of the Fe2O3 pigment. The red crosses indicate α-Fe2O3 structure diffraction peaks (space group R-3C).
Figure 6.
XRD pattern of the Fe2O3 pigment. The red crosses indicate α-Fe2O3 structure diffraction peaks (space group R-3C).
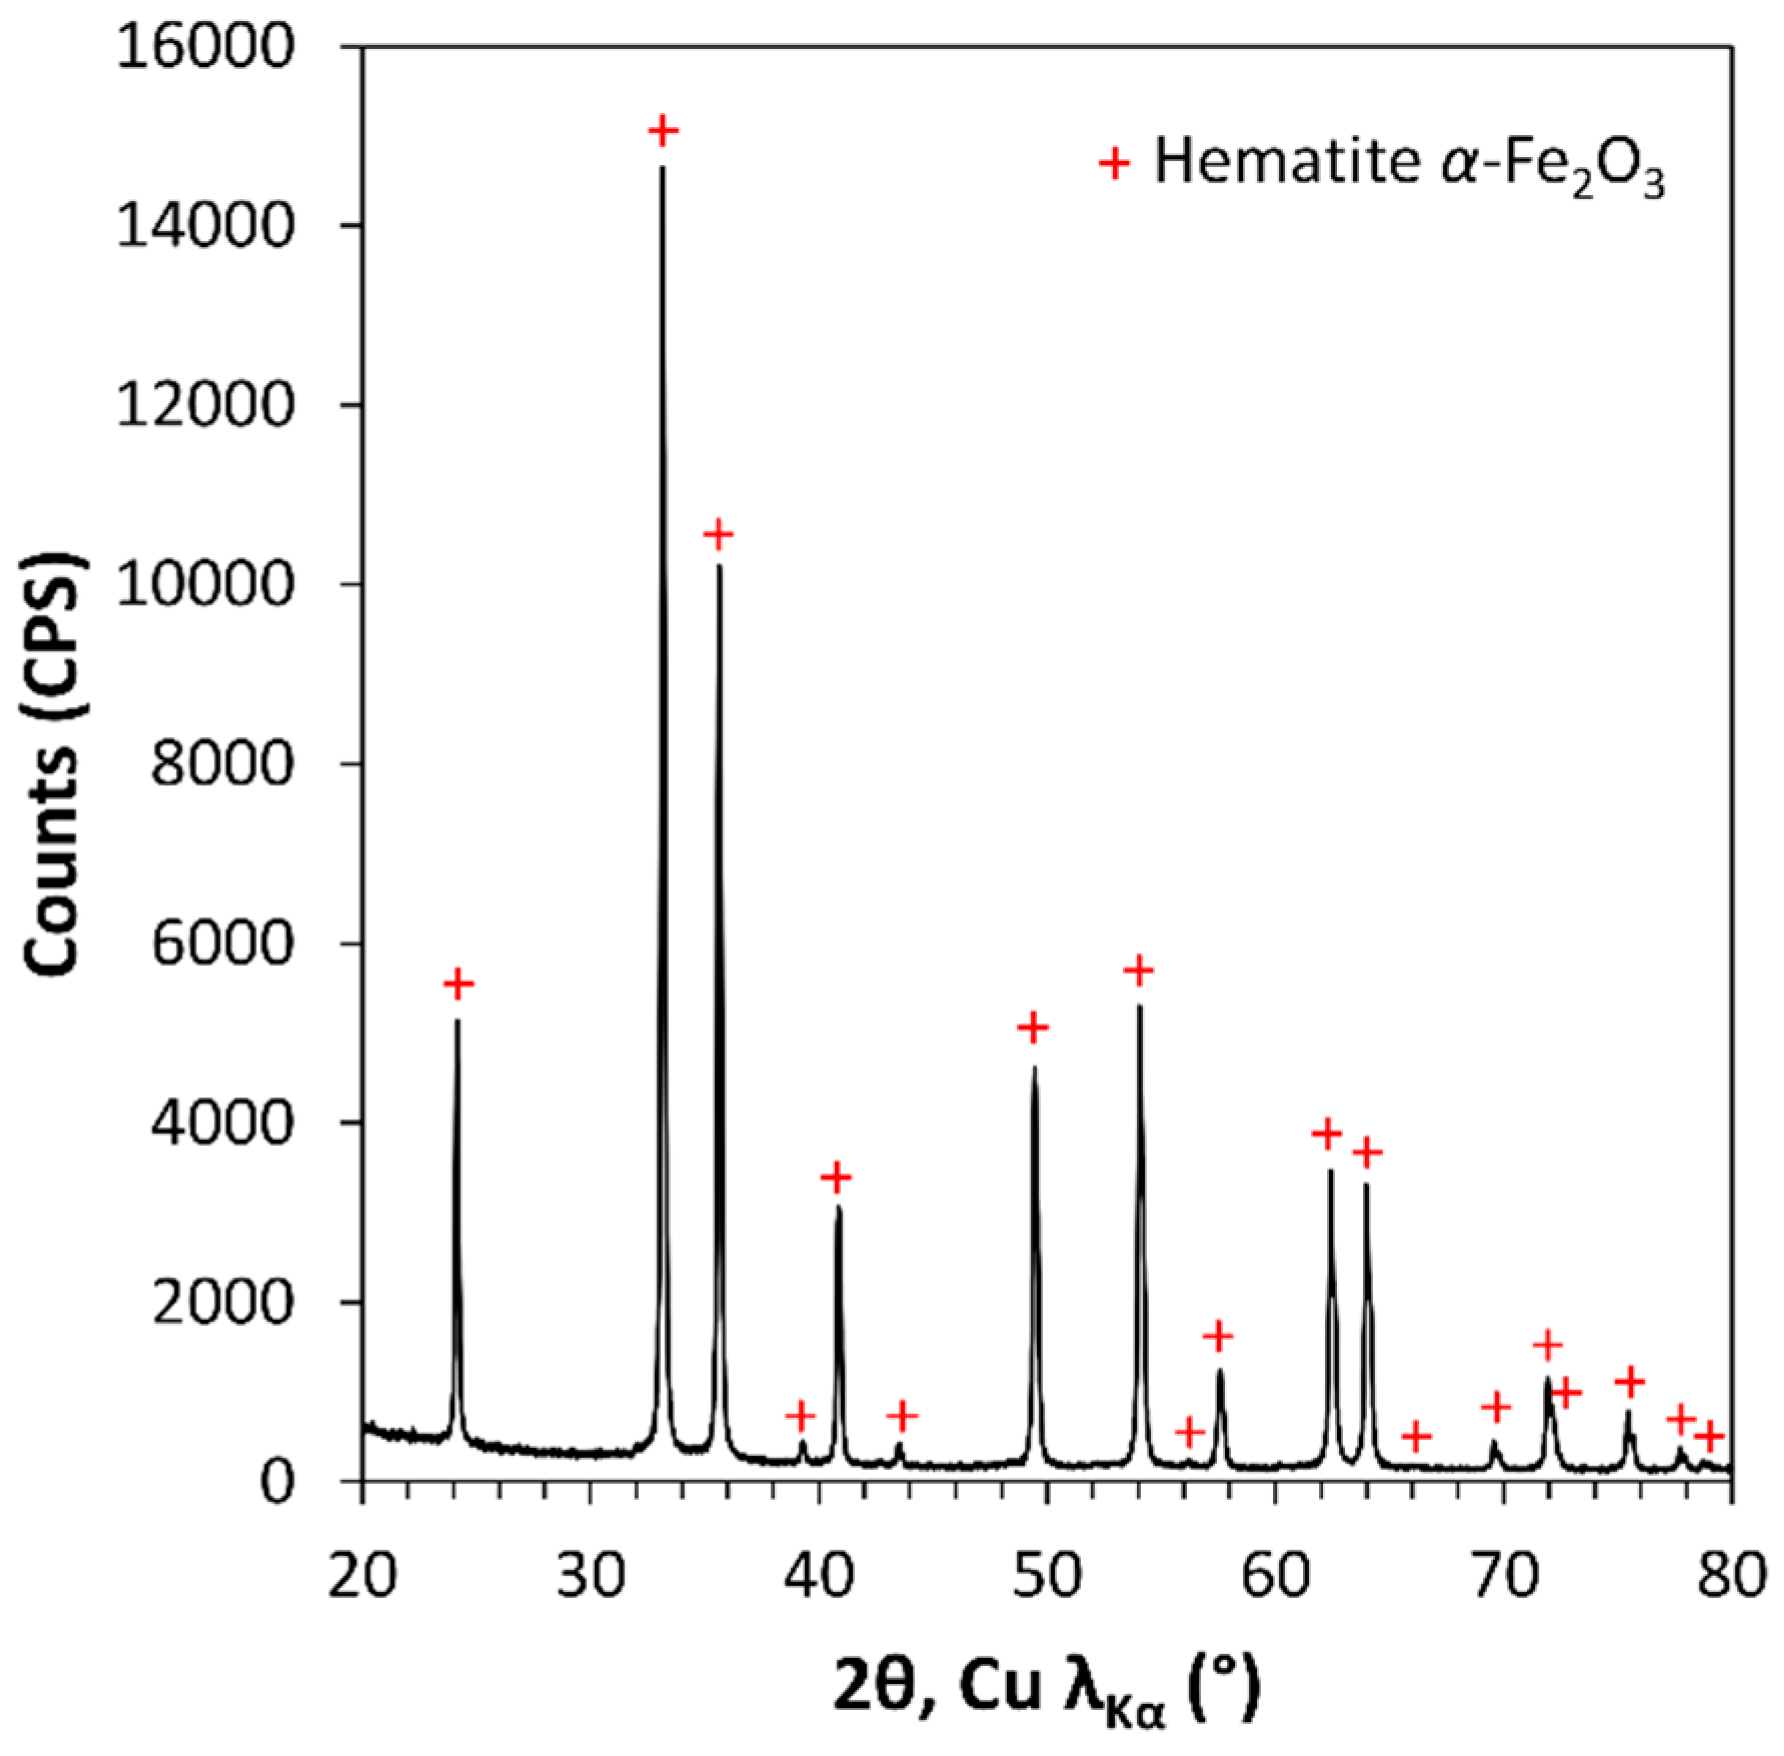
Figure 7.
Top view SEM images of the surface morphology of two films. On the left, PEDOT:PSS film with an average thickness of 550 nm; on the right, PEDOT:PSS + 2.5% of Fe2O3 film with an average thickness of 814 nm. Both films were deposited using the same wirebar (i.e., bar n°5, wet thickness 50 µm).

Figure 8.
(a) Cyclic voltammograms (2nd cycle) of the electrochromic displays obtained from PEDOT-PSS + x Fe2O3 thin film with varying x from 2 wt % to 3.5 wt % compared to PEDOT:PSS without Fe2O3, (b) cyclic voltammograms of the electrochromic displays with PEDOT:PSS +2.5% Fe2O3 at different potential ranges.

Figure 9.
This figure shows the tuning of the L*a*b* parameters by adjusting the Fe2O3 content or the reduction voltage. (a) Image of the oxidized and reduced state of a 98%PEDOT:PSS/2%Fe2O3 thin layer and display, changing from red to blue color. (b) L* parameter as a function of the reduction voltage for different Fe2O3 contents. (c) Tuning of a*b* parameters by increasing Fe2O3 content for oxidized state at 1.6 V and reduced state at −1.8 V (d); inset shows the tuning of the blue shade by varying the reduction voltage.
© 2019 by the authors. Licensee MDPI, Basel, Switzerland. This article is an open access article distributed under the terms and conditions of the Creative Commons Attribution (CC BY) license (http://creativecommons.org/licenses/by/4.0/).
Share and Cite
MDPI and ACS Style
Levasseur, D.; Mjejri, I.; Rolland, T.; Rougier, A. Color Tuning by Oxide Addition in PEDOT:PSS-Based Electrochromic Devices. Polymers 2019, 11, 179. https://doi.org/10.3390/polym11010179
AMA Style
Levasseur D, Mjejri I, Rolland T, Rougier A. Color Tuning by Oxide Addition in PEDOT:PSS-Based Electrochromic Devices. Polymers. 2019; 11(1):179. https://doi.org/10.3390/polym11010179
Chicago/Turabian StyleLevasseur, Delphin, Issam Mjejri, Thomas Rolland, and Aline Rougier. 2019. "Color Tuning by Oxide Addition in PEDOT:PSS-Based Electrochromic Devices" Polymers 11, no. 1: 179. https://doi.org/10.3390/polym11010179
Note that from the first issue of 2016, this journal uses article numbers instead of page numbers. See further details here.