Melt-Mixed PP/MWCNT Composites: Influence of CNT Incorporation Strategy and Matrix Viscosity on Filler Dispersion and Electrical Resistivity


Abstract
:
1. Introduction
2. Materials and Methods
3. Results
4. Conclusions
Author Contributions
Funding
Conflicts of Interest
References
- Breuer, O.; Sundararaj, U. Big returns from small fibers: A review of polymer/carbon nanotube composites. Polym. Compos. 2004, 25, 630–645. [Google Scholar] [CrossRef]
- Vaisman, L.; Marom, G.; Wagner, H.D. Dispersions of surface-modified carbon nanotubes in water-soluble and water-insoluble polymers. Adv. Funct. Mater. 2006, 16, 357–363. [Google Scholar] [CrossRef]
- Coleman, J.N.; Khan, U.; Blau, W.J.; Gun’ko, Y.K. Small but strong: A review of the mechanical properties of carbon nanotube-polymer composites. Carbon 2006, 44, 1624–1652. [Google Scholar] [CrossRef]
- Li, J.; Ma, P.C.; Chow, W.S.; To, C.K.; Tang, B.Z.; Kim, J.K. Correlations between percolation threshold, dispersion state, and aspect ratio of carbon nanotubes. Adv. Funct. Mater. 2007, 17, 3207–3215. [Google Scholar] [CrossRef]
- McClory, C.; Chin, S.J.; McNally, T. Polymer/carbon nanotube composites. Aust. J. Chem. 2009, 62, 762–785. [Google Scholar] [CrossRef]
- Bauhofer, W.; Kovacs, J.Z. A review and analysis of electrical percolation in carbon nanotube polymer composites. Compos. Sci. Technol. 2009, 69, 1486–1498. [Google Scholar] [CrossRef] [Green Version]
- Villmow, T.; Kretzschmar, B.; Pötschke, P. Influence of screw configuration, residence time, and specific mechanical energy in twin-screw extrusion of polycaprolactone/multi-walled carbon nanotube composites. Compos. Sci. Technol. 2010, 70, 2045–2055. [Google Scholar] [CrossRef] [Green Version]
- Ma, P.-C.; Siddiqui, N.A.; Marom, G.; Kim, J.-K. Dispersion and functionalization of carbon nanotubes for polymer-based nanocomposites: A review. Compos. Part A Appl. Sci. Manuf. 2010, 41, 1345–1367. [Google Scholar] [CrossRef]
- Noll, A.; Burkhart, T. Morphological characterization and modelling of electrical conductivity of multi-walled carbon nanotube/poly(p-phenylene sulfide) nanocomposites obtained by twin screw extrusion. Compos. Sci. Technol. 2011, 71, 499–505. [Google Scholar] [CrossRef] [Green Version]
- Kasaliwal, G.R.; Villmow, T.; Pegel, S.; Pötschke, P. Influence of material and processing parameters on carbon nanotube dispersion in polymer melts. In Polymer-Carbon Nanotube Composites: Preparation, Porperties and Applications; McNally, T., Pötschke, P., Eds.; Woodhead Publishing: Oxford, UK, 2011; pp. 92–132. [Google Scholar]
- Krause, B.; Mende, M.; Petzold, G.; Boldt, R.; Pötschke, P. Characterization of dispersability of industrial nanotube materials and their length distribution before and after melt processing. In Carbon Nanotube-Polymer Composites; Tasis, D., Ed.; Royal Society of Chemistry: Cambridge, UK, 2013; pp. 212–233. [Google Scholar]
- Skipa, T.; Lellinger, D.; Saphiannikova, M.; Alig, I. Shear-stimulated formation of multi-wall carbon nanotube networks in polymer melts. Phys. Status Solidi B 2009, 246, 2453–2456. [Google Scholar] [CrossRef]
- Alig, I.; Skipa, T.; Lellinger, D.; Bierdel, M.; Meyer, H. Dynamic percolation of carbon nanotube agglomerates in a polymer matrix: Comparison of different model approaches. Phys. Status Solidi B. 2008, 245, 2264–2267. [Google Scholar] [CrossRef]
- Alig, I.; Pötschke, P.; Lellinger, D.; Skipa, T.; Pegel, S.; Kasaliwal, G.R.; Villmow, T. Establishment, morphology and properties of carbon nanotube networks in polymer melts. Polymer 2012, 53, 4–28. [Google Scholar] [CrossRef] [Green Version]
- Cruz, H.; Son, Y. Effect of aspect ratio on electrical, rheological and glass transition properties of PC/MWCNT nanocomposites. J. Nanosci. Nanotechnol. 2018, 18, 943–950. [Google Scholar] [CrossRef]
- Pegel, S.; Villmow, T.; Kasaliwal, G.R.; Pötschke, P. Polymer-carbon nanotubes composites: Melt processing, properties and applications. In Synthetic Polymer-Polymer Composites; Bhattacharyya, D., Fakirov, S., Eds.; Carl Hanser Verlag: München, Germany, 2012; pp. 145–192. [Google Scholar]
- Krause, B.; Pötschke, P.; Häußler, L. Influence of small scale melt mixing conditions on electrical resistivity of carbon nanotube-polyamide composites. Compos. Sci. Technol. 2009, 69, 1505–1515. [Google Scholar] [CrossRef]
- Kasaliwal, G.R.; Pegel, S.; Göldel, A.; Pötschke, P.; Heinrich, G. Analysis of agglomerate dispersion mechanisms of multiwalled carbon nanotubes during melt mixing in polycarbonate. Polymer 2010, 51, 2708–2720. [Google Scholar] [CrossRef]
- Krause, B.; Mende, M.; Petzold, G.; Boldt, R.; Pötschke, P. Methoden zur Charakterisierung der Dispergierbarkeit und Längenanalyse von Carbon Nanotubes /methods to characterize the dispersability of carbon nanotubes and their length distribution. Chem. Ing. Tech. 2012, 84, 263–271. [Google Scholar] [CrossRef]
- Pötschke, P.; Villmow, T.; Krause, B. Melt mixed PCL/MWCNT composites prepared at different rotation speeds: Characterization of rheological, thermal, and electrical properties, molecular weight, MWCNT macrodispersion, and MWCNT length distribution. Polymer 2013, 54, 3071–3078. [Google Scholar] [CrossRef]
- Sathyanarayana, S.; Olowojoba, G.; Weiss, P.; Caglar, B.; Pataki, B.; Mikonsaari, I.; Hübner, C.; Henning, F. Compounding of MWCNTs with PS in a twin-screw extruder with varying process parameters: Morphology, interfacial behavior, thermal stability, rheology, and volume resistivity. Macromol. Mater. Eng. 2012, 298, 89–105. [Google Scholar] [CrossRef]
- Mičušík, M.; Omastová, M.; Krupa, I.; Prokes, J.; Pissis, P.; Logakis, E.; Pandis, C.; Pötschke, P.; Pionteck, J. A comparative study on the electrical and mechanical behaviour of multi-walled carbon nanotube composites prepared by diluting a masterbatch with various types of polypropylenes. J. Appl. Polym. Sci. 2009, 113, 2536–2551. [Google Scholar] [CrossRef]
- Besco, S.; Lorenzetti, A.; Hrelja, D.; Boaretti, C.; Roso, M.; Ferri, D.; Modesti, M. Influence of melt viscosity on the structure and properties of electrically conductive nanocomposites produced by masterbatch process. Macromol. Mater. Eng. 2014, 299, 814–824. [Google Scholar] [CrossRef]
- Müller, M.T.; Krause, B.; Kretzschmar, B.; Pötschke, P. Influence of a supplemental filler in twin-screw extruded PP/CNT composites using masterbatch dilution. AIP Conf. Proc. 2018, 2055, 090006. [Google Scholar]
- Chen, L.; Qu, M.-Z.; Zhou, G.-M.; Zhang, B.-L.; Yu, Z.-L. PC-mediated shortening of carbon nanotubes. Mater. Lett. 2004, 58, 3737–3740. [Google Scholar] [CrossRef]
- Ahn, J.H.; Shin, H.S.; Kim, Y.J.; Chung, H. Structural modification of carbon nanotubes by various ball milling. J. Alloys Compd. 2007, 434–435, 428–432. [Google Scholar] [CrossRef]
- Smart, S.K.; Ren, W.C.; Cheng, H.M.; Lu, G.Q.; Martin, D.J. Shortened double-walled carbon nanotubes by high-energy ball milling. Int. J. Nanotechnol. 2007, 4, 618–633. [Google Scholar] [CrossRef]
- Park, K.C.; Fujishige, M.; Takeuchi, K.; Arai, S.; Morimoto, S.; Endo, M. Inter-collisional cutting of multi-walled carbon nanotubes by high-speed agitation. J. Phys. Chem. Solids 2008, 69, 2481–2486. [Google Scholar] [CrossRef] [Green Version]
- Sun, Y.F.; Zhang, A.M.; Yin, Y.; Dong, Y.M.; Cui, Y.C.; Zhang, X.; Hong, J.M. The investigation of adsorptive performance on modified multi-walled carbon nanotubes by mechanical ball milling. Mater. Chem. Phys. 2007, 101, 30–34. [Google Scholar] [CrossRef]
- Krause, B.; Villmow, T.; Boldt, R.; Mende, M.; Petzold, G.; Pötschke, P. Influence of dry grinding in a ball mill on the length of multiwalled carbon nanotubes and their dispersion and percolation behaviour in melt mixed polycarbonate composites. Compos. Sci. Technol. 2011, 71, 1145–1153. [Google Scholar] [CrossRef] [Green Version]
- Chen, S.J.; Zou, B.; Collins, F.; Zhao, X.L.; Majumber, M.; Duan, W.H. Predicting the influence of ultrasonication energy on the reinforcing efficiency of carbon nanotubes. Carbon 2014, 77, 1–10. [Google Scholar] [CrossRef]
- Fuge, R.; Liebscher, M.; Schröfl, C.; Oswald, S.; Leonhardt, A.; Büchner, B.; Mechtcherine, V. Fragmentation characteristics of undoped and nitrogen-doped multiwalled carbon nanotubes in aqueous dispersion in dependence on the ultrasonication parameters. Diam. Relat. Mater. 2016, 66, 126–134. [Google Scholar] [CrossRef]
- Liu, Z.Y.; Xiao, B.L.; Wang, W.G.; Ma, Z.Y. Analysis of carbon nanotube shortening and composite strengthening in carbon nanotube/aluminum composites fabricated by multi-pass friction stir processing. Carbon 2014, 69, 264–274. [Google Scholar] [CrossRef]
- Krause, B.; Boldt, R.; Pötschke, P. A method for determination of length distributions of multiwalled carbon nanotubes before and after melt processing. Carbon 2011, 49, 1243–1247. [Google Scholar] [CrossRef]
- Socher, R.; Krause, B.; Müller, M.T.; Boldt, R.; Pötschke, P. The influence of matrix viscosity on MWCNT dispersion and electrical properties in different thermoplastic nanocomposites. Polymer 2012, 53, 495–504. [Google Scholar] [CrossRef]
- Talò, M.; Krause, B.; Pionteck, J.; Lanzara, G.; Lacarbonara, W. An updated micromechanical model based on morphological characterization of carbon nanotube nanocomposites. Compos. Part B Eng. 2017, 115, 70–78. [Google Scholar] [CrossRef]
- Liebscher, M.; Domurath, J.; Krause, B.; Saphiannikova, M.; Heinrich, G.; Pötschke, P. Electrical and melt rheological characterization of PC and co-continuous PC/SAN blends filled with CNTs: Relationship between melt-mixing parameters, filler dispersion, and filler aspect ratio. J. Polym. Sci. Part B Polym. Phys. 2018, 56, 79–88. [Google Scholar] [CrossRef]
- Krause, B.; Carval, J.; Pötschke, P. Influence of mixing conditions on carbon nanotube shortening and curling in polycarbonate composites. AIP Conf. Proc. 2017, 1914, 030007. [Google Scholar]
- Andrews, R.; Jacques, D.; Minot, M.; Rantell, T. Fabrication of carbon multiwall nanotube/polymer composites by shear mixing. Macromol. Mater. Eng. 2002, 287, 395–403. [Google Scholar] [CrossRef]
- Kasaliwal, G.R.; Göldel, A.; Pötschke, P.; Heinrich, G. Influences of polymer matrix melt viscosity and molecular weight on MWCNT agglomerate dispersion. Polymer 2011, 52, 1027–1036. [Google Scholar] [CrossRef]
- Pan, Y.; Li, L.; Chan, S.H.; Zhao, J. Correlation between dispersion state and electrical conductivity of MWCNTs/PP composites prepared by melt blending. Compos. Part A Appl. Sci. Manuf. 2010, 41, 419–426. [Google Scholar] [CrossRef]


| Trade Name | Notation | Manufacturer | MFI [g/10 min] | MA-Content [wt %] |
|---|---|---|---|---|
| Moplen HP501H | PP-h | LyondellBasell (Rotterdam, The Netherlands) | 2.1 | - |
| Orevac® PPC | PP-h-MA | Arkema Group (Colombes, France) | 2.0 | 0.14 [22] |
| PPH | PP-m | - | 11.8 | - |
| Orevac® 18732 | PP-m-MA | Arkema Group (Colombes, France) | 6–10 | 0.13 [22] |
| Moplen HP400R | PP-l | LyondellBasell (Rotterdam, The Netherlands) | 25 | - |
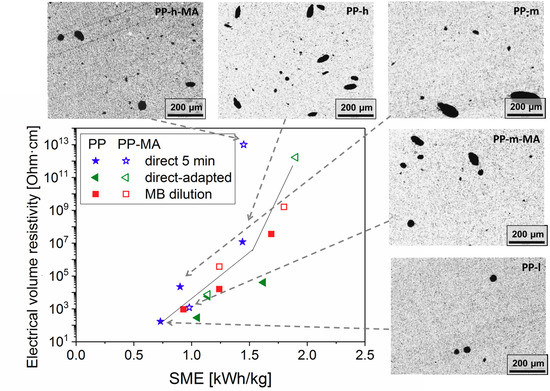
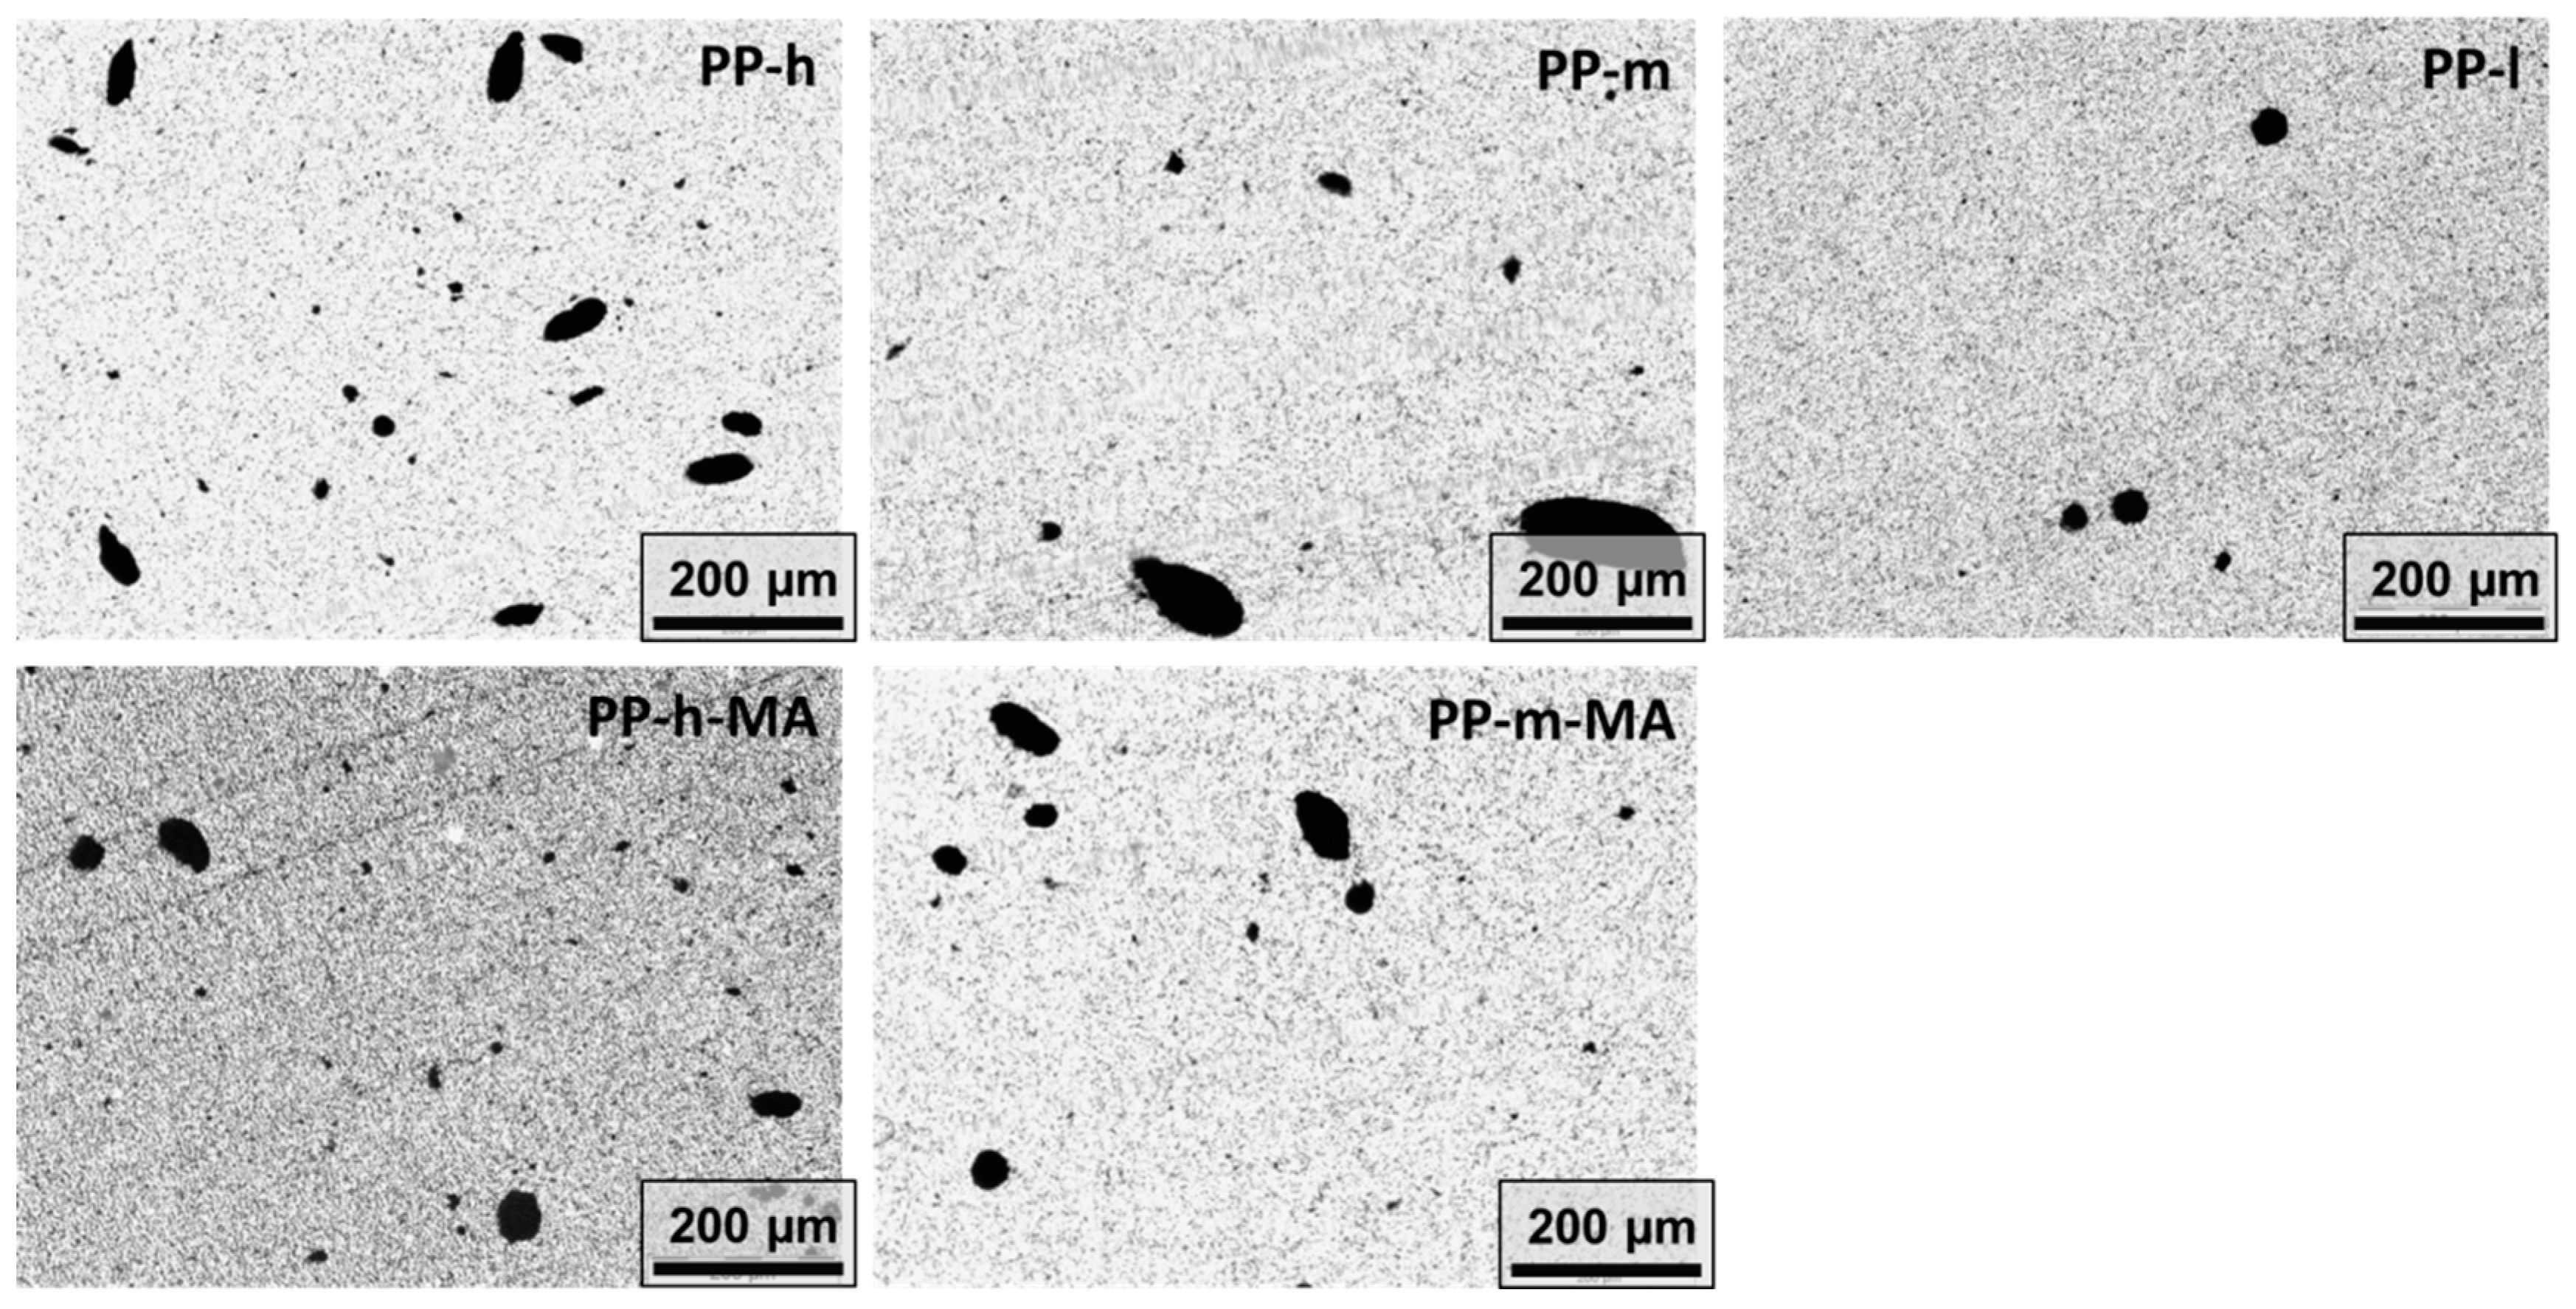
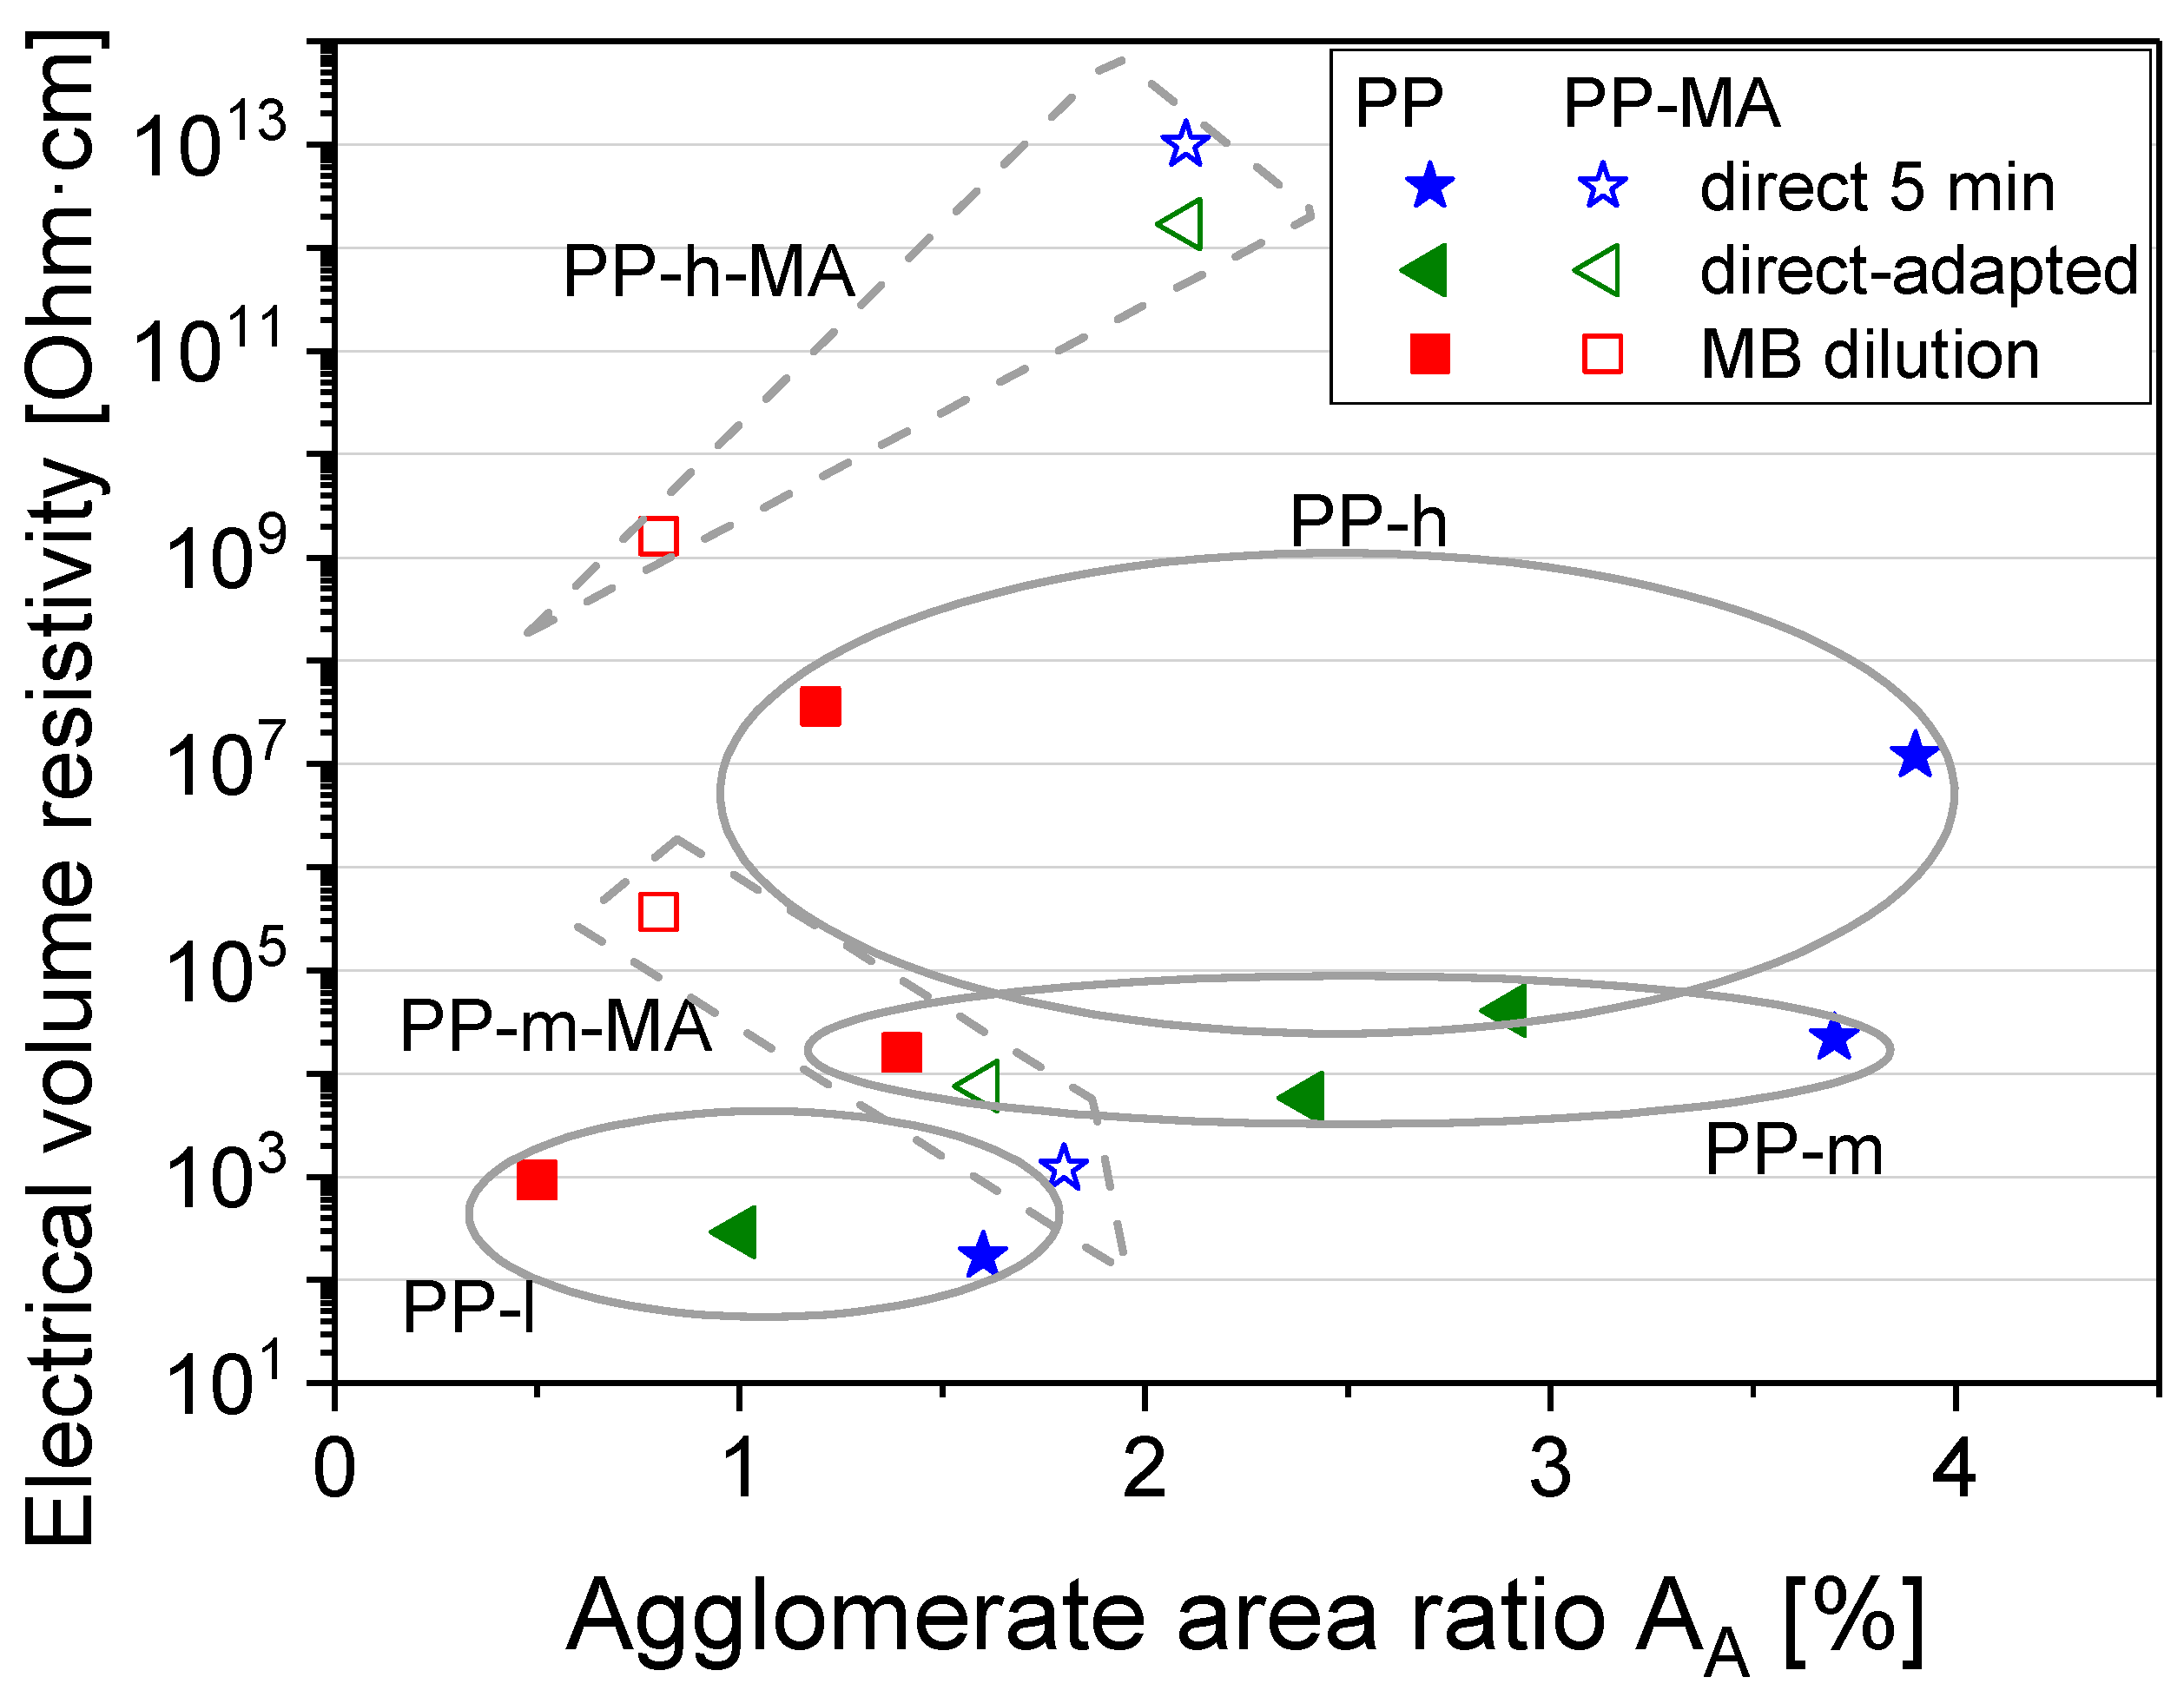
| Material | Direct Incorporation AA [%] | Direct Incorporation SME [kWh/kg] | Masterbatch Dilution AA [%] | Masterbatch Dilution SME [kWh/kg] |
|---|---|---|---|---|
| PP-h | 3.9 ± 1.4% | 1.44 | 1.2 ± 0.7% | 1.69 |
| PP-h-MA | 2.1 ± 0.9% | 1.45 | 0.8 ± 0.2% | 1.80 |
| PP-m | 3.7 ± 2.2% | 0.90 | 1.4 ± 1.0% | 1.24 |
| PP-m-MA | 1.8 ± 0.7% | 0.98 | 0.8 ± 0.2% | 1.24 |
| PP-l | 1.6 ± 0.7% | 0.73 | 0.5 ± 0.1% | 0.93 |
| Material | Adapted Mixing Time [min] | Direct Incorporation Adapted AA [%] | Direct Incorporation Adapted SME [kWh/kg] |
|---|---|---|---|
| PP-h | 6 | 2.9 ± 0.9% | 1.62 |
| PP-h-MA | 7 | 2.1 ± 0.7% | 1.90 |
| PP-m | 7 | 2.4 ± 1.0% | 1.14 |
| PP-m-MA | 6 | 1.6 ± 0.3% | 1.14 |
| PP-l | 8 | 1.0 ± 0.4% | 1.05 |
© 2019 by the authors. Licensee MDPI, Basel, Switzerland. This article is an open access article distributed under the terms and conditions of the Creative Commons Attribution (CC BY) license (http://creativecommons.org/licenses/by/4.0/).
Share and Cite
Pötschke, P.; Mothes, F.; Krause, B.; Voit, B. Melt-Mixed PP/MWCNT Composites: Influence of CNT Incorporation Strategy and Matrix Viscosity on Filler Dispersion and Electrical Resistivity. Polymers 2019, 11, 189. https://doi.org/10.3390/polym11020189
Pötschke P, Mothes F, Krause B, Voit B. Melt-Mixed PP/MWCNT Composites: Influence of CNT Incorporation Strategy and Matrix Viscosity on Filler Dispersion and Electrical Resistivity. Polymers. 2019; 11(2):189. https://doi.org/10.3390/polym11020189
Chicago/Turabian StylePötschke, Petra, Fanny Mothes, Beate Krause, and Brigitte Voit. 2019. "Melt-Mixed PP/MWCNT Composites: Influence of CNT Incorporation Strategy and Matrix Viscosity on Filler Dispersion and Electrical Resistivity" Polymers 11, no. 2: 189. https://doi.org/10.3390/polym11020189