3D Printing PLA Waste to Produce Ceramic Based Particulate Reinforced Composite Using Abundant Silica-Sand: Mechanical Properties Characterization


Abstract
:
1. Introduction
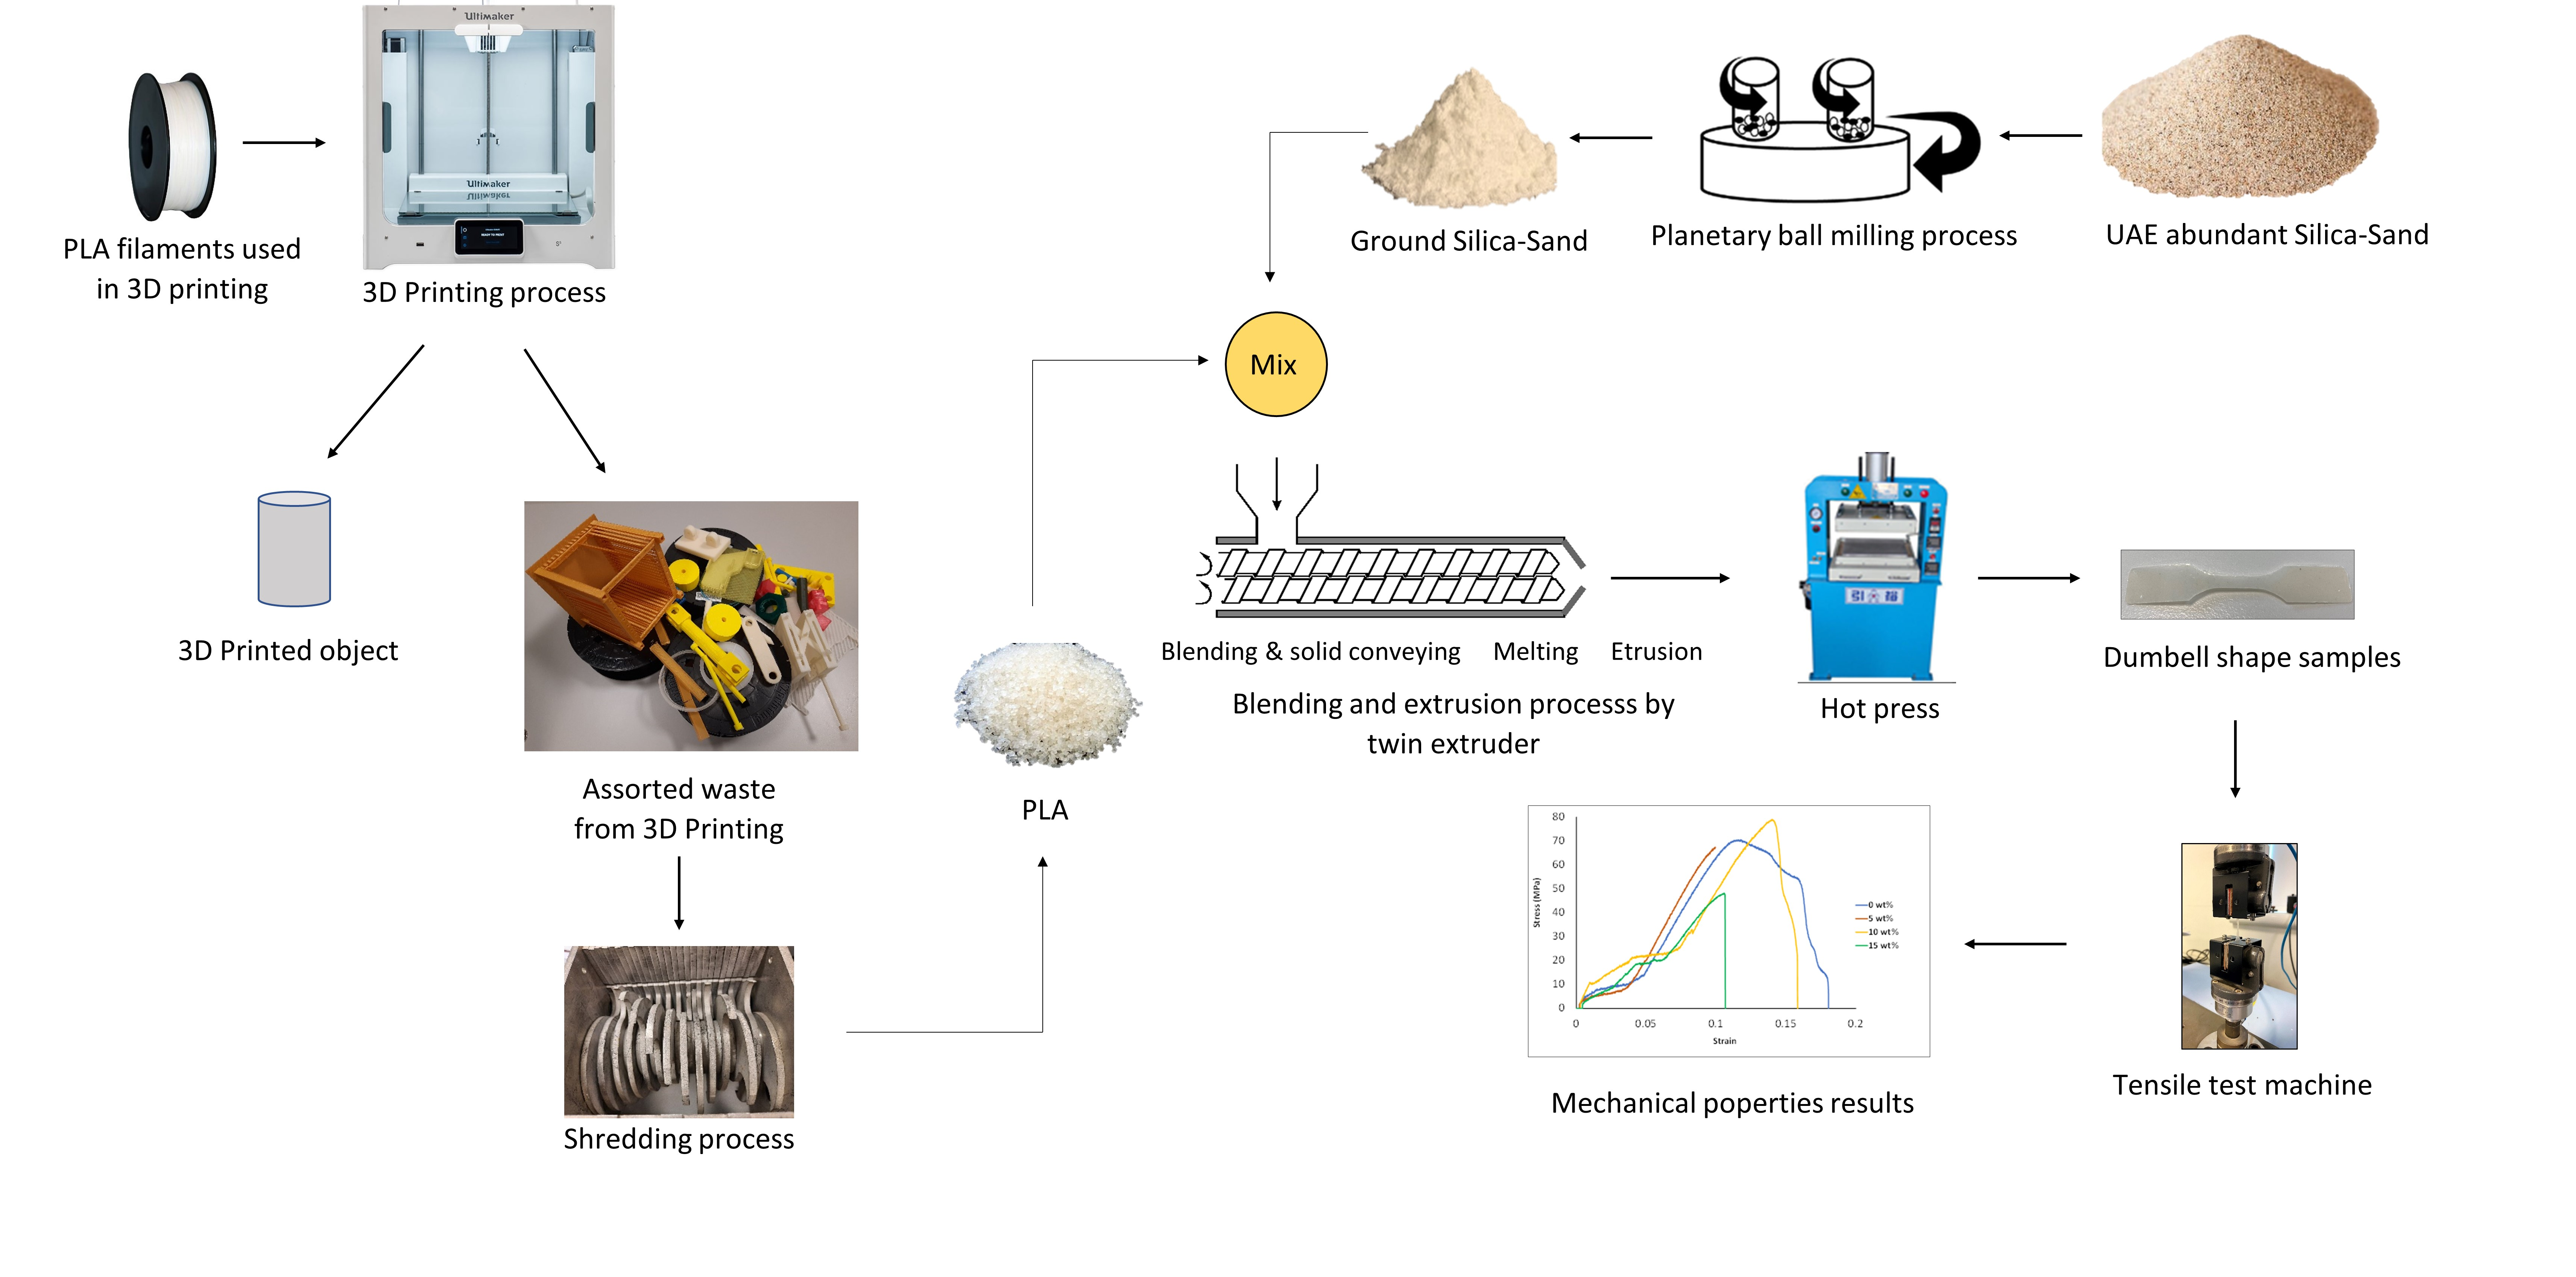
2. Materials and Methods
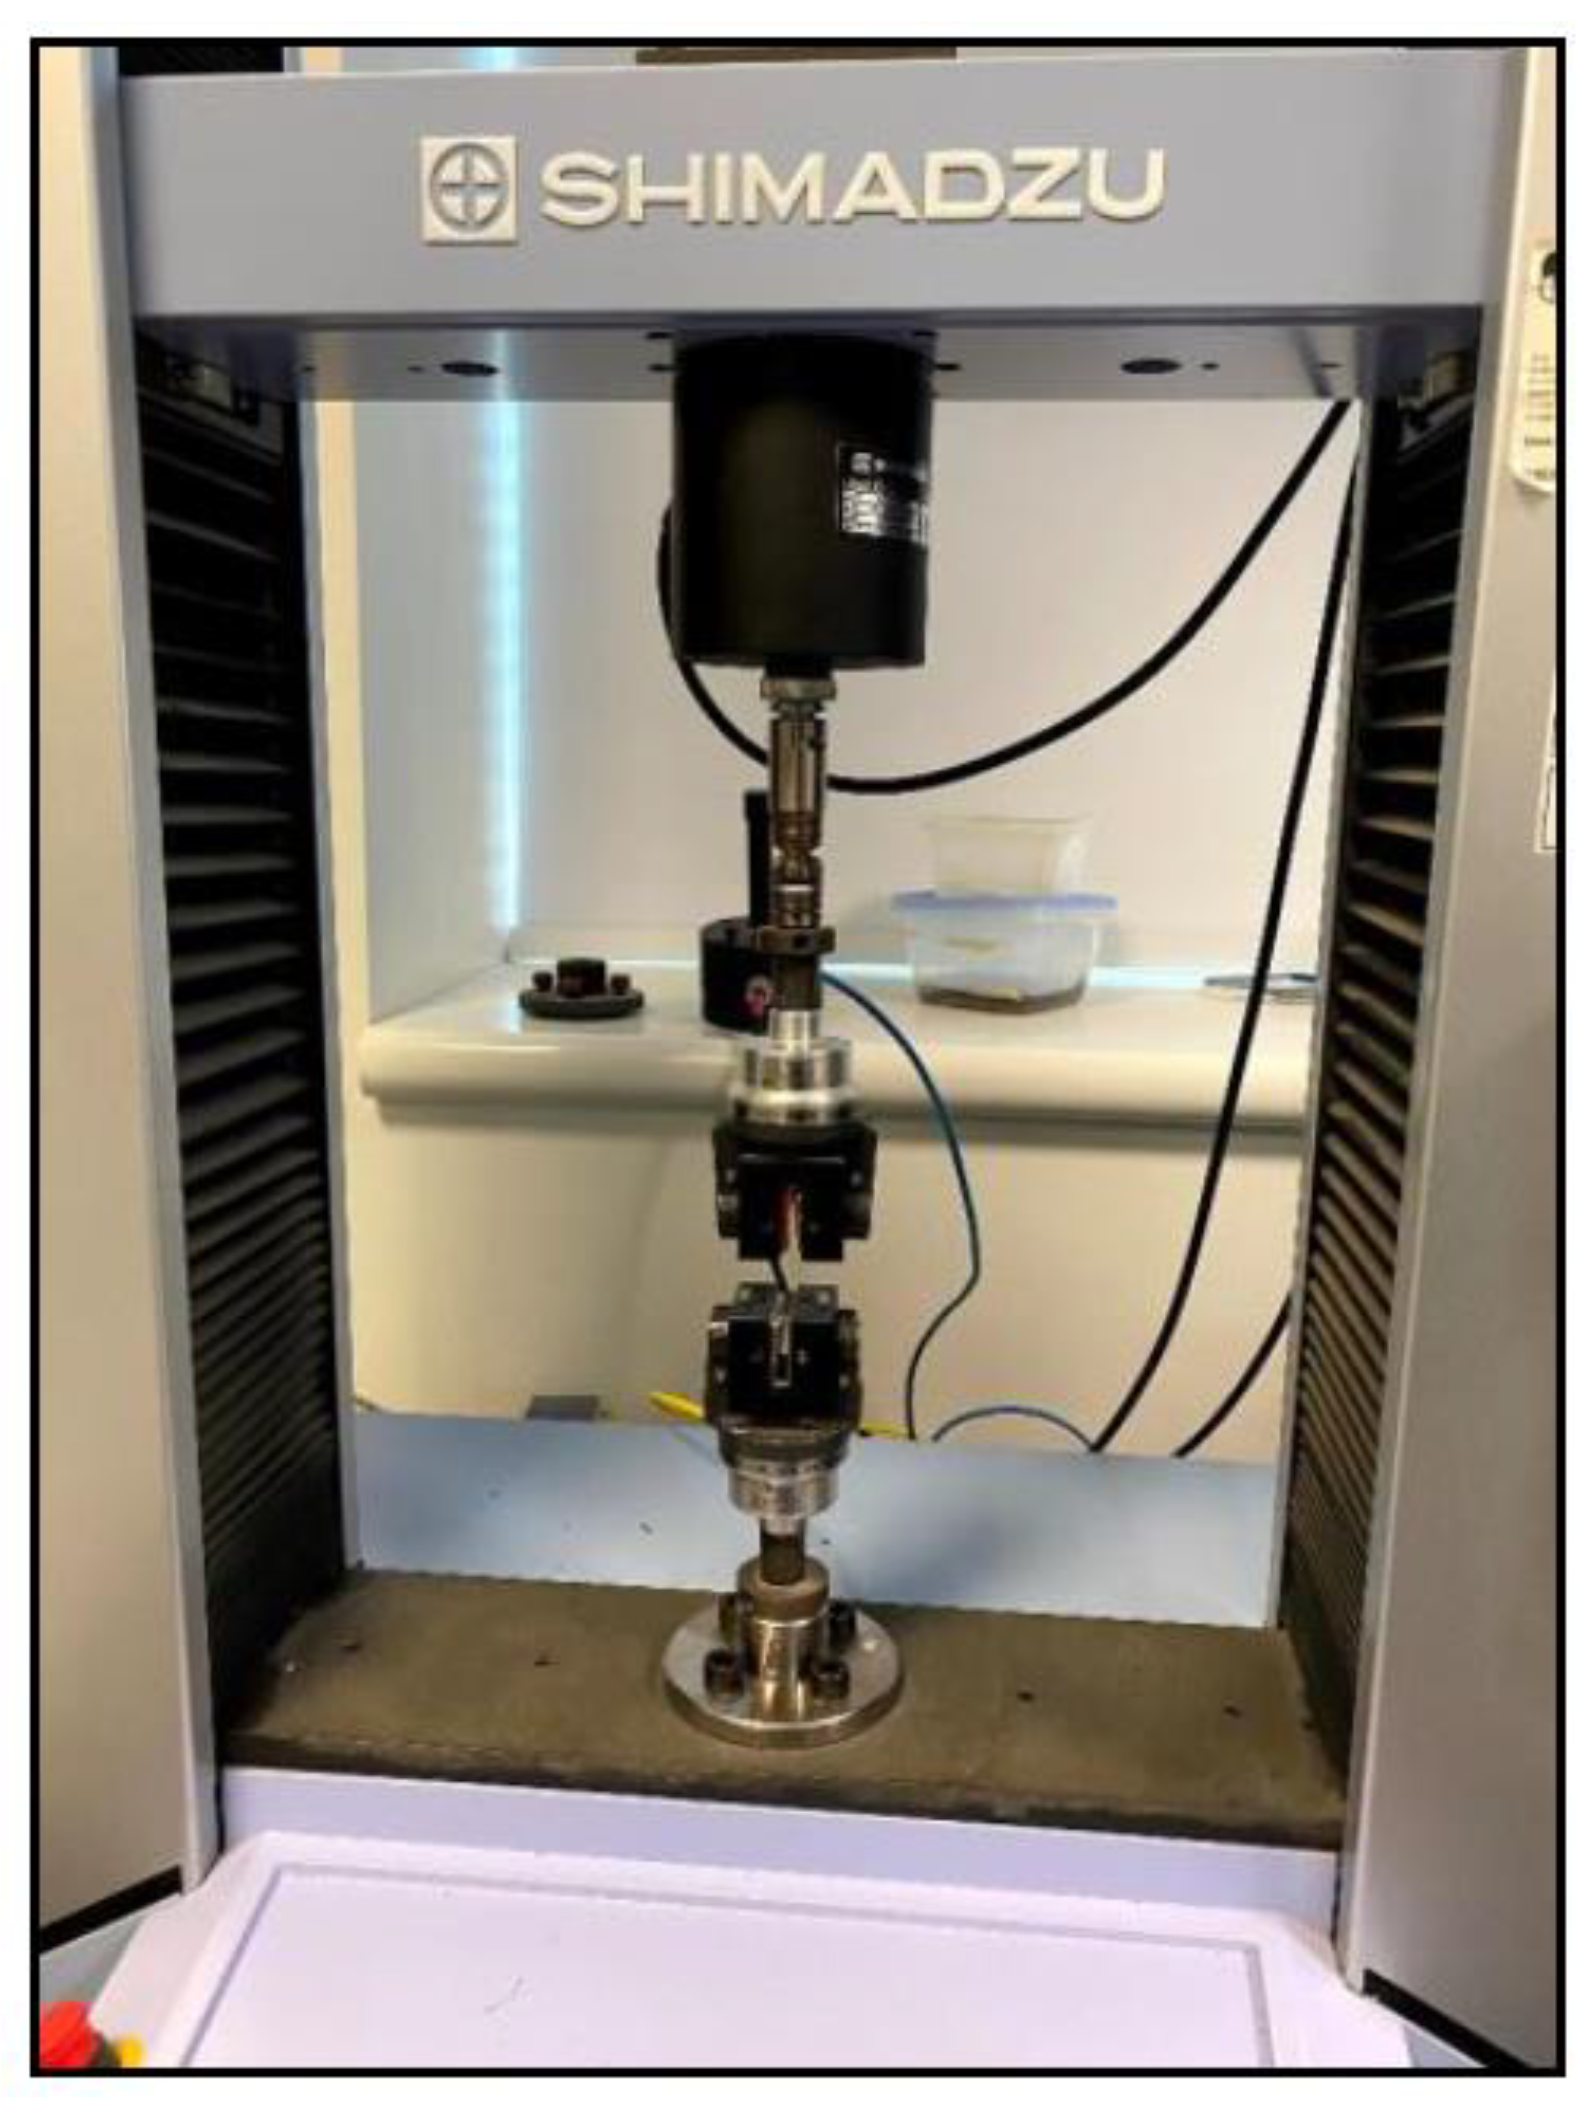
Mechanical Characterization
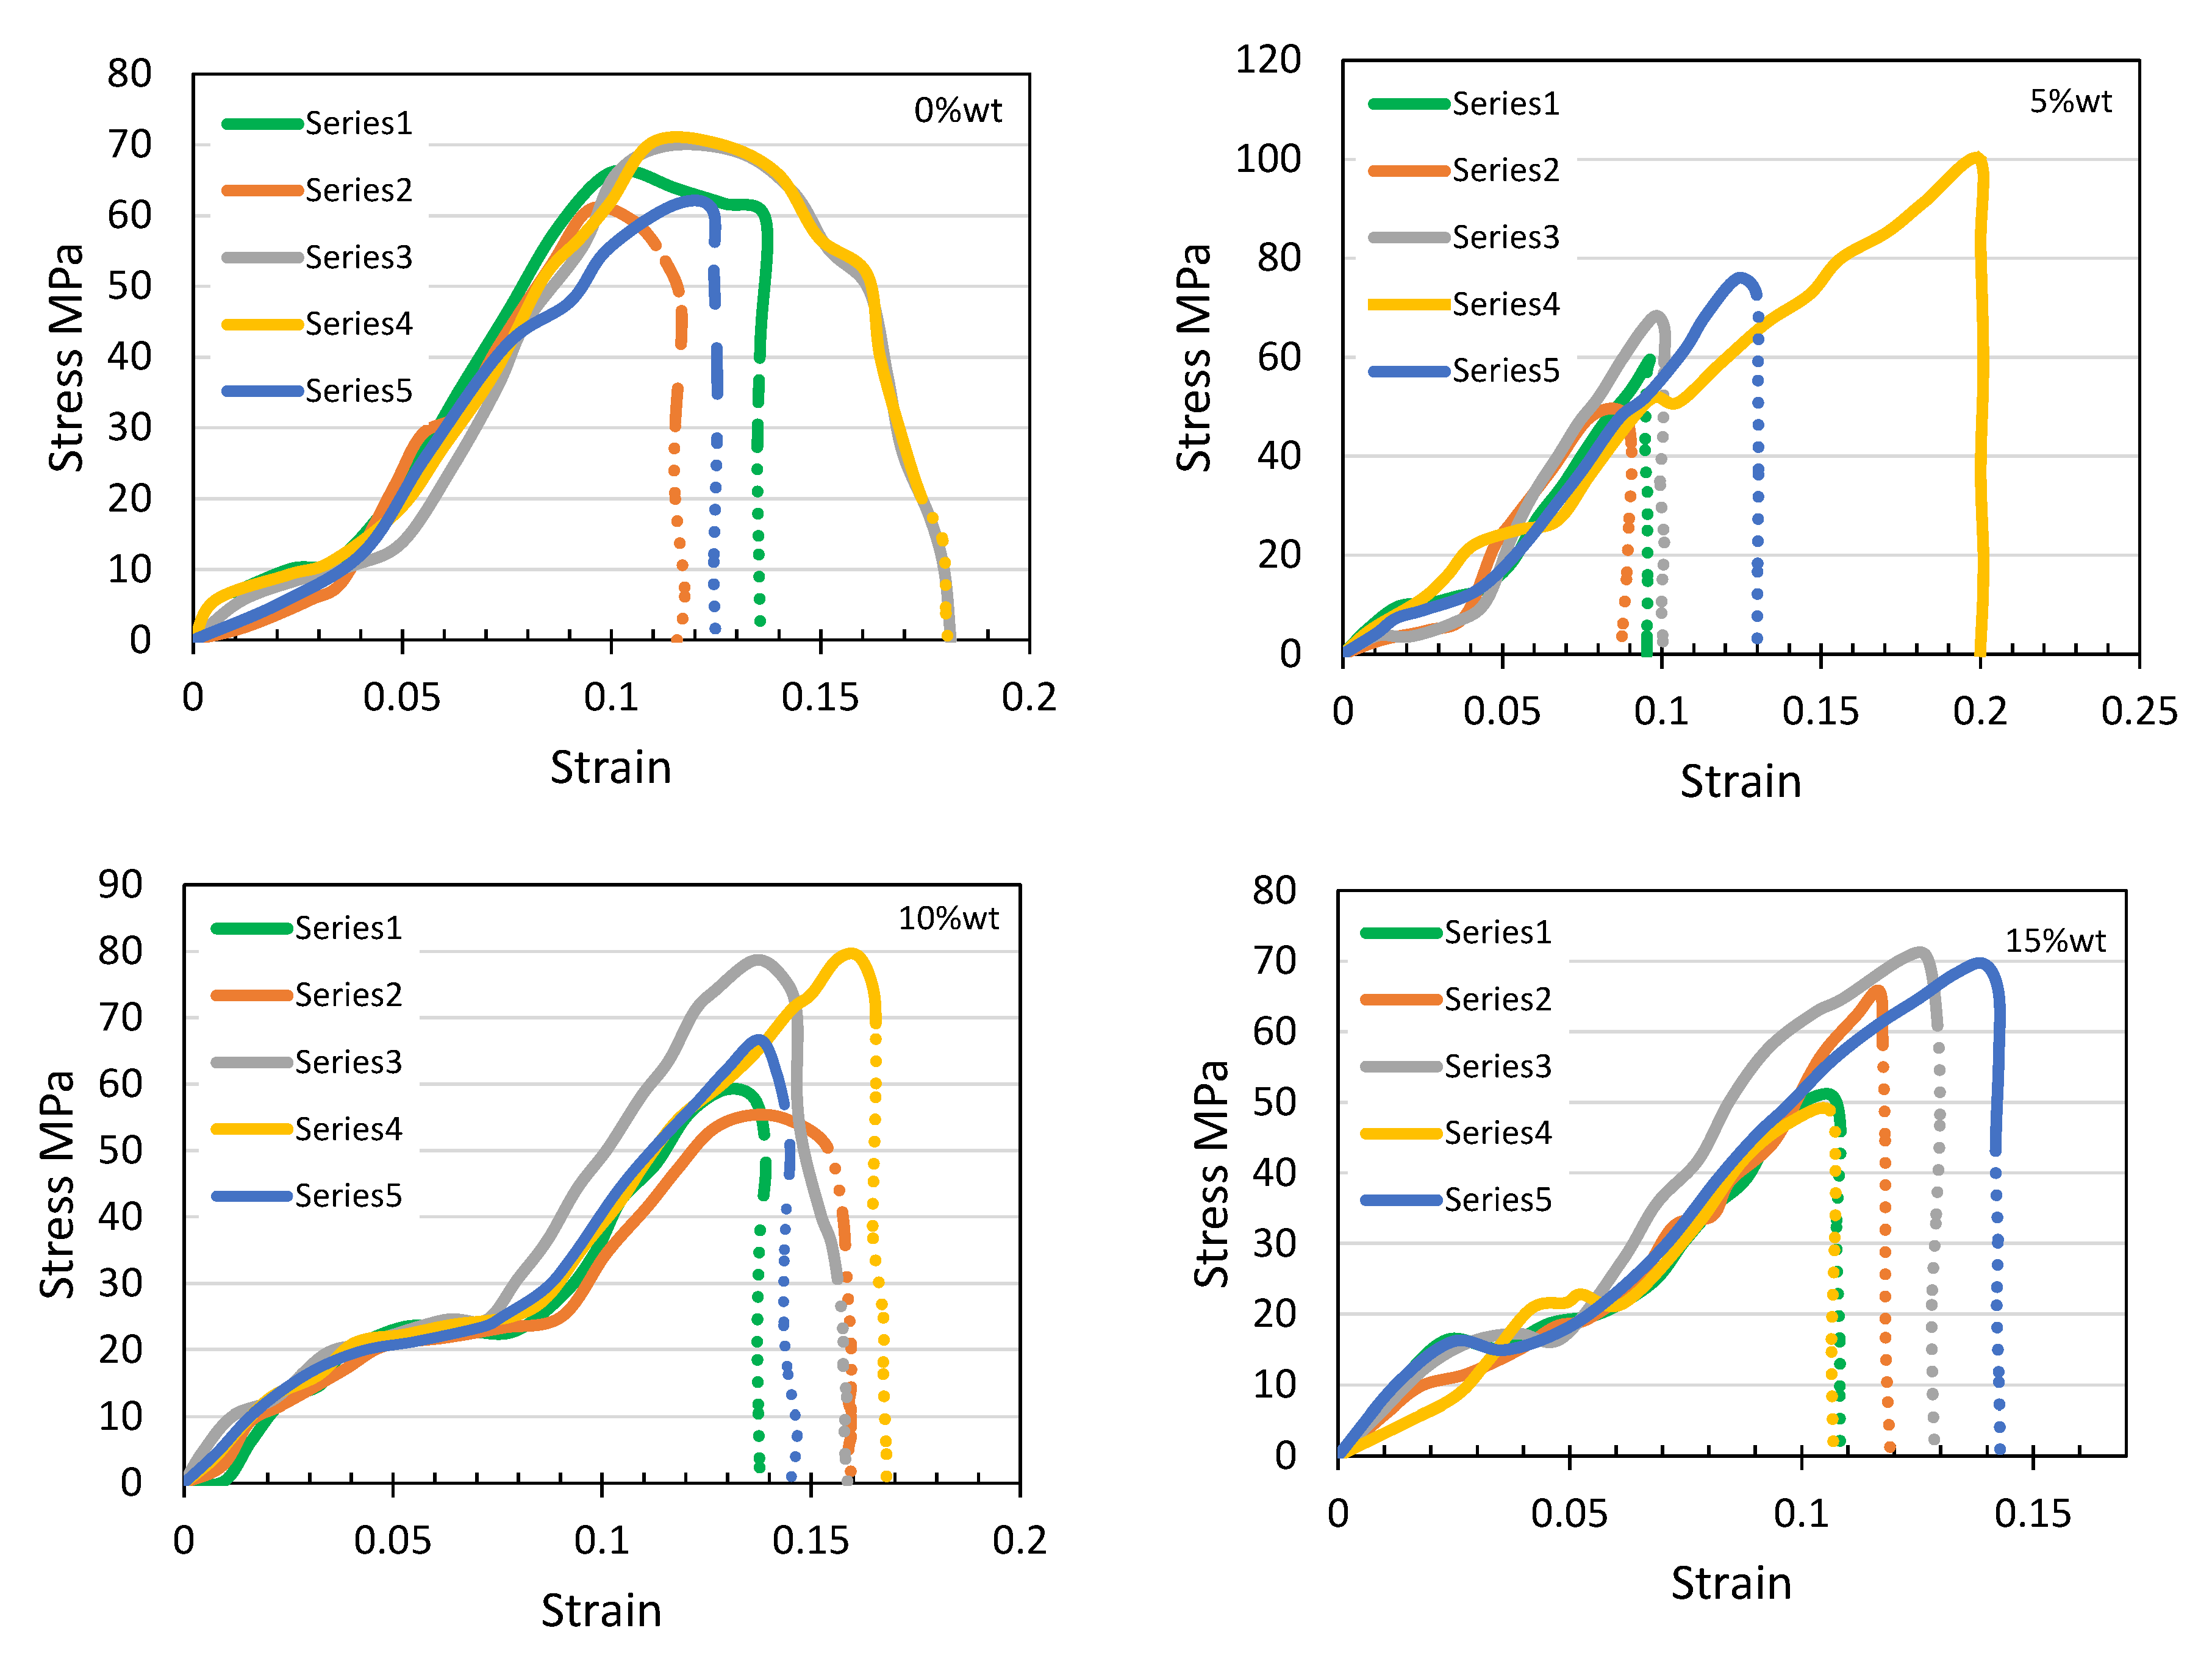
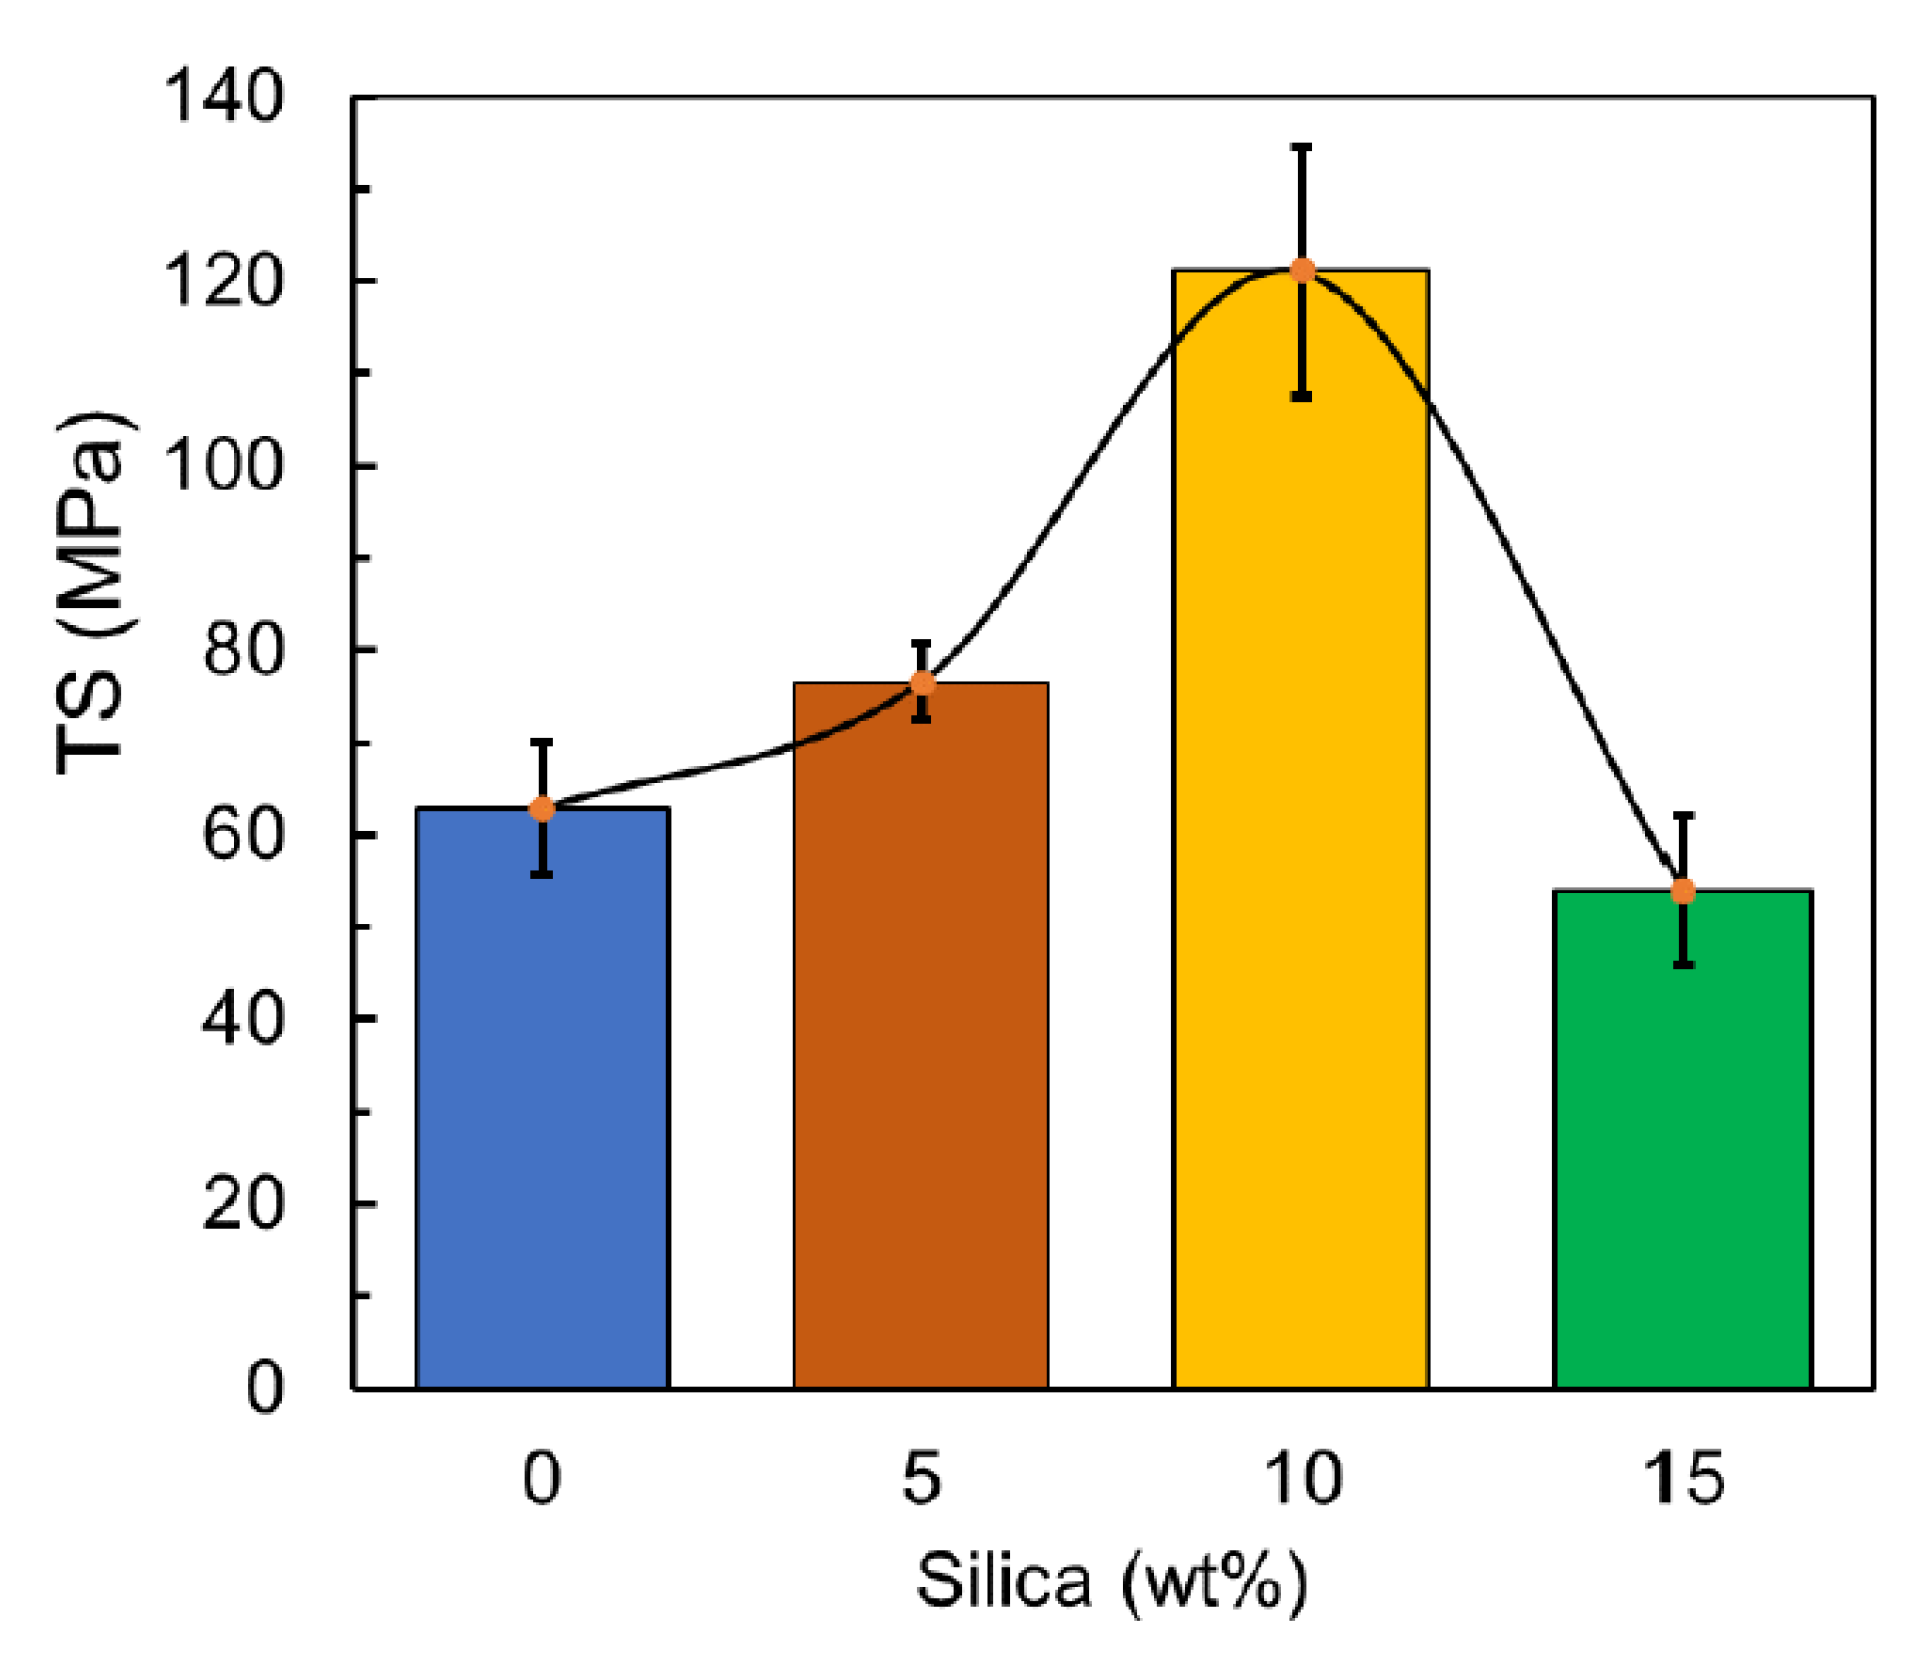
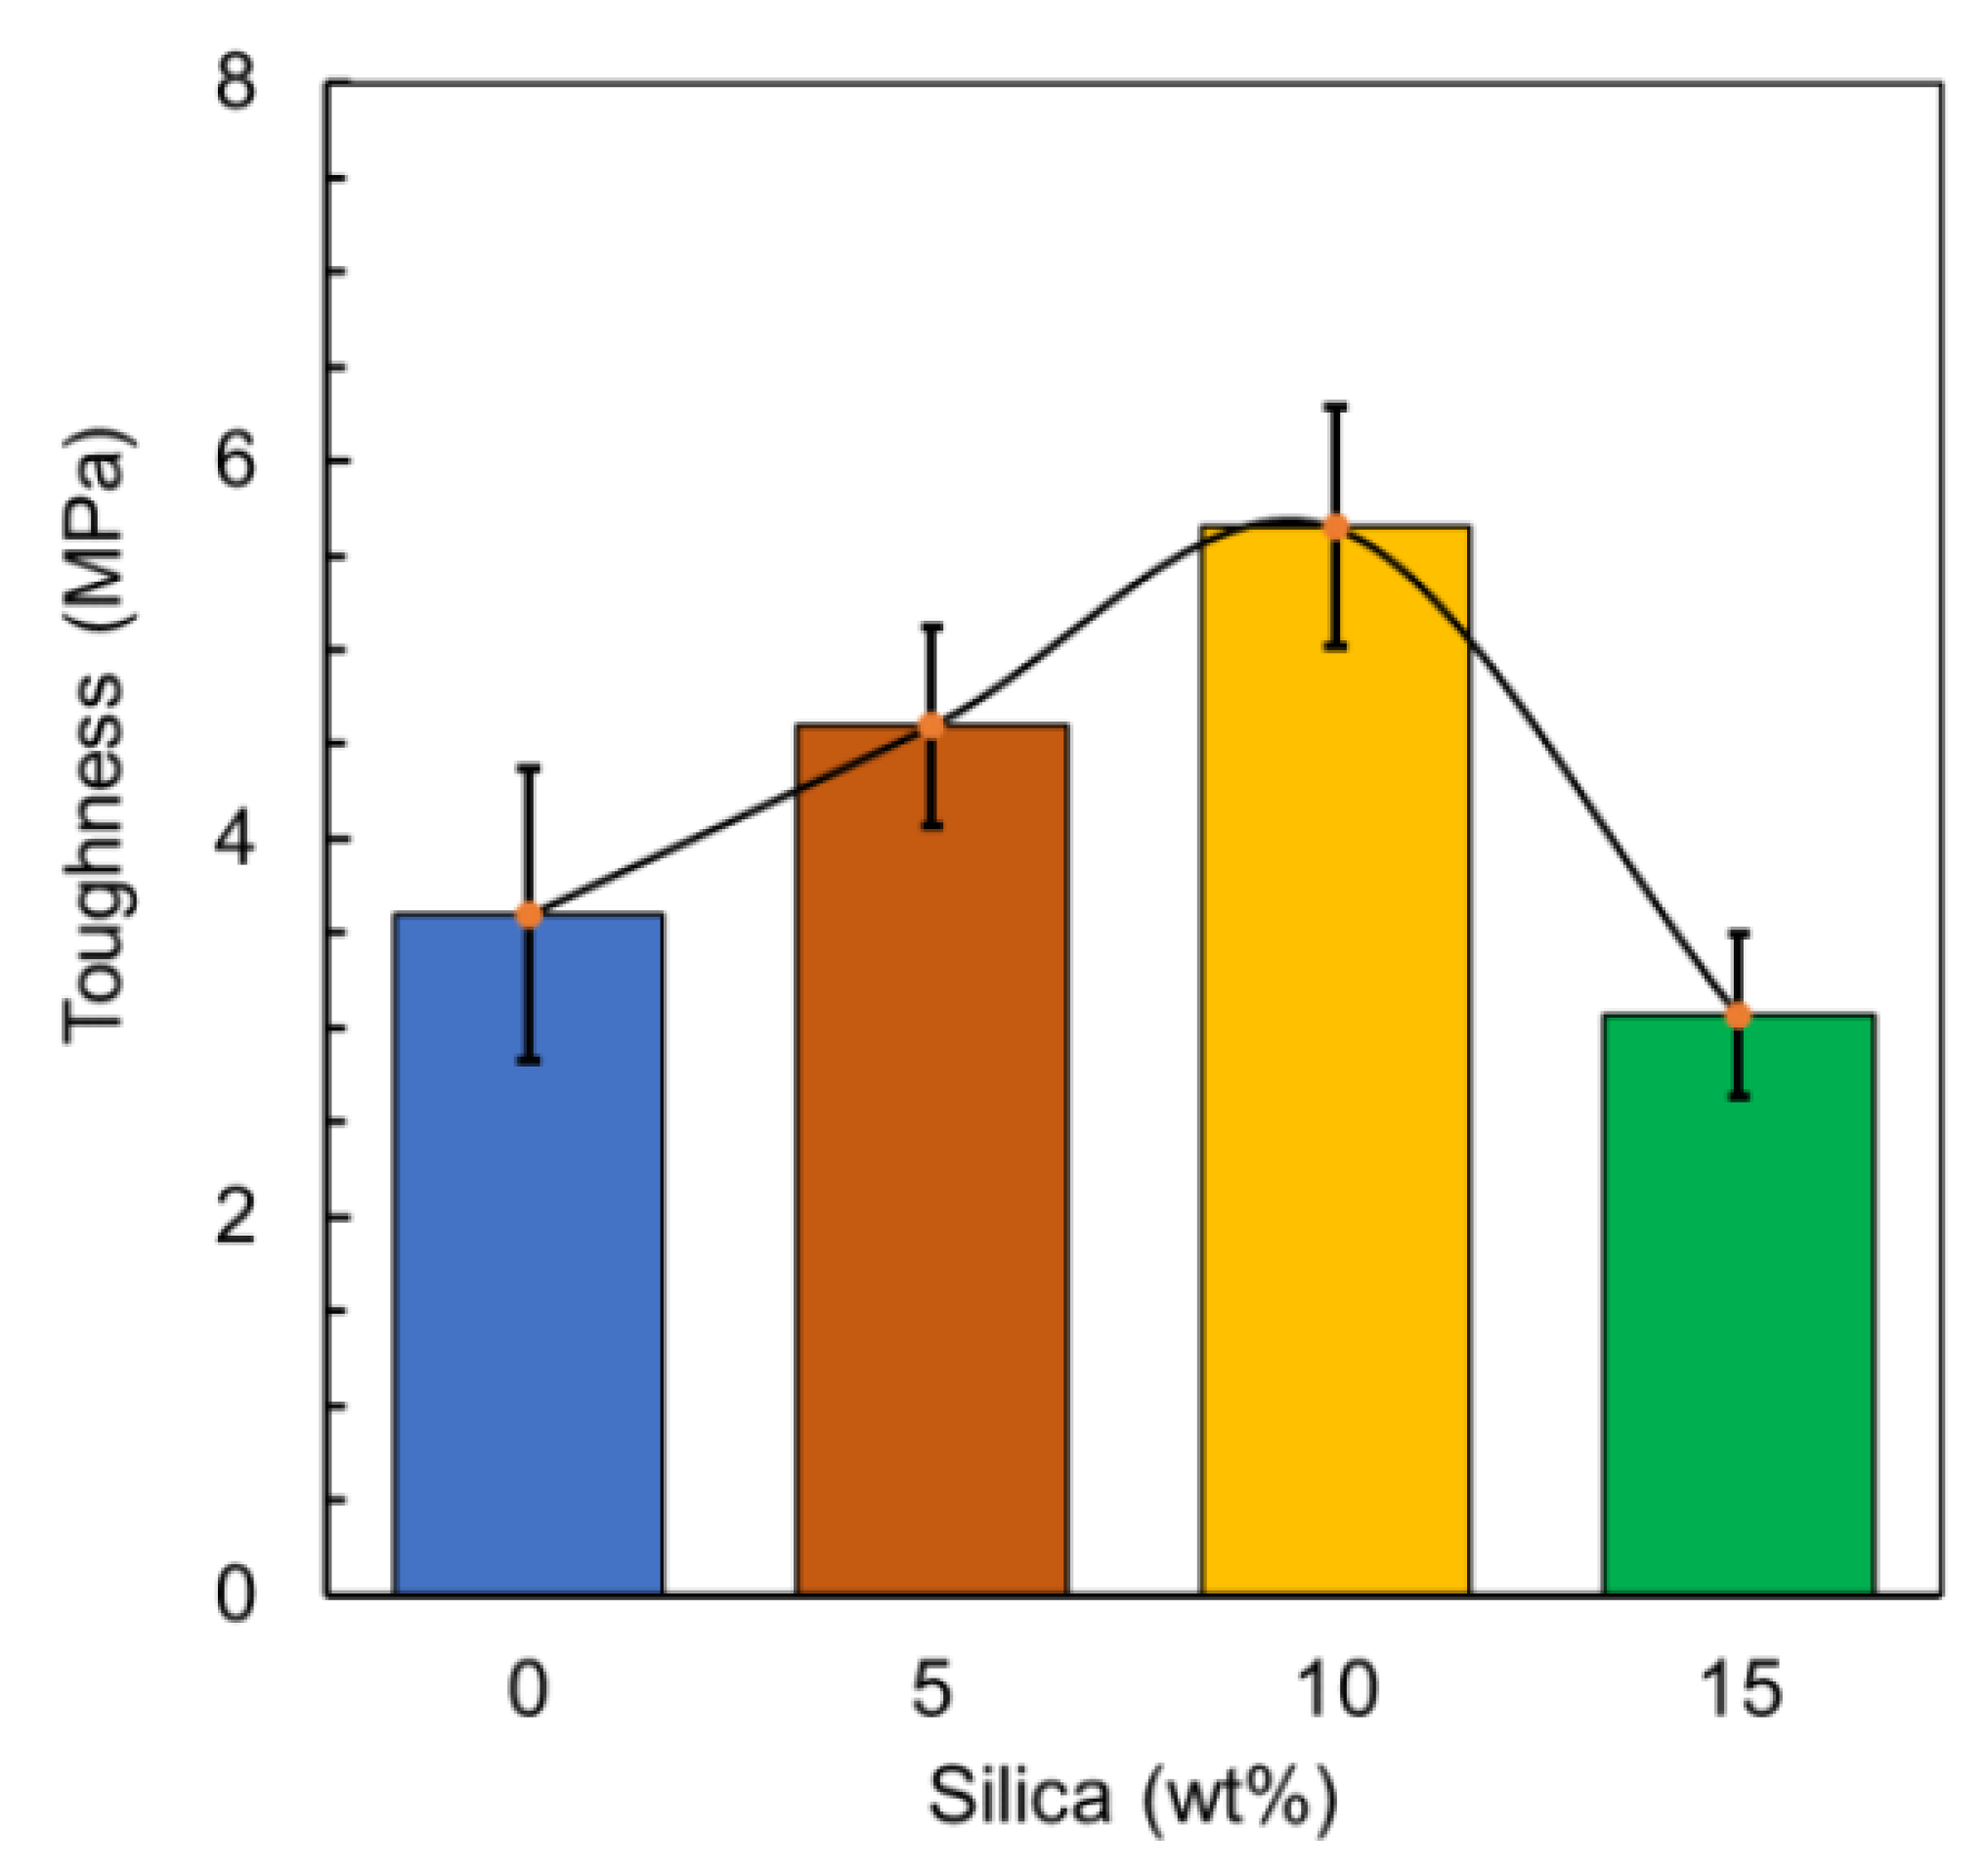
3. Results and Discussion
- Lf = is the length of the specimen when it finally ruptures or breaks.
- Lo = is the original gauge length of the specimen
- E is Young’s modulus (modulus of elasticity)
- F is the force exerted on an object under tension.
- A is the actual cross-sectional area, which equals the area of the cross-section perpendicular to the applied force.
- ΔL is the amount by which the length of the object changes
- Lo is the original length of the object.
4. Bulk Density
5. Conclusions
Author Contributions
Funding
Conflicts of Interest
References
- Turku, I.; Kasala, S.; Kärki, T. Characterization of Polystyrene Wastes as Potential Extruded Feedstock Filament for 3D Printing. Recycling 2018, 3, 57. [Google Scholar] [CrossRef] [Green Version]
- Niaounakis, M. Recycling of biopolymers—The patent perspective. Eur. Polym. J. 2019, 114, 464–475. [Google Scholar] [CrossRef]
- Hedayati, F.; Moshiri-Gomchi, N.; Assaran-Ghomi, M.; Sabahi, S.; Bahri-Laleh, N.; Mehdipour-Ataei, S.; Mokhtari-Aliabad, J.; Mirmohammadi, S.A. Preparation and properties of enhanced nanocomposites based on PLA/PC blends reinforced with silica nanoparticles. Polym. Adv. Technol. 2019, 31, 566–573. [Google Scholar] [CrossRef]
- Tian, X.; Liu, T.; Wang, Q.; Dilmurat, A.; Li, D.; Ziegmann, G. Recycling and remanufacturing of 3D printed continuous carbon fiber reinforced PLA composites. J. Clean. Prod. 2017, 142, 1609–1618. [Google Scholar] [CrossRef]
- Prasad, C.V.; Sudhakara, P.; Prabhakar, M.; Shah, A.U.R.; Song, J.-I. An investigation on the effect of silica aerogel content on thermal and mechanical properties of Sisal/PLA nano composites. Polym. Compos. 2016, 39, 835–840. [Google Scholar] [CrossRef]
- Li, Y.; Han, C.; Bian, J.; Han, L.; Dong, L.; Gao, G. Rheology and biodegradation of polylactide/silica nanocomposites. Polym. Compos. 2012, 33, 1719–1727. [Google Scholar] [CrossRef]
- Patti, A.; Acierno, D.; Latteri, A.; Tosto, C.; Pergolizzi, E.; Recca, G.; Cristaudo, M.; Cicala, G. Influence of the processing conditions on the mechanical performance of sustainable Bio-Based PLA compounds. Polymers 2020, 12, 2197. [Google Scholar] [CrossRef]
- Monti, M.; Scrivani, M.T.; Gianotti, V. Effect of SEBS and OBC on the impact strength of recycled polypropylene/talc composites. Recycling 2020, 5, 9. [Google Scholar] [CrossRef]
- Zhong, S.; Rakhe, P.; Pearce, J.M. energy payback time of a solar photovoltaic powered waste plastic recyclebot system. Recycling 2017, 2, 10. [Google Scholar] [CrossRef]
- Wu, D.; Hakkarainen, M. Recycling PLA to multifunctional oligomeric compatibilizers for PLA/starch composites. Eur. Polym. J. 2015, 64, 126–137. [Google Scholar] [CrossRef]
- Raquez, J.-M.; Habibi, Y.; Murariu, M.; Dubois, P. Polylactide (PLA)-based nanocomposites. Prog. Polym. Sci. 2013, 38, 1504–1542. [Google Scholar] [CrossRef]
- Kim, G.H.; Hwang, S.W.; Jung, B.N.; Kang, D.; Shim, J.K.; Seo, K.H. Effect of PMMA/Silica hybrid particles on interfacial adhesion and crystallization properties of Poly(Lactic Acid)/Block acrylic elastomer composites. Polymers 2020, 12, 2231. [Google Scholar] [CrossRef] [PubMed]
- Ahmed, S.W.; Hussain, G.; Altaf, K.; Ali, S.; Alkahtani, M.; Abidi, M.H.; Alzabidi, A. On the effects of process parameters and optimization of interlaminate bond strength in 3D printed ABS/CF-PLA composite. Polymers 2020, 12, 2155. [Google Scholar] [CrossRef] [PubMed]
- Pop, M.A.; Croitoru, C.; Bedo, T.; Geamăn, V.; Radomir, I.; Zaharia, S.M.; Chicoș, L.A. Influence of internal innovative architecture on the mechanical properties of 3D polymer printed parts. Polymers 2020, 12, 1129. [Google Scholar] [CrossRef]
- Olaiya, N.; Nuryawan, A.; Oke, P.K.; Khalil, H.A.; Rizal, S.; Mogaji, P.B.; Sadiku, E.R.; Ray, S.S.; Farayibi, P.K.; Ojijo, V.; et al. The role of two-step blending in the properties of starch/chitin/polylactic acid biodegradable composites for biomedical applications. Polymers 2020, 12, 592. [Google Scholar] [CrossRef] [Green Version]
- Correa, A.C.; De Santi, C.R.; Manrich, S. Synthetic paper from plastic waste: The effect of CaCO3 on physical, surface properties and printability. Macromol. Symp. 2006, 611–620. [Google Scholar] [CrossRef]
- Attaran, S.A.; Hassan, A.; Wahit, M.U. Materials for Food Packaging Applications Based on Bio-Based Polymer Nanocomposites: A Review. J. of Thermoplast. Compos. Mater. 2017, 1–32. [Google Scholar] [CrossRef]
- Krupa, I.; Cecen, V.; Boudenne, A.; Prokeš, J.; Novák, I. The mechanical and adhesive properties of electrically and thermally conductive polymeric composites based on high density polyethylene filled with nickel powder. Mater. Des. 2013, 51, 620–628. [Google Scholar] [CrossRef]
- Lee, D.W.; Yoo, B.R. Advanced silica/polymer composites: Materials and applications. J. Ind. Eng. Chem. 2016, 38, 1–12. [Google Scholar] [CrossRef]
- Ahmed, W.K.; Al-Douri, Y. Three-dimensional printing of ceramic powder technology. In Metal Oxide Powder Technologies; Elsevier BV: Amsterdam, The Netherlands, 2020; pp. 351–383. [Google Scholar]
- Hakim, R.H.; Cailloux, J.; Santana, O.O.; Bou, J.; Sánchez-Soto, M.; Odent, J.; Raquez, J.M.; Dubois, P.; Carrasco, F.; Maspoch, M.L. PLA/SiO2 composites: Influence of the filler modifications on the morphology, crystallization behavior, and mechanical properties. J. Appl. Polym. Sci. 2017, 134, 45367. [Google Scholar] [CrossRef]
- Warrick, E.L.; Pierce, O.R.; Polmanteer, K.E.; Saam, J.C. Silicone Elastomer Developments 1967–1977. Rubber Chem. Technol. 1979, 52, 437–525. [Google Scholar] [CrossRef]
- Bhowmick, A.K.; Stephens, H. (Eds.) Handbook of Elastomers; Routledge & CRC Press: Boca Raton, FL, USA, November 2000; Available online: https://www.routledge.com/Handbook-of-Elastomers/Bhowmick-Stephens/p/book/9780824703837 (accessed on 23 October 2020).
- Wei, L.; Hu, N.; Yang, Z. Synthesis of polymer—Mesoporous silica nanocomposites. Materials 2010, 3, 4066–4079. [Google Scholar] [CrossRef]
- Agüero, Á.; Garcia-Sanoguera, D.; Lascano, D.; Rojas-Lema, S.; Ivorra-Martinez, J.; Fenollar, O.; Torres-Giner, S. Evaluation of different compatibilization strategies to improve the performance of injection-molded green composite pieces made of polylactide reinforced with short flaxseed fibers. Polymers 2020, 12, 821. [Google Scholar] [CrossRef] [PubMed] [Green Version]
- Sitticharoen, W.; Chainawakul, A.; Sangkas, T.; Kuntham, Y. Rheological and mechanical properties of silica-based bagasse-fiber-ash-reinforced recycled HDPE composites. Mech. Compos. Mater. 2016, 52, 421–432. [Google Scholar] [CrossRef]
- Shokrieh, M.; Rezvani, S.; Mosalmani, R. A novel polymer concrete made from fine silica sand and polyester. Mech. Compos. Mater. 2015, 51, 571–580. [Google Scholar] [CrossRef]
- Jong, L. Synergistic effect of calcium carbonate and biobased particles for rubber reinforcement and comparison to silica reinforced rubber. J. Compos. Sci. 2020, 4, 113. [Google Scholar] [CrossRef]
- Park, S.; Ko, Y.-S.; Jung, H.; Lee, C.; Woo, K.; Ko, G. Disinfection of waterborne viruses using silver nanoparticle-decorated silica hybrid composites in water environments. Sci. Total Environ. 2018, 625, 477–485. [Google Scholar] [CrossRef]
- Tsai, P.-A.; Chiu, W.-M.; Lin, C.-E.; Wu, J.-H. Fabrication and characterization of PLA/SiO2/Al2O3 composites prepared by Sol-Gel process. Polym. Plast. Technol. Eng. 2013, 52, 1488–1495. [Google Scholar] [CrossRef]
- Santos, F.A.D.; Tavares, M.I.B. Development and characterization of hybrid materials based on biodegradable PLA matrix, microcrystalline cellulose and organophilic silica. Polímeros 2014, 24, 561–566. [Google Scholar] [CrossRef] [Green Version]
- Wen, X. One-pot route to graft long-chain polymer onto silica nanoparticles and its application for high-performance poly(l-lactide) nanocomposites. RSC Adv. 2019, 9, 13908–13915. [Google Scholar] [CrossRef] [Green Version]
- Yuliarto, B.; Kumai, Y.; Inagaki, S.; Zhou, H. Enhanced benzene selectivity of mesoporous silica SPV sensors by incorporating phenylene groups in the silica framework. Sens. Actuators B Chem. 2009, 138, 417–421. [Google Scholar] [CrossRef]
- Mallakpour, S.; Naghdi, M. Polymer/SiO2 nanocomposites: Production and applications. Prog. Mater. Sci. 2018, 97, 409–447. [Google Scholar] [CrossRef]
- Ahmed, W.; Alabdouli, H.; Alqaydi, H.; Mansour, A.; Khawaja, H.A. Open source 3D printer: A case study. In Proceedings of the International Conference on Industrial Engineering and Operations Management, 10th Annual International IEOM Conference, Dubai, UAE, 10–12 March 2020. [Google Scholar]
- Lu, B.; Li, D.; Tian, X. Development trends in additive manufacturing and 3D printing. Engineering 2015, 1, 85–89. [Google Scholar] [CrossRef] [Green Version]
- Palmer, C. 3D printing advances on multiple fronts. Engineering 2020, 6, 590–592. [Google Scholar] [CrossRef]
- Sörme, L.; Voxberg, E.; Rosenlund, J.; Jensen, S.; Augustsson, A.L. Coloured plastic bags for kerbside collection of waste from households—To improve waste recycling. Recycling 2019, 4, 20. [Google Scholar] [CrossRef] [Green Version]
- Zuniga, J.M.; Peck, J.; Srivastava, R.; Katsavelis, D.; Carson, A. An open source 3D-Printed transitional hand prosthesis for children. JPO J. Prosthet. Orthot. 2016, 28, 103–108. [Google Scholar] [CrossRef]
- Fielding, G.A.; Bandyopadhyay, A.; Bose, S. Effects of silica and zinc oxide doping on mechanical and biological properties of 3D printed tricalcium phosphate tissue engineering scaffolds. Dent. Mater. 2012, 28, 113–122. [Google Scholar] [CrossRef] [Green Version]
- Al Khawaja, H.; Alabdouli, H.; Alqaydi, H.; Mansour, A.; Ahmed, W.; Al Jassmi, H. Investigating the mechanical properties of 3D printed components. In Proceedings of the 2020 Advances in Science and Engineering Technology International Conferences (ASET), Dubai, UAE, 4–9 February 2020; pp. 1–7. [Google Scholar]
- Alhamad, I.M.; Ahmed, W.K.; Ali, H.Z.; Aljassmi, H. 3d printing applications in mechanical engineering education. In Integrating 3D Printing into Teaching and Learning; Brill: Leiden, The Netherlands, 2019; pp. 90–131. [Google Scholar]
- Genena, F.A.; Jamal, D.A.; Ahmed, W.; Almarzooqi, L.A.; Almazrouei, A.S.; Al-Naqbi, A.H. Implementing green solutions to recycle UAE domestic waste: Aircraft composite materials. In Proceedings of the 2018 5th International Conference on Renewable Energy: Generation and Applications (ICREGA), Abu Dhabi, UAE, 26–28 February 2018; pp. 30–33. [Google Scholar]
- Mansour, A.; Alabdouli, H.; Almehairi, A.R.; Alhammadi, M.; Alqaidy, H.; Ahmed, W.; Hilal-Alnaqbi, A. Investigating the compressive strength of CFRP Pre-Preg Scrap from aerospace industries: Compression molding. In Proceedings of the 2019 Advances in Science and Engineering Technology International Conferences (ASET), Institute of Electrical and Electronics Engineers (IEEE), Dubai, UAE, 26 March–11 April 2019; pp. 1–6. [Google Scholar]
- Ahmed, W.K.; Hilal-Alnaqbi, A.; Almazrouei, A.S.S.; Almarzooqi, L.A.A.M.; Al Jamal, D.; Genena, F.A.A. Method of Recycling Carbon Fiber Prepreg Waste. Patent US10328610B2, 25 June 2019. [Google Scholar]
- Ahmed, W.K. Method of Recycling Carbon Fiber Prepreg Waste and Transparent Thermoplastic Waste. Patent US10507598B2, 17 December 2019. [Google Scholar]
- Hoffman, J.M. New life for shredded plastic waste. Mach. Des. 2008, 80, 55–58. [Google Scholar]
- Alsheriani, T.A.K. Composition and Environmental Assessment of Soils from United Arab Emirates. Master’s Thesis, United Arab Emirates University, Abu Dhabi, UAE, 1998. [Google Scholar]
- Peşman, E.; Tufan, M. The effects of CaCO3 coated wood free paper usage as filler on water absorption, mechanical and thermal properties of cellulose-high density polyethylene composites. Mater. Sci. 2016, 22, 530–535. [Google Scholar] [CrossRef] [Green Version]
- Huang, J.-W.; Hung, Y.C.; Wen, Y.-L.; Kang, C.-C.; Yeh, M.-Y. Polylactide/nano- and micro-scale silica composite films. II. Melting behavior and cold crystallization. J. Appl. Polym. Sci. 2009, 112, 3149–3156. [Google Scholar] [CrossRef]
- Suzuki, Y.; Yang, M.; Murakawa, M. Optimum clearance in the microblanking of thin foil of austenitic stainless steel JIS SUS304 studied from shear cut surface and punch load. Materials 2020, 13, 678. [Google Scholar] [CrossRef] [Green Version]
- Akyürek, F.; Yaman, K.; Tekiner, Z. An experimental work on tool wear affected by die clearance and punch hardness. Arab. J. Sci. Eng. 2017, 42, 4683–4692. [Google Scholar] [CrossRef]
- Mucha, J.; Tutak, J. Analysis of the influence of blanking clearance on the wear of the punch, the change of the burr size and the geometry of the hook blanked in the hardened steel sheet. Materials 2019, 12, 1261. [Google Scholar] [CrossRef] [Green Version]
- Mucha, J. An experimental analysis of effects of various material tool’s wear on burr during generator sheets blanking. Int. J. Adv. Manuf. Technol. 2010, 50, 495–507. [Google Scholar] [CrossRef]
- D20 Committee. Guide for Determination of Thickness of Plastic Film Test Specimens; ASTM International: West Conshohocken, PA, USA, 2013. [Google Scholar]
- Ultimaker PLA Material: Highly Versatile, Easy to Print. ultimaker.com. Available online: https://ultimaker.com/materials/pla (accessed on 7 August 2020).
- Meng, Q.; Hetzer, M.; de Kee, D. PLA/clay/wood nanocomposites: Nanoclay effects on mechanical and thermal properties. J. Compos. Mater. 2010, 45, 1145–1158. [Google Scholar] [CrossRef]
- Li, Z.; Muiruri, J.K.; Thitsartarn, W.; Zhang, X.; Tan, B.H.; He, C. Biodegradable silica rubber core-shell nanoparticles and their stereocomplex for efficient PLA toughening. Compos. Sci. Technol. 2018, 159, 11–17. [Google Scholar] [CrossRef]
- Liu, L.-Z.; Ma, H.-J.; Zhu, X.-S.; Fan, Y.-J.; Jin, Z.-H. Preparation and properties of polylactide/nano-silicain situcomposites. Pigment. Resin Technol. 2010, 39, 27–31. [Google Scholar] [CrossRef]
- Xia, S.; Liu, X.; Wang, J.; Kan, Z.; Chen, H.; Fu, W.; Li, Z. Role of poly(ethylene glycol) grafted silica nanoparticle shape in toughened PLA-matrix nanocomposites. Compos. Part B Eng. 2019, 168, 398–405. [Google Scholar] [CrossRef]
- Wen, X.; Lin, Y.; Han, C.; Zhang, K.; Ran, X.; Li, Y.; Dong, L. Thermomechanical and optical properties of Biodegradable Poly(L-lactide)/Silica Nanocomposites by melt compounding. J. Appl. Polym. Sci. 2009, 114, 3379–3388. [Google Scholar] [CrossRef]
- Siengchin, S. Impact, thermal and mechanical properties of high density polyethylene/flax/SiO2 composites: Effect of flax reinforcing structures. J. Reinf. Plast. Compos. 2012, 31, 959–966. [Google Scholar] [CrossRef]
- Hao, X.; Kaschta, J.; Schubert, D.W. Viscous and elastic properties of polylactide melts filled with silica particles: Effect of particle size and concentration. Compos. Part B Eng. 2016, 89, 44–53. [Google Scholar] [CrossRef]
- Dorigato, A.; D’Amato, M.; Pegoretti, A. Thermo-mechanical properties of high density polyethylene—fumed silica nanocomposites: Effect of filler surface area and treatment. J. Polym. Res. 2012, 19, 1–11. [Google Scholar] [CrossRef]
- Cheng, D.; Zan, Y.; Du, J.; Luo, Y. Recycling of ultrahigh molecular weight polyethylene waste used for preparing high performance synthetic paper. J. Appl. Polym. Sci. 2016, 133, 44159–44165. [Google Scholar] [CrossRef]
- Grunert, F.; Wehmeier, A.; Blume, A. New insights into the morphology of silica and carbon black based on their different dispersion behavior. Polymers 2020, 12, 567. [Google Scholar] [CrossRef] [PubMed] [Green Version]
- Rothon, R. Particulate-Filled Polymer Composites; iSmithers Rapra Publishing: Shrewsbury, UK, 2003. [Google Scholar]
- Karger-Kocsis, J. (Ed.) Polypropylene Structure, Blends and Composites: Volume 3 Composites; Springer: Berlin/Heidelberg, Germany, 1995. [Google Scholar]
- D18 Committee. Test Methods for Laboratory Determination of Density (Unit Weight) of Soil Specimens; ASTM International: West Conshohocken, PA, USA, 2018. [Google Scholar]
- Lee, I.K.; White, W.; Ingles, O.G. Soil formation, classification and exploration. Princ. Geotech. Eng. 1983, 1, 1–56. [Google Scholar]
- D20 Committee. Test Methods for Density and Specific Gravity (Relative Density) of Plastics by Displacement; ASTM International: West Conshohocken, PA, USA, 2020. [Google Scholar]
- D20 Committee. Practice for Cutting Film and Sheeting Test Specimens; ASTM International: West Conshohocken, PA, USA, 2020. [Google Scholar]
- Auras, R.; Harte, B.R.; Selke, S. An overview of polylactides as packaging materials. Macromol. Biosci. 2004, 4, 835–864. [Google Scholar] [CrossRef]
- Farah, S.; Anderson, D.G.; Langer, R. Physical and mechanical properties of pla, and their functions in widespread applications–A comprehensive review. Adv. Drug Deliv. Rev. 2016, 107, 367–392. [Google Scholar] [CrossRef] [Green Version]
- Wypych, G. Handbook of fillers–Book reviews. IEEE Electr. Insul. Mag. 2004, 20, 64–65. [Google Scholar] [CrossRef]
- Laurence, W. McKeen, CH3–plastics used in medical devices. In Plastics Design Library, Handbook of Polymer Applications in Medicine and Medical Devices; Modjarrad, K., Ebnesajjad, S., Eds.; William Andrew Publishing: Norwich, NY, USA, 2014; pp. 21–53. [Google Scholar]
- Pielichowski, K.; Majka, T.M. (Eds.) Polymer Composites with Functionalized Nanoparticles; Elsevier BV: Amsterdam, The Netherlands, 2019. [Google Scholar]
- Bhat, A.N.; Venkatesan, P.N.; Dharmalingam, S. Polymer/silica composites fabricated by Sol-Gel Technique for medical applications. Trends Biomater. Artif. Organs 2012, 26, 121. [Google Scholar]
- Meer, S.; Kausar, A.; Iqbal, T. Attributes of polymer and silica nanoparticle composites: A Review. Polym. Technol. Eng. 2015, 55, 826–861. [Google Scholar] [CrossRef]
- Ahmed, W.K.; Al-Rifaie, W.N. The impact of cracked microparticles on the mechanical and the fracture behavior of particulate composite. J. Nano Electron. Phys. 2015, 7, 03008–03914. [Google Scholar]
- Ahmed, W.; Teng, H. Characterisation of fractured particulate reinforced composite. Int. J. Microstruct. Mater. Prop. 2014, 9, 160. [Google Scholar] [CrossRef]
- Ahmed, W.; Alnajjar, F.; Zaneldin, E.; Al-Marzouqi, A.H.; Gochoo, M.; Khalid, S. Implementing FDM 3D printing strategies using natural fibers to produce biomass composite. Materials 2020, 13, 4065. [Google Scholar] [CrossRef]


| Silica% | Tensile Strength (MPa) | SD | Toughness (MPa) | SD | Ductility (%) | SD | Elastic Modulus (MPa) | SD | Yield Stress (MPa) | SD |
|---|---|---|---|---|---|---|---|---|---|---|
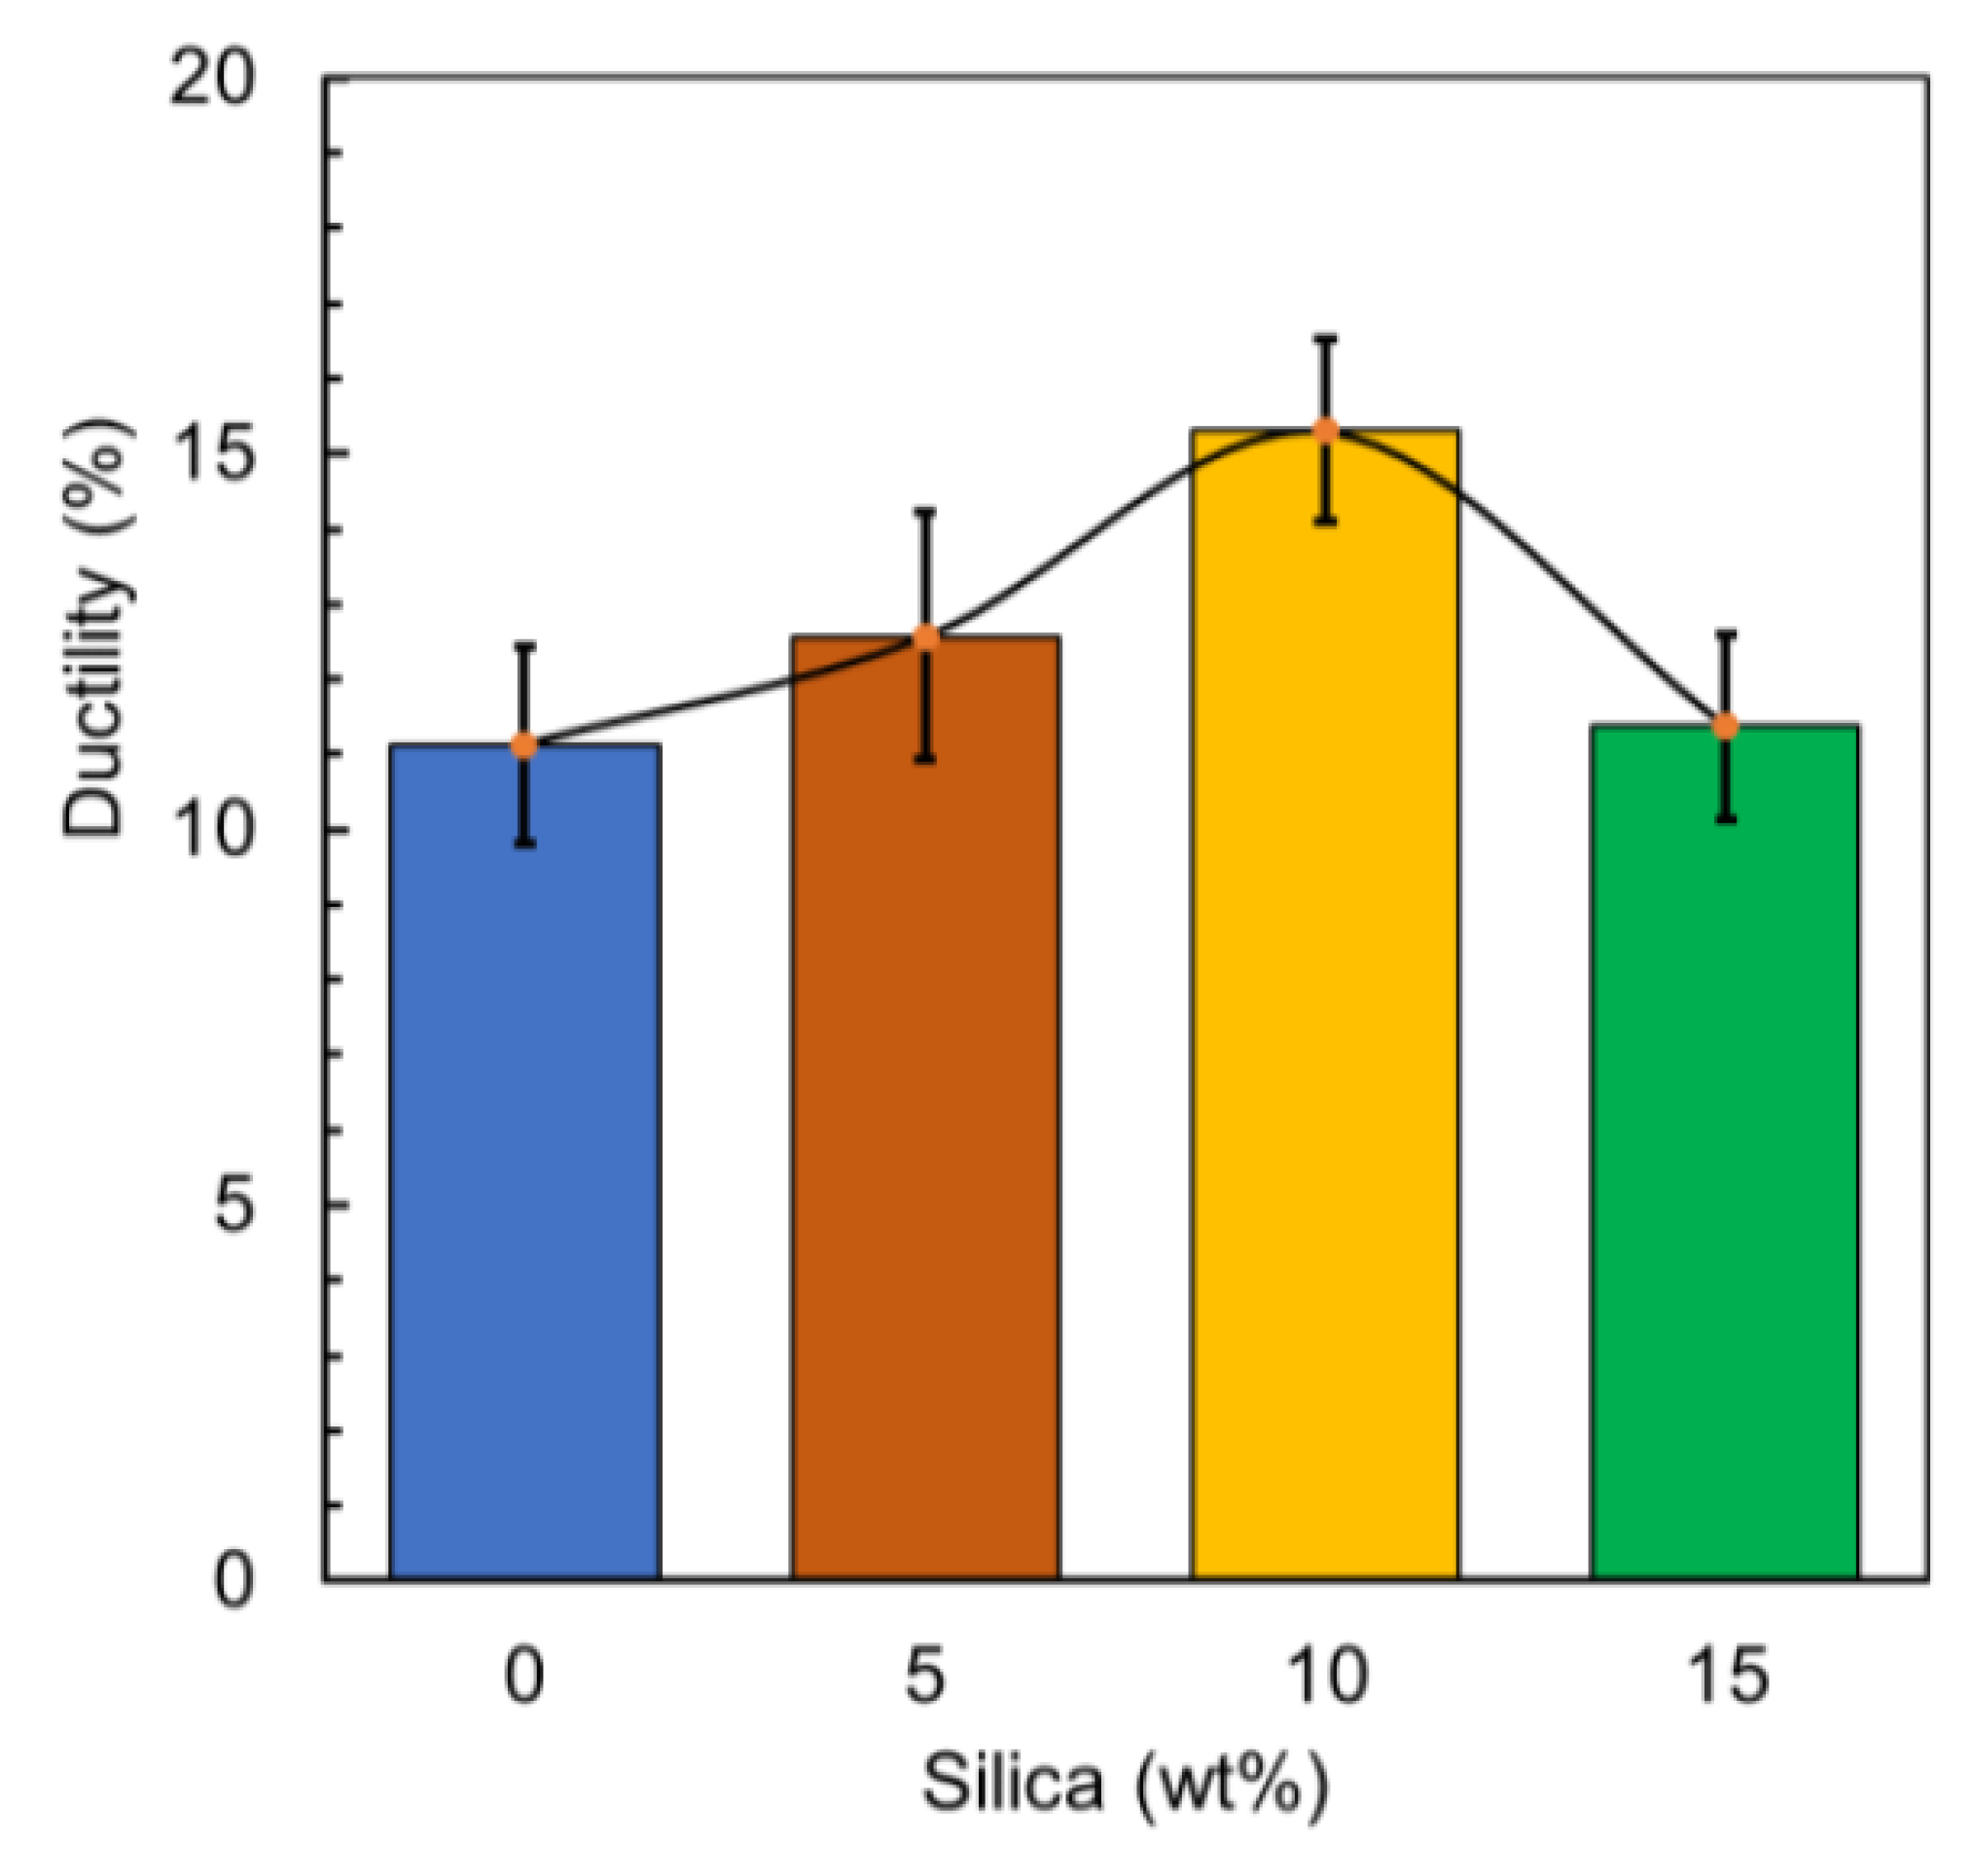
| 0 | 62.8 | ±7.2 | 3.6 | ±0.8 | 11.1 | ±1.3 | 839.6 | ±79.2 | 52.6 | ±9.8 |
| 5 | 76.5 | ±4.1 | 4.6 | ±0.5 | 12.6 | ±1.7 | 895.1 | ±86.4 | 58.8 | ±2.0 |
| 10 | 121.0 | ±13.5 | 5.6 | ±0.6 | 15.3 | ±1.2 | 1020.7 | ±82.1 | 63.6 | ±11.6 |
| 15 | 53.9 | ±8.1 | 3.1 | ±0.4 | 11.4 | ±1.4 | 793.2 | ±94.6 | 53.0 | ±8.7 |
Publisher’s Note: MDPI stays neutral with regard to jurisdictional claims in published maps and institutional affiliations. |
© 2020 by the authors. Licensee MDPI, Basel, Switzerland. This article is an open access article distributed under the terms and conditions of the Creative Commons Attribution (CC BY) license (http://creativecommons.org/licenses/by/4.0/).
Share and Cite
Ahmed, W.; Siraj, S.; Al-Marzouqi, A.H. 3D Printing PLA Waste to Produce Ceramic Based Particulate Reinforced Composite Using Abundant Silica-Sand: Mechanical Properties Characterization. Polymers 2020, 12, 2579. https://doi.org/10.3390/polym12112579
Ahmed W, Siraj S, Al-Marzouqi AH. 3D Printing PLA Waste to Produce Ceramic Based Particulate Reinforced Composite Using Abundant Silica-Sand: Mechanical Properties Characterization. Polymers. 2020; 12(11):2579. https://doi.org/10.3390/polym12112579
Chicago/Turabian StyleAhmed, Waleed, Sidra Siraj, and Ali H. Al-Marzouqi. 2020. "3D Printing PLA Waste to Produce Ceramic Based Particulate Reinforced Composite Using Abundant Silica-Sand: Mechanical Properties Characterization" Polymers 12, no. 11: 2579. https://doi.org/10.3390/polym12112579