Biopolymer-Waste Fiber Reinforcement for Earthen Materials: Capillary, Mechanical, Impact, and Abrasion Performance

 , , ,
, , ,
Abstract
:1. Introduction
2. Materials and Methods
2.1. Material Characterization
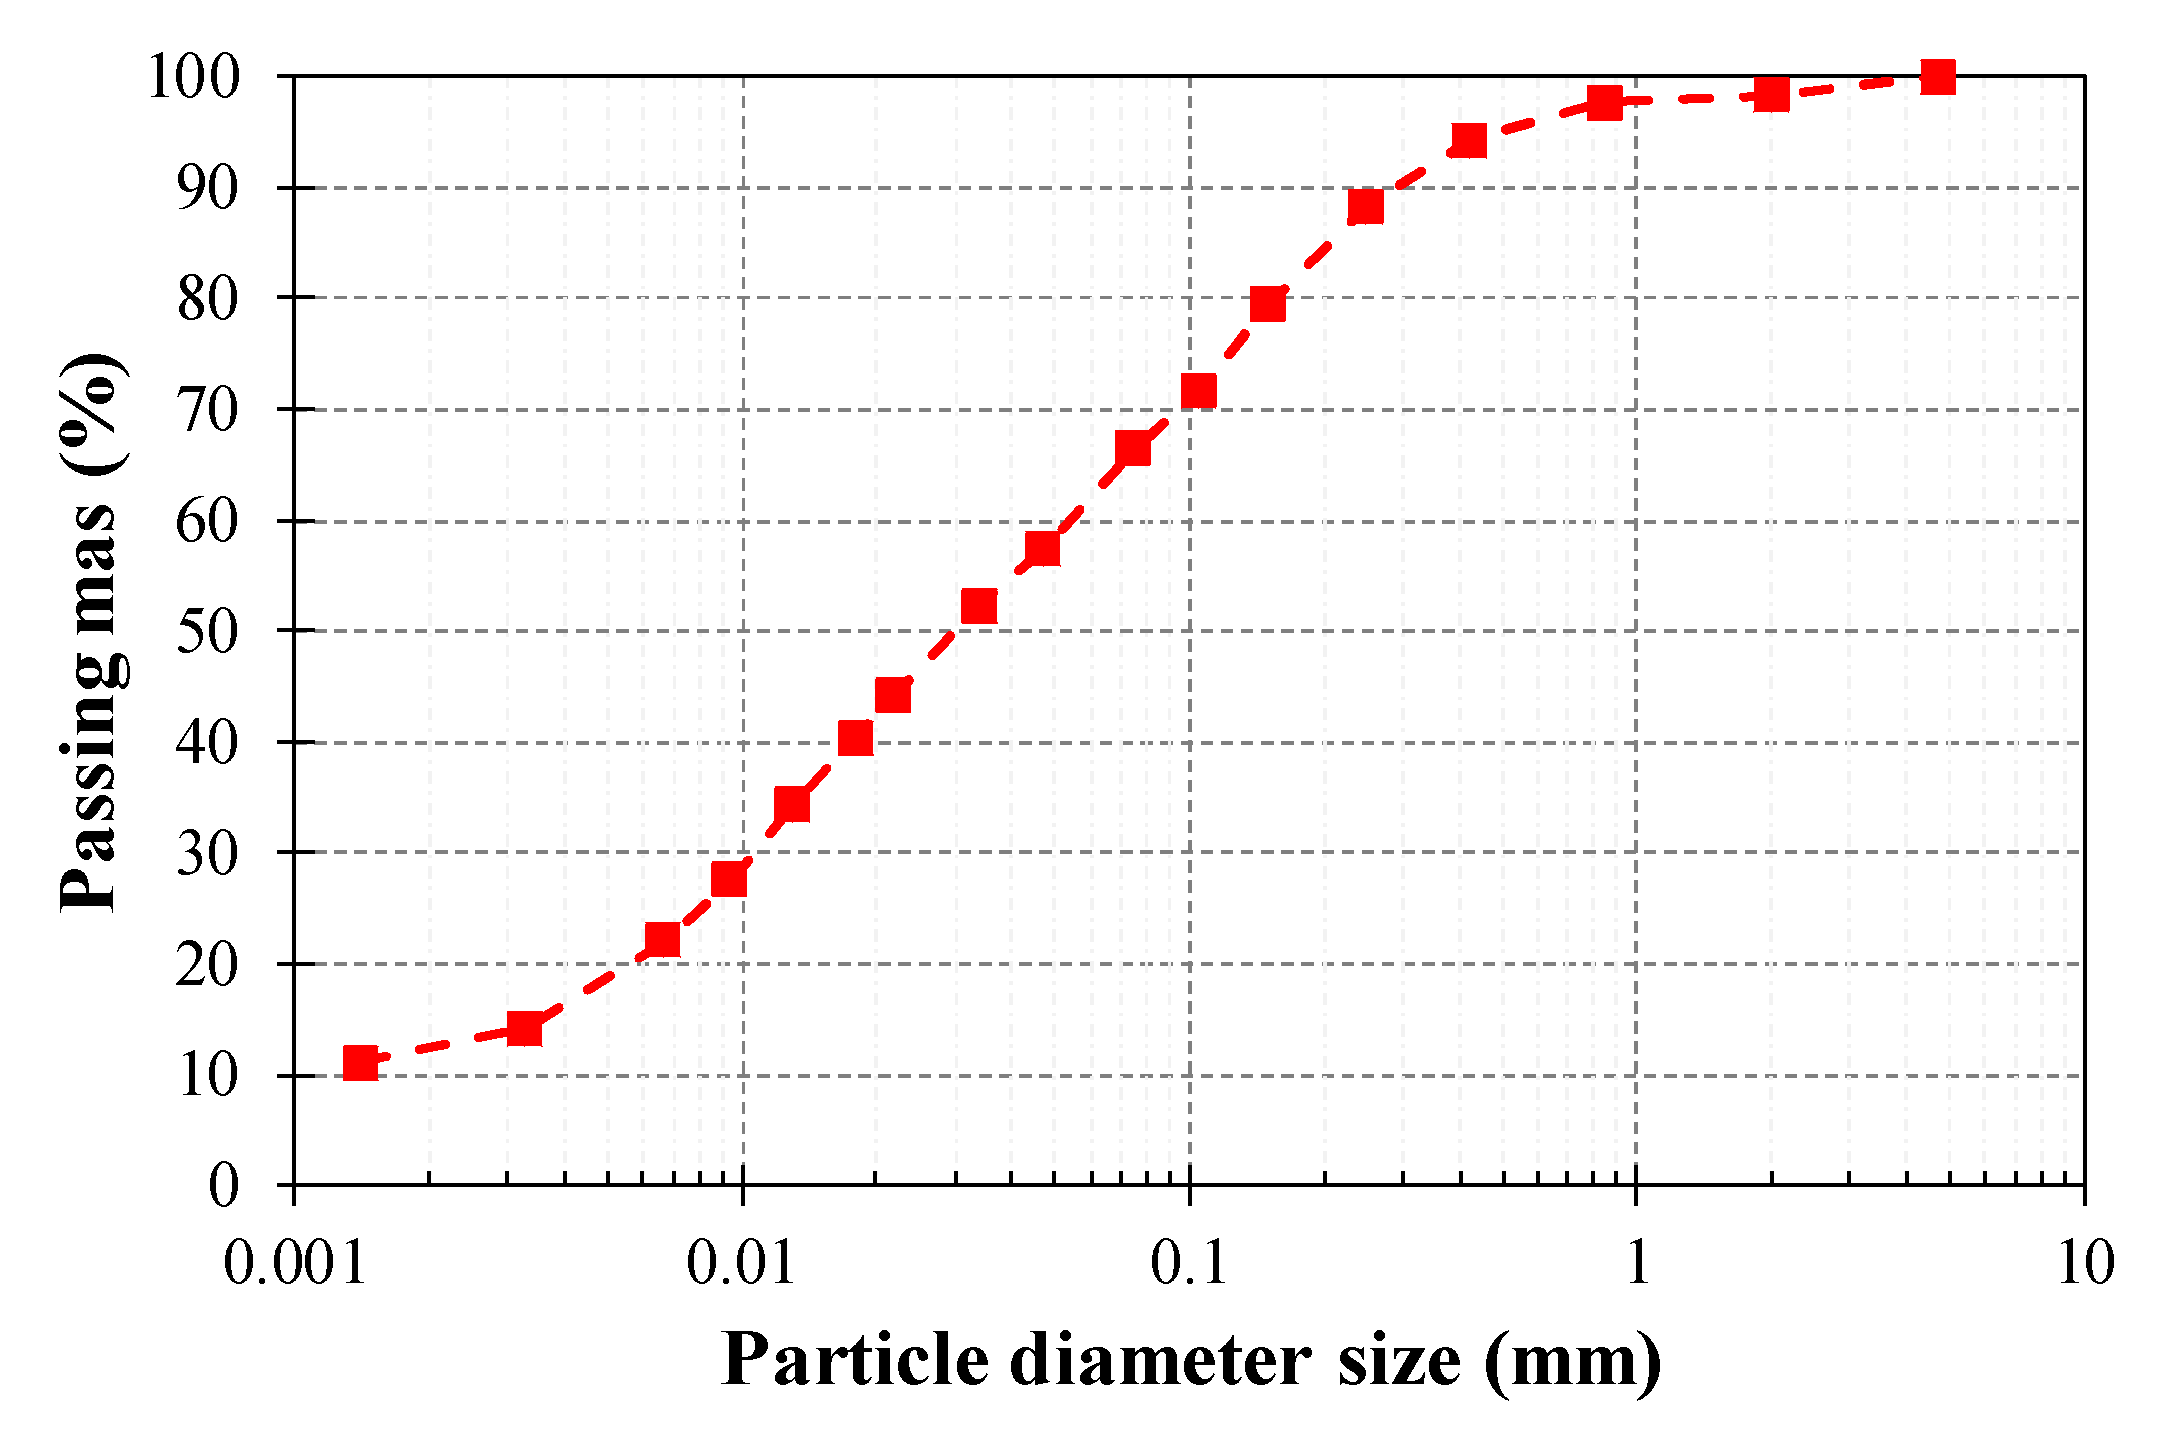
2.1.1. Clayey Soil
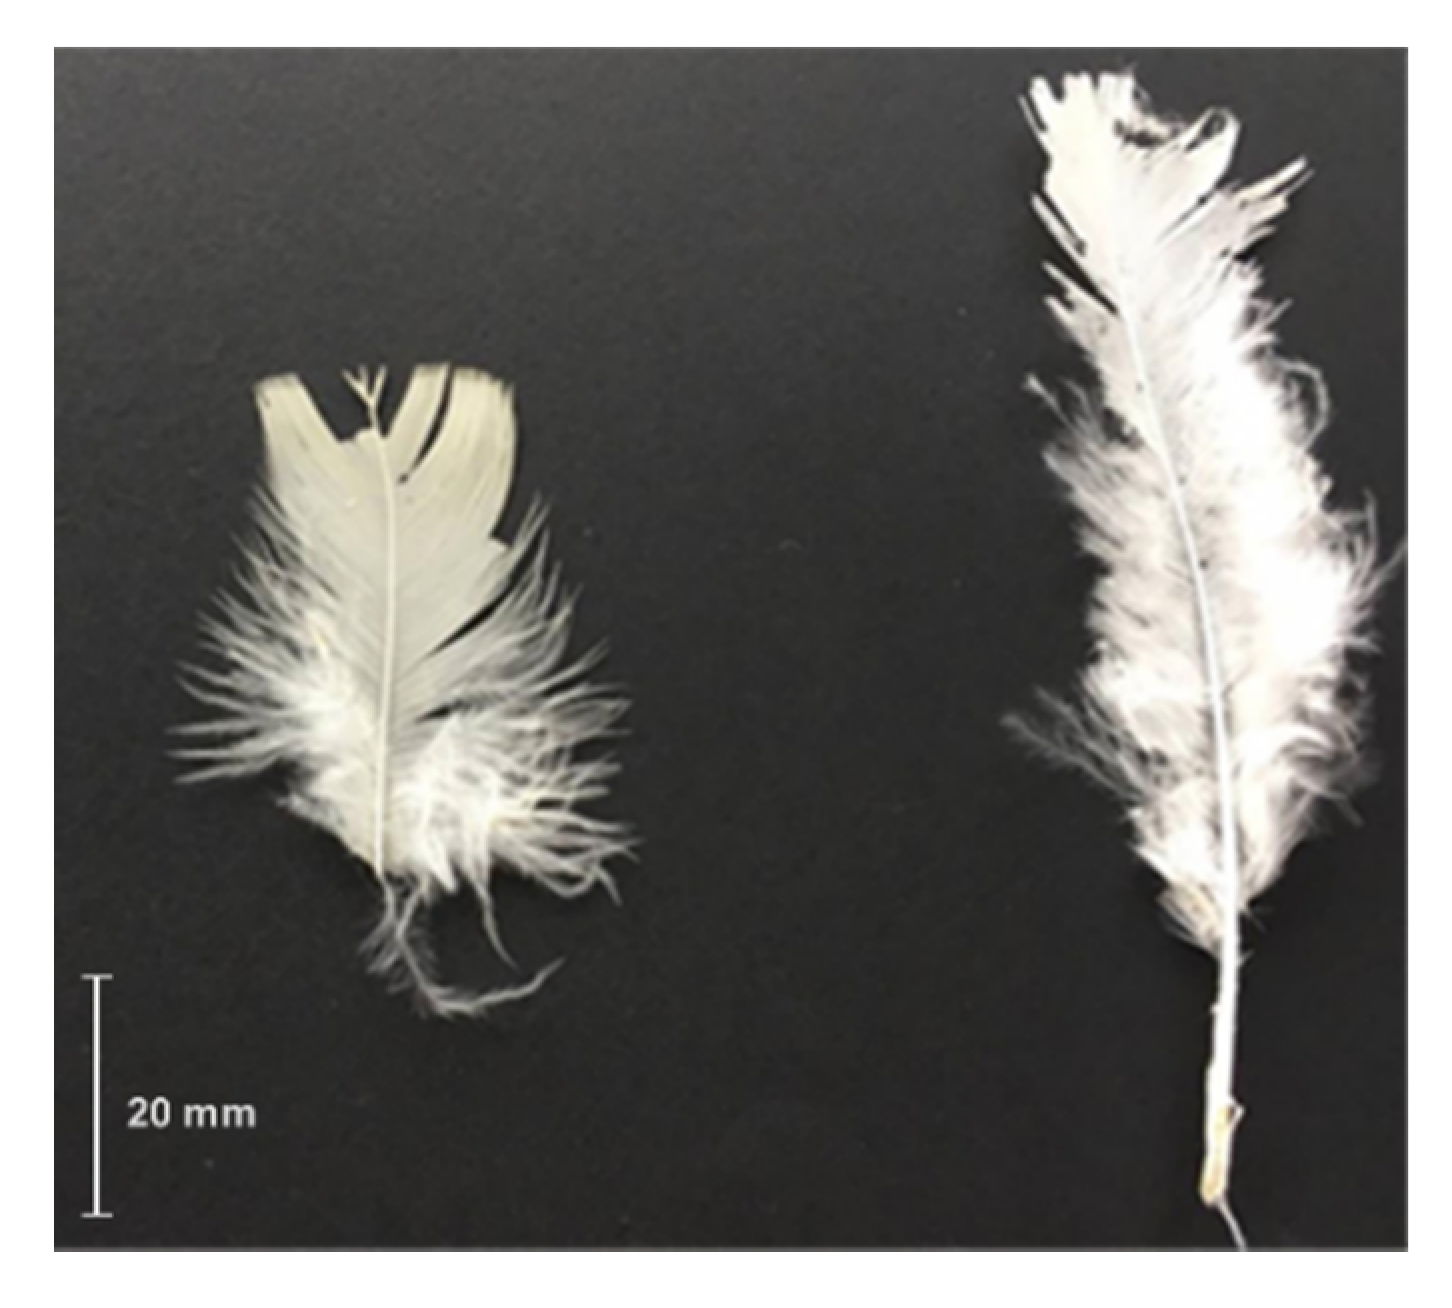
2.1.2. BPFs
2.2. Earthen Mixes and Specimen Preparation
2.3. Test Methods
2.3.1. Capillarity
2.3.2. Compressive and Flexural Strength
2.3.3. Impact Strength
2.3.4. Dry Abrasion Resistance
2.4. Analysis of Variance of Results
3. Experimental Results and Analyses
3.1. Capillarity
3.2. Compressive and Flexural Strength
3.3. Impact Strength
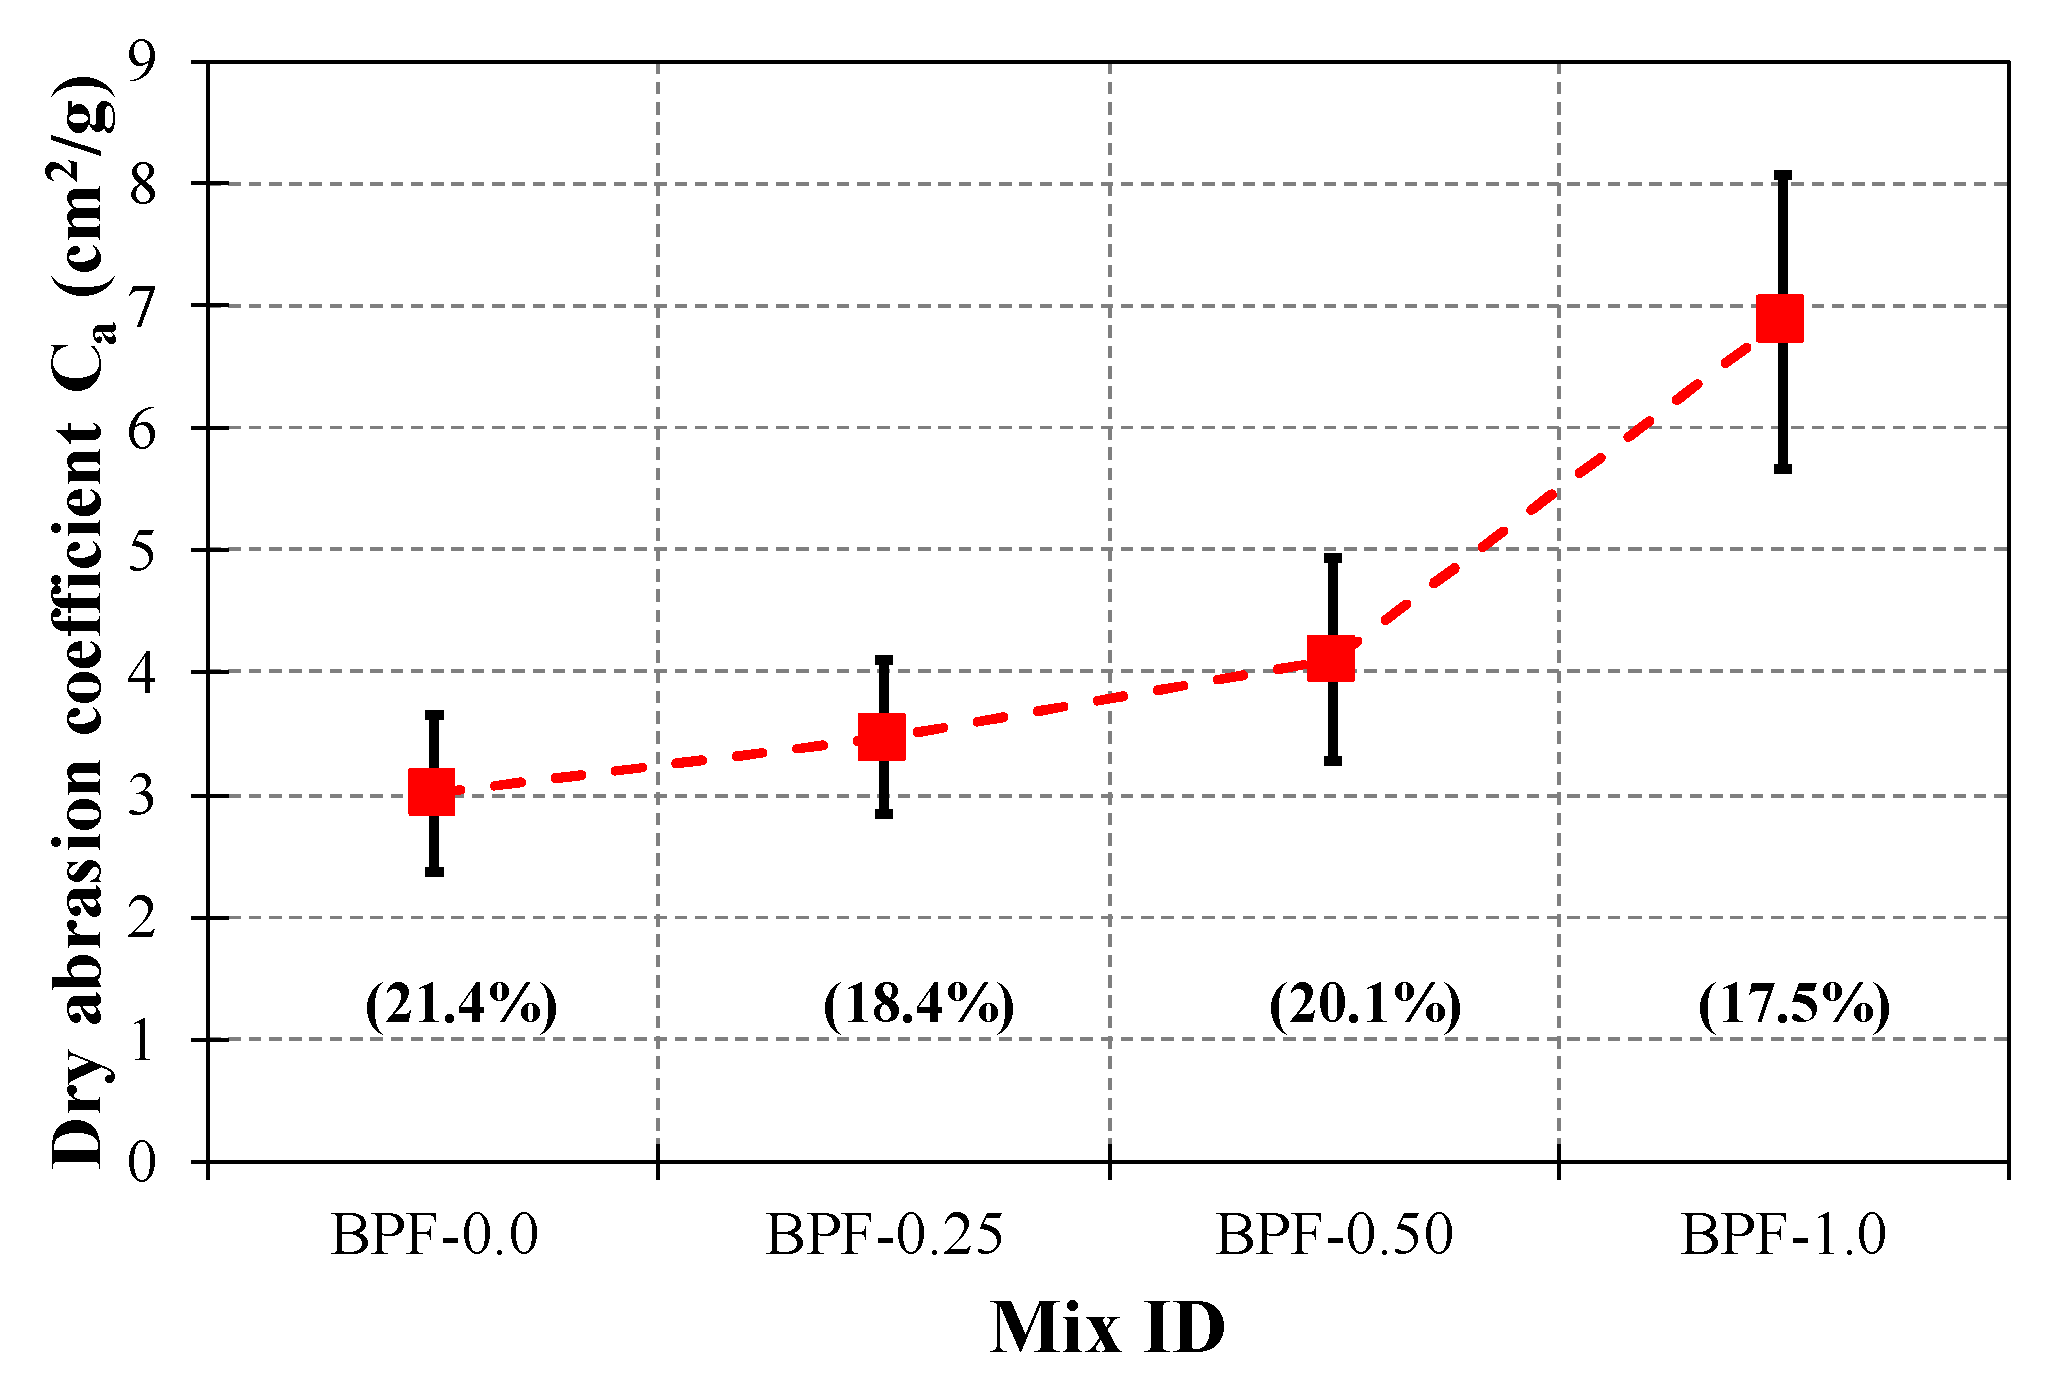
3.4. Dry Abrasion Resistance
4. Conclusions and Comments
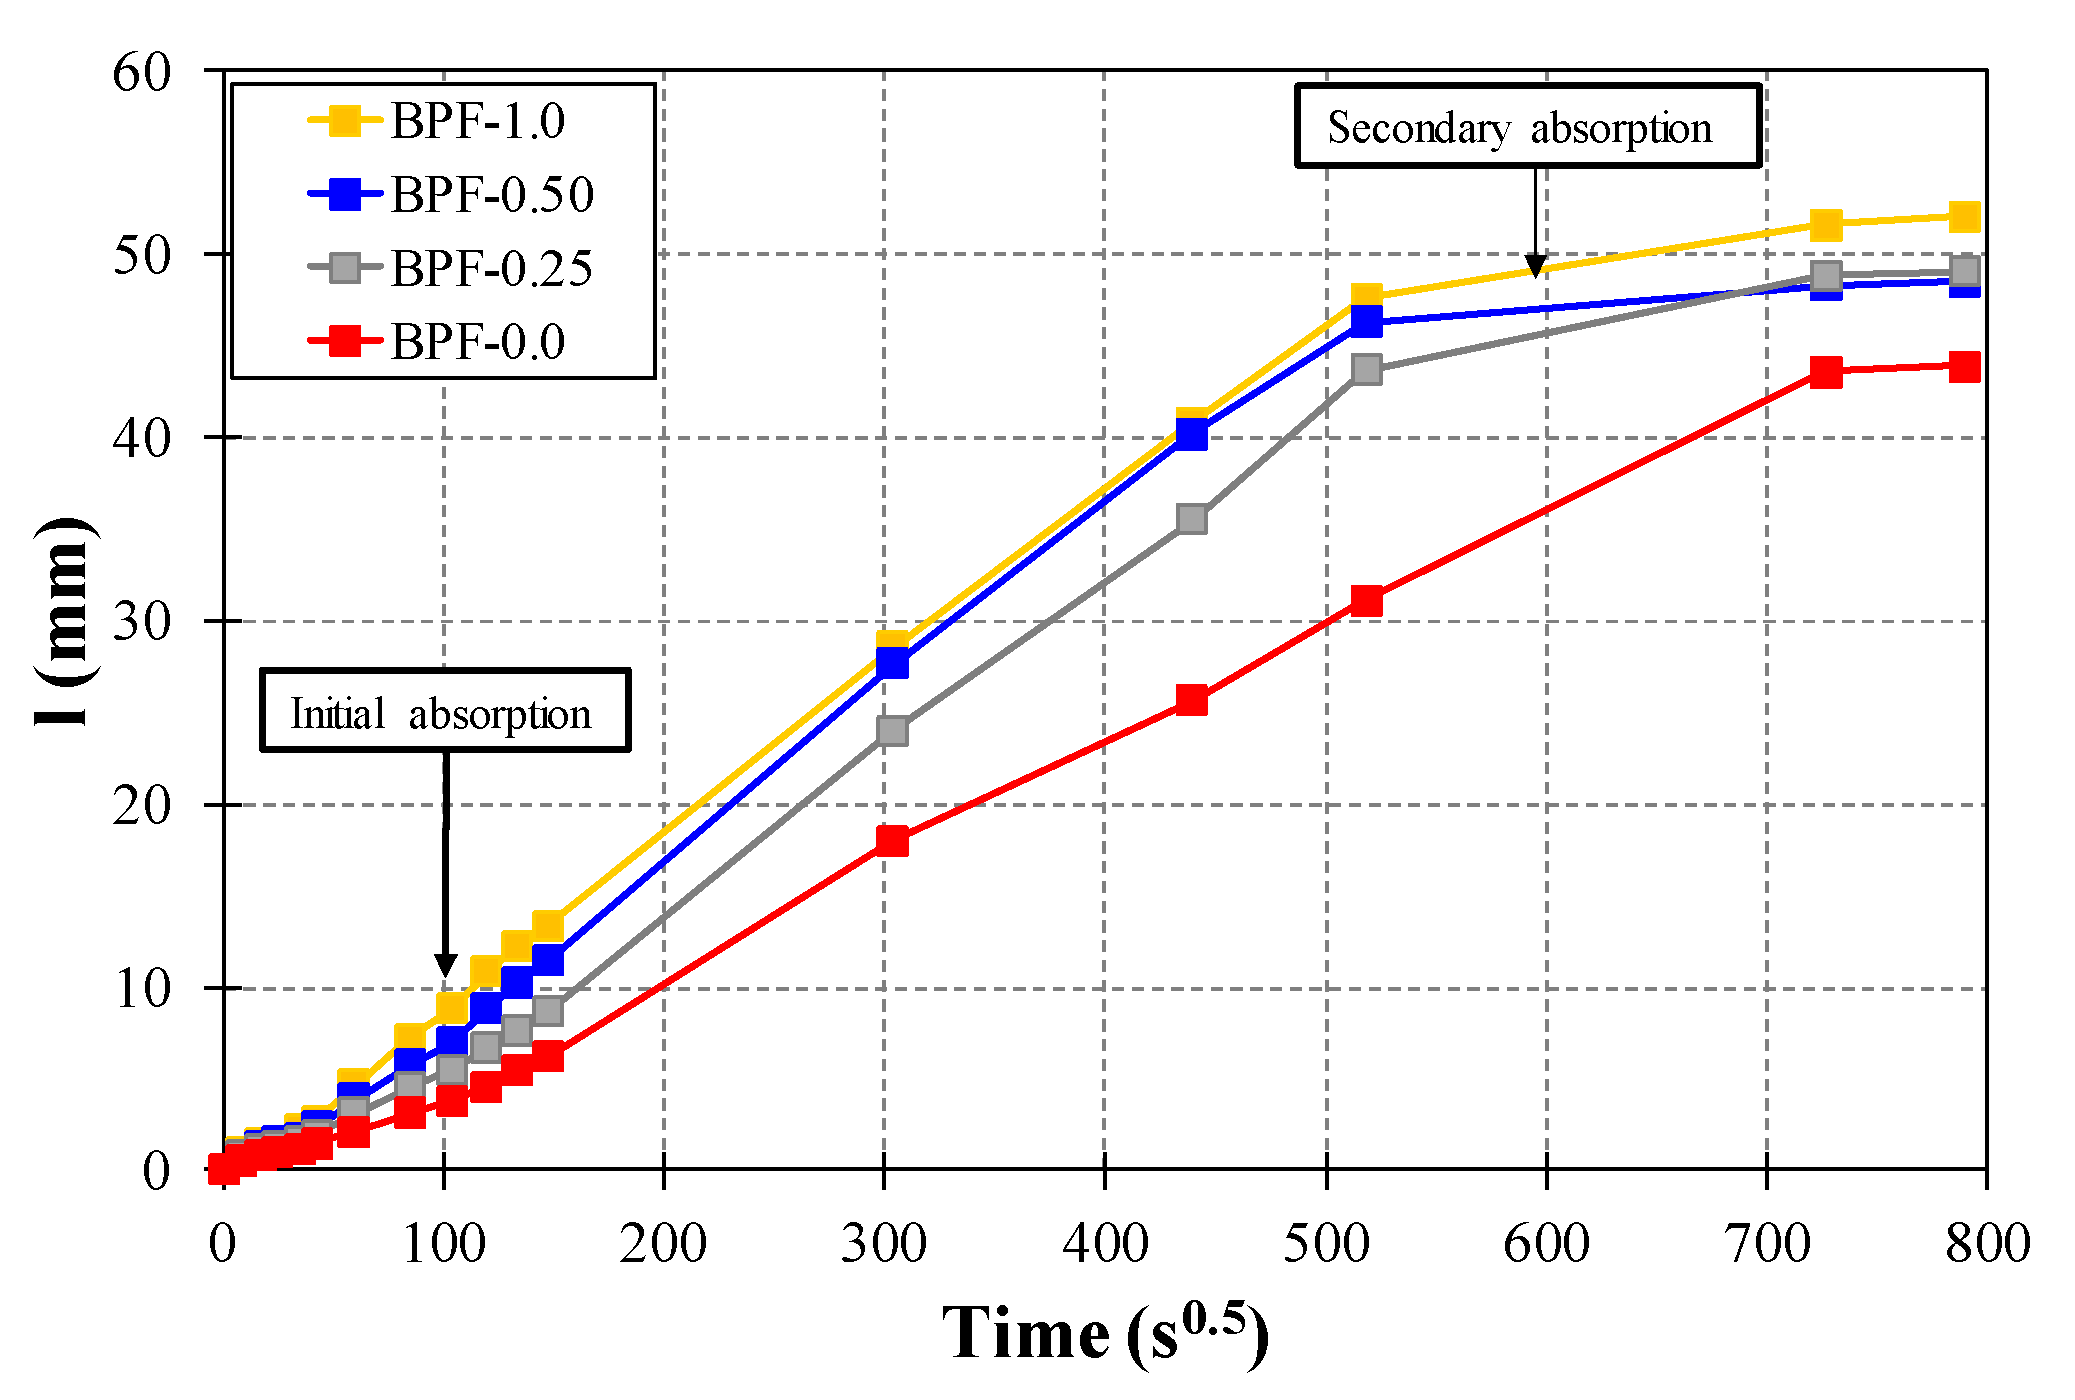
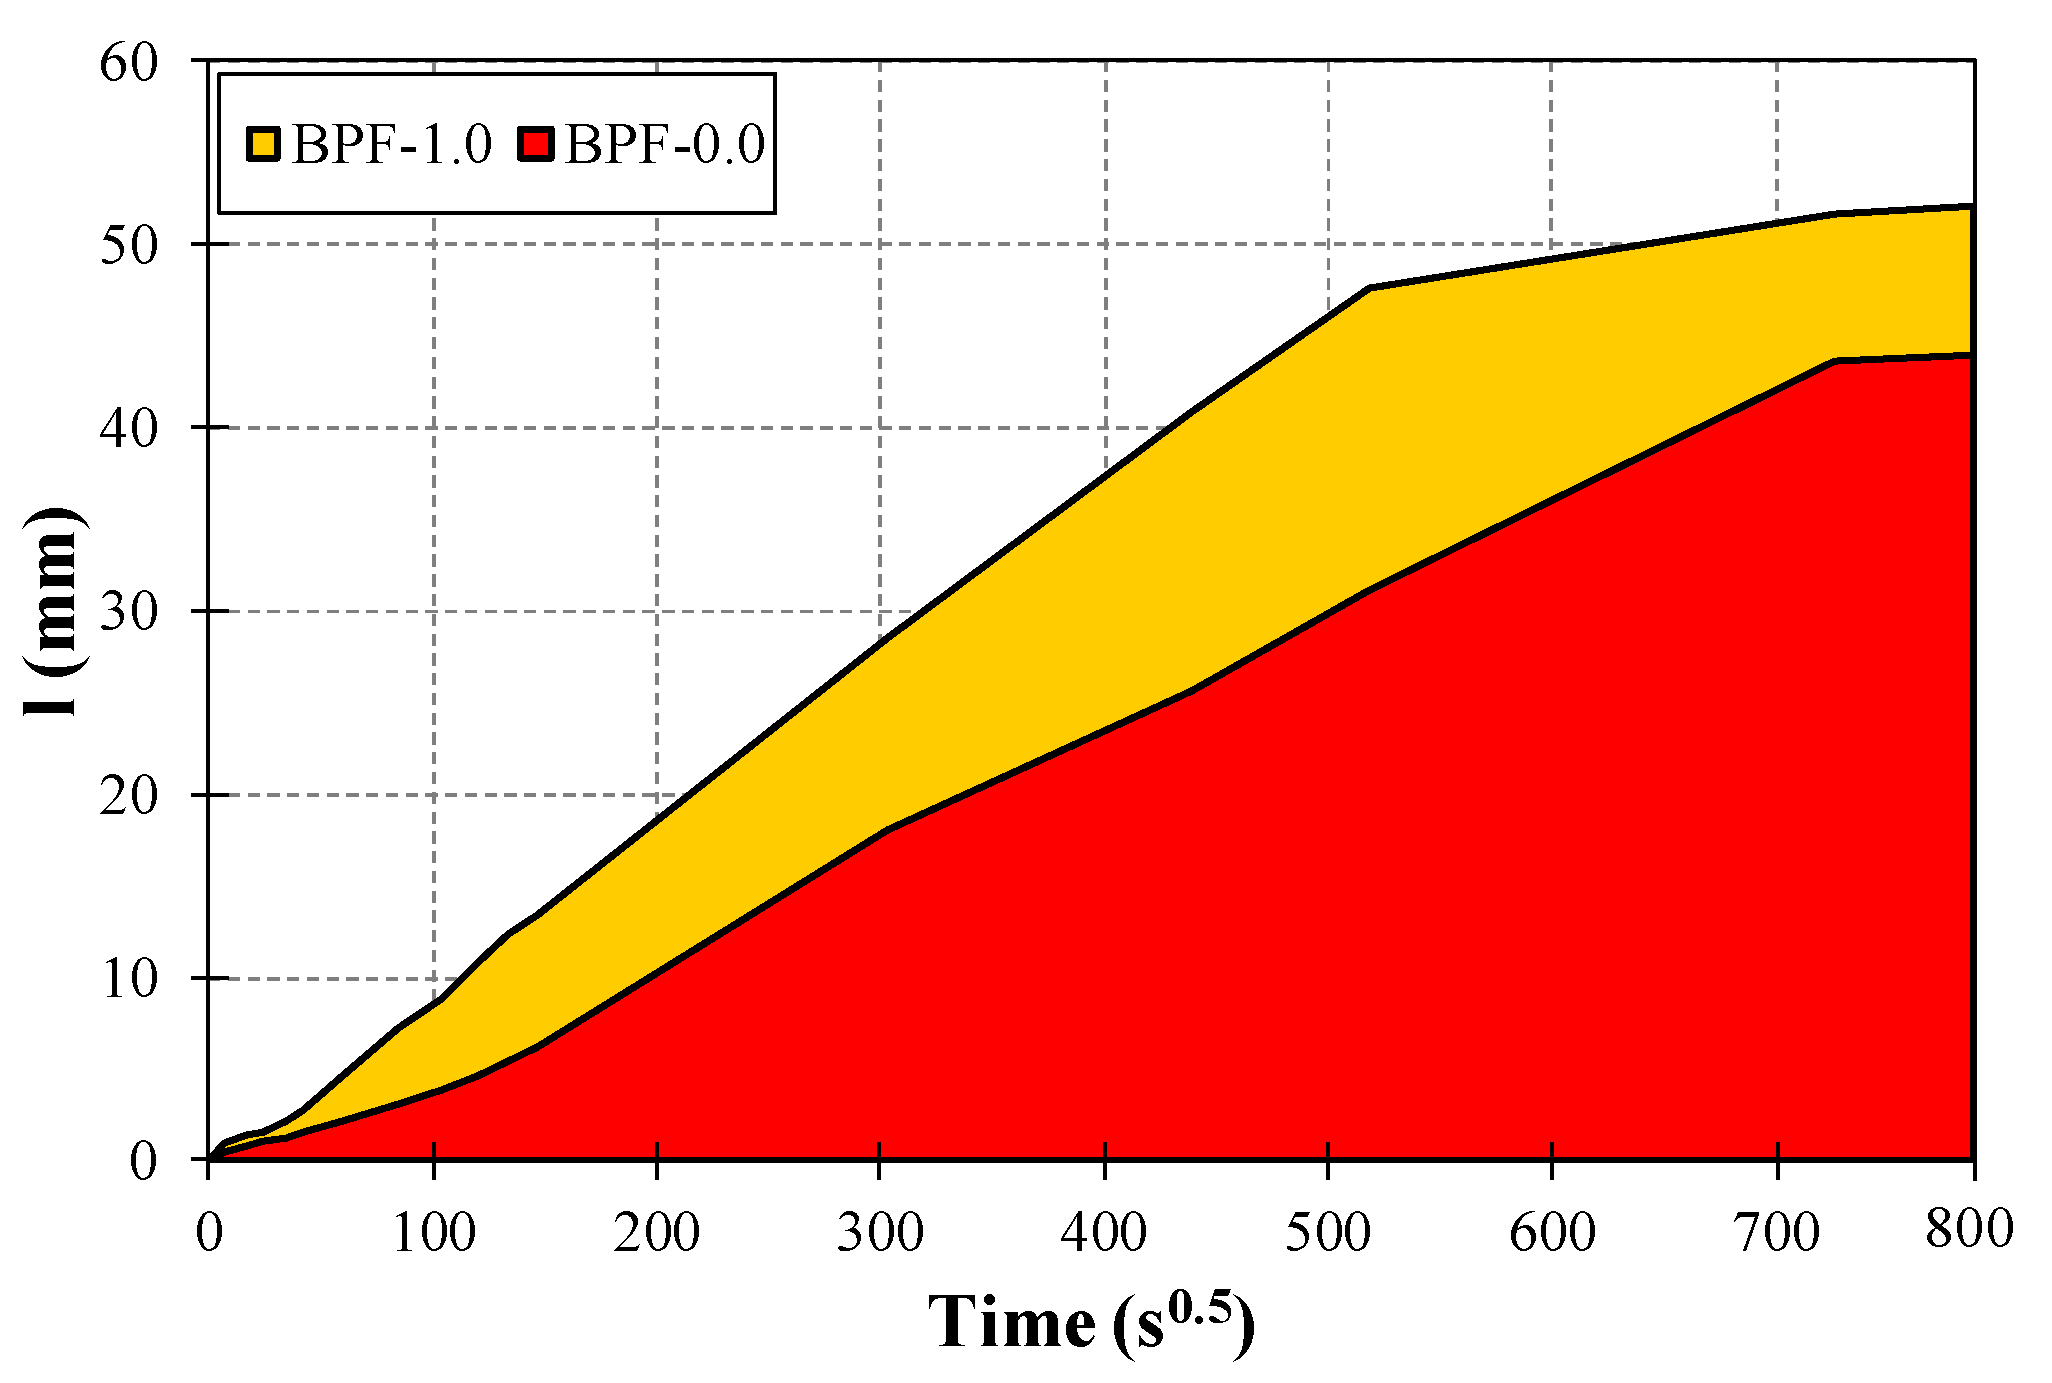
- The capillarity was monotonically increased by the incorporation of BPFs, but this increment was only statistically significant for the BPF-1.0 mix with respect to BPF-0.0. The latter can be explained since the incorporation of BPFs monotonically increased the porosity of the mixes for increasing doses of BPFs (possibly due to the hollow inner structure and keratin nature of the BPFs, the formation of fiber clusters, and/or the generation of small gaps between some parts of the interface between BPFs and the clayey matrix), which facilitated the capillary water rise;
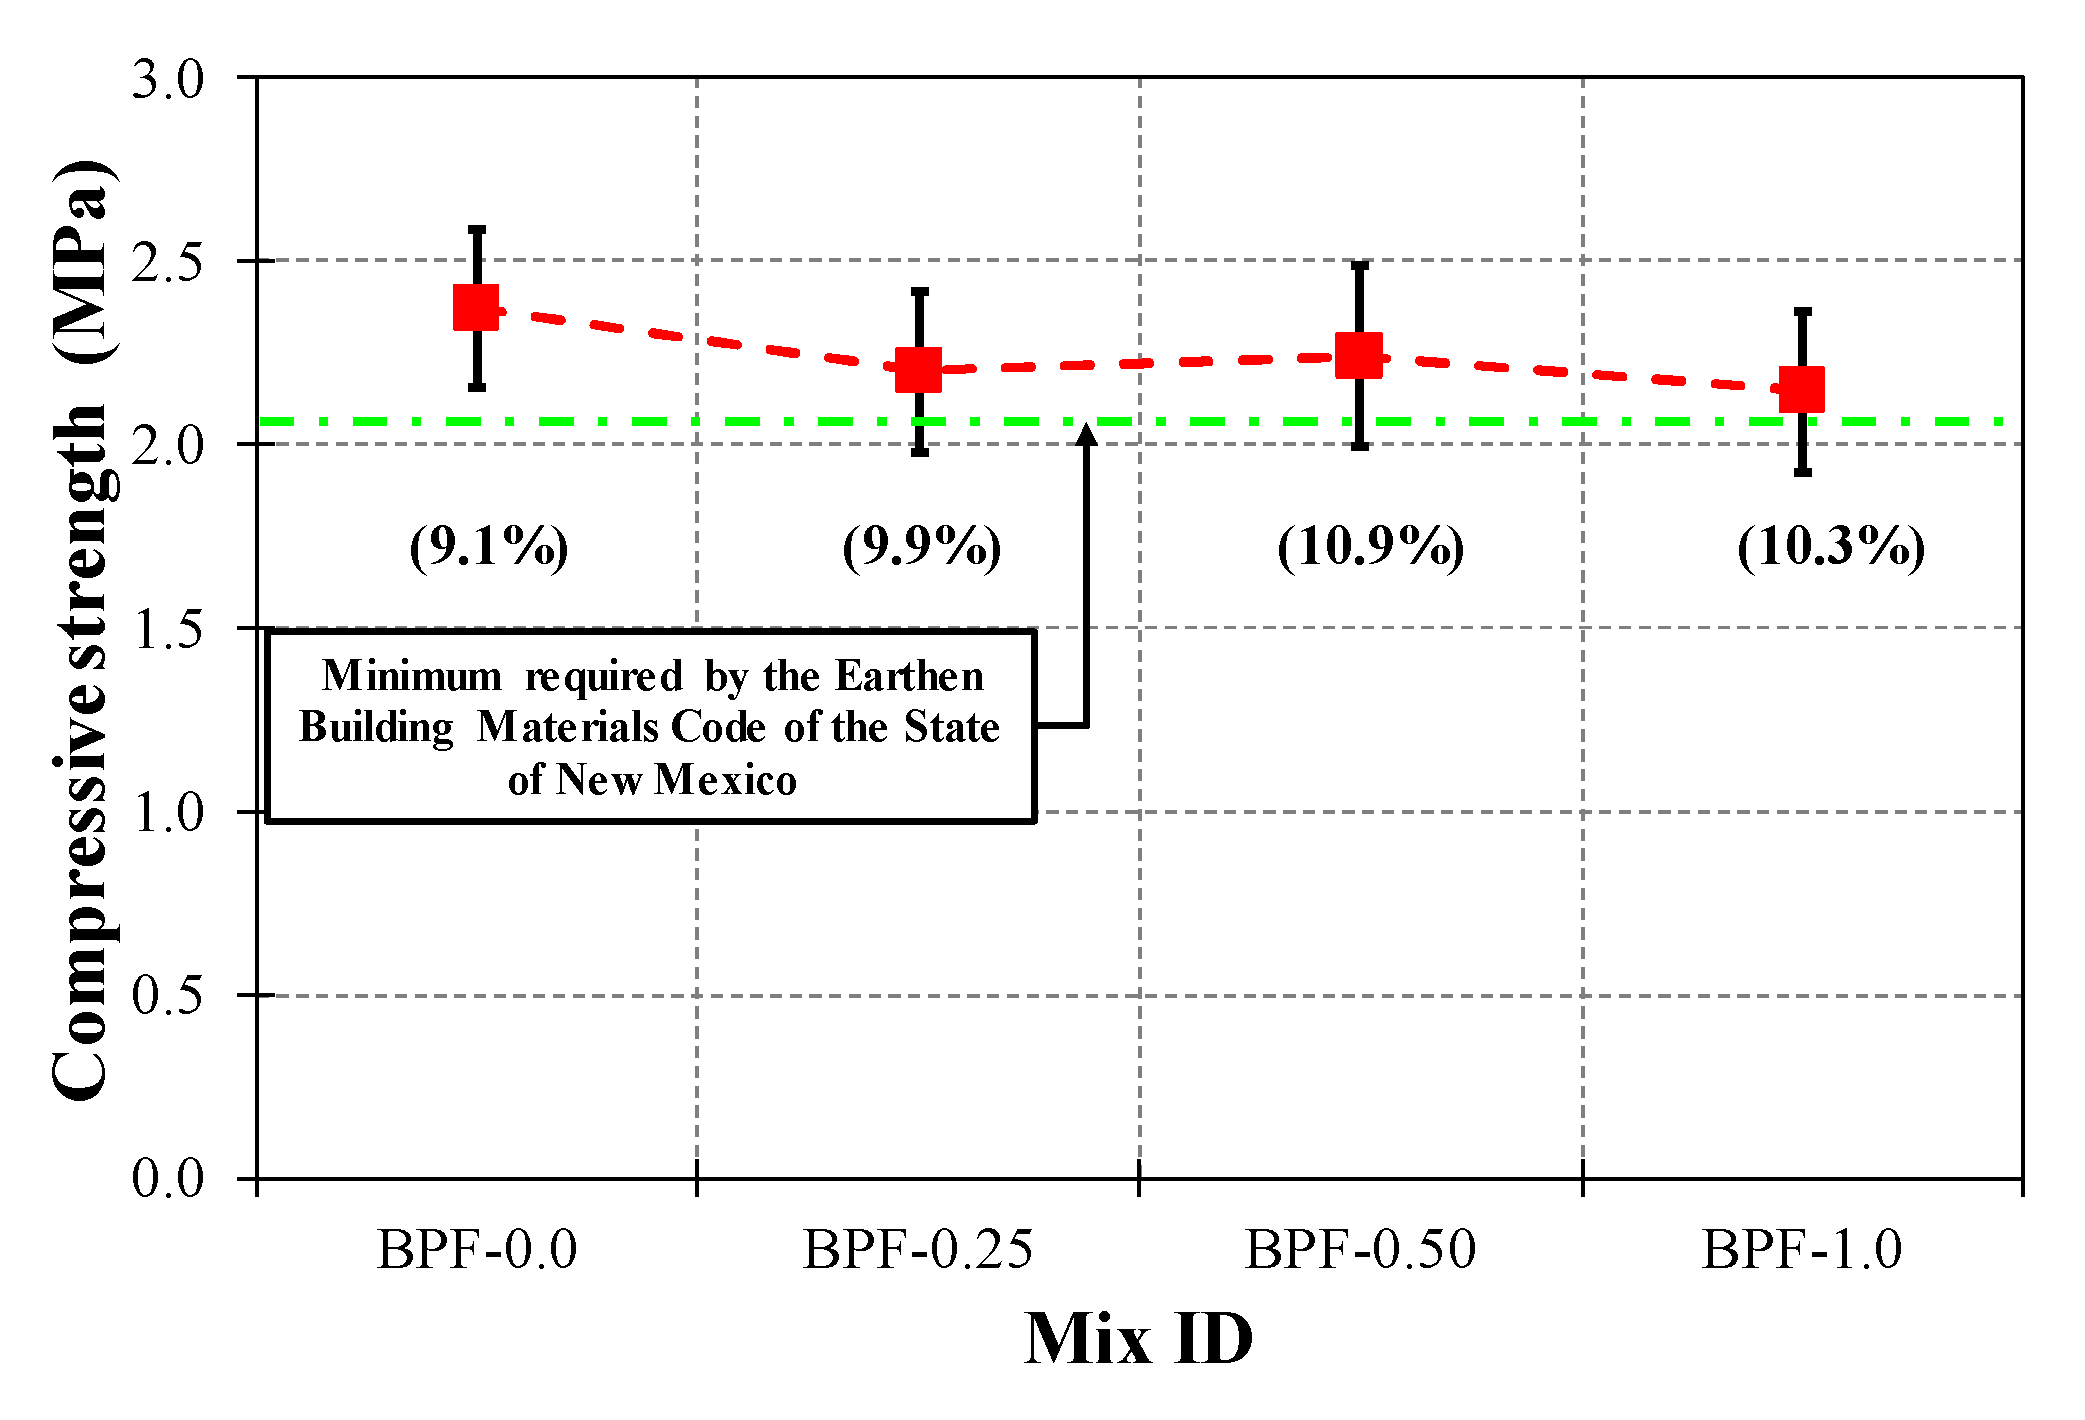
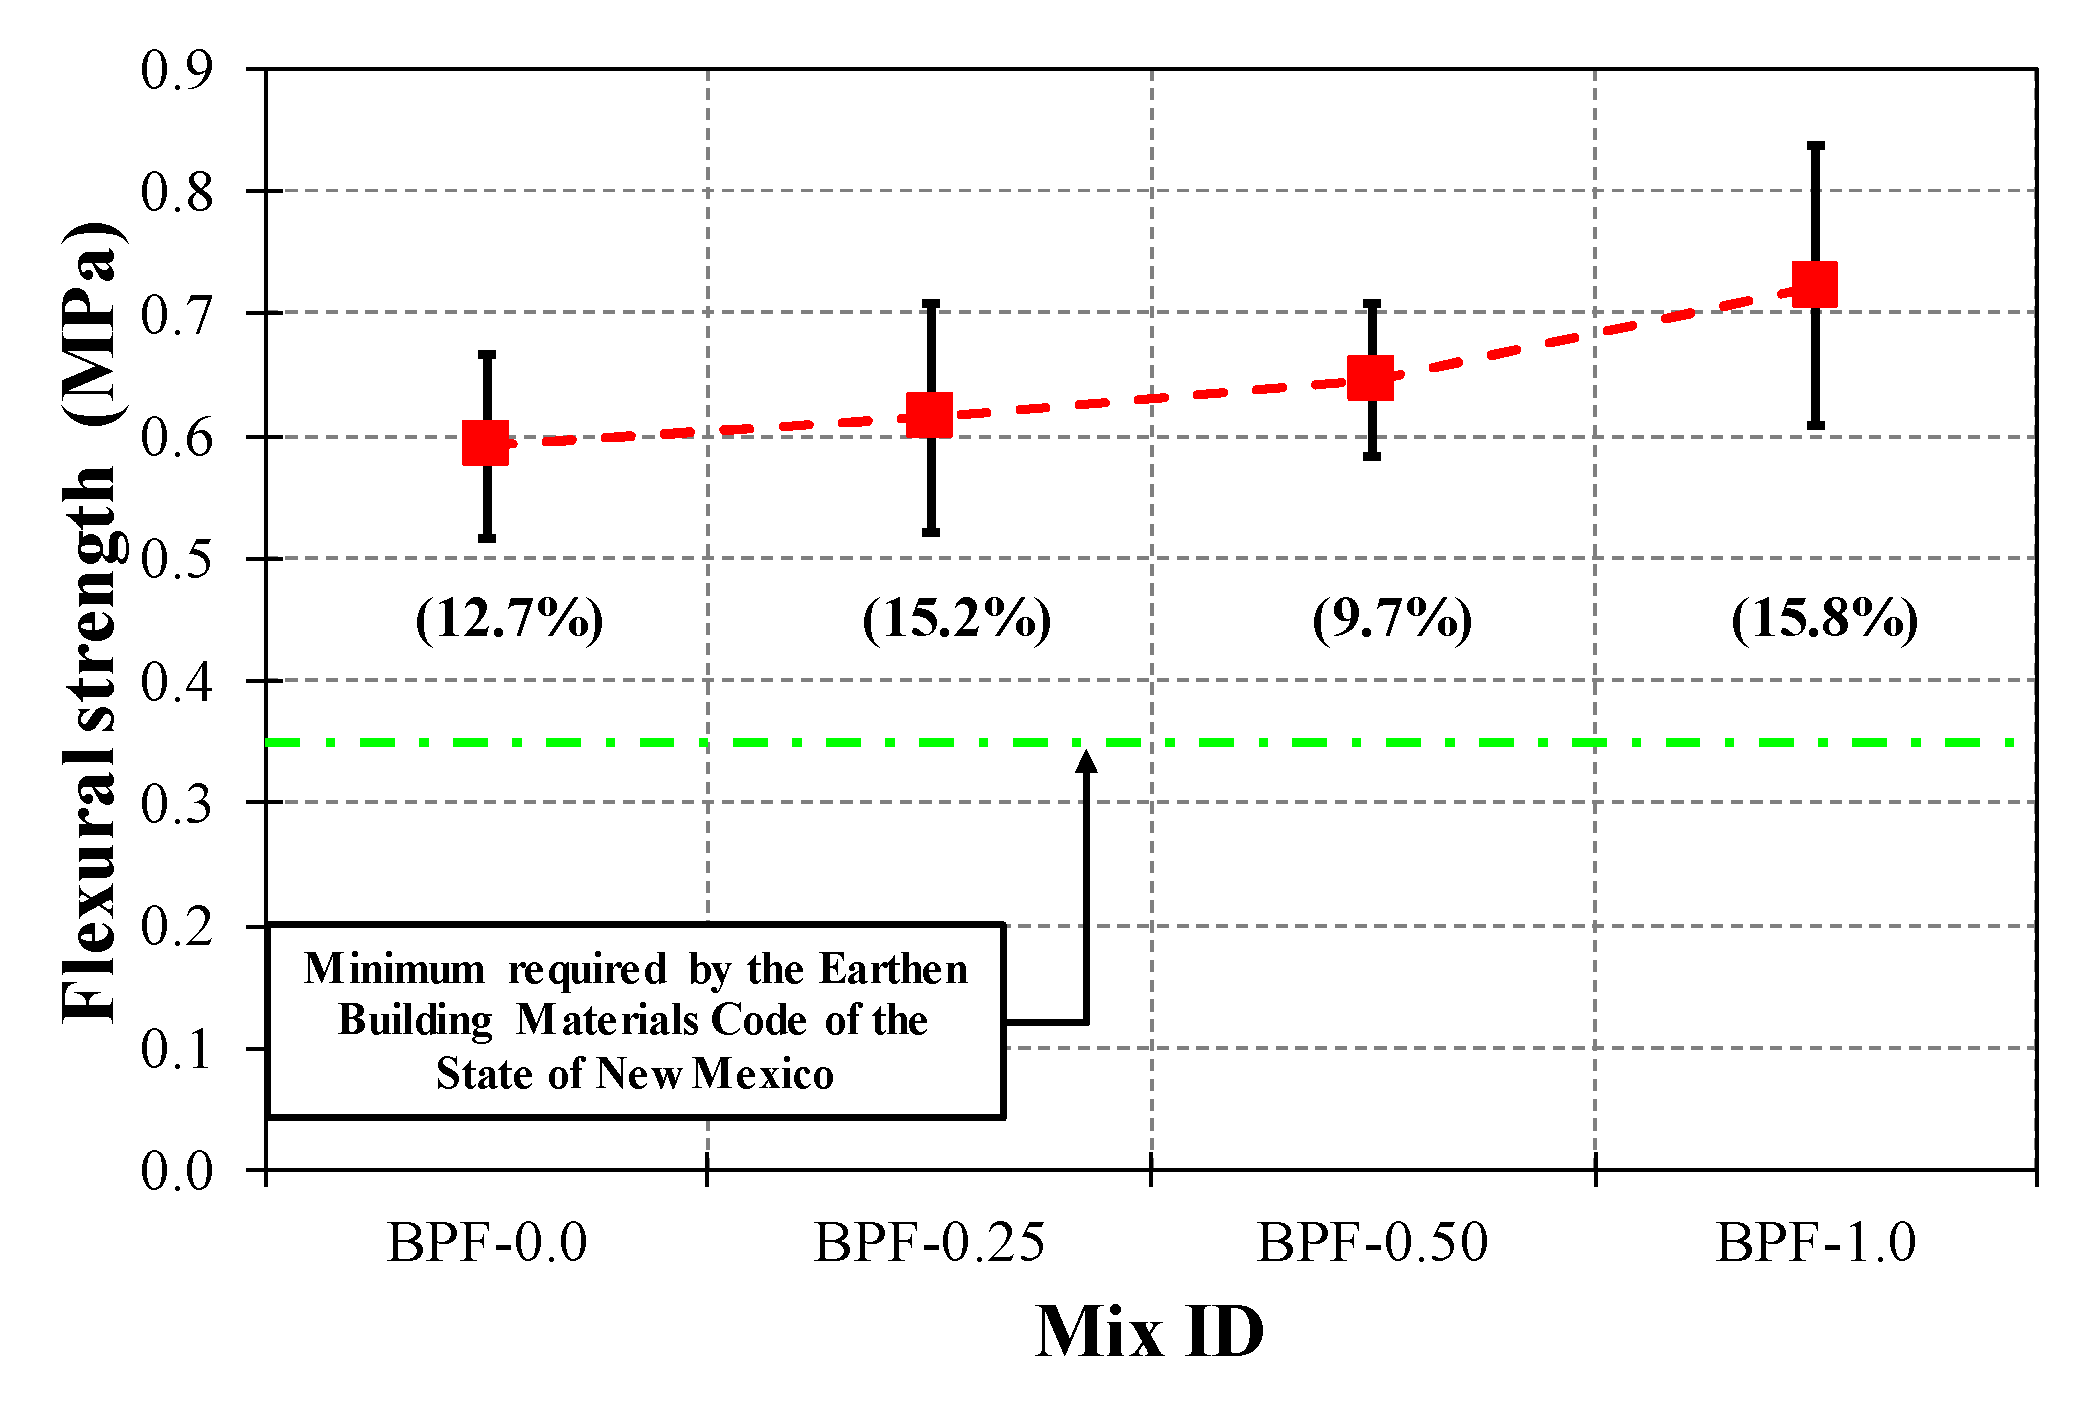
- Even though some variations were observed, the mechanical performance, measured in terms of the compressive and flexural strength, was not statistically modified. This is consistent with previous studies addressing the incorporation of polypropylene micro fibers into earthen mixes, where these micro fibers, when well mixed and in reduced doses, did not significantly affect the mechanical properties. However, as reported in a previous study, the incorporation of BPFs has a positive effect on the post-cracking performance of earthen mixes, especially in terms of the flexural toughness;
- Regarding the impact strength, increasing doses of BPFs monotonically increased both the impact energy at the first crack (e.g., by three times for BPF-1.0 with respect to BPF-0.0) as well as the impact energy at collapse (e.g., by 14 times for BPF-1.0 with respect to BPF-0.0), suggesting that an improved fracture toughness performance can be expected when adding these waste-based fibers. The improvements in impact strength were statistically significant, even for small doses of BPFs (e.g., 0.25%);
- BPFs increased the abrasion resistance of earthen mixes by up to 130% compared to BPF-0.0, but this increase was only statistically significant for BPF-0.5 and BPF-1.0. The latter reflects the need for a minimum dose of BPF to bond with the clayey matrix and significantly impact the abrasion resistance.
Author Contributions
Funding
Acknowledgments
Conflicts of Interest
Abbreviations
| AV | Average |
| BPF | Biopolymer fiber |
| BPF-0.0 | Earthen mix incorporating 0% of BPFs (by weight of clayey soil) |
| BPF-0.25 | Earthen mix incorporating 0.25% of BPFs (by weight of clayey soil) |
| BPF-0.50 | Earthen mix incorporating 0.50% of BPFs (by weight of clayey soil) |
| BPF-1.0 | Earthen mix incorporating 1.0% of BPFs (by weight of clayey soil) |
| CF | Chicken feather |
| CL | Low plasticity clay |
| COV | Coefficient of variation |
| EDS | Energy dispersive X-ray spectroscopy |
| Fcrit | Value of an F-distribution that captures a specific area under the right tail |
| fst | Ratio between mean square (variance) between study groups and mean square (variance) within each study group |
| ID | Identification code |
| SD | Standard deviation |
| SEM | Scanning electron microscopy |
Notation List
| Water absorption rate | |
| Mass variation between two consecutive measurements | |
| Cross section exposed to water absorption | |
| Water density | |
| Porosity | |
| Bulk density | |
| Specific weight of solids | |
| Dry abrasion coefficient | |
| Brushed area | |
| Mass before brushing | |
| Mass after brushing |
References
- Watt Global Media Poultry Trends 2019. Available online: http://www.poultrytrends.com/201911/ (accessed on 11 February 2020).
- USDA. Livestock and Poultry: World Markets and Trade; United States Department of Agriculture and Foreign Agricultural Service: Washington, DC, USA, 2020; Volume 31, pp. 13–14. [CrossRef]
- European Commission Poultry Market Overview. Available online: https://ec.europa.eu/info/sites/info/files/food-farming-fisheries/farming/documents/poultry-meat-dashboard_en.pdf (accessed on 10 February 2020).
- Acda, M. Sustainable use of waste chicken feather for durable and low cost building materials for tropical climates; Sustainable agriculture: Technology, planning and management; Nova Science Publishers: Los Baños, Philippines, 2010; pp. 353–366. ISBN 978-1-60876-269-9. [Google Scholar]
- Tesfaye, T.; Sithole, B.; Ramjugernath, D.; Chunilall, V. Valorisation of chicken feathers: Characterisation of physical properties and morphological structure. J. Clean. Prod. 2017, 149, 349–365. [Google Scholar] [CrossRef]
- Dweib, M.; Hu, B.; O’Donnell, A.; Shenton, H.; Wool, R. All natural composite sandwich beams for structural applications. Compos. Struct. 2004, 63, 147–157. [Google Scholar] [CrossRef]
- Cheng, S.; Lau, K.; Liu, T.; Zhao, Y.; Lam, P.; Yin, Y. Mechanical and thermal properties of chicken feather fiber/PLA green composites. Compos. Part B Eng. 2009, 40, 650–654. [Google Scholar] [CrossRef]
- Tesfaye, T.; Sithole, B.; Ramjugernath, D.; Chunilall, V. Valorisation of chicken feathers: Application in paper production. J. Clean. Prod. 2017, 164, 1324–1331. [Google Scholar] [CrossRef]
- Kalaikumari, S.; Vennila, T.; Monika, V.; Chandraraj, K.; Gunasekaran, P.; Rajendhran, J. Bioutilization of poultry feather for keratinase production and its application in leather industry. J. Clean. Prod. 2019, 208, 44–53. [Google Scholar] [CrossRef]
- Acda, M. Waste chicken feather as reinforcement in cement-bonded composites. Philipp. J. Sci. 2010, 139, 161–166. [Google Scholar]
- Cao, L.; Shi, X.; Liu, X.; Wu, J. Laboratory study on the properties of plastering mortar modified by feather fibers. Sci. Eng. Compos. Mater. 2013, 20, 293–299. [Google Scholar] [CrossRef]
- Montes-Zarazúa, E.; Colín-Cruz, A.; Pérez-Rea, M.; Icaza, M.; Velasco-Santos, C.; Martínez-Hernández, A. Effect of keratin structures from chicken feathers on expansive soil remediation. Adv. Mater. Sci. Eng. 2015, 2015, 1–10. [Google Scholar] [CrossRef] [Green Version]
- Parkinson, G. Chementator: A higher use for lowly chicken feathers. Chem. Eng. 1998, 105, 21. [Google Scholar]
- Gassner, G., III; Schmidt, W.; Line, M.; Thomas, C.; Waters, R. Fiber and Fiber Products Produced from Feathers. U.S. Patent 5705030A, 1998. [Google Scholar]
- Khosa, M.; Ullah, A. A Sustainable Role of Keratin Biopolymer in Green Chemistry: A Review. J. Food. Process. Beverages. 2013, 1, 1–8. [Google Scholar] [CrossRef]
- Poole, A.; Church, J.; Huson, M. Environmentally sustainable fibers from regenerated protein. Biomacromolecules 2009, 10, 1–8. [Google Scholar] [CrossRef] [PubMed]
- He, M.; Chen, M.; Dou, Y.; Ding, J.; Yue, H.; Yin, G.; Chen, X.; Cui, Y. Electrospun Silver Nanoparticles-Embedded Feather Keratin/Poly(vinyl alcohol)/Poly(ethylene oxide) Antibacterial Composite Nanofibers. Polymers 2020, 12, 305. [Google Scholar] [CrossRef] [PubMed] [Green Version]
- Chen, X.; Wu, S.; Yi, M.; Ge, J.; Yin, G.; Li, X. Preparation and physicochemical properties of blend films of feather keratin and poly (vinyl alcohol) compatibilized by tris (hydroxymethyl) aminomethane. Polymers 2018, 10, 1054. [Google Scholar] [CrossRef] [PubMed] [Green Version]
- El-Hawary, M.; Hamoush, S. Strength of concrete reinforced with treated feathers. Constr. Build. Mater. 1994, 8, 173–176. [Google Scholar] [CrossRef]
- Huda, S.; Yang, Y. Feather fiber reinforced light-weight composites with good acoustic properties. J. Polym. Environ. 2009, 17, 131–142. [Google Scholar] [CrossRef]
- He, M.; Zhang, B.; Dou, Y.; Yin, G.; Cui, Y. Blend modification of feather keratin-based films using sodium alginate. J. Appl. Polym. Sci. 2017, 134, 1–8. [Google Scholar] [CrossRef]
- Wang, B.; Yang, W.; McKittrick, J.; Meyers, M. Keratin: Structure, mechanical properties, occurrence in biological organisms, and efforts at bioinspiration. Prog. Mater. Sci. 2016, 76, 229–318. [Google Scholar] [CrossRef] [Green Version]
- Aranberri, I.; Montes, S.; Azcune, I.; Rekondo, A.; Grande, H. Flexible Biocomposites with Enhanced Interfacial Compatibility Based on Keratin Fibers and Sulfur-Containing Poly (urea-urethane) s. Polymers 2018, 10, 1056. [Google Scholar] [CrossRef] [Green Version]
- Donato, R.; Mija, A. Keratin Associations with Synthetic, Biosynthetic and Natural Polymers: An Extensive Review. Polymers 2020, 12, 32. [Google Scholar] [CrossRef] [Green Version]
- Western Oregon University Online Chemistry Textbooks: ch450 and ch451: Biochemistry—Defining Life at the Molecular Level. Available online: https://wou.edu/chemistry/courses/online-chemistry-textbooks/ch450-and-ch451-biochemistry-defining-life-at-the-molecular-level/chapter-2-protein-structure/ (accessed on 19 February 2020).
- Uzun, M.; Sancak, E.; Patel, I.; Usta, I.; Akalin, M.; Yuksek, M. Mechanical behaviour of chicken quills and chicken feather fibres reinforced polymeric composites. Arch. Mater. Sci. Eng. 2011, 52, 82–86. [Google Scholar]
- Subramani, T.; Krishnan, S.; Ganesan, S.; Nagarajan, G. Investigation of Mechanical Properties in Polyester and Phenyl- ester Composites Reinforced with Chicken Feather Fiber. Int. J. Eng. Res. Appl. 2014, 4, 93–104. [Google Scholar]
- Zhang, T.; Dieckmann, E.; Song, S.; Xie, J.; Yu, Z.; Cheeseman, C. Properties of magnesium silicate hydrate (M-S-H) cement mortars containing chicken feather fibres. Constr. Build. Mater. 2018, 180, 692–697. [Google Scholar] [CrossRef]
- Görgün, B.; Bozkurt, E.; Gökdag, D.; Borazan, A.; Ural, N. Evaluation of Waste Chicken Feather in Soil Improvement. BSEU. J. Sci. 2018, 5, 89–96. [Google Scholar]
- Llanque, R.; Carvalho, J.; Martínez-Hernández, A. Melhoria de solos com fibras naturais–penas de frango. In Proceedings of the XVIII Congresso Brasileiro Mecânica Dos Solos e Eng, Geotécnica, Belo Horizonte, Brasil, 19–22 October 2016. [Google Scholar]
- Minke, G. Building with Earth: Design and Technology of a Sustainable Architecture; Birkhäuser–Publishers for Architecture: Basel, Switzerland; Berlin, Germany; Boston, MA, USA, 2006; ISBN 978-3-7643-7477-8. [Google Scholar]
- Cataldo-Born, M.; Araya-Letelier, G.; Pabón, C. Obstacles and motivations for earthbag social housing in Chile: Energy, environment, economic and codes implications. Rev. de la Construcción 2016, 15, 17–26. [Google Scholar] [CrossRef]
- Millogo, Y.; Morel, J.; Aubert, J.; Ghavami, K. Experimental analysis of Pressed Adobe Blocks reinforced with Hibiscus cannabinus fibers. Constr. Build. Mater. 2014, 52, 71–78. [Google Scholar] [CrossRef]
- Araya-Letelier, G.; Concha-Riedel, J.; Antico, F.; Valdés, C.; Cáceres, G. Influence of natural fiber dosage and length on adobe mixes damage-mechanical behavior. Constr. Build. Mater. 2018, 174, 645–655. [Google Scholar] [CrossRef]
- Araya-Letelier, G.; Gonzalez-Calderon, H.; Kunze, S.; Burbano-Garcia, C.; Reidel, U.; Sandoval, C.; Bas, F. Waste-based natural fiber reinforcement of adobe mixtures: Physical, mechanical, damage and durability performance assessment. J. Clean. Prod. 2020, 273, 122806. [Google Scholar] [CrossRef]
- ASTM D6913-17 Standard Test Methods for Particle-Size Distribution (Gradation) of Soils Using Sieve, USA, 2017. Available online: https://www.astm.org/Standards/D6913.htm (accessed on 4 February 2020).
- ASTM D7928-17 Standard Test Method for Particle-Size Distribution (Gradation) of Fine-Grained Soils Using the Sedimentation (Hydrometer) Analysis, USA, 2017. Available online: https://www.astm.org/Standards/D7928.htm (accessed on 4 February 2020).
- ASTM D4318-17 Standard Test Methods for Liquid Limit, Plastic Limit, and Plasticity Index of Soils, USA, 2017. Available online: https://www.astm.org/Standards/D4318 (accessed on 4 February 2020).
- ASTM D2487-17 Standard Practice for Classification of Soils for Engineering Purposes (Unified Soil Classification System), USA, 2017. Available online: https://www.astm.org/Standards/D2487.htm (accessed on 4 February 2020).
- Dalhat, M.; Osman, S.; Alhuraish, A.; Almarshad, F.; Qarwan, S.; Adesina, A. Chicken Feather fiber modified hot mix asphalt concrete: Rutting performance, durability, mechanical and volumetric properties. Constr. Build. Mater. 2020, 239, 117849. [Google Scholar] [CrossRef]
- Reddy, N.; Yang, Y. Structure and properties of chicken feather barbs as natural protein fibers. J. Polym. Environ. 2007, 15, 81–87. [Google Scholar] [CrossRef] [Green Version]
- Miller, A.; Spragg, R.; Antico, F.; Ashraf, W.; Barrett, T.; Behnood, A.; Bu, Y.; Chiu, Y.; Desta, B.; Farnam, Y.; et al. Determining the Moisture Content of Pre-Wetted Lightweight Aggregate: Assessing the Variability of the Paper Towel and Centrifuge Methods. In Proceedings of the 4th International Conference on the Durability of Concrete Structures, Purdue University, West Lafayette, IN, USA, 24–26 July 2014; pp. 312–316. [Google Scholar]
- Araya-Letelier, G.; Antico, F.; Parra, P.; Carrasco, M. Fiber-Reinforced Mortar Incorporating Pig Hair. Adv. Eng. Forum 2017, 21, 219–225. [Google Scholar] [CrossRef]
- Araya-Letelier, G.; Antico, F.; Carrasco, M.; Rojas, P.; García-Herrera, C. Effectiveness of new natural fibers on damage-mechanical performance of mortar. Constr. Build. Mater. 2017, 152, 672–682. [Google Scholar] [CrossRef]
- Zhan, M.; Wool, R. Mechanical Properties of Chicken Feather Fibers. Polym. Compos. 2011, 32, 937–944. [Google Scholar] [CrossRef]
- SENCICO Norma Técnica Peruana, E.080 Diseño y Construcción con Tierra Reforzada, Perú, 2017. Available online: http://www3.vivienda.gob.pe/dgprvu/docs/TITULO_III_EDIFICACIONES/III.2%20ESTRUCTURAS/E.080%20ADOBE.pdf (accessed on 3 December 2019).
- Delgado, C.; Guerrero, I. The selection of soils for unstabilised earth building: A normative review. Constr. Build. Mater. 2007, 21, 237–251. [Google Scholar] [CrossRef]
- Araya-Letelier, G.; Concha-Riedel, J.; Antico, F.; Sandoval, S. Experimental mechanical-damage assessment of earthen mixes reinforced with micro polypropylene fibers. Constr. Build. Mater. 2019, 198, 762–776. [Google Scholar] [CrossRef]
- Mohammadhosseini, H.; Yatim, J.; Sam, A.; Awal, A. Durability performance of green concrete composites containing waste carpet fibers and palm oil fuel ash. J. Clean. Prod. 2017, 144, 448–458. [Google Scholar] [CrossRef]
- ASTM C1585-13 Standard Test Method for Measurement of Rate of Absorption of Water by Hydraulic-Cement Concretes, USA, 2013. Available online: https://www.astm.org/Standards/C1585 (accessed on 7 January 2020).
- Hwang, J.; Kim, M.; Ann, K. Porosity generation arising from steel fibre in concrete. Constr. Build. Mater. 2015, 94, 433–436. [Google Scholar] [CrossRef]
- Zhang, S.; He, P.; Niu, L. Mechanical properties and permeability of fiber-reinforced concrete with recycled aggregate made from waste clay brick. J. Clean. Prod. 2020, 268, 121690. [Google Scholar] [CrossRef]
- Plagué, T.; Desmettre, C.; Charron, J. Influence of fiber type and fiber orientation on cracking and permeability of reinforced concrete under tensile loading. Cem. Concr. Res. 2017, 94, 59–70. [Google Scholar] [CrossRef]
- Osman, K. Soils: Principles, Properties and Management; Springer Science and Business Media: Chittagong, Bangladesh, 2012; pp. 56–57. ISBN 978-94-007-5663-2. [Google Scholar]
- Gandia, R.; Gomes, F.; Corrêa, A.; Rodrigues, M.; Mendes, R. Physical, mechanical and thermal behavior of adobe stabilized with glass fiber reinforced polymer waste. Constr. Build. Mater. 2019, 222, 168–182. [Google Scholar] [CrossRef]
- ASTM C348-14 Standard Test Method for Flexural Strength of Hydraulic-Cement Mortars, USA, 2014. Available online: https://www.astm.org/DATABASE.CART/HISTORICAL/C348-14.htm (accessed on 10 November 2019).
- ASTM C349-18 Standard Test Method for Compressive Strength of Hydraulic-Cement Mortars (Using Portions of Prisms Broken in Flexure), USA, 2018. Available online: https://www.astm.org/Standards/C349 (accessed on 7 January 2020).
- Concha-Riedel, J.; Araya-Letelier, G.; Antico, F.; Reidel, U.; Glade, A. Influence of Jute Fibers to Improve Flexural Toughness, Impact Resistance and Drying Shrinkage Cracking in Adobe Mixes. In Earthen Dwellings Structures; Springer: Singapore, 2019; pp. 269–278. ISBN 978-981-13-5883-8. [Google Scholar] [CrossRef]
- Araya-Letelier, G.; Antico, F.; Concha-Riedel, J.; Glade, A.; Wiener, M. Effectiveness of Polypropylene Fibers on Impact and Shrinkage Cracking Behavior of Adobe Mixes, In Earthen Dwellings Structures; Springer: Singapore, 2019; pp. 269–278. ISBN 978-981-13-5883-8. [Google Scholar] [CrossRef]
- Concha-Riedel, J.; Antico, F.; Araya-Letelier, G. Mechanical and Similarities of Adobe Blocks Reinforced with Natural and Industrial Fibres; Máteria: Rio de Janeiro, Brazil, 2020. [Google Scholar]
- Araya-Letelier, G.; Maturana, P.; Carrasco, M.; Antico, F.; Gómez, M. Mechanical-damage behavior of mortars reinforced with recycled polypropylene fibers. Sustainability 2019, 11, 2200. [Google Scholar] [CrossRef] [Green Version]
- AFNOR XP P13-901 Blocs de terre comprimée pour murs et cloisons: Définitions–Spécifications–Méthodes d’essais–Conditions de reception. Available online: https://sagaweb.afnor.org/fr-FR/sw/consultation/notice/1273438?%0Arecordfromsearch=True (accessed on 10 February 2020).
- Giroudon, M.; Laborel-Préneron, A.; Aubert, J.; Magniont, C. Comparison of barley and lavender straws as bioaggregates in earth bricks. Constr. Build. Mater. 2019, 202, 254–265. [Google Scholar] [CrossRef]
- Jokhio, G.; Saad, F.; Gul, Y.; Mohsin, S.; Ramli, N. Uniaxial compression and tensile splitting tests on adobe with embedded steel wire reinforcement. Constr. Build. Mater. 2018, 176, 383–393. [Google Scholar] [CrossRef]
- Araya-Letelier, G. Design of Building Structural Systems and Enhanced Partition Walls to Improve Life Cycle Costs Associated with Risk of Earthquake Damage. Ph.D. Thesis, Stanford University, Stanford, CA, USA, 2014. [Google Scholar]
- Devore, J. Probability and Statistics for Engineering and the Sciences, 8th ed.; Cengage Learning: Boston, MA, USA, 2011; ISBN 978-0-538-73352-6. [Google Scholar]
- Ma, B.; Qiao, X.; Hou, X.; Yang, Y. Pure keratin membrane and fibers from chicken feather. Int. J. Biol. Macromol. 2016, 89, 614–621. [Google Scholar] [CrossRef] [Green Version]
- Construction Industries Division of the Regulation and Licensing Department. New Mexico Earthen Building Code; Construction Industries Division of the Regulation and Licensing Department: Santa Fe, Mexico, 2011. [Google Scholar]
- Bažant, Z. Size effect. Int. J. Solids Struct. 2000, 37, 69–80. [Google Scholar] [CrossRef]
- Kytinou, V.; Chalioris, C.; Karayannis, C. Analysis of Residual Flexural Stiffness of Steel Fiber-Reinforced Concrete Beams with Steel Reinforcement. Materials 2020, 13, 2698. [Google Scholar] [CrossRef] [PubMed]
- Fares, A.; Hassan, H.; Arab, M. Flexural Behavior of High Strength Self-Compacted Concrete Slabs Containing Treated and Untreated Geogrid Reinforcement. Fibers 2020, 8, 23. [Google Scholar] [CrossRef]


| Diameter (mm) | Length (mm) | Aspect Ratio (Length/Diameter) | Density 2 (g/cm 3) | Water Absorption (%) | Elongation 2 (%) | Tensile Strength 2 (MPa) | Young’s Modulus 3 (MPa) |
|---|---|---|---|---|---|---|---|
| 0.012–0.11 | 0.3–12 | 147–354 | 0.8–0.89 | 85 | 7.7 ± 0.85 | 187.2 ± 0.46 | 3590 ± 1090 |
| Mixes ID Code | Clayey Soil 1 (kg) | Water (kg) | W/S (%) | BPFs 1 (kg) | BPFs 2 (%) |
|---|---|---|---|---|---|
| BPF-0.0 | 100 | 25 | 25 | 0.0 | 0.0 |
| BPF-0.25 | 0.25 | 0.25 | |||
| BPF-0.50 | 0.50 | 0.50 | |||
| BPF-1.0 | 1.0 | 1.0 |
| Specimens | Dimensions (mm) | Experimental Methods | |
|---|---|---|---|
| Type | Specimens Per Type of Test for Each Earthen Mix | ||
| Prismatic | 155 × 105 × 70 | Capillarity | 4 |
| RILEM beam | 160 × 40 × 40 | Flexural and compressive strength | 6 (flexural strength)/ 12 (compressive strength) |
| Beam | 310 × 105 × 70 | Impact strength | 6 |
| Cube | 100 × 100 × 100 | Dry abrasion resistance | 6 |
| ANOVA Test | Source | DF | SS | MS | fst | Fcr | p-Value | Statistically Significant? |
|---|---|---|---|---|---|---|---|---|
| All earthen mixes (one way) | Treatment (BPF) | 3 | 1.777 | 0.592 | 3.768 | 3.49 | 0.0408 | Yes |
| Error | 12 | 1.886 | 0.157 | |||||
| BPF-0.0 versus BPF-0.25 (pair-wise) | Treatment (BPF) | 1 | 0.349 | 0.349 | 3.093 | 5.99 | 0.0129 | No |
| Error | 6 | 0.676 | 0.113 | |||||
| BPF-0.0 versus BPF-0.50 (pair-wise) | Treatment (BPF) | 1 | 0.427 | 0.427 | 3.469 | 5.99 | 0.111 | No |
| Error | 6 | 0.738 | 0.123 | |||||
| BPF-0.0 versus BPF-1.0 (pair-wise) | Treatment (BPF) | 1 | 1.769 | 1.769 | 18.98 | 5.99 | 0.005 | Yes |
| Error | 6 | 0.559 | 0.093 |
| Earthen Mix | Bulk Density 1 (kg/m3) | Porosity (%) |
|---|---|---|
| BPF-0.0 | 1739.2 {1.7%} | 29.6 |
| BPF-0.25 | 1705.1 {2.3%} | 30.9 |
| BPF-0.50 | 1672.7 {2.3%} | 32.3 |
| BPF-1.0 | 1622.4 {1.8%} | 34.3 |
| ANOVA Test | Source | DF | SS | MS | fst | Fcr | p-Value | Statistically Significant? |
|---|---|---|---|---|---|---|---|---|
| All earthen mixes (one way) | Treatment (BPF) | 3 | 0.327 | 0.1091 | 2.14 | 2.84 | 0.1076 | No |
| Error | 44 | 2.234 | 0.0508 |
| ANOVA Test | Source | DF | SS | MS | fst | Fcr | p-Value | Statistically Significant? |
|---|---|---|---|---|---|---|---|---|
| All earthen mixes (one way) | Treatment (BPF) | 3 | 0.059 | 0.0197 | 2.50 | 3.10 | 0.089 | No |
| Error | 20 | 0.157 | 0.0079 |
| ANOVA Test | Source | DF | SS | MS | fst | Fcr | p-Value | Statistically Significant? |
|---|---|---|---|---|---|---|---|---|
| All earthen mixes (one way) | Treatment (BPF) | 3 | 1.3 × 10⁴ | 4.4 × 10³ | 25.49 | 3.10 | <1 × 10⁻⁵ | Yes |
| Error | 20 | 3.4 × 10³ | 1.7 × 10² | |||||
| BPF-0.0 versus BPF-0.25 (pair-wise) | Treatment (BPF) | 1 | 1.1 × 10³ | 1.1 × 10³ | 7.43 | 4.96 | 0.0214 | Yes |
| Error | 10 | 1.5 × 10³ | 1.5 × 10² | |||||
| BPF-0.0 versus BPF-0.50 (pair-wise) | Treatment (BPF) | 1 | 1.6 × 10³ | 1.6 × 10³ | 14.51 | 4.96 | 0.0034 | Yes |
| Error | 10 | 1.1 × 10³ | 1.1 × 10² | |||||
| BPF-0.0 versus BPF-1.0 (pair-wise) | Treatment (BPF) | 1 | 1.2 × 10⁴ | 1.2 × 10⁴ | 71.29 | 4.96 | <1 × 10⁻⁵ | Yes |
| Error | 10 | 1.7 × 10³ | 1.7 × 10² |
| ANOVA Test | Source | DF | SS | MS | fst | Fcr | P-Value | Statistically Significant? |
|---|---|---|---|---|---|---|---|---|
| All earthen mixes (one way) | Treatment (BPF) | 3 | 7.7 × 10⁵ | 2.6 × 10⁵ | 89.29 | 3.10 | <1 × 10⁻⁵ | Yes |
| Error | 20 | 5.8 × 10⁴ | 2.9 × 10³ | |||||
| BPF0.0 versus BPF0.25 (pair-wise) | Treatment (BPF) | 1 | 7.4 × 10³ | 7.4 × 10³ | 50.03 | 4.96 | 3 × 10⁻⁵ | Yes |
| Error | 10 | 1.5 × 10³ | 1.5 × 10² | |||||
| BPF0.0 versus BPF0.5 (pair-wise) | Treatment (BPF) | 1 | 4.0 × 10⁴ | 4.0 × 10⁴ | 88.88 | 4.96 | <1 × 10⁻⁵ | Yes |
| Error | 10 | 4.5 × 10³ | 4.4 × 10² | |||||
| BPF0.0 versus BPF1.0 (pair-wise) | Treatment (BPF) | 1 | 6.3 × 10⁵ | 6.3 × 10⁵ | 119.8 | 4.96 | <1 × 10⁻⁵ | Yes |
| Error | 10 | 5.3 × 10⁴ | 5.3 × 10³ |
| ANOVA Test | Source | DF | SS | MS | fst | Fcr | p-Value | Statistically Significant? |
|---|---|---|---|---|---|---|---|---|
| All earthen mixes (one way) | Treatment (BPF) | 3 | 5.4 × 101 | 1.8 × 101 | 24.38 | 3.10 | <1 × 10⁻⁵ | Yes |
| Error | 20 | 1.5 × 101 | 0.7 × 100 | |||||
| BPF-0.0 versus BPF-0.25 (pair-wise) | Treatment (BPF) | 1 | 0.7 × 100 | 0.7 × 100 | 1.61 | 4.96 | 0.2335 | No |
| Error | 10 | 4.1 × 101 | 0.4 × 100 | |||||
| BPF-0.0 versus BPF-0.50 (pair-wise) | Treatment (BPF) | 1 | 3.6 × 100 | 3.6 × 100 | 6.68 | 4.96 | 0.0272 | Yes |
| Error | 10 | 5.5 × 100 | 0.6 × 100 | |||||
| BPF-0.0 versus BPF-1.0 (pair-wise) | Treatment (BPF) | 1 | 4.5 × 101 | 4.5 × 101 | 48.14 | 4.96 | 4 × 10⁻⁵ | Yes |
| Error | 10 | 9.3 × 100 | 0.9 × 100 |
© 2020 by the authors. Licensee MDPI, Basel, Switzerland. This article is an open access article distributed under the terms and conditions of the Creative Commons Attribution (CC BY) license (http://creativecommons.org/licenses/by/4.0/).
Share and Cite
Gonzalez-Calderon, H.; Araya-Letelier, G.; Kunze, S.; Burbano-Garcia, C.; Reidel, Ú.; Sandoval, C.; Astroza, R.; Bas, F. Biopolymer-Waste Fiber Reinforcement for Earthen Materials: Capillary, Mechanical, Impact, and Abrasion Performance. Polymers 2020, 12, 1819. https://doi.org/10.3390/polym12081819
Gonzalez-Calderon H, Araya-Letelier G, Kunze S, Burbano-Garcia C, Reidel Ú, Sandoval C, Astroza R, Bas F. Biopolymer-Waste Fiber Reinforcement for Earthen Materials: Capillary, Mechanical, Impact, and Abrasion Performance. Polymers. 2020; 12(8):1819. https://doi.org/10.3390/polym12081819
Chicago/Turabian StyleGonzalez-Calderon, Héctor, Gerardo Araya-Letelier, Sabine Kunze, Claudia Burbano-Garcia, Úrsula Reidel, Cristián Sandoval, Rodrigo Astroza, and Fernando Bas. 2020. "Biopolymer-Waste Fiber Reinforcement for Earthen Materials: Capillary, Mechanical, Impact, and Abrasion Performance" Polymers 12, no. 8: 1819. https://doi.org/10.3390/polym12081819