
Structure and Dynamics of Highly Attractive Polymer Nanocomposites in the Semi-Dilute Regime: The Role of Interfacial Domains and Bridging Chains


Abstract
:1. Introduction
2. Systems Studied and Simulation Details
3. Results
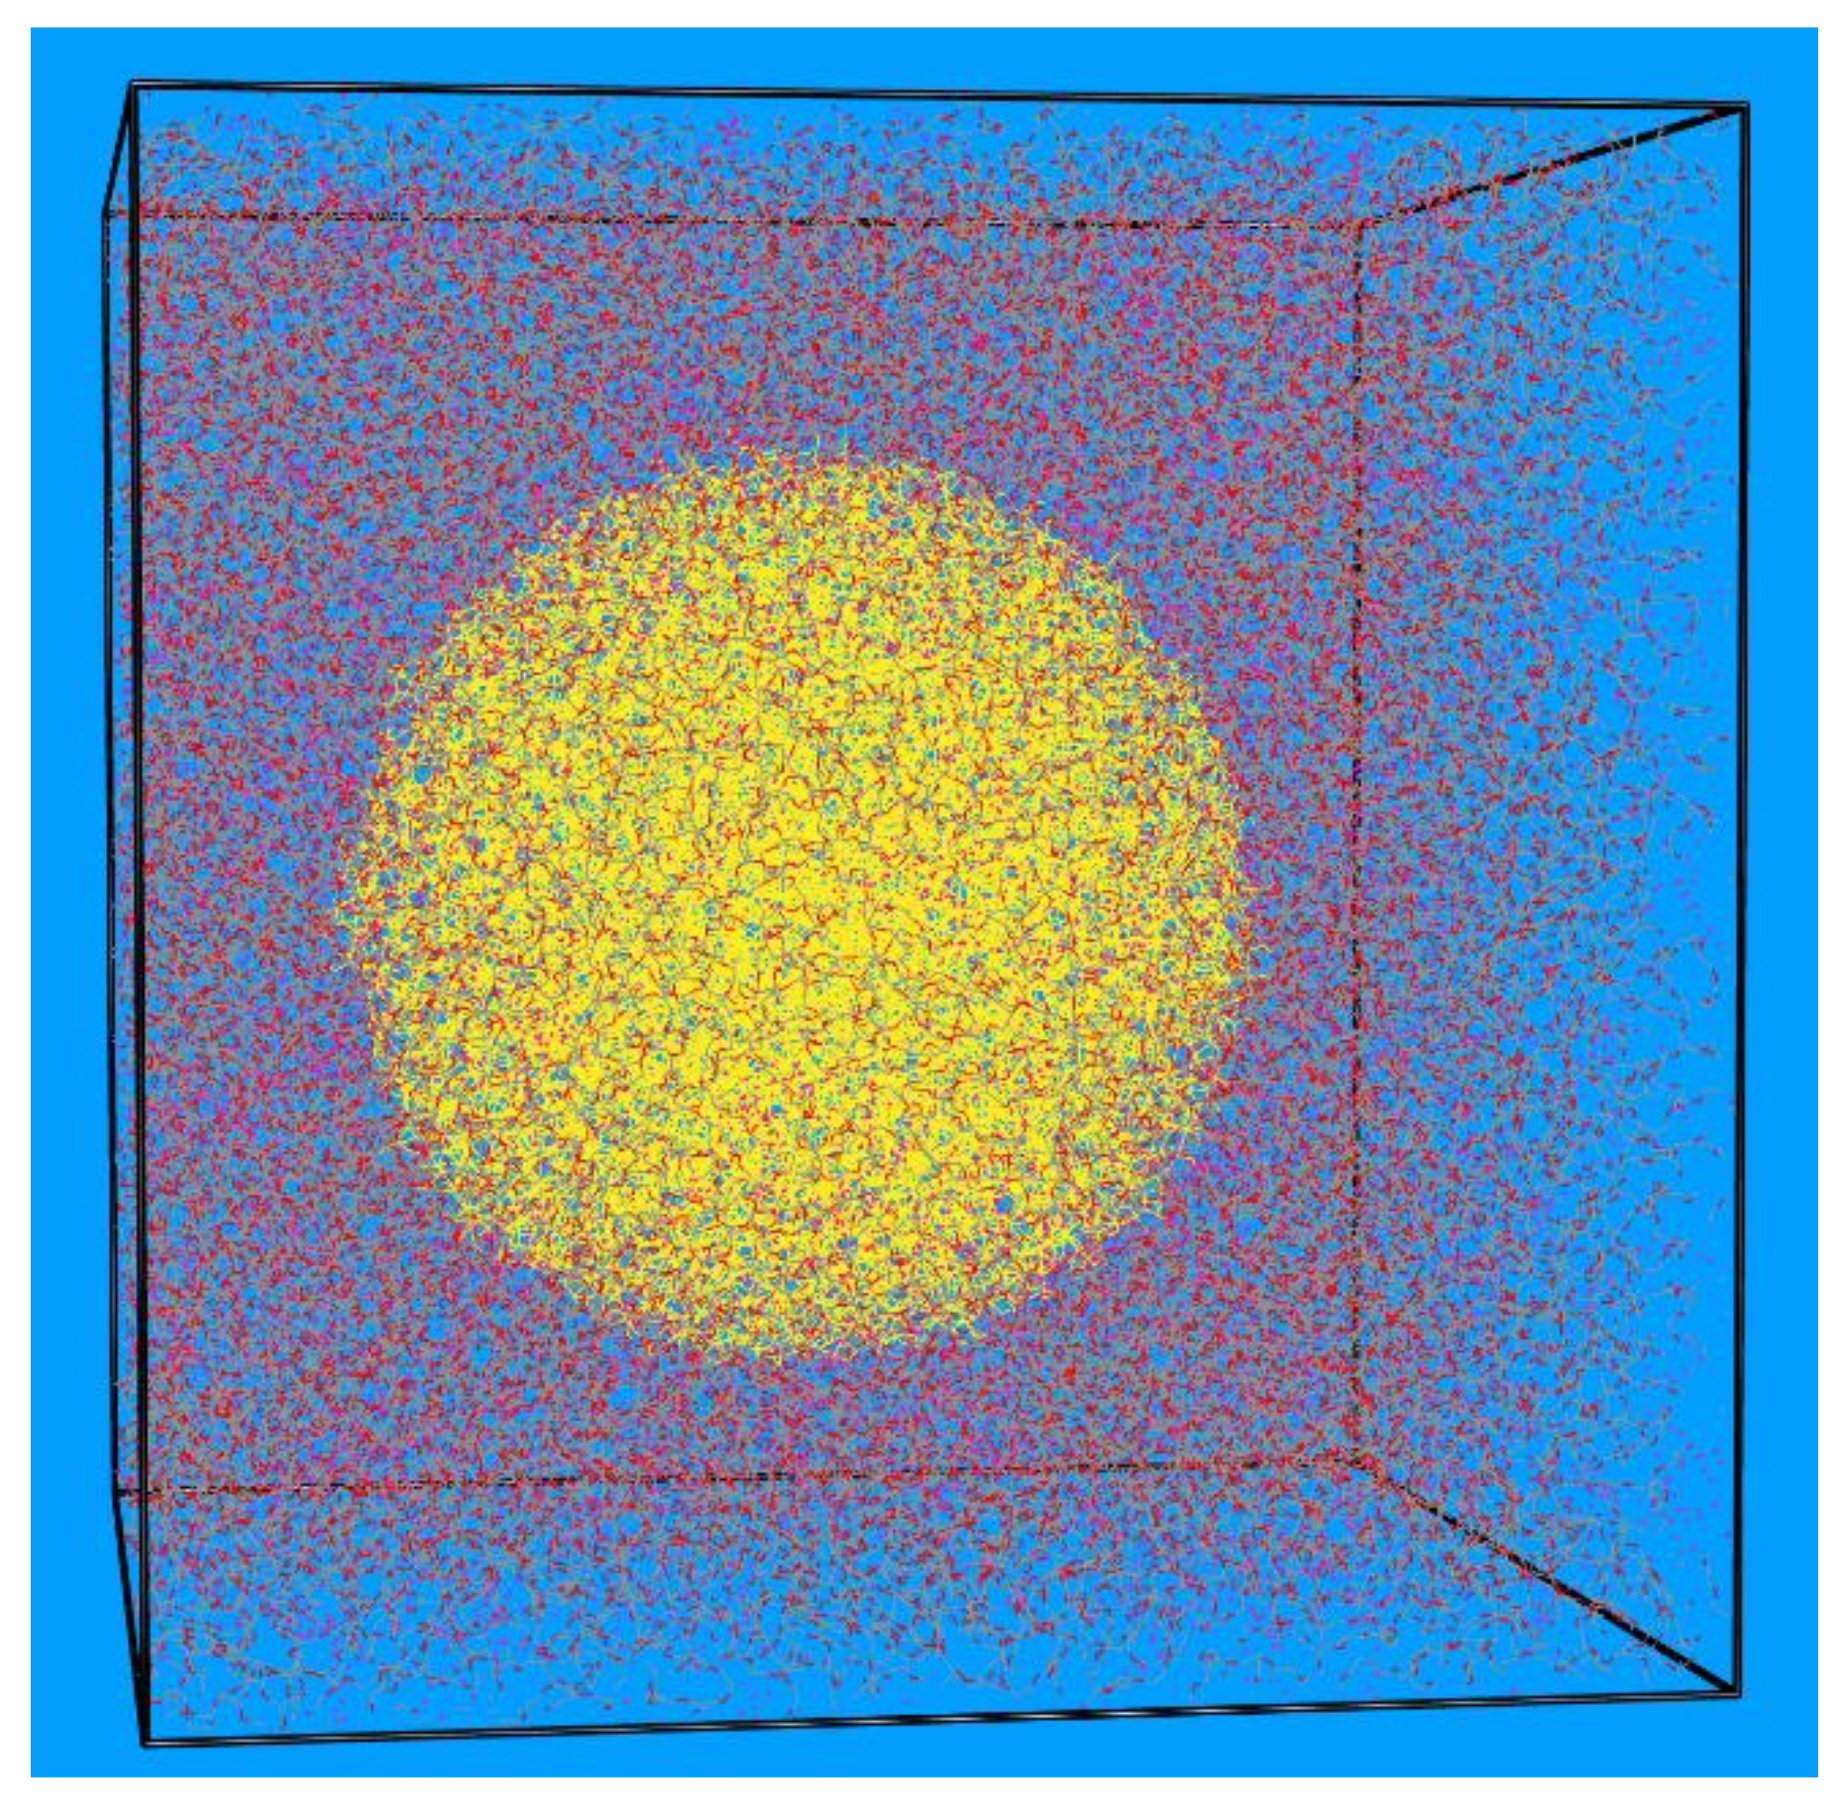
3.1. Local Density
3.2. Structure and Conformation of Adsorbed and Free PEG Chains
3.3. Static Structure Factor
3.4. Single Chain form Factor
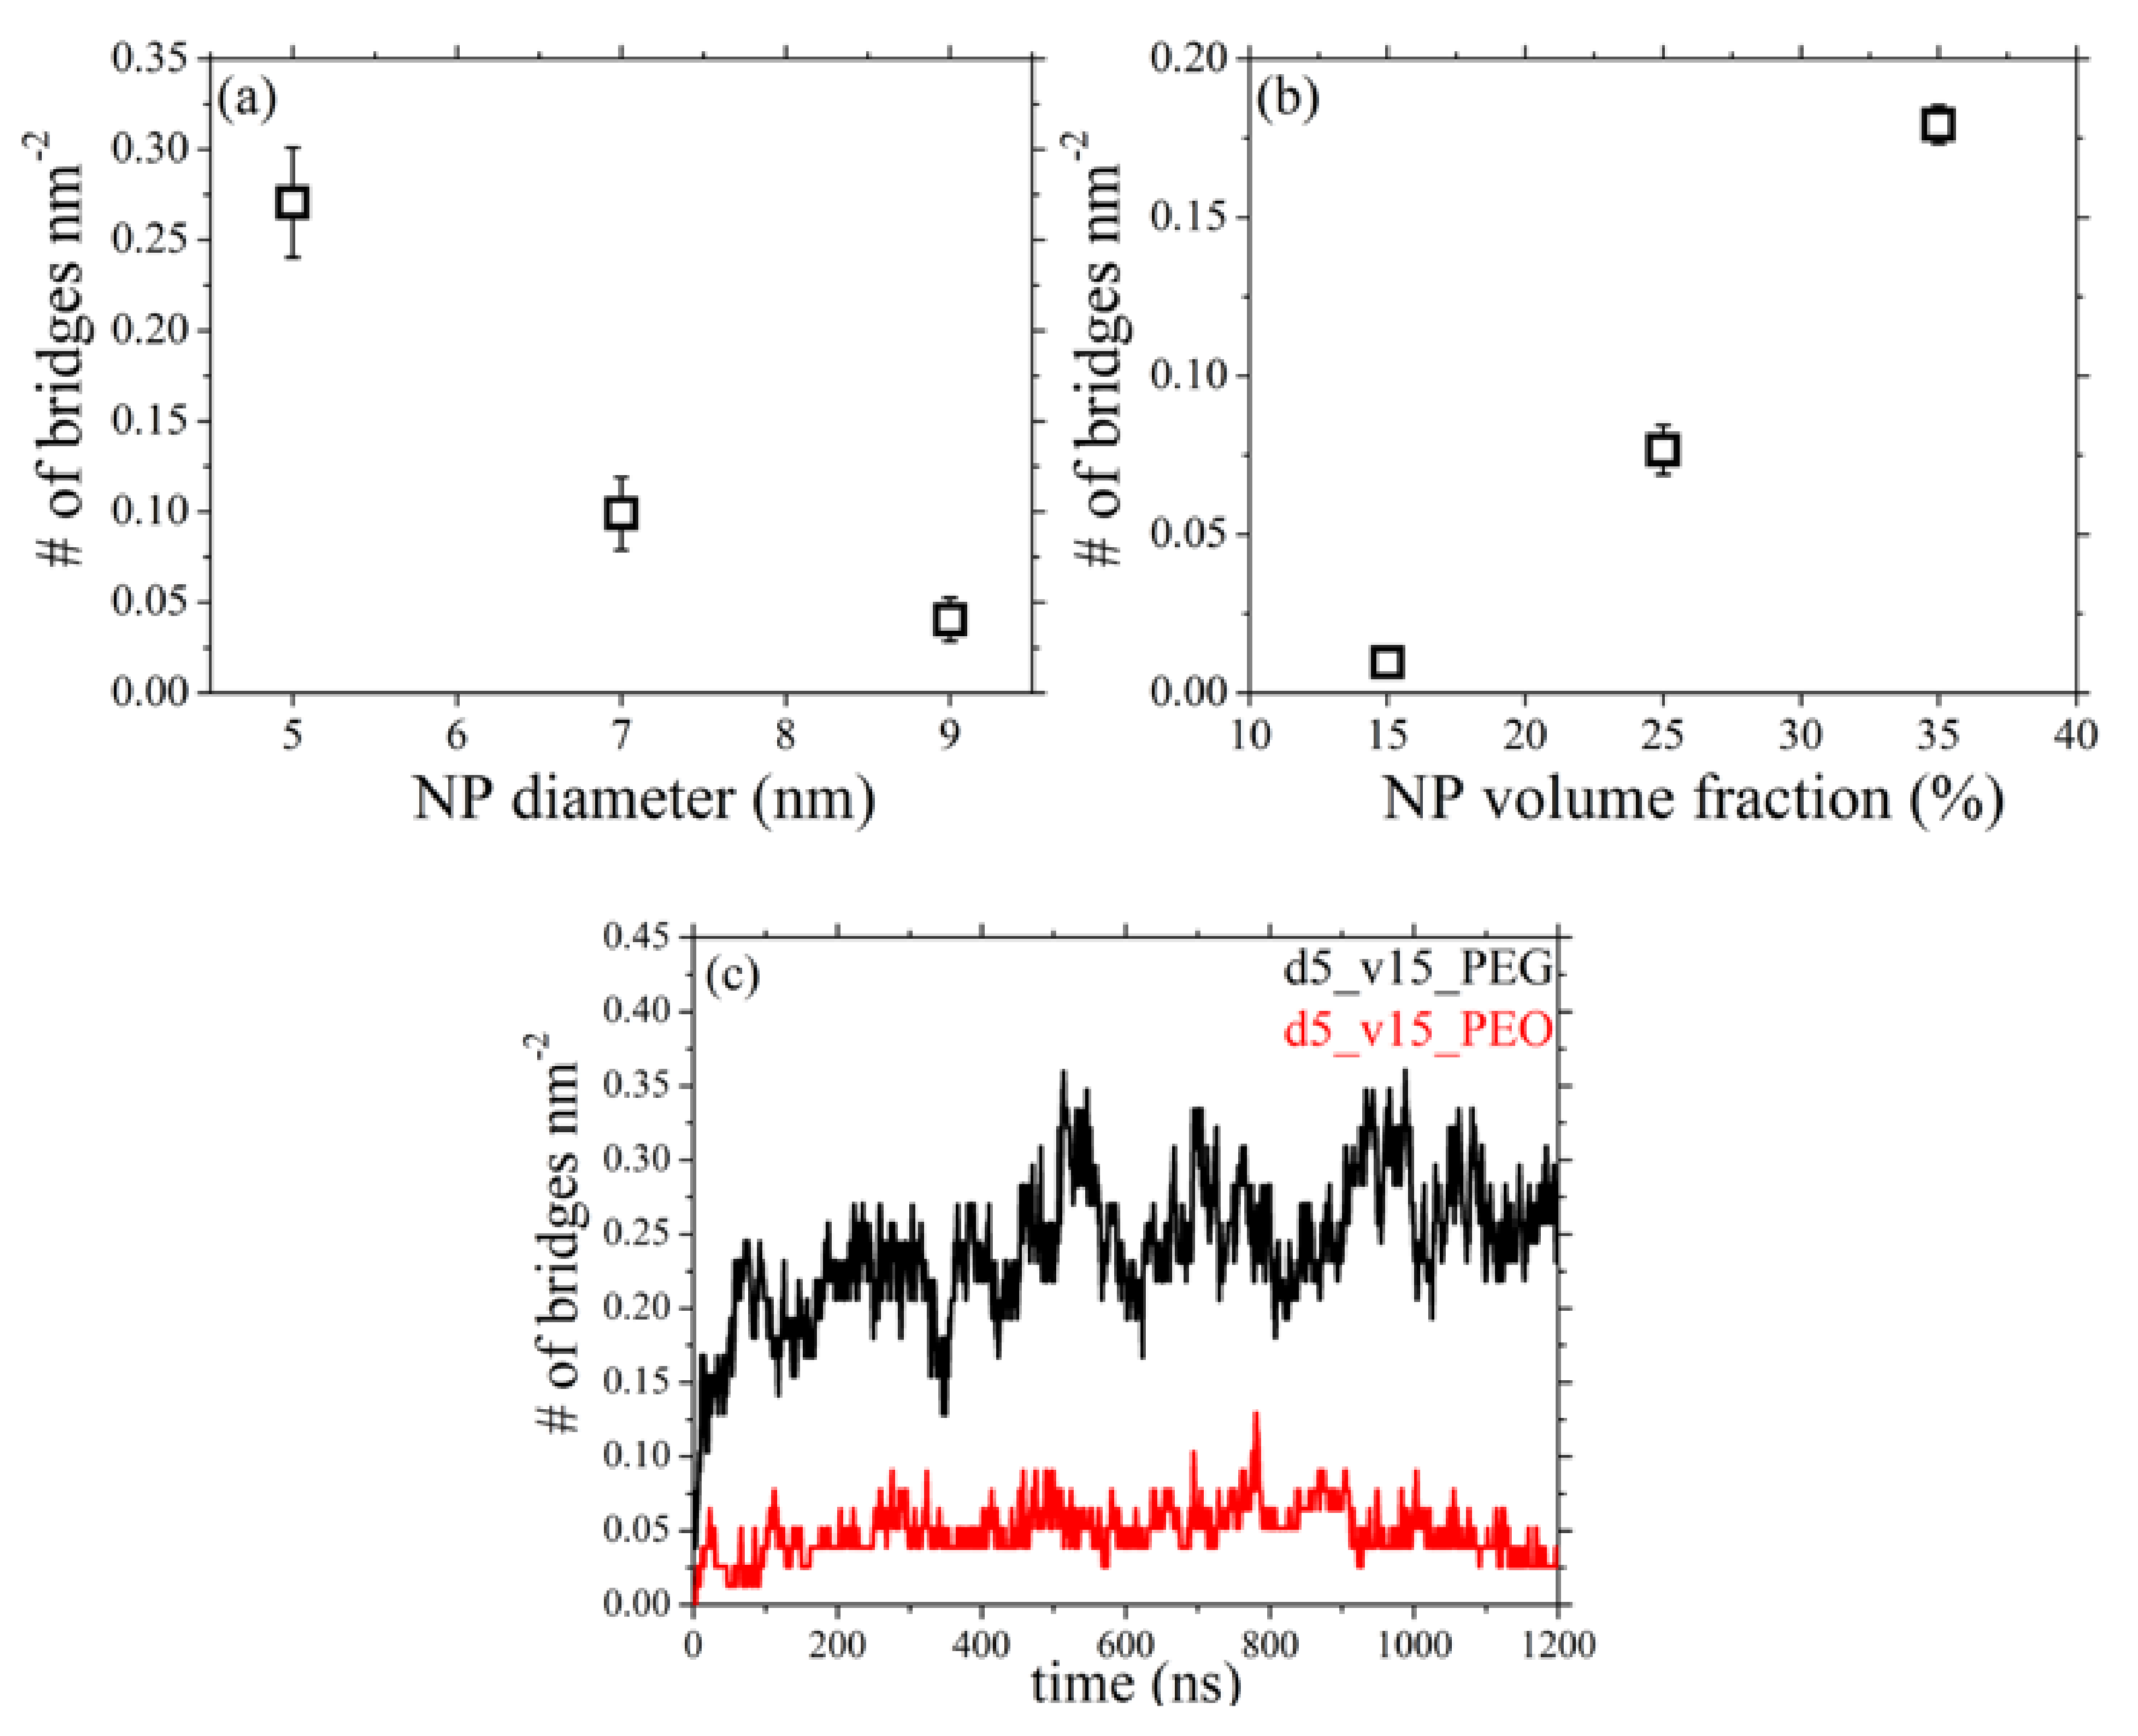
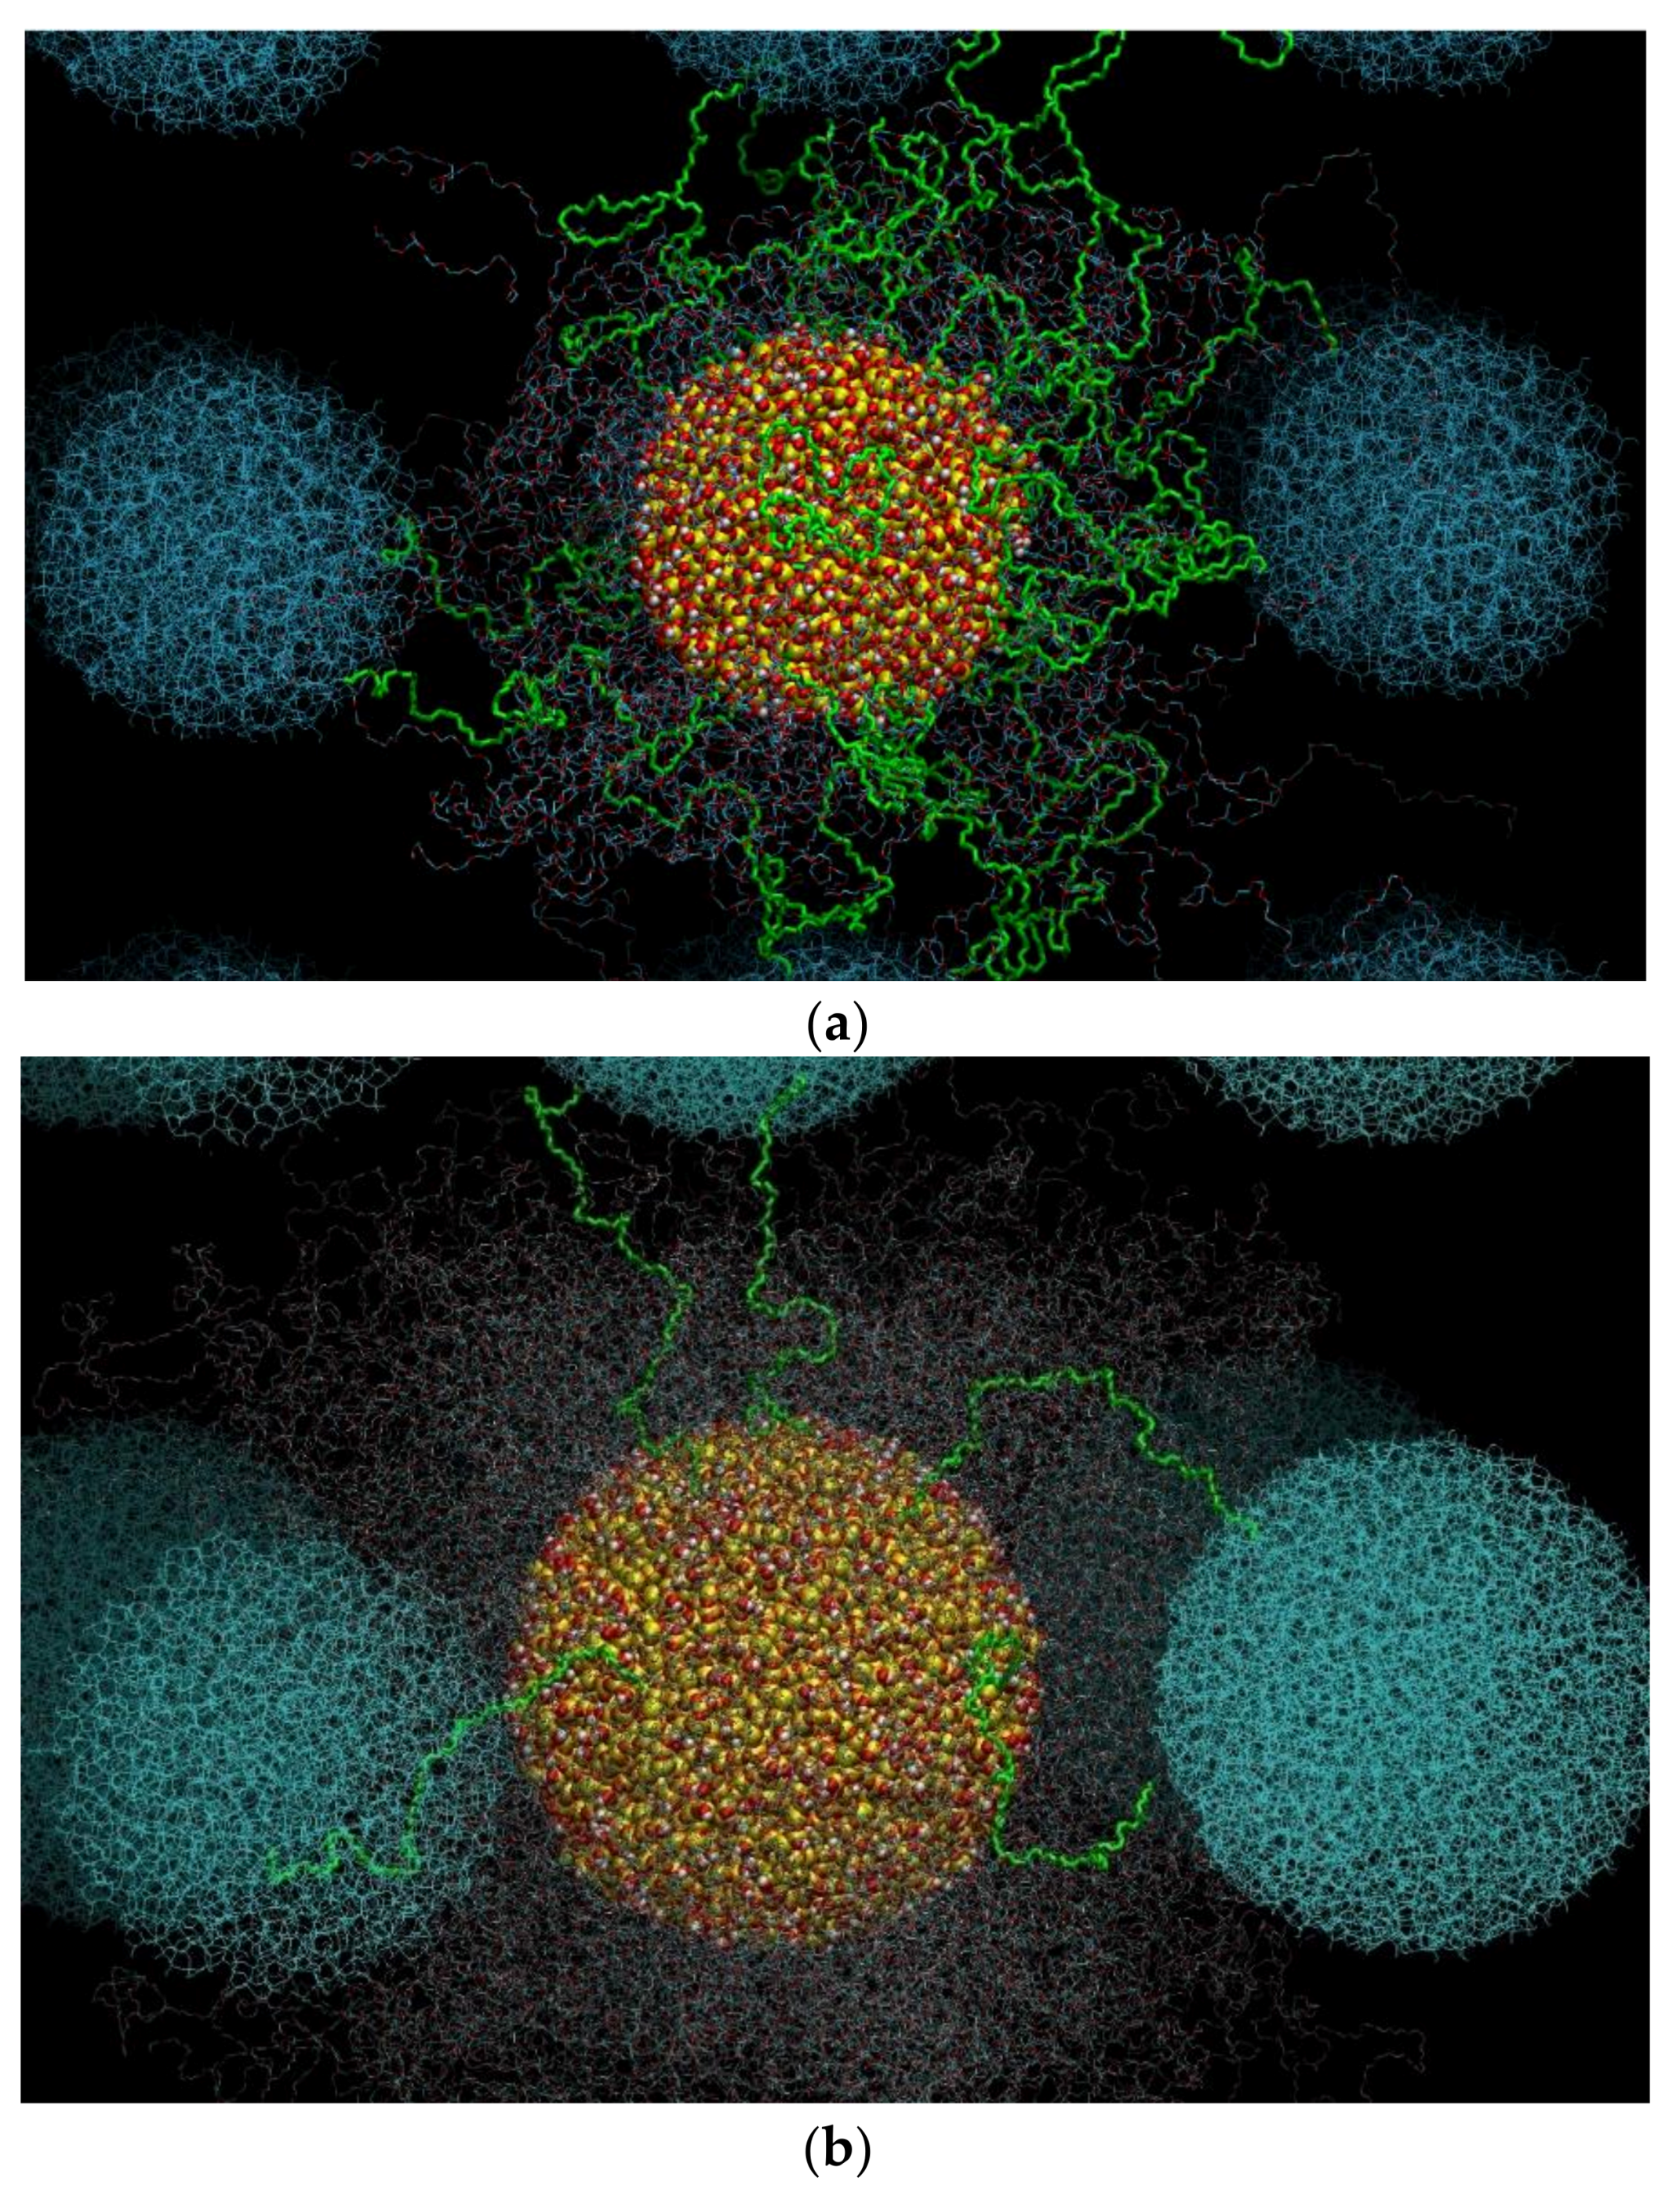
3.5. Network of Nanoparticle Bridging Chains
3.6. Orientational Relaxation of Polymer Chains
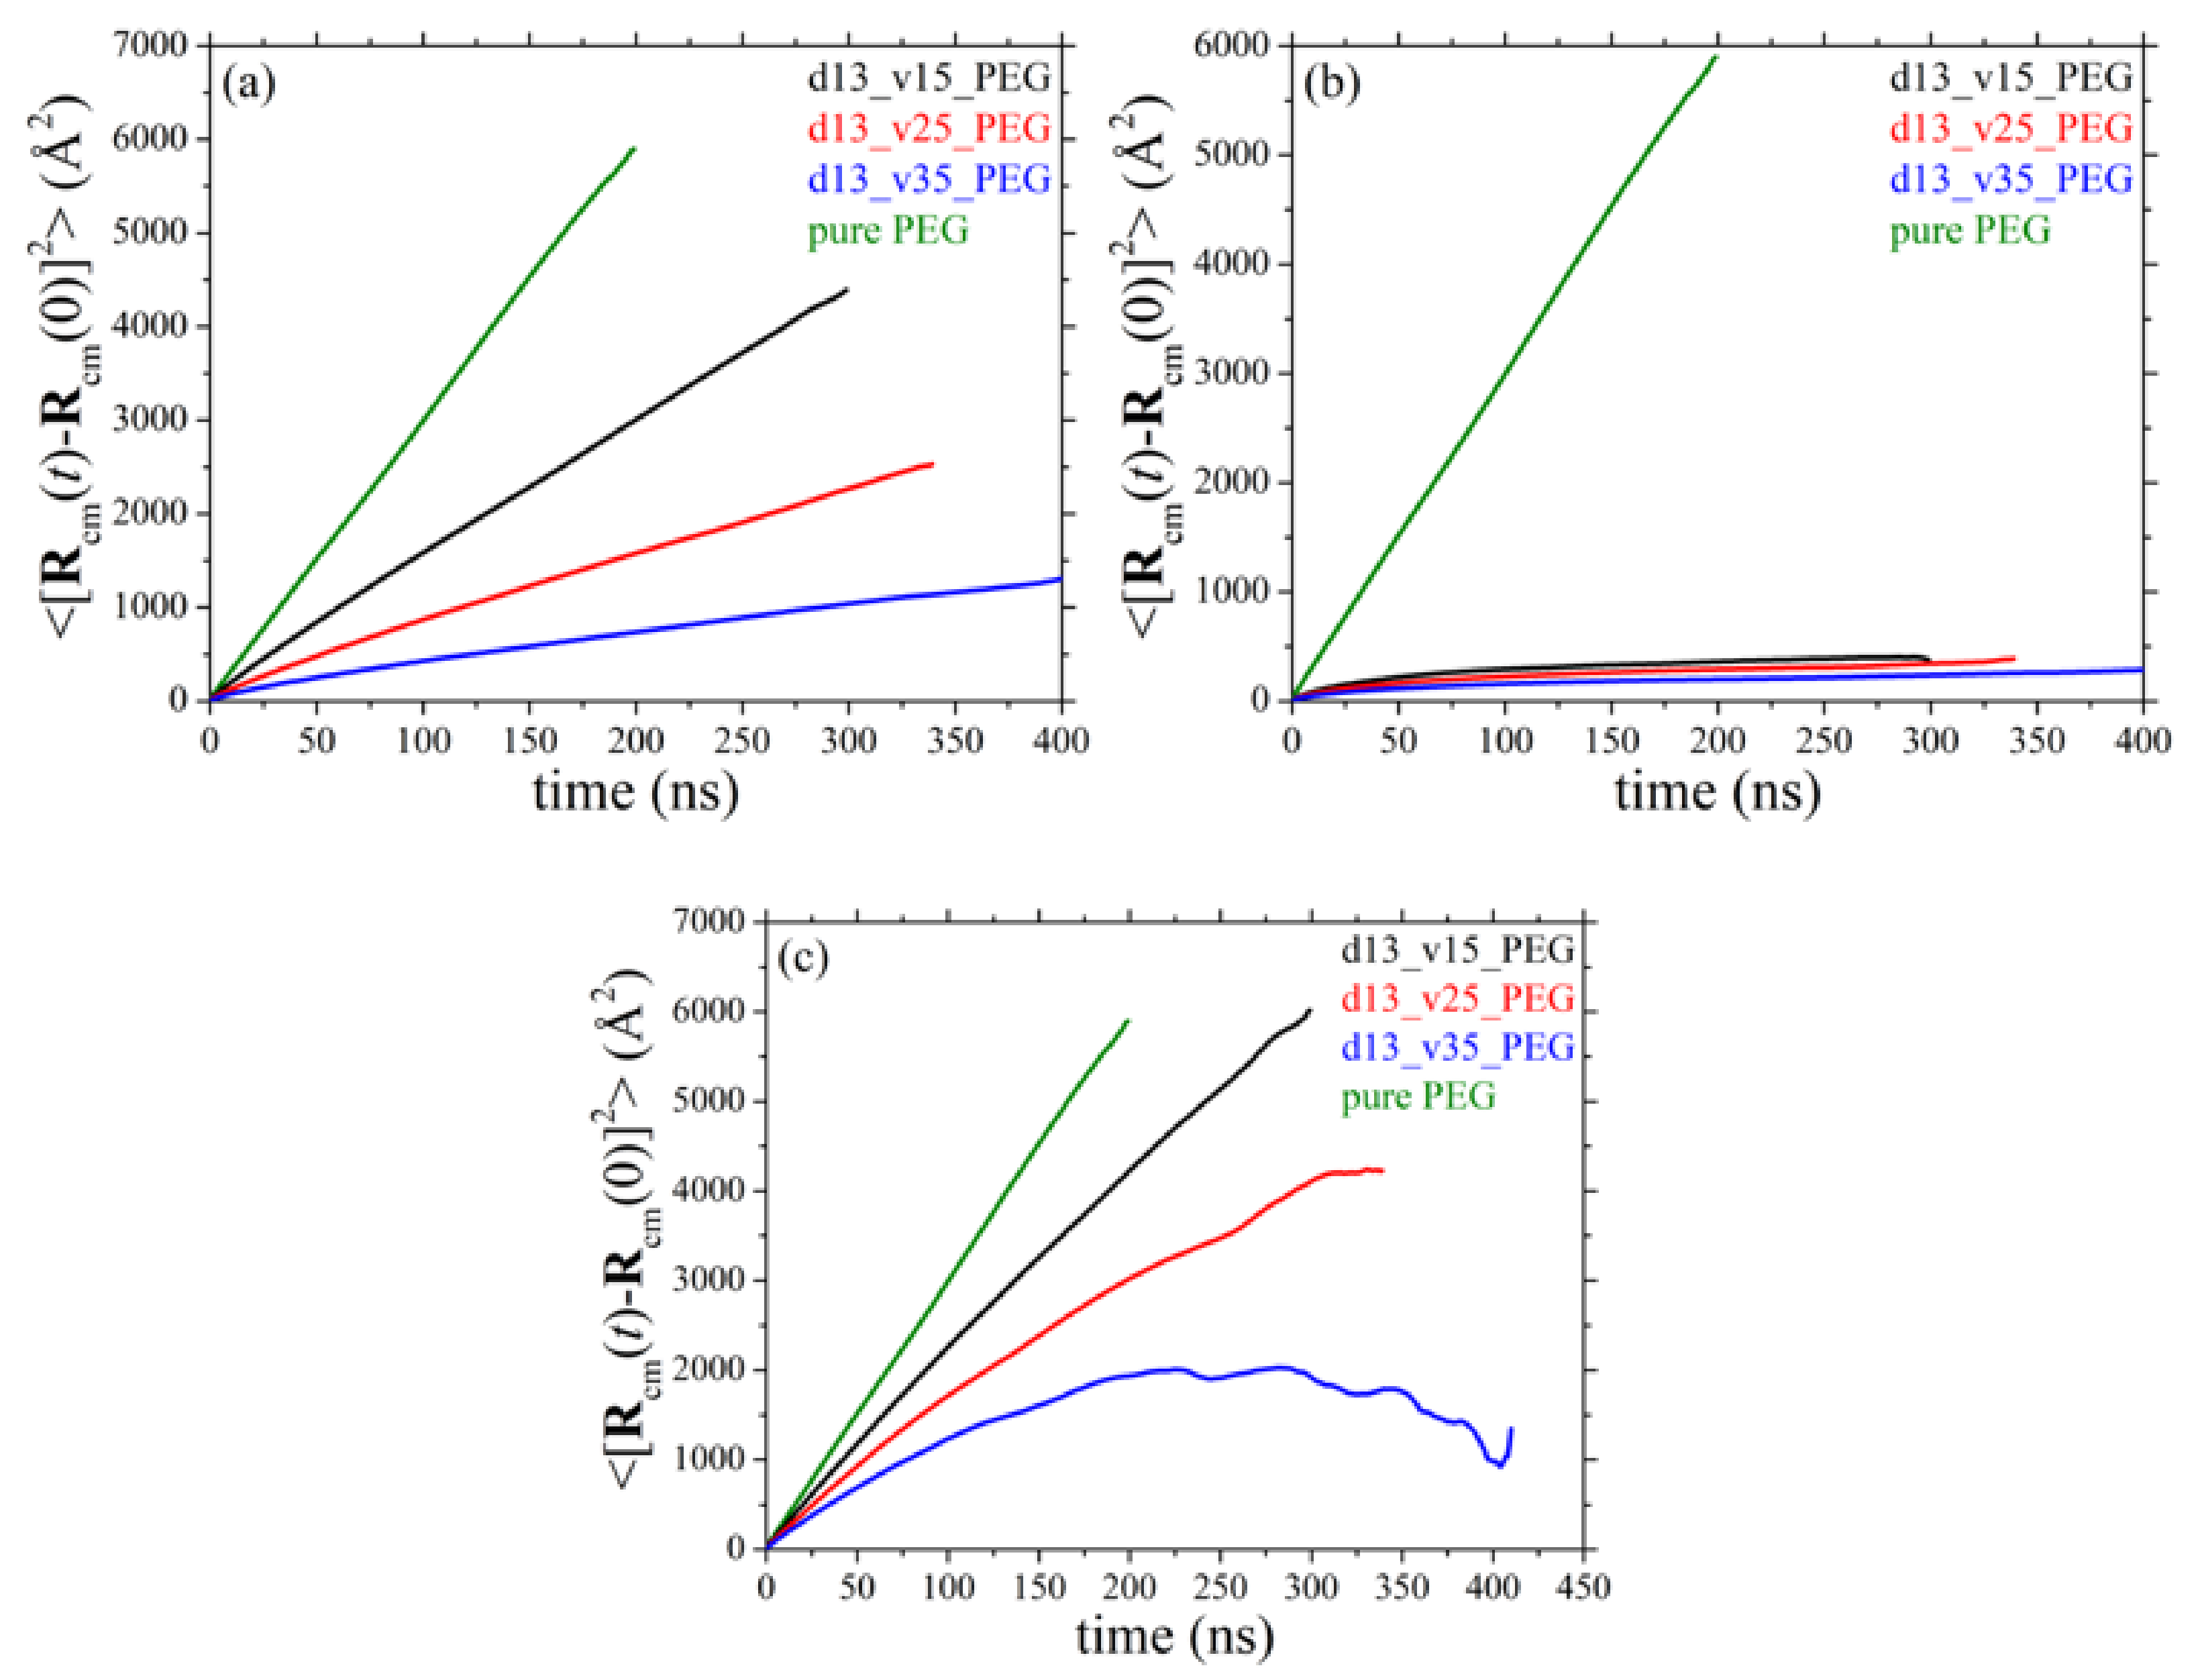
3.7. Diffusive Behavior of Polymer Chains
3.8. Dynamic Structure Factor
3.9. Self-Intermediate Scattering Function
3.10. Thermal Expansion Coefficient and Isothermal Compressibility
4. Conclusions
Author Contributions
Funding
Institutional Review Board Statement
Informed Consent Statement
Data Availability Statement
Acknowledgments
Conflicts of Interest
References
- Serenko, O.A.; Muzafarov, A.M. Polymer composites with surface modified SiO2 nanoparticles: Structures, properties, and promising applications. Polym. Sci. Ser. C+ 2016, 58, 93–101. [Google Scholar] [CrossRef]
- Kumar, S.K.; Krishnamoorti, R. Nanocomposites: Structure, phase behavior, and properties. Ann. Rev. Chem. Biomol. 2010, 1, 37–58. [Google Scholar] [CrossRef] [PubMed] [Green Version]
- Kumar, S.K.; Benicewicz, B.C.; Vaia, R.A.; Winey, K.I. 50th Anniversary perspective: Are polymer nanocomposites practical for applications? Macromolecules 2017, 50, 714–731. [Google Scholar] [CrossRef]
- Cheng, S.W.; Carroll, B.; Bocharova, V.; Carrillo, J.M.Y.; Sumpter, B.G.; Sokolov, A.P. Focus: Structure and dynamics of the interfacial layer in polymer nanocomposites with attractive interactions. J. Chem. Phys. 2017, 146, 203201. [Google Scholar] [CrossRef] [PubMed]
- Bailey, E.J.; Winey, K.I. Dynamics of polymer segments, polymer chains, and nanoparticles in polymer nanocomposite melts: A review. Prog. Polym. Sci. 2020, 105, 101242. [Google Scholar] [CrossRef]
- Zou, H.; Wu, S.S.; Shen, J. Polymer/silica nanocomposites: Preparation, characterization, properties, and applications. Chem. Rev. 2008, 108, 3893–3957. [Google Scholar] [CrossRef]
- Müller, K.; Bugnicourt, E.; Latorre, M.; Jorda, M.; Sanz, Y.E.; Lagaron, J.M.; Miesbauer, O.; Bianchin, A.; Hankin, S.; Bölz, U.; et al. Review on the processing and properties of polymer nanocomposites and nanocoatings and their applications in the packaging, automotive and solar energy fields. Nanomaterials 2017, 7, 74. [Google Scholar] [CrossRef] [Green Version]
- Mallakpour, S.; Naghdi, M. Polymer/SiO2 nanocomposites: Production and applications. Prog. Mater. Sci 2018, 97, 409–447. [Google Scholar] [CrossRef]
- Zhao, J.B.; Wu, L.L.; Zhan, C.X.; Shao, Q.; Guo, Z.H.; Zhang, L.Q. Overview of polymer nanocomposites: Computer simulation understanding of physical properties. Polymer 2017, 133, 272–287. [Google Scholar] [CrossRef]
- Vogiatzis, G.G.; Theodorou, D.N. Multiscale molecular simulations of polymer-matrix nanocomposites. Arch. Computat. Methods Eng. 2018, 25, 591–645. [Google Scholar] [CrossRef] [Green Version]
- Karatrantos, A.; Clarke, N.; Kröger, M. Modeling of polymer structure and conformations in polymer nanocomposites from atomistic to mesoscale: A review. Polym. Rev. 2016, 56, 385–428. [Google Scholar] [CrossRef]
- Karatrantos, A.; Composto, R.J.; Winey, K.I.; Kröger, M.; Clarke, N. Modeling of entangled polymer diffusion in melts and nanocomposites: A review. Polymers 2019, 11, 876. [Google Scholar] [CrossRef] [Green Version]
- Liu, A.Y.; Emamy, H.; Douglas, J.F.; Starr, F.W. Effects of chain length on the structure and dynamics of semidilute nanoparticle–polymer composites. Macromolecules 2021, 54, 3041–3051. [Google Scholar] [CrossRef]
- Jouault, N.; Kumar, S.K.; Smalley, R.J.; Chi, C.Z.; Moneta, R.; Wood, B.; Salerno, H.; Melnichenko, Y.B.; He, L.L.; Guise, W.E.; et al. Do very small POSS nanoparticles perturb s-PMMA chain conformations? Macromolecules 2018, 51, 5278–5293. [Google Scholar] [CrossRef]
- Baeza, G.P.; Dessi, C.; Costanzo, S.; Zhao, D.; Gong, S.S.; Alegria, A.; Colby, R.H.; Rubinstein, M.; Vlassopoulos, D.; Kumar, S.K. Network dynamics in nanofilled polymers. Nat. Commun. 2016, 7, 11368. [Google Scholar] [CrossRef]
- Chen, Q.; Gong, S.S.; Moll, J.; Zhao, D.; Kumar, S.K.; Colby, R.H. Mechanical reinforcement of polymer nanocomposites from percolation of a nanoparticle network. ACS Macro Lett. 2015, 4, 398–402. [Google Scholar] [CrossRef]
- Kim, S.Y.; Meyer, H.W.; Saalwächter, K.; Zukoski, C.F. Polymer dynamics in PEG-silica nanocomposites: Effects of polymer molecular weight, temperature and solvent dilution. Macromolecules 2012, 45, 4225–4237. [Google Scholar] [CrossRef]
- Anderson, B.J.; Zukoski, C.F. Rheology and microstructure of an unentangled polymer nanocomposite melt. Macromolecules 2008, 41, 9326–9334. [Google Scholar] [CrossRef]
- Anderson, B.J.; Zukoski, C.F. Rheology and microstructure of entangled polymer nanocomposite melts. Macromolecules 2009, 42, 8370–8384. [Google Scholar] [CrossRef]
- Barbier, D.; Brown, D.; Grillet, A.C.; Neyertz, S. Interface between end-functionalized PEO oligomers and a silica nanoparticle studied by molecular dynamics simulations. Macromolecules 2004, 37, 4695–4710. [Google Scholar] [CrossRef]
- Skountzos, E.N.; Tsalikis, D.G.; Stephanou, P.S.; Mavrantzas, V.G. Individual contributions of adsorbed and free chains to microscopic dynamics of unentangled poly(ethylene glycol)/silica nanocomposite melts and the important role of end groups: Theory and simulation. Macromolecules 2021, 54, 4470–4487. [Google Scholar] [CrossRef]
- Glomann, T.; Hamm, A.; Allgaier, J.; Hübner, E.G.; Radulescu, A.; Farago, B.; Schneider, G.J. A microscopic view on the large scale chain dynamics in nanocomposites with attractive interactions. Soft Matter 2013, 9, 10559–10571. [Google Scholar] [CrossRef] [Green Version]
- Glomann, T.; Schneider, G.J.; Allgaier, J.; Radulescu, A.; Lohstroh, W.; Farago, B.; Richter, D. Microscopic dynamics of polyethylene glycol chains interacting with silica nanoparticles. Phys. Rev. Lett. 2013, 110, 178001. [Google Scholar] [CrossRef] [Green Version]
- Rissanou, A.N.; Papananou, H.; Petrakis, V.S.; Doxastakis, M.; Andrikopoulos, K.S.; Voyiatzis, G.A.; Chrissopoulou, K.; Harmandaris, V.; Anastasiadis, S.H. Structural and conformational properties of poly(ethylene oxide)/silica nanocomposites: Effect of confinement. Macromolecules 2017, 50, 6273–6284. [Google Scholar] [CrossRef]
- Behbahani, A.F.; Rissanou, A.; Kritikos, G.; Doxastakis, M.; Burkhart, C.; Polińska, P.; Harmandaris, V.A. Conformations and dynamics of polymer chains in cis and trans polybutadiene/silica nanocomposites through atomistic simulations: From the unentangled to the entangled regime. Macromolecules 2020, 53, 6173–6189. [Google Scholar] [CrossRef]
- Rissanou, A.N.; Harmandaris, V. Dynamics of various polymer-graphene interfacial systems through atomistic molecular dynamics simulations. Soft Matter 2014, 10, 2876–2888. [Google Scholar] [CrossRef] [PubMed] [Green Version]
- Kritikos, G.; Rissanou, A.N.; Harmandaris, V.; Karatasos, K. Bound layer polymer behavior on graphene and graphene oxide nanosheets. Macromolecules 2020, 53, 6190–6203. [Google Scholar] [CrossRef]
- Behbahani, A.F.; Motlagh, G.H.; Allaei, S.M.V.; Harmandaris, V.A. Structure and conformation of stereoregular poly(methyl methacrylate) chains adsorbed on graphene oxide and reduced graphene oxide via atomistic simulations. Macromolecules 2019, 52, 3825–3838. [Google Scholar] [CrossRef]
- Behbahani, A.F.; Harmandaris, V. Gradient of segmental dynamics in stereoregular poly(methyl methacrylate) melts confined between pristine or oxidized graphene sheets. Polymers 2021, 13, 830. [Google Scholar] [CrossRef]
- Li, W.; Bačová, P.; Behbahani, A.F.; Burkhart, C.; Polińska, P.; Harmandaris, V.; Doxastakis, M. Tailoring interfacial properties in polymer-silica nanocomposites via surface modification: An atomistic simulation study. ACS Appl. Polym. Mater. 2021, 3, 2576–2587. [Google Scholar] [CrossRef]
- Eslami, H.; Rahimi, M.; Müller-Plathe, F. Molecular dynamics simulation of a silica nanoparticle in oligomeric poly(methyl methacrylate): A model system for studying the interphase thickness in a polymer-nanocomposite via different properties. Macromolecules 2013, 46, 8680–8692. [Google Scholar] [CrossRef]
- Pandey, Y.N.; Papakonstantopoulos, G.J.; Doxastakis, M. Polymer/nanoparticle interactions: Bridging the gap. Macromolecules 2013, 46, 5097–5106. [Google Scholar] [CrossRef]
- Pandey, Y.N.; Doxastakis, M. Detailed atomistic Monte Carlo simulations of a polymer melt on a solid surface and around a nanoparticle. J. Chem. Phys. 2012, 136, 094901. [Google Scholar] [CrossRef] [PubMed]
- Sgouros, A.P.; Revelas, C.J.; Lakkas, A.T.; Theodorou, D.N. Potential of mean force between bare or grafted silica/polystyrene surfaces from self-consistent field theory. Polymers 2021, 13, 1197. [Google Scholar] [CrossRef] [PubMed]
- Lakkas, A.T.; Sgouros, A.P.; Revelas, C.J.; Theodorou, D.N. Structure and thermodynamics of grafted silica/polystyrene dilute nanocomposites investigated through self-consistent field theory. Soft Matter 2021, 17, 4077–4097. [Google Scholar] [CrossRef] [PubMed]
- Vogiatzis, G.G.; Voyiatzis, E.; Theodorou, D.N. Monte Carlo simulations of a coarse grained model for an athermal all-polystyrene nanocomposite system. Eur. Polym. J. 2011, 47, 699–712. [Google Scholar] [CrossRef] [Green Version]
- Vogiatzis, G.G.; Theodorou, D.N. Local segmental dynamics and stresses in polystyrene-C60 mixtures. Macromolecules 2014, 47, 387–404. [Google Scholar] [CrossRef] [Green Version]
- Vogiatzis, G.G.; Theodorou, D.N. Structure of polymer layers grafted to nanoparticles in silica-polystyrene nanocomposites. Macromolecules 2013, 46, 4670–4683. [Google Scholar] [CrossRef] [Green Version]
- Mathioudakis, I.G.; Vogiatzis, G.G.; Tzoumanekas, C.; Theodorou, D.N. Multiscale simulations of PS-SiO2 nanocomposites: From melt to glassy state. Soft Matter 2016, 12, 7585–7605. [Google Scholar] [CrossRef]
- Ndoro, T.V.M.; Böhm, M.C.; Müller-Plathe, F. Interface and interphase dynamics of polystyrene chains near grafted and ungrafted silica nanoparticles. Macromolecules 2012, 45, 171–179. [Google Scholar] [CrossRef]
- Ndoro, T.V.M.; Voyiatzis, E.; Ghanbari, A.; Theodorou, D.N.; Böhm, M.C.; Müller-Plathe, F. Interface of grafted and ungrafted silica nanoparticles with a polystyrene matrix: Atomistic molecular dynamics simulations. Macromolecules 2011, 44, 2316–2327. [Google Scholar] [CrossRef]
- Karatrantos, A.; Composto, R.J.; Winey, K.I.; Clarke, N. Structure and conformations of polymer/SWCNT nanocomposites. Macromolecules 2011, 44, 9830–9838. [Google Scholar] [CrossRef]
- Karatrantos, A.; Clarke, N.; Composto, R.J.; Winey, K.I. Polymer conformations in polymer nanocomposites containing spherical nanoparticles. Soft Matter 2015, 11, 382–388. [Google Scholar] [CrossRef] [Green Version]
- Karatrantos, A.; Composto, R.J.; Winey, K.I.; Clarke, N. Polymer and spherical nanoparticle diffusion in nanocomposites. J. Chem. Phys. 2017, 146, 203331. [Google Scholar] [CrossRef] [Green Version]
- Hong, B.B.; Panagiotopoulos, A.Z. Molecular dynamics simulations of silica nanoparticles grafted with poly(ethylene oxide) oligomer chains. J. Phys. Chem. B 2012, 116, 2385–2395. [Google Scholar] [CrossRef]
- Skountzos, E.N.; Mermigkis, P.G.; Mavrantzas, V.G. Molecular dynamics study of an atactic poly(methyl methacrylate)-carbon nanotube nanocomposite. J. Phys. Chem. B 2018, 122, 9007–9021. [Google Scholar] [CrossRef] [PubMed]
- Skountzos, E.N.; Anastassiou, A.; Mavrantzas, V.G.; Theodorou, D.N. Determination of the mechanical properties of a poly(methyl methacrylate) nanocomposite with functionalized graphene sheets through detailed atomistic simulations. Macromolecules 2014, 47, 8072–8088. [Google Scholar] [CrossRef]
- Ramos, J.; Peristeras, L.D.; Theodorou, D.N. Monte Carlo simulation of short chain branched polyolefins in the molten state. Macromolecules 2007, 40, 9640–9650. [Google Scholar] [CrossRef]
- Scienomics. MAPS Platform, V., France. 2015. Available online: http://www.scienomics.com/ (accessed on 30 September 2016).
- Brown, D.; Marcadon, V.; Mélé, P.; Albérola, N.D. Effect of filler particle size on the properties of model nanocomposites. Macromolecules 2008, 41, 1499–1511. [Google Scholar] [CrossRef]
- Tsalikis, D.G.; Koukoulas, T.; Mavrantzas, V.G. Dynamic, conformational and topological properties of ring-linear poly(ethylene oxide) blends from molecular dynamics simulations. React. Funct. Polym. 2014, 80, 61–70. [Google Scholar] [CrossRef]
- Tsamopoulos, A.J.; Katsarou, A.F.; Tsalikis, D.G.; Mavrantzas, V.G. Shear rheology of unentangled and marginally entangled ring polymer melts from large-scale nonequilibrium molecular dynamics simulations. Polymers 2019, 11, 1194. [Google Scholar] [CrossRef] [Green Version]
- Tsalikis, D.G.; Koukoulas, T.; Mavrantzas, V.G.; Pasquino, R.; Vlassopoulos, D.; Pyckhout-Hintzen, W.; Wischnewski, A.; Monkenbusch, M.; Richter, D. Microscopic structure, conformation, and dynamics of ring and linear poly(ethylene oxide) melts from detailed atomistic molecular dynamics simulations: Dependence on chain length and direct comparison with experimental data. Macromolecules 2017, 50, 2565–2584. [Google Scholar] [CrossRef]
- Van der Spoel, D.; Lindahl, E.; Hess, B.; Groenhof, G.; Mark, A.E.; Berendsen, H.J.C. GROMACS: Fast, flexible, and free. J. Comput. Chem. 2005, 26, 1701–1718. [Google Scholar] [CrossRef]
- Dee, G.T.; Ougizawa, T.; Walsh, D.J. The pressure volume temperature properties of polyethylene, poly(dimethyl siloxane), poly(ethylene glycol) and poly(propylene glycol) as a function of molecular-weight. Polymer 1992, 33, 3462–3469. [Google Scholar] [CrossRef]
- Daoulas, K.C.; Harmandaris, V.A.; Mavrantzas, V.G. Detailed atomistic simulation of a polymer melt/solid interface: Structure, density, and conformation of a thin film of polyethylene melt adsorbed on graphite. Macromolecules 2005, 38, 5780–5795. [Google Scholar] [CrossRef]
- Luzar, A.; Chandler, D. Hydrogen-bond kinetics in liquid water. Nature 1996, 379, 55–57. [Google Scholar] [CrossRef]
- Sears, V.F. Neutron scattering lengths and cross sections. Neutron News 1992, 3, 26–37. [Google Scholar] [CrossRef]
- Johnson, J.A.; Saboungi, M.L.; Price, D.L.; Ansell, S.; Russell, T.P.; Halley, J.W.; Nielsen, B. Atomic structure of solid and liquid polyethylene oxide. J. Chem. Phys. 1998, 109, 7005–7010. [Google Scholar] [CrossRef]
- Burchard, W.; Kajiwara, K. Statistics of stiff chain molecules. 1. Particle scattering factor. Proc. R. Soc. Lond. Ser. A 1970, 316, 185–199. [Google Scholar]
- Doi, M.; Edwards, S.F. The Theory of Polymer Dynamics; Clarendon: Oxford, UK, 1986. [Google Scholar]
- Tsujita, Y.; Nose, T.; Hata, T. Thermodynamic properties of polyethylene and eicosane. 1. P-V-T relations and internal pressure. Polym. J. 1972, 3, 581–586. [Google Scholar] [CrossRef] [Green Version]


| System | Abbreviation | Number of PEG Chains | Silanol Concentration (OH nm−2) | Volume Fraction (v/v%) | Silica Nanoparticle Diameter (nm) | Total Number of Interacting Atoms |
|---|---|---|---|---|---|---|
| 1 | PEG | 1000 | - | - | - | 126,000 |
| 2 | d5_v15_PEG | 130 | 3.6 | 15 | 5 | 21,160 |
| 3 | d7_v15_PEG | 354 | 3.6 | 15 | 7 | 57,636 |
| 4 | d9_v15_PEG | 750 | 3.6 | 15 | 9 | 122,201 |
| 5 | d13_v15_PEG | 1799 | 4.2 | 15 | 12.8 | 305,887 |
| 6 | d13_v25_PEG | 975 | 4.2 | 25 | 12.8 | 202,063 |
| 7 | d13_v35_PEG | 600 | 4.2 | 35 | 12.8 | 154,813 |
| 8 | d5_v15_PEO | 130 | 3.6 | 15 | 5 | 21,940 |
| System | ρ (g cm−3) |
|---|---|
| PEG | 1.015 ± 0.001 |
| d5_v15_PEG | 1.247 ± 0.004 |
| d7_v15_PEG | 1.241 ± 0.002 |
| d9_v15_PEG | 1.240 ± 0.002 |
| d13_v15_PEG | 1.264 ± 0.001 |
| d13_v25_PEG | 1.437 ± 0.001 |
| d13_v35_PEG | 1.602 ± 0.001 |
| System | Fraction of | Available Adsorption Surface per PEG Chain (nm2 chain−1) | Interparticle Distance dinter (nm) | |
|---|---|---|---|---|
| Adsorbed PEG Chains | Free PEG Chains | |||
| d5_v15_PEG | 0.779 ± 0.021 | 0.221 ± 0.021 | 0.597 | 2.61 |
| d7_v15_PEG | 0.601 ± 0.013 | 0.399 ± 0.013 | 0.434 | 3.63 |
| d9_v15_PEG | 0.424 ± 0.008 | 0.576 ± 0.008 | 0.339 | 4.67 |
| d13_v15_PEG | 0.346 ± 0.006 a | 0.654 ± 0.006 a | 0.285 | 5.68 |
| d13_v25_PEG | 0.598 ± 0.005 | 0.402 ± 0.005 | 0.526 | 2.88 |
| d13_v35_PEG | 0.781 ± 0.006 | 0.219 ± 0.006 | 0.855 | 1.20 |
| System | Hydrogen Bonds Per Chain | ||
|---|---|---|---|
| Total | Polymer-Polymer (HBpol-pol) | Polymer-Silica (HBpol-sil) | |
| PEG | 0.690 | 0.690 | - |
| d5_v15_PEG | 1.416 | 0.559 | 0.857 |
| d7_v15_PEG | 1.258 | 0.568 | 0.690 |
| d9_v15_PEG | 1.073 | 0.621 | 0.451 |
| d13_v15_PEG | 1.072 | 0.614 | 0.458 |
| d13_v25_PEG | 1.394 | 0.557 | 0.838 |
| d13_v35_PEG | 1.742 | 0.497 | 1.245 |
| System | (Å2) | ||
|---|---|---|---|
| Adsorbed PEG Chains | Free PEG Chains | All PEG Chains | |
| PEG | - | - | 1454 ± 31 a |
| d5_v15_PEG | 1518 ± 36 | 1379 ± 68 | 1479 ± 30 |
| d7_v15_PEG | 1580 ± 29 | 1380 ± 41 | 1501 ± 25 |
| d9_v15_PEG | 1556 ± 55 | 1415 ± 47 | 1475 ± 38 |
| d13_v15_PEG | 1587 ± 42 a | 1443 ± 23 a | 1487 ± 18 a |
| d13_v25_PEG | 1544 ± 40 | 1395 ± 55 | 1482 ± 30 |
| d13_v35_PEG | 1495 ± 38 | 1346 ± 93 | 1432 ± 34 |
Publisher’s Note: MDPI stays neutral with regard to jurisdictional claims in published maps and institutional affiliations. |
© 2021 by the authors. Licensee MDPI, Basel, Switzerland. This article is an open access article distributed under the terms and conditions of the Creative Commons Attribution (CC BY) license (https://creativecommons.org/licenses/by/4.0/).
Share and Cite
Skountzos, E.N.; Karadima, K.S.; Mavrantzas, V.G. Structure and Dynamics of Highly Attractive Polymer Nanocomposites in the Semi-Dilute Regime: The Role of Interfacial Domains and Bridging Chains. Polymers 2021, 13, 2749. https://doi.org/10.3390/polym13162749
Skountzos EN, Karadima KS, Mavrantzas VG. Structure and Dynamics of Highly Attractive Polymer Nanocomposites in the Semi-Dilute Regime: The Role of Interfacial Domains and Bridging Chains. Polymers. 2021; 13(16):2749. https://doi.org/10.3390/polym13162749
Chicago/Turabian StyleSkountzos, Emmanuel N., Katerina S. Karadima, and Vlasis G. Mavrantzas. 2021. "Structure and Dynamics of Highly Attractive Polymer Nanocomposites in the Semi-Dilute Regime: The Role of Interfacial Domains and Bridging Chains" Polymers 13, no. 16: 2749. https://doi.org/10.3390/polym13162749