Article

Practical Prediction Models of Tensile Strength and Reinforcement-Concrete Bond Strength of Low-Calcium Fly Ash Geopolymer Concrete

1
Key Laboratory of Deep Underground Science and Engineering (Ministry of Education), Department of Architecture and Environment, Sichuan University, Chengdu 610065, China
2
Failure Mechanics and Engineering Disaster Prevention and Mitigation Key Lab of Sichuan Province, Chengdu 610065, China
3
Department of Mechanical Engineering, Chengdu University, Chengdu 610106, China
*
Author to whom correspondence should be addressed.
Polymers 2021, 13(6), 875; https://doi.org/10.3390/polym13060875
Submission received: 11 February 2021 / Revised: 26 February 2021 / Accepted: 26 February 2021 / Published: 12 March 2021
(This article belongs to the Special Issue Geopolymers - Design, Preparation, Applications)

Abstract

:
There have been a few attempts to develop prediction models of splitting tensile strength and reinforcement-concrete bond strength of FAGC (low-calcium fly ash geopolymer concrete), however, no model can be used as a design equation. Therefore, this paper aimed to provide practical prediction models. Using 115 test results for splitting tensile strength and 147 test results for bond strength from experiments and previous literature, considering the effect of size and shape on strength and structural factors on bond strength, this paper developed and verified updated prediction models and the 90% prediction intervals by regression analysis. The models can be used as design equations and applied for estimating the cracking behaviors and calculating the design anchorage length of reinforced FAGC beams. The strength models of PCC (Portland cement concrete) overestimate the splitting tensile strength and reinforcement-concrete bond strength of FAGC, so PCC’s models are not recommended as the design equations.

Graphical Abstract

1. Introduction

1.1. Background

Low-calcium fly ash geopolymer concrete (FAGC) is regarded as an alternative to Portland cement concrete (PCC) [1,2,3] because of its low energy consumption and CO2 emissions, early compressive strength under slightly elevated temperatures [4], superior durability in sulphates or acids [5,6], and excellent fire-resistance behavior [7]. The necessary heat curing of FAGC is considered to limit its application in precast industries only, but the limitation can be overcome by pre-heating of fly ash and alkaline solution [8].
The most important application of concrete in building construction is concrete members [9]. Current research on structural behaviors of reinforced FAGC members focused on the failure mode and bearing capacity. However, there was a lack of study on other structural behaviors, such as the cracking behaviors and design anchorage length of reinforced FAGC beams, which are related to the tensile strength and reinforcement-concrete bond strength [9,10,11]. To estimate the cracking behaviors and calculate the design anchorage length, it is vital to accurately estimate the tensile strength and reinforcement-concrete bond strength from the compressive strength using the specific strength models of FAGC rather than the strength models of PCC.
There have been many studies to assess the tensile strength [12,13,14,15,16,17,18,19,20,21,22] and reinforcement-concrete bond strength of FAGC [12,13,14,23,24,25,26]. Some authors [12,13,14] argued that the splitting tensile strength of FAGC was higher than that of PCC at the same compressive strength, while others [15,16] obtained the opposite conclusion, which can be explained by the scatter of the splitting tensile strength of FAGC. The bond strength of FAGC was considered to be higher than that of PCC in the same case [12,13,14,23,24,25,26].
However, there were only a few attempts to develop the prediction models of tensile strength [15,16,21] and reinforcement-concrete bond strength [23,24], and there is still a long way to go before these prediction models can be used as design equations because of the limitations of these prediction models.
In previous attempts to develop the prediction models of the splitting tensile strength of FAGC, comparatively few data have been used considering the large scatter [15,16,21]. In addition, the specimens for strength test in different studies were different, but the effect of the shape and size of the tested specimens on strength was not considered in previous attempts [15,16,21]. Therefore, this work aims to provide a reliable tensile strength model by acquiring more data and considering the effect of shape and size of tested specimens on strength.
Bond strength should be regarded as a structural property rather than only a material property [27], however, in these previous attempts to develop the bond strength model, only the effect of compressive strength was considered, and the effects of structural factors, namely the cover c, bar diameter d, and development length l, on bond strength were ignored [23,24]. Therefore, these models cannot be used as design equations. Also, we noticed there was a lack of data on high-strength FAGC (compressive strength >50 MPa). In summary, for proposing design equations of bond strength of FAGC, this work considers the effects of structural factors and compressive strength on bond strength simultaneously, and acquires much data from these previous studies and the laboratory experiments.

1.2. Main Works

In this work, first, the splitting tensile strength and bond strength of four FAGCs with compressive strength of 50–80 MPa were tested, and previously published results of FAGC were collected to build databases; second, based on the databases, the prediction models of tensile strength and bond strength for FAGC, as well as the 90% prediction interval of the models, were proposed through regression analysis; third, the splitting tensile strength and bond strength of five FAGCs were tested and the results were used to validate the models; fourth, the models for FAGC were compared with the existing models for PCC to show whether the existing models are suitable for FAGC; finally, based on the strength models, the cracking behaviors of reinforced FAGC beams, such as the cracking moment, crack spacing and width, can be predicted using the existing prediction models of structural behaviors, and the design anchorage length can be calculated. The test results in previously published literature were used to validate the prediction models of the cracking moment and crack spacing.

1.3. Research Significance

At present, there is no design equation developed to predict tensile strength and reinforcement-concrete bond strength of FAGC as functions of compressive strength, which hinders the use of FAGC for large-scale field applications. Reliance on the existing design equation for PCC may lead to unsafe structural design. So far, a few studies have proposed prediction models for FAGC; however, there are limitations in those prediction models as shown in Section 1.1. This work addresses these knowledge gaps, provides practical prediction models of tensile strength and reinforcement-concrete bond strength of FAGC, and uses the strength models to estimate the cracking behaviors of reinforced FAGC beams and calculate the design anchorage length.
In addition, it notes that the data is from FAGC with different sources of fly ash and different mix designs, so the models do not depend on the sources of fly ash and the mix designs.

2. Materials and Methods

2.1. Strength Test

2.1.1. Materials

Low-calcium fly ash (ASTM C618 Class F, Shenzhen Dot Co., Ltd., Shenzhen, China) was used as the source material for producing geopolymer binder. The oxide composition of fly ash as determined by X-ray fluorescence (XRF) (Shimadzu Corporation, Tokyo, Japan), is shown in Table 1. The particle size distribution of fly ash as determined by HELOS-RODOS (SYMPATEC GmbH, Clausthal-Zellerfeld, Germany), is shown in Figure 1.
The alkaline solution was a combination of sodium silicate (Na2SiO3, Foshan Zhongfa Silicate Co., Ltd., Foshan, China) with a modulus ratio (Ms) of 3.13 (where Ms = SiO2/Na2O, Na2O = 8.83%, SiO2 = 27.64%) and sodium hydroxide (NaOH, Chengdu Kelong Chemical Reagent Factory, Chengdu, China) prepared by dissolving NaOH solids (98% purity) in water. The alkaline solution was prepared approximately 24 h before usage.
Both coarse aggregates and fine aggregates in a saturated surface dry condition were used in this work. Crushed stone in three-grain sizes was used as coarse aggregate: 5–10 mm (50%), 10–16 mm (35%), and 16–20 mm (15%). Natural sand with fineness modulus of 2.3 was used as fine aggregate.

2.1.2. Mix Proportions

The mix proportions of all mixtures are shown in Table 2. The tested results of Mix. 1–4 are added to databases for developing models, and those of Mix. 5–9 are for validating models. Their compressive strength is also given in Table 2. The compressive strength (fc) was tested on a 2000 KN electro-hydraulic mechanical testing machine (Changchun testing machine factory, Changchun, China) with a constant load rate of 3 KN/s using 100 mm cubes cured 28 days [28].

2.1.3. Preparation of Test Specimens

The mixing of the concrete was undertaken in a compulsory mixer (Beijing Shenkeweijie Instrument and Equipment Co., Ltd, Beijing, China). First, fine and coarse aggregates were dry mixed in the mixer for 1 min, and then the fly ash was poured into the mixer for another minute. Second, the alkaline solution was sequentially added, and the mixing continued for 2 min. Finally, the fresh concrete was placed in steel molds, and they were then compacted on a table vibrator.
We cast 100 mm cubes for measuring the splitting tensile strength (fst) and modified direct pull-out specimens as shown in Figure 2 for measuring the bond strength (τ). Before casting, the steel bars were aligned with the center of the side baffles of the pull-out specimen molds and then fixed. Oil was applied to the inside surfaces of both the pull-out specimen molds and the cube molds. After casting, the specimens with the molds were covered with plastic film to prevent moisture loss, and they were then cured at 80 °C in an oven for 24 h. After removal from their molds, the specimens were cured in open air at 20–25 °C for 27 days.

2.1.4. Splitting Tensile Strength Test
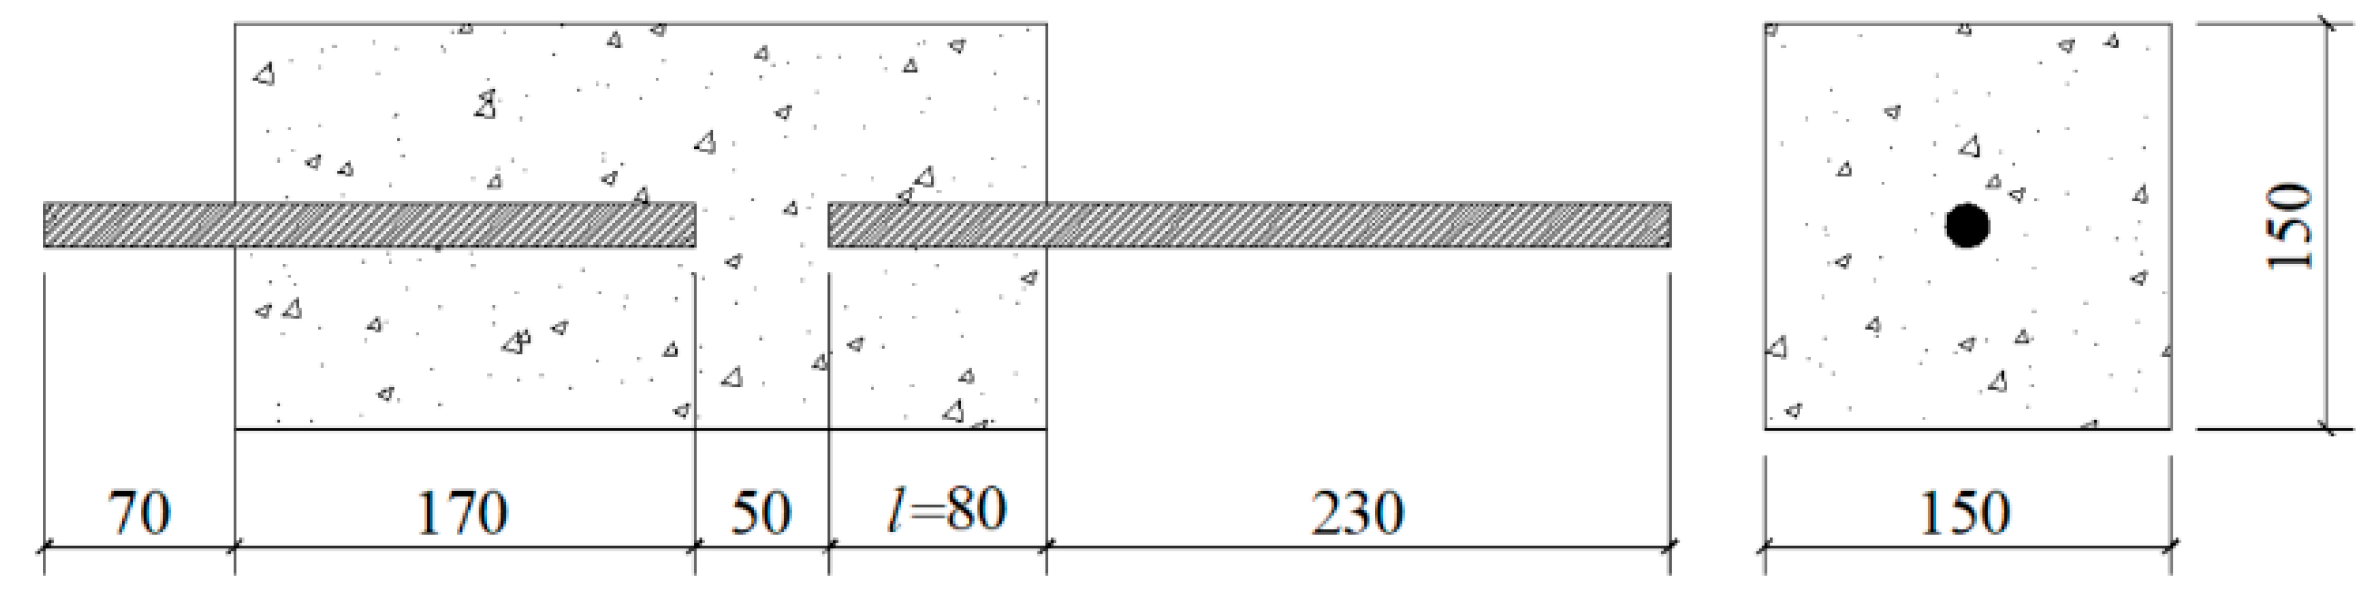
The tensile strength can be measured using the axial tensile strength test, splitting tensile strength test or flexural strength test. The axial tensile strength test is the most appropriate method to determine tensile strength, but it is more difficult than the splitting tensile strength test and the flexural strength test. Also, the value of the splitting tensile strength approaches that of the axial tensile strength, and it can also be used to predict the bond strength. Therefore, the splitting tensile strength test was used in this work. The splitting tensile strength was tested on a 300 KN capacity universal testing machine (Reger, Shenzhen, China) with a constant load rate of 300 N/s at ages of 28 days.

2.1.5. Bond Test

Various types of specimens were used for the bond test. Popularly-used specimens include direct pull-out specimens and beam-end specimens. The direct pull-out specimens are easy to fabricate and test, but the surrounding concrete is in compression as the bars are in tension. This stress state differs from most reinforced concrete members, in which both the bars and the surrounding concrete are in tension. The beam-end specimens provide more realistic measures of bond strength in actual structures, but their fabrication and testing are complex. Therefore, we adopted a modified direct pull-out test, as shown in Figure 2 and Figure 3. The specimens were easy to fabricate and test, and the concrete remained in tension [29].
The specimen consisted of a concrete prism in which two HRB500 rebars of 16 mm diameter were embedded. The two bars were separated by 50 mm. When two bars were pulled in opposite directions, the bar with the shorter embedded length was pulled out. The shorter embedded length was 80 mm which was five times the bar diameter. The test was conducted using a 300 KN capacity universal testing machine with a constant displacement rate of 0.2 mm/min. The pull-out load was applied through the free ends of the embedded bars using friction grips.
The bond strength τ can be derived from Equation (1)
τ = F / ( π d l )
where F = ultimate force applied to bars; d = bar diameter, 16mm in this work; and l = embedded length of bar, 80mm in this work.

2.2. Database

A comprehensive literature review was conducted to establish databases for developing the models.
It is noted that different kinds of tested specimen for compressive strength and splitting tensile strength are adopted in different studies, so the effect of size and shape of tested specimens on strength is considered in this work. The common-used tested specimens include 100 mm cubes, 150 mm cubes, 100 × 200 mm2 cylinders (100 mm in diameter and 200 mm in length), and 150 × 300 mm2 cylinders (150 mm in diameter and 300 mm in length). The 150 × 300 mm2 cylinder is the standard specimen in ACI (American Concrete Institute) 318 and CEB-FIP (Fib, fédération internationale du béton), and the 150 × 300 mm2 cylinder strength is used in the models of ACI 318 and CEB-FIP. Therefore, to compare with the models of ACI 318 and CEB-FIP, the strength measured by the other specimens needs to be converted to that of the 150 × 300 mm2 cylinder.
The larger the volume of the concrete subjected to stress, the more likely it is to contain an element of a given low strength. As a result, the measured strength of the specimen decreases with an increase in its size. Due to the friction between the specimen and the testing machine, the measured compressive strength of the cube specimen is higher than that of the cylinder specimen with the length-to-diameter ratio of 2. So far, no study has investigated the effect of size and shape of tested specimens on strength for FAGC, but the above two conclusions still apply to FAGC. Therefore, in this work, we supposed that the conversion factors of compressive strength and splitting tensile strength for PCC also applied to FAGC. This assumption has also been used in reference [28].
The conversion factors of compressive strength and splitting tensile strength are shown in Table 3 and Table 4, respectively [30,31,32]. For example, for C60 concrete, according to Table 3, we can multiply the 100 mm cube compressive strength by the specific conversion factor 0.819 to obtain the 150 × 300 mm2 cylinder compressive strength.

2.3. Proposing Models and Corresponding 90% Prediction Intervals

The strength models were derived using the statistical regression analysis based on the databases. The least squares estimation procedure was used for the regression analysis. It uses the criterion that the solution must give the smallest possible sum of deviations of the observed Y i from the estimates of their true means provided by the solution [33].
Before solving with the models, the functions and the independent variables we selected were given, as shown in Equations (2)–(5). The existing models of PCC were used for reference, as shown in Equations (6)–(9). There were differences between ACI 318 and CEB-FIP, as follows.
  • Different functions were adopted.
  • Besides the bar diameter to development length ratio (d/l) and the minimum cover to bar diameter ratio (cmin/d), CEB-FIP also considered the bar diameter (1/d) and the maximum cover (cmax/cmin).
All the models were non-linear models, but Equations (2)–(4) can be linearized by an appropriate transformation on the dependent variable and there were explicit solutions. For nonlinear regression analysis like Equation (5), the iterative numerical method was used, where the values of the parameters in the existing model of PCC were used as the starting values of the parameters in the models of FAGC.
f s t = k f c n
f s t = a I n ( f c ) b
τ = k 1 f c n ( 1 d ) k 2 ( d l ) k 3 ( c m i n d ) k 4 ( c m a x c m i n ) k 5
τ = ( m 1 + m 2 c m i n d + m 3 d l ) f c n
ACI 318 (America code) [34]:
f s t = 0.556 f c 0.5
ACI 318 [34]:
τ = 0.083 ( 1.2 + 3 c m i n d + 50 d l ) f c 0.5
CEB-FIP (Europe code) [35]:
f s t = 2.329 I n ( f c ) 4.71
CEB-FIP [35]:
τ = 54 4 ( f c 25 ) 0.25 ( 25 d ) 0.2 ( d l ) 0.45 ( c m i n d ) 0.25 ( c m a x c m i n ) 0.1
where d = bar diameter, l = development length, cmin = min{side cover, bottom cover, half of bar spacing}, cmax = max{side cover, bottom cover, half of bar spacing}.
In addition, a data point may be an outlier because of errors in conducting the study (machine malfunction; recording, coding, or data entry errors; failure to follow the experimental protocol). Therefore, during modelling, we identified outliers through studentised residual r t * , as computed in Equations (10)–(12) [33]. When r t * > 3 , the data point can be regarded as an outlier.
After solving with the linear models, t-test was conducted to determine whether the dependent variable was related to each selected independent variable or not. The t-value, as computed in Equation (13), is compared to the corresponding critical value. In addition, the determination coefficient R 2 , as computed in Equation (14), should be given to show the fitting precision of the models, which also applies to nonlinear models.
Note that these models only provide the estimated mean of the strength. Considering the large scatter of the strength of concrete, besides the models, the 90% prediction interval of the models, especially the lower limit of the prediction interval, is essential for design. The 90% prediction interval means there is a 90% probability that the true value of strength is within the interval. The lower limit of the 90% prediction interval is defined as the characteristic value, which means there is a 95% probability that the true value of strength is higher than the characteristic value. For linear models, the 90% prediction interval is given in Equations (18) and (19) which are derived from Equations (10) and (15)–(17) [33].
s 2 = i = 1 n ( Y i Y i ^ ) 2 n p 1
r i = Y i Y i ^ s 1 v i i
r t * = r i ( n p 2 n p 1 r i 2 ) 0.5
t = β j ^ s ( X X ) 1
R 2 = 1 i = 1 n ( Y i Y i ^ ) 2 i = 1 n ( Y i Y ¯ ) 2
Y Y ^   ~   N   ( 0 ,   [ 1 + x ( X X ) 1 x ] σ 2 )
P { | Y Y ^ 1 + x ( X X ) 1 x s | < t α / 2 ( n p 1 ) } = 1 α
P { Y m i n Y Y m a x } = 90 %
Y m a x = Y ^ + t 0.05 ( n p 1 ) i = 1 n ( Y i Y i ^ ) 2 n p 1 1 + x ( X X ) 1 x
Y m i n = Y ^ t 0.05 ( n p 1 ) i = 1 n ( Y i Y i ^ ) 2 n p 1 1 + x ( X X ) 1 x
where β j ^ is an unbiased estimator of the corresponding parameter of each independent variable; Y is the true value of the dependent variable; Y ^ is an unbiased estimator of the mean of Y ; Y i is each observed value of the dependent variable; Y i ^ is the prediction value of Y i by the model; Y ¯ is the mean of all observed values of the dependent variable; x is the 1 × ( p + 1 ) matrix consisting of a column of ones, followed by the independent variables; X is the n × ( p + 1 ) matrix consisting of a column of ones, followed by the observations on independent variables; v i i is the ith diagonal element of X ( X X ) 1 X ; s 2 is an unbiased estimator of σ 2 ; σ 2 is the variance of the random errors; n is the number of data points; p is the number of independent variables.

2.4. Validation of Models

Having developed the models in this research, the splitting tensile strength and bond strength of five FAGCs were measured according to Section 2.1.4 and Section 2.1.5, and then the results were used to validate the models. Their mix proportions and compressive strength are shown in Table 2.

3. Results

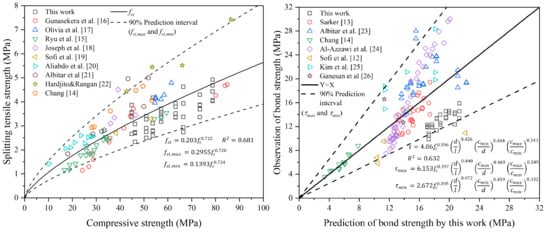
3.1. Database of Splitting Tensile Strength

A summary of the splitting tensile strength and corresponding compressive strength of FAGC is tabulated in Table 5, including 70 test results from previously published literature [14,15,16,17,18,19,20,21,22] and 20 test results from this work.

3.2. Database of Bond Strength

A summary of the bond strength, corresponding compressive strength, and size details of the specimens of FAGC are listed in Table 6, including 120 test results from previously published literature [12,13,14,23,24,25,26] and 12 test results from this work.

4. Discussion

4.1. Splitting Tensile Strength Model

Based on the basic equations as shown in Equations (2) and (3) and the database as listed in Table 5, models were proposed through simple linear regression analysis, as expressed in Equations (20)–(23) and shown in Table 7.
The p value < 0.01 shows that there is a highly significant linear relationship between the independent variable X and the dependent variable Y. Therefore, Equations (20)–(23) can describe the relationship between splitting tensile strength and compressive strength of FAGC satisfactorily. Although the resulting values of R2 in Table 7 do not seem sufficiently high, the R2 corresponding to the P value of 0.01 is only 0.07 when there are 90 data points [33].
According to R2, Equation (20) can describe the relationship better. In addition, when Equation (22) is adopted, a data point from reference [22] (fc = 86.41 MPa, fst = 7.43 MPa) is regarded as an outlier, while, when Equation (20) is adopted, no outlier is detected. It means that this data point is not a true outlier and Equation (22) is not a suitable model to express the relationship between splitting tensile strength and compressive strength. In summary, Equation (20), which uses the function in ACI 318, is recommended.
f s t ,   m a x = 0.2955 f c 0.720
f s t ,   m i n = 0.1393 f c 0.724 0.686 f s t
The 90% prediction interval of Equation (20) is given, as shown in Equations (24) and (25). It can be seen from Figure 4 that 92% of data points are in the prediction interval. If the value of splitting tensile strength needs to be given, the characteristic strength, the lower limit of the prediction interval, is recommended in consideration of the safety requirements of the structure. The lower limit is approximately 70% of the mean value. For PCC, CEB-FIP states that the lower limit of tensile strength is also 70% of the mean value [35]. This means the scatter of the tensile strength of FAGC is close to that of PCC.
Equations (21) and (23) show that the splitting tensile strength of FAGC is lower than that of PCC with the same compressive strength. The existing models of PCC overestimate the splitting tensile of FAGC, so the models of PCC cannot apply to FAGC.

4.2. Validation of Splitting Tensile Strength Model

The results of the splitting tensile strength and corresponding compressive strength of FAGC for validation of splitting tensile strength model is tabulated in Table 8, and plotted in Figure 5. It can be seen from Figure 5 that almost all data points are within the prediction intervals proposed by this work. Equation (20) is verified to predict the splitting tensile strength of FAGC.

4.3. Bond Strength Model

The bond strength model can be unified in the form of Equation (26), where f(c, l, d) shows the effects of structural factors on bond strength and fcn shows the effect of the material. For PCC, two different forms of functions f(c, l, d) were adopted in ACI 318 and CEB-FIP, as shown in Equations (7) and (9).
τ = f ( c , l , d ) f c n
During the modelling of Equation (4), 1/d, one of the dependent variables we selected, failed the t-test, while the other dependent variables passed the t-test. This means that the relationship between this dependent variable and bond strength is not significant. Therefore, this dependent variable was deleted, and then a new basic equation Equation (27) replaced Equation (4).
τ = f ( c , l , d ) f c n
Based on the database as listed in Table 6 and the basic equations as shown in Equations (27) and (5), Equations (28) and (29) were obtained to predict bond strength. According to the correlation coefficient (R2), Equations (28) and (29) give a good prediction of the bond strength, and Equation (28) is better. It is noted that these two equations are for unconfined FAGC specimens, as the effect of transverse reinforcement is not considered. However, considering that the transverse reinforcement is always beneficial to the bond strength, the bond strength predicted by Equations (28) and (29) is safe and can be applied to structural design. Figure 6 shows the comparison of the observation and prediction of bond strength by Equation (28).
τ = 4.06 f c 0.396 ( d l ) 0.456 ( c m i n d ) 0.464 ( c m a x c m i n ) 0.341   R 2 = 0.632
τ = ( 0.249 + 0.269 c m i n d + 12.785 d l ) f c 0.4 R 2 = 0.598

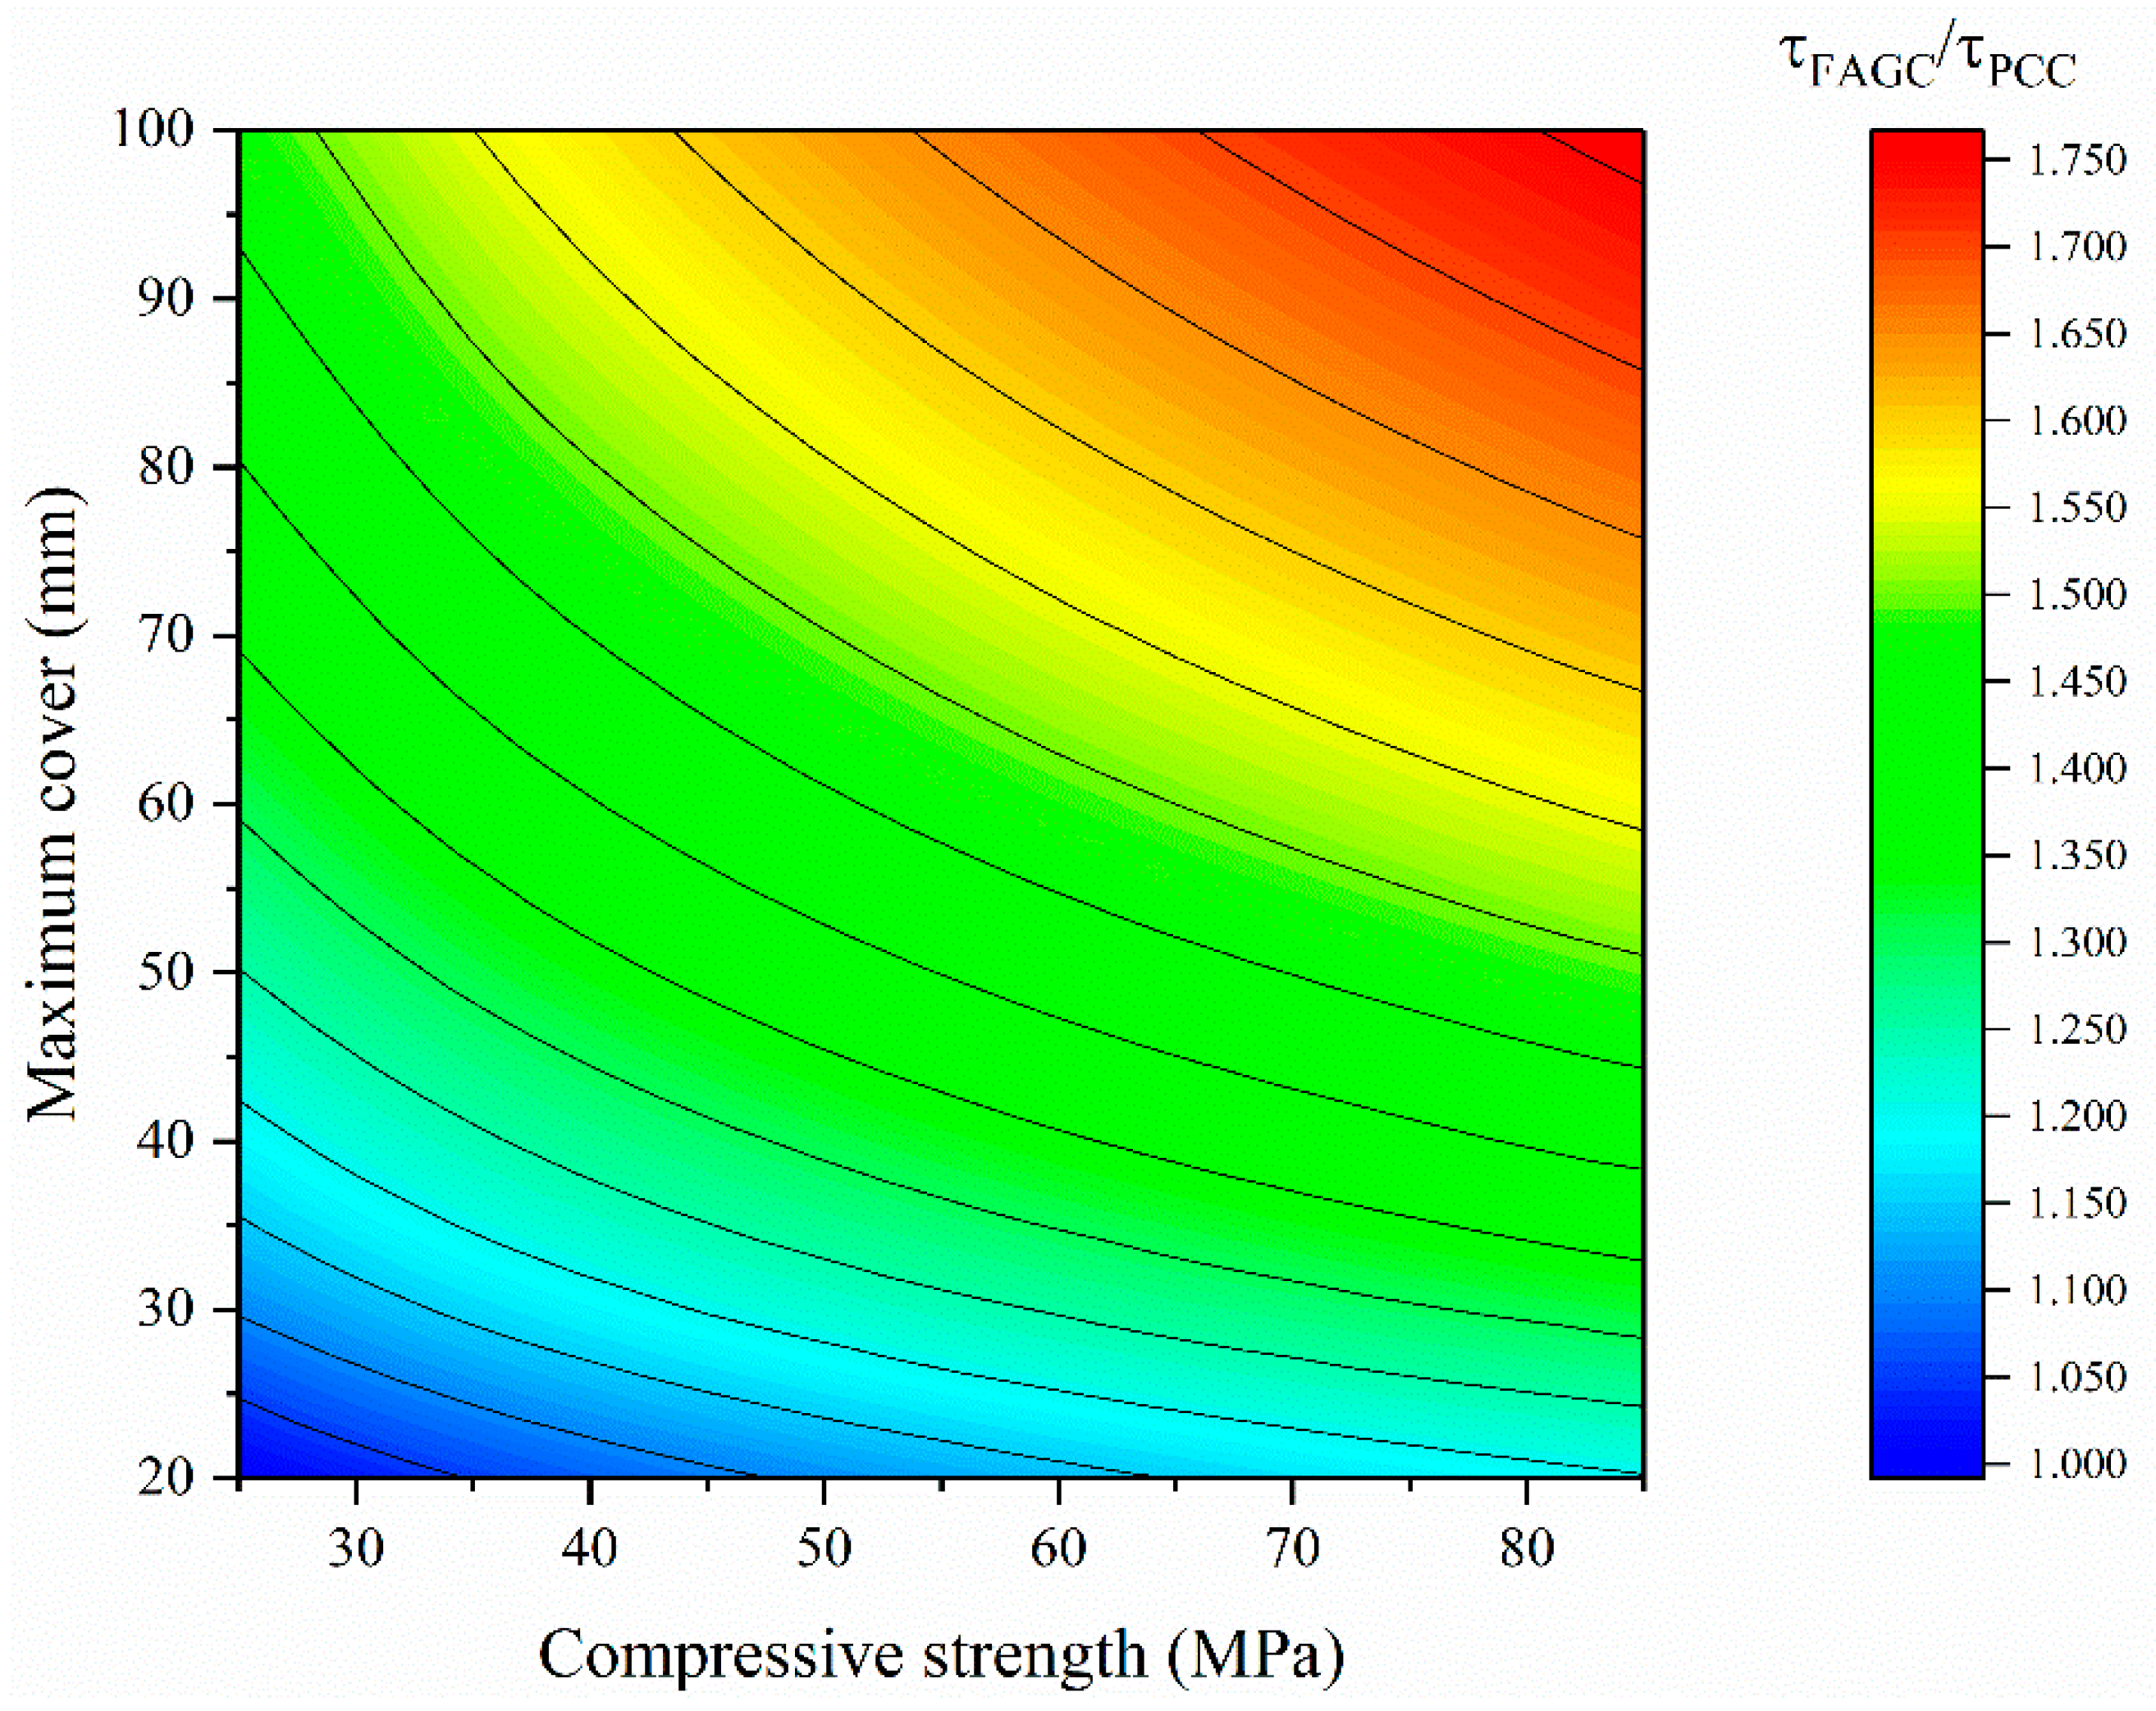
4.4. Comparison of Bond Strength of Portland Cement Concrete (PCC) and Fly Ash Geopolymer Concrete (FAGC)

In both Equations (28) and (29), the power of the compressive strength is near 0.4. The value is between 0.25 and 0.5, which means the contribution of compressive strength on the bond strength of FAGC is near that of PCC. Similarly to the bond strength of PCC, the bond strength of FAGC also increases with the increase of the cover to diameter ratio or the diameter to development length ratio.
However, the contribution of these structural factors on the bond strength of FAGC is different from that of PCC. We can divide Equation (28) by Equation (9) to obtain the relative value of the bond strength of FAGC to that of PCC in the same case. The result is given in Equation (30) and Figure 7.
τ F A G C τ P C C = 0.353 f c 0.146 ( 1 d ) 0.2 ( d l ) 0.006 ( c m i n d ) 0.214 ( c m a x c m i n ) 0.241
= 0.353 f c 0.146 ( 1 d ) 0.008 ( 1 l ) 0.006 ( 1 c m i n ) 0.027 c m a x 0.241
0.353 f c 0.146 ( 1 19 ) 0.008 ( 1 550 ) 0.006 ( 1 25 ) 0.027 c m a x 0.241 = 0.304 f c 0.146 c m a x 0.241 ,
As shown in Equation (30), both the power values of the compressive strength and maximum cover are relatively large, so the relative value is mainly related to the compressive strength and maximum cover. The power values of the bar diameter, development length, minimum cover in Equation (33) are small, so their average values are selected to calculate their effect on the relative value. Bar diameters are commonly between 6–32 mm; the minimum cover is usually the bottom cover or the side cover, of size between 20–30 mm; the development length is usually between 100–1000 mm; the maximum cover is usually half of the spacing between bars, so it is usually between 20–100 mm; the compressive strength is usually 25–85 MPa. Therefore, the bond strength of FAGC is 1.00–1.76 times that of PCC in the same case, as shown in Figure 7. Note that in the case of lower compressive strength and a smaller maximum cover (i.e., a smaller spacing between bars), the bond strength of FAGC is only slightly higher than that of PCC.
In addition, it is noted that the above bond strength is the estimated mean value rather than the characteristic value. For the safety of structures, the characteristic value is more commonly used in structure design, as the probability that the true value of the strength is above the characteristic value is 95%, while the probability that it is above the estimated mean is only 50%.
Equation (31) in CEB-FIP gives the characteristic value of bond strength of PCC, which shows the characteristic value is 0.759 times the mean value for PCC [35]. In this work, the 90% prediction interval of Equation (28) is given, as shown in Equations (32) and (33). The lower limit of the prediction interval is the characteristic value of bond strength of FAGC, which shows the characteristic value is 0.616 times the mean value for FAGC. This means that the scatter of bond strength of FAGC is larger than that of PCC. Therefore, it is important to compare the characteristic values of bond strength of PCC and FAGC after comparing the mean values of the bond strength of PCC and FAGC.
The comparison of the characteristic values of bond strength of PCC and FAGC is shown in Equation (34) obtained through dividing Equation (33) by Equation (31). The result is plotted in Figure 8.
Previous literature [12,13,14,23,24,25,26] showed that the bond strength of FAGC is higher than that of PCC with the same case, so it was concluded that using the PCC model to predict the bond strength of FAGC is conservative but feasible. However, this work shows that although the mean value of bond strength of FAGC is higher than that of PCC in the same case, the characteristic value of bond strength of FAGC is lower than that of PCC in the case of a smaller maximum cover (i.e., a smaller spacing between bars). This means that the prediction model of bond strength for PCC cannot be used directly for FAGC.
τ P C C , c = 41 4 ( f c 25 ) 0.25 ( 25 d ) 0.2 ( d l ) 0.45 ( c m i n d ) 0.25 ( c m a x c m i n ) 0.1 ,
τ F A G C , m a x = 6.153 f c 0.397 ( d l ) 0.440 ( c m i n d ) 0.469 ( c m a x c m i n ) 0.349
= 1.5155 f c 0.001 ( d l ) 0.016 ( c m i n d ) 0.005 ( c m a x c m i n ) 0.008 τ
1.5155 ( 55 ) 0.001 ( 19 550 ) 0.016 ( 25 19 ) 0.005 ( 60 25 ) 0.008 τ = 1.629 τ ,
τ F A G C , c = τ F A G C , m i n = 2.672 f c 0.395 ( d l ) 0.472 ( c m i n d ) 0.459 ( c m a x c m i n ) 0.332
= 0.658 f c 0.001 ( d l ) 0.016 ( c m i n d ) 0.005 ( c m a x c m i n ) 0.008 τ
0.658 ( 55 ) 0.001 ( 19 550 ) 0.016 ( 25 19 ) 0.005 ( 60 25 ) 0.008 τ = 0.616 τ ,
τ F A G C , c τ P C C , c = 0.306 f c 0.145 ( 1 d ) 0.2 ( d l ) 0.022 ( c m i n d ) 0.209 ( c m a x c m i n ) 0.232
= 0.306 f c 0.145 ( 1 d ) 0.013 ( 1 l ) 0.022 ( 1 c m i n ) 0.023 c m a x 0.232
0.306 f c 0.145 ( 1 19 ) 0.013 ( 1 550 ) 0.022 ( 1 25 ) 0.023 c m a x 0.232 = 0.257 f c 0.145 c m a x 0.232 , .

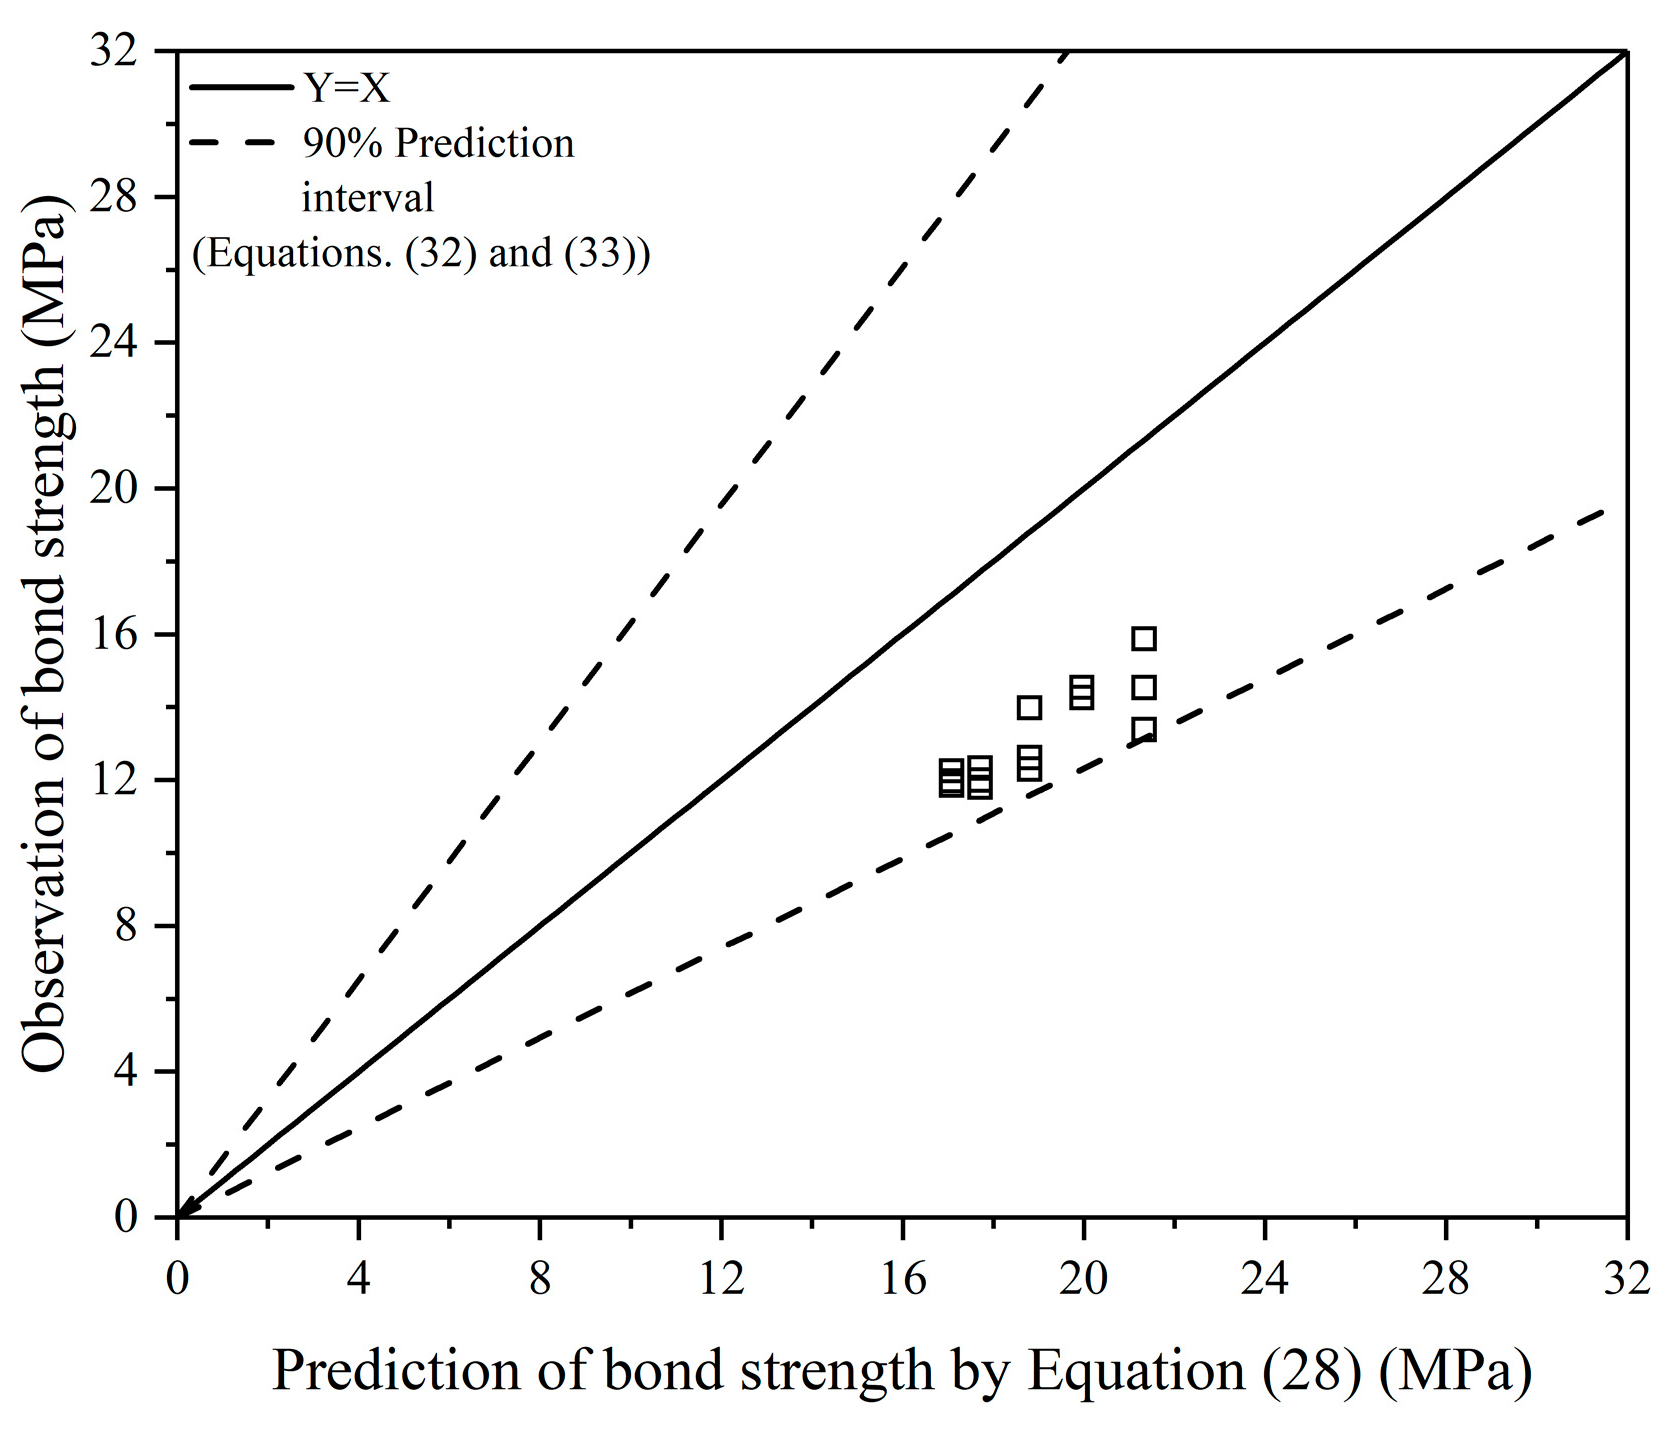
4.5. Validation of Bond Strength Model

The results of the bond strength for validation of the bond strength model and the corresponding compressive strength and size details of the specimens of FAGC are listed in Table 9.
It can be seen from Figure 9 that all data points are within the prediction interval proposed by this work. The bond strength model is verified. Meanwhile, it should be noted that all data points are below the estimated mean value, which shows the importance of the characteristic value in structural design.

4.6. Design Anchorage Length of Reinforced FAGC Beams

The design anchorage length lb may be calculated from Equation (35).
l b = f y d 4 τ
where fy = tensile strength of the reinforcement.
To ensure reliable anchorage lengths, the characteristic value of bond strength as shown in Equation (33) is adopted. Then, the calculation equation of design anchorage length of reinforced FAGC beams is derived, as shown in Equation (36).
l b = ( 0.0936 f y f c 0.395 d 0.987 c m i n 0.127 c m a x 0.332 ) 1.894
The curves of the design anchorage length of reinforced FAGC beams vs. the maximum cover for different cases are calculated based on Equation (36) and compared with those of reinforced PCC beams proposed by GB 50010–2010 [36], as shown in Figure 10. The design anchorage lengths of reinforced FAGC beams are much longer than those of reinforced PCC beams in the case of a small maximum cover (i.e., a smaller spacing between bars). This can be explained by the fact that the bond strength of FAGC is lower than that of PCC in this case, as shown in Figure 8. Based on this, to obtain suitable design anchorage lengths of reinforced FAGC beams, the minimum bar spacing needs to be restricted in the design code for FAGC.

4.7. Prediction of Cracking Behaviors of Reinforced FAGC Beams

The cracking moment of reinforced concrete beams is much smaller than the ultimate bearing capacity, so most of them are in the cracking state, and the cracking behaviors, such as cracking moment and crack spacing and width, deserve our attention.

4.7.1. Cracking Moment

The cracking moment Mcr of a rectangular cross-section beam may be predicted from Equation (37).
M c r = 0.256 f t b h 2
where ft = concrete tensile strength, b = width of rectangular cross-section, h = height of rectangular cross-section.
By incorporating the tensile strength model of FAGC proposed by this work (Equation (20)) to Equation (37), the cracking moment can be predicted based on the compressive strength and Equation (38). To validate the prediction model, the experiment results on the cracking moment of reinforced FAGC beams were collected from previous literature [37], as listed in Table 10. The corresponding Mcr and test/prediction ratios predicted by Equation (38) are also shown in Table 10. The average test/prediction ratio of Mcr is 1.00, with a standard deviation of 0.06. Mcr predicted by Equation (38) is closer to the test result than Mcr predicted by reference [37]. Both indicate that Equation (38) can predict Mcr of reinforced FAGC beams well.
M c r = 0.256 ( 0.203 f c 0.722 ) b h 2

4.7.2. Crack Spacing and Width

For reinforced PCC beams, the average crack spacing Scr can be analytically evaluated by many models in papers or codes. The results of Khuram Rashid et al. showed that incorporating the rebar-concrete bond strength in Zhang’s model resulted in more precise analytical values than using the design node of JSCE (Japan Society of Civil Engineers) or CEB-FIP for blended slag and fly ash geopolymer concrete [38]. However, they still used the bond strength model for PCC.
In this work, the crack spacing was evaluated by using Zhang’s model as shown in Equation (39) [39]. And to obtain a precise result for FAGC, the bond strength model used Equation (28) and the tensile strength model used Equation (20). See reference [39] for the calculation of At. l in Equation (28) should be Scr, as the crack spacing is the development length of concrete through which concrete stress grows from zero to tensile strength. Then, the prediction model of the crack spacing of reinforced FAGC beams was obtained, as shown in Equation (40).
Zhang’s model [39]:
Zhang s   model   [ 39 ] :   S c r = 1.5 f t A t τ   O r
where   O r = total perimeter of tension reinforcement, At = entire effective tension area.
To validate the prediction model, the experimental results on the crack spacing of reinforced FAGC beams were collected from previous literature [37,40], as listed in Table 11. Based on the details of these tested reinforced FAGC beams as shown in Table 12, the corresponding Scr and test/prediction ratios can be predicted by Equation (40), as shown in Table 11. The average test/prediction ratio of Scr is 1.11, with a standard deviation of 0.17. This indicates that Equation (40) can predict Scr of reinforced FAGC beams well.
S c r = ( 1.5 0.203 f c 0.326 A t 4.06 d 0.456 ( c m i n d ) 0.464 ( c m a x c m i n ) 0.341   O r ) 1 / 0.544
The crack width w can be obtained from the crack spacing, as it is the tensile extension difference between the reinforcement and the concrete within the crack spacing [41]. Considering that the tensile strain of concrete is very small, the crack width can be derived from Equation (41).
w = ( σ s E s ) S c r
where σs = stress in the reinforcement at a cracked section, Es = modulus of elasticity of the reinforcement.
Based on Equations (39) and (41), it is concluded that from a qualitative perspective, compared with PCC, the higher bond strength and the lower tensile strength of FAGC leads to the narrower crack width of reinforced concrete beams, which is beneficial to the durability of reinforced concrete beams.

5. Conclusions

This study has established the databases of splitting tensile strength and bond strength of FAGC, developed and verified the prediction models and the corresponding prediction intervals of splitting tensile strength and bond strength of FAGC, and used the strength models to calculate the design anchorage length and estimate the cracking moment, crack spacing and width of reinforced FAGC beams.
Based on this study, the following conclusions are obtained:
  • Compared with the previous strength models of FAGC, the tensile strength model in this study considers the effect of shape and size of tested specimens on strength, and the bond strength model in this study considers the cover to diameter ratio and the diameter to development length ratio. Therefore, the models in this study can be used as the design equations for estimating the tensile strength and reinforcement-concrete bond strength of FAGC.
  • The strength models provide the corresponding 90% prediction intervals. The lower limit of the prediction intervals is the characteristic value of the strength.
  • The splitting tensile strength of FAGC is slightly lower than that of PCC with the same compressive strength, while the scatter of the splitting tensile strength of FAGC is close to that of PCC.
  • The scatter of the bond strength of FAGC is larger than that of PCC. This results in the fact that for the bond strength of FAGC, although the estimated mean value is higher than that of PCC in the same case, the characteristic value may be lower than that of PCC in the case of a small bar spacing.
  • The strength prediction models of PCC cannot be used for FAGC.
  • To ensure adequate anchorage and suitable design anchorage lengths of reinforced FAGC beams, the minimum bar spacing needs to be restricted in the design code for FAGC.
  • Incorporating the models into the prediction models of the cracking behaviors for PCC gives good predictions on the cracking moment and crack spacing of reinforced FAGC beams.

Author Contributions

Conceptualization, C.L.; methodology, C.L.; validation, C.L.; investigation, C.L., F.Y., K.Z., N.U. and J.D.; resources, Q.W. and X.S.; writing—original draft preparation, C.L.; writing—review and editing, C.L. and X.S.; supervision, Q.W. and X.S.; project administration, X.S.; funding acquisition, Q.W. and X.S. All authors have read and agreed to the published version of the manuscript.

Funding

This research and the APC were funded by Science and Technology Department of Sichuan province, grant number 2020YJ0319.

Institutional Review Board Statement

Not applicable.

Informed Consent Statement

Not applicable.

Data Availability Statement

The data presented in this study are available on request from the corresponding author.

Acknowledgments

Thanks for the support from Failure Mechanics and Engineering Disaster Prevention and Mitigation Key Lab of Sichuan Province.

Conflicts of Interest

The authors declare no conflict of interest.

References

  1. Elahi, M.M.A.; Hossain, M.M.; Karim, M.R.; Zain, M.F.M.; Shearer, C. A review on alkali-activated binders: Materials composition and fresh properties of concrete. Constr. Build. Mater. 2020, 260, 119788. [Google Scholar] [CrossRef]
  2. Xie, T.; Visintin, P.; Zhao, X.; Gravina, R. Mix design and mechanical properties of geopolymer and alkali activated concrete: Review of the state-of-the-art and the development of a new unified approach. Constr. Build. Mater. 2020, 256, 119380. [Google Scholar] [CrossRef]
  3. Zhang, P.; Gao, Z.; Wang, J.; Guo, J.; Ling, Y. Properties of fresh and hardened fly ash/slag based geopolymer concrete: A review. J. Clean. Prod. 2020, 122389. [Google Scholar] [CrossRef]
  4. Fernández-Jiménez, A.M.; Palomo, A.; López-Hombrados, C. Engineering properties of alkali-activated fly ash concrete. Aci Mater. J. 2006, 103, 106–112. [Google Scholar]
  5. Bakharev, T. Durability of geopolymer materials in sodium and magnesium sulfate solutions. Cem. Concr. Res. 2005, 35, 1233–1246. [Google Scholar] [CrossRef]
  6. Song, X. Development and Performance of Class F Fly Ash Based Geopolymer Concretes against Sulphuric Acid Attack. Ph.D. Thesis, School of Civil and Environmental Engineering, The University of New South Wales, Kensington, Australia, 2007. [Google Scholar]
  7. Kong, D.L.Y.; Sanjayan, J.G.; Sagoe-Crentsil, K. Comparative performance of geopolymers made with metakaolin and fly ash after exposure to elevated temperatures. Cem. Concr. Res. 2007, 37, 1583–1589. [Google Scholar] [CrossRef]
  8. Adak, D.; Mandal, S. Strength and durability performance of fly ash–based process-modified geopolymer concrete. J. Mater. Civil Eng. 2019, 31, 04019174–1–04019174-8. [Google Scholar] [CrossRef]
  9. Mo, K.H.; Alengaram, U.J.; Jumaat, M.Z. Structural performance of reinforced geopolymer concrete members: A review. Constr. Build. Mater. 2016, 120, 251–264. [Google Scholar] [CrossRef]
  10. Hassan, A.; Arif, M.; Shariq, M. A review of properties and behavior of reinforced geopolymer concrete structural elements- A clean technology option for sustainable development. J. Clean. Prod. 2020, 245. [Google Scholar] [CrossRef]
  11. Sumajouw, D.M.J.; Hardjito, D.; Wallah, S.E.; Rangan, B.V. Fly ash-based geopolymer concrete: Study of slender reinforced columns. J. Mater. Sci. 2007, 42, 3124–3130. [Google Scholar] [CrossRef]
  12. Sofi, M.; van Deventer, J.S.J.; Mendis, P.A.; Lukey, G.C. Bond performance of reinforcing bars in inorganic polymer concrete (IPC). J. Mater. Sci. 2007, 42, 3107–3116. [Google Scholar] [CrossRef]
  13. Sarker, P.K. Bond strength of reinforcing steel embedded in fly ash-based geopolymer concrete. Mater. Struct. 2011, 44, 1021–1030. [Google Scholar] [CrossRef]
  14. Chang, E.H. Shear and Bond Behavior of Reinforced Fly Ash-Based Geopolymer Concrete Beams. Ph.D. Thesis, Curtin University of Technology, Perth, Australia, 2009. [Google Scholar]
  15. Ryu, G.S.; Lee, Y.B.; Koh, K.T.; Chung, Y.S. The mechanical properties of fly ash-based geopolymer concrete with alkaline activators. Constr. Build. Mater. 2013, 47, 409–418. [Google Scholar] [CrossRef]
  16. Gunasekera, C.; Setunge, S.; Law, D.W. Correlations between Mechanical Properties of Low-Calcium Fly Ash Geopolymer Concretes. J. Mater. Civil Eng. 2017, 29. [Google Scholar] [CrossRef]
  17. Olivia, M.; Nikraz, H. Properties of fly ash geopolymer concrete designed by Taguchi method. Mater. Des. 2012, 36, 191–198. [Google Scholar] [CrossRef] [Green Version]
  18. Joseph, B.; Mathew, G. Influence of aggregate content on the behavior of fly ash based geopolymer concrete. Sci. Iran. 2012, 19, 1188–1194. [Google Scholar] [CrossRef] [Green Version]
  19. Sofi, M.; van Deventer, J.S.J.; Mendis, P.A.; Lukey, G.C. Engineering properties of inorganic polymer concretes (IPCs). Cem. Concr. Res. 2007, 37, 251–257. [Google Scholar] [CrossRef]
  20. Aliabdo, A.A.; Abd Elmoaty, A.E.M.; Salem, H.A. Effect of cement addition, solution resting time and curing characteristics on fly ash based geopolymer concrete performance. Constr. Build. Mater. 2016, 123, 581–593. [Google Scholar] [CrossRef]
  21. Albitar, M.; Visintin, P.; Ali, M.S.M.; Drechsler, M. Assessing behavior of fresh and hardened geopolymer concrete mixed with class-F fly ash. KSCE J. Civ. Eng. 2015, 19, 1445–1455. [Google Scholar] [CrossRef]
  22. Hardjito, D.; Rangan, B.V. Development and Properties of Low-Calcium Fly Ash-Based Geopolymer Concrete; Research Report GC1; Faculty of Engineering, Curtin University of Technology: Perth, Australia, 2005; Available online: www.geopolymer.org/news/research-report-on-fly-ash-based-geopolymer-concrete/ (accessed on 5 March 2021).
  23. Albitar, M.; Visintin, P.; Ali, M.S.M.; Lavigne, O.; Gamboa, E. Bond Slip Models for Uncorroded and Corroded Steel Reinforcement in Class-F Fly Ash Geopolymer Concrete. J. Mater. Civ. Eng. 2017, 29. [Google Scholar] [CrossRef]
  24. Al-Azzawi, M.; Yu, T.; Hadi, M.N.S. Factors Affecting the Bond Strength Between the Fly Ash-based Geopolymer Concrete and Steel Reinforcement. Structures 2018, 14, 262–272. [Google Scholar] [CrossRef] [Green Version]
  25. Kim Jee, S.; Park, J. An Experimental Evaluation of Development Length of Reinforcements Embedded in Geopolymer Concrete. Appl. Mech. Mater. 2014, 578–579, 441–444. [Google Scholar] [CrossRef]
  26. Ganesan, N.; Indira, P.V.; Santhakumar, A. Bond behavior of reinforcing bars embedded in steel fibre reinforced geopolymer concrete. Mag. Concr. Res. 2015, 67, 9–16. [Google Scholar] [CrossRef]
  27. ACI 408R-03. Bond and Development of Straight Reinforcing Bars in Tension. Available online: www.concrete.org/store/productdetail.aspx?ItemID=40803&Format=DOWNLOAD&Language=English&Units=US_AND_METRIC (accessed on 5 March 2021).
  28. Luan, C.; Shi, X.; Zhang, K.; Utashev, N.; Yang, F.; Dai, J.; Wang, Q. A mix design method of fly ash geopolymer concrete based on factors analysis. Constr. Build. Mater. 2020. [Google Scholar] [CrossRef]
  29. Auyeung, Y.; Balaguru, P.; Chung, L. Bond behavior of corroded reinforcement bars. Aci Mater. J. 2000, 97, 214–220. [Google Scholar]
  30. Yazici, S.; Sezer, G.I. The effect of cylindrical specimen size on the compressive strength of concrete. Build. Environ. 2007, 42, 2417–2420. [Google Scholar] [CrossRef]
  31. Kadlecek, V.; Modry, S.; Kadlecek, V. Size effect of test specimens on tensile splitting strength of concrete: General relation. Mater. Struct. 2002, 35, 28–34. [Google Scholar] [CrossRef]
  32. Guo, Z.; Shi, X. Reinforced Concrete Theory and Analyse; Tsinghua University Press: Beijing, China, 2003; p. 13. [Google Scholar]
  33. Rawlings, J.O.; Pantula, S.G.; Dickey, D.A. Applied Regression Analysis: A Research Tool, 2nd ed.; Springer: New York, NY, USA, 1998; pp. 1–93. [Google Scholar]
  34. ACI 318-19. Building Code Requirements for Structural Concrete. Available online: www.concrete.org/store/productdetail.aspx?ItemID=318U19&Language=English (accessed on 5 March 2021).
  35. CEB-FIP. Fib Model Code for Concrete Structures. 2010. Available online: https://onlinelibrary.wiley.com/doi/book/10.1002/9783433604090 (accessed on 5 March 2021).
  36. GB 50010—2010. Code for Deign of Concrete Structures. Available online: www.mohurd.gov.cn/wjfb/201511/t20151119_225665.html (accessed on 5 March 2021).
  37. Sumajouw, M.D.J.; Rangan, B.V. Low-Calcium Fly Ash-Based Geopolymer Concrete: Reinforced Beams and Columns; Research Report GC3; Faculty of Engineering, Curtin University of Technology: Perth, Australia, 2006. [Google Scholar]
  38. Rashid, K.; Li, X.; Xie, Y.; Deng, J.; Zhang, F. Cracking behavior of geopolymer concrete beams reinforced with steel and fiber reinforced polymer bars under flexural load. Compos. Part B Eng. 2020, 186, 107777. [Google Scholar] [CrossRef]
  39. Zhang, D.; Ueda, T.; Furuuchi, H. Average Crack Spacing of Overlay-Strengthened RC Beams. J. Mater. Civil Eng. 2011, 23, 1460–1472. [Google Scholar] [CrossRef] [Green Version]
  40. Thirugnanasambandam, S.; Kumaravel, S. Flexural Behaviour of Reinforced Low Calcium Fly Ash based Geopolymer Concrete Beam. Global Journal of Research in Engineering, [S.l.], dec. 2013. ISSN 2249-4596. Available online: https://www.engineeringresearch.org/index.php/GJRE/article/view/938 (accessed on 5 March 2021).
  41. Zhang, D.; Rashid, K.; Wang, B.; Ueda, T. Experimental and Analytical Investigation of Crack Spacing and Width for Overlaid RC Beams at Elevated Temperatures. ASCE J. Struct. Eng. 2017, 143, 04017168. [Google Scholar] [CrossRef] [Green Version]
Figure 1. The particle size distribution of fly ash.
Polymers 13 00875 g001
Figure 2. Detail of the modified direct pull-out specimen (mm) (l = the shorter embedded length of the bar).
Polymers 13 00875 g002
Figure 3. Test set up for the bond test.
Polymers 13 00875 g003
Figure 4. Relationship between the splitting tensile and compressive strength of FAGC.
Polymers 13 00875 g004
Figure 5. Validation of the splitting tensile strength model.
Polymers 13 00875 g005
Figure 6. Comparison of the observation and prediction of bond strength by Equation (28).
Polymers 13 00875 g006
Figure 7. Comparison of bond strength of Portland cement concrete (PCC) and FAGC.
Polymers 13 00875 g007
Figure 8. Comparison of the characteristic values of bond strength of PCC and FAGC.
Polymers 13 00875 g008
Figure 9. Validation of bond strength model.
Polymers 13 00875 g009
Figure 10. Design anchorage length of reinforced FAGC beams for some cases.
Polymers 13 00875 g010
Table 1. Chemical composition of fly ash.
CompositionSiO2Al2O3Fe2O3CaOP2O5Na2OTiO2MgO
Mass%62.8316.717.386.374.111.050.910.64
Table 2. Mix proportions and corresponding compressive strength.
Mix.CoarseFineFly AshAlkaline Solution(kg/m3)fc
Aggregate
(kg/m3)
Aggregate
(kg/m3)
(kg/m3)Na2SiO3NaOHWater(MPa)
11173.00 527.00 500.00 142.86 18.00 39.14 58.51
21260.42 566.28 420.00 91.98 19.32 42.00 65.58
31250.28 561.72 420.00 112.00 19.64 36.36 75.90
41160.93 521.58 500.00 130.50 30.51 56.49 86.60
51240.14 557.16 420.00 130.50 19.98 32.22 69.87
61222.75 549.35 460.00 119.93 16.82 31.15 62.23
71211.64 544.36 460.00 110.40 28.17 45.43 92.86
81200.53 539.37 460.00 133.40 20.94 45.76 56.80
91185.08 532.43 500.00 121.67 23.28 37.55 79.83
Table 3. The conversion factors of compressive strength.
Strength
Grade
100 mm
Cube
150 mm
Cube
100 × 200 mm2
Cylinder
150 × 300 mm2
Cylinder
C20-C400.7620.8-1
C500.7900.831
C600.8190.861
C700.8330.8751
C800.8480.891
--0.9711
Table 4. The conversion factors of splitting tensile strength.
100 mm
Cube
150 mm
Cube
75 × 150 mm2
Cylinder
100 × 200 mm2
Cylinder
150 × 300 mm2
Cylinder
0.825 0.915 0.837 0.901 1
Table 5. Summary of splitting tensile strength and corresponding compressive strength of fly ash geopolymer concrete (FAGC, MPa).
Experiments Specimens
for fc
Specimens
for fst
fc1fst1fc1fst1
This work100 mm 100 mm 58.512.82646.252.335
cubecube58.513.26146.252.695
58.513.30646.252.732
58.513.28846.252.718
58.513.72246.253.076
65.583.39153.722.803
65.583.13753.722.592
65.583.75653.723.104
65.583.36353.722.78
65.585.04853.724.172
75.94.05763.253.353
75.94.58563.253.789
75.94.07563.253.368
75.94.25663.253.517
75.94.7663.253.934
86.64.06673.413.36
86.64.69173.413.877
86.64.66973.413.859
86.64.4673.413.686
86.65.273.414.297
Gunasekera et al.100 × 200 mm2150 × 300 mm282.54.2680.14.26
[16]cylindercylinder36.92.4935.832.49
29.61.628.741.6
24.91.1524.171.15
86.54.6783.984.67
45.63.4144.273.41
36.52.3235.442.32
27.71.326.891.3
87.44.7284.854.72
473.7145.633.71
42.82.941.552.9
28.71.8627.861.86
Olivia et al.100 × 200 mm2150 × 300 mm256.494.1354.844.13
[17]cylindercylinder56.243.9654.63.96
60.24.2958.454.29
56.514.1854.864.18
58.854.157.144.1
63.294.7961.454.79
Ryu et al.100 × 200 mm2100 × 200 mm217.171.316.671.171
[15]cylindercylinder19.321.318.761.171
19.461.5318.891.378
21.941.5921.31.432
24.141.9723.441.775
26.511.9725.741.775
26.672.1825.891.964
28.022.0327.21.829
29.35228.51.802
26.922.426.142.162
30.012.2229.142
312.4430.12.198
33.982.6832.992.414
34.942.8233.922.541
35.272.7334.242.459
36.182.6835.132.414
56.023.6554.393.288
58.913.6857.193.315
61.193.9359.413.541
Benny Joseph150 mm 150 × 300 mm2453.1363.1
[18]cubecylinder473.3437.63.34
563.4546.483.45
494.5139.24.51
Sofi et al.150 × 300 mm2150 × 300 mm238.32.738.32.7
[19]cylindercylinder52.83.352.83.3
Aliabdo et al.100 mm 75 × 150 mm222.52.4517.142.059
[20]cubecylinder27.52.7520.952.311
36.53.0527.812.563
35326.672.521
43.53.333.142.773
13.51.710.291.429
37.53.0528.572.563
332.725.142.269
25.32.519.282.101
313.123.622.605
Albitar et al.100 × 200 mm2100 × 200 mm218.662.0418.121.838
[21]cylindercylinder33.173.0832.22.775
34.413.1433.412.829
29.452.9628.592.667
51.424.2349.923.811
53.425.5551.865
44.585.5143.284.964
Hardjito 100 × 200 mm2150 × 300 mm2897.4386.417.43
and Rangancylindercylinder685.5266.025.52
[22] 555.4553.45.45
444.4342.724.43
Chang100 × 200 mm2150 × 300 mm2373.6235.923.62
[14]cylindercylinder302.9629.132.96
554.0653.44.06
484.4846.64.48
292.9328.162.93
514.6549.514.65
1fc = experiment results of compressive strength, fst = experiment results of splitting tensile strength, fc = the 150 × 300 mm cylinder compressive strength, fst = the 150 × 300 mm cylinder splitting tensile strength.
Table 6. Summary of the bond strength and corresponding factors of FAGC.
Experimentsτ
(MPa)
fc
(MPa)
Specimens for fcfc
(MPa)
ldcmincmax
Specimens for Bond Test(mm)
This work11.34 65.58100 mm53.71680166767
modified direct pull-out specimens13.43 65.58cube53.71680166767
13.27 65.58 53.71680166767
14.56 75.9 63.24780166767
13.40 75.9 63.24780166767
13.54 75.9 63.24780166767
10.49 58.51 46.25180166767
10.77 58.51 46.25180166767
9.86 58.51 46.25180166767
14.08 86.6 73.40780166767
14.33 86.6 73.40780166767
12.34 86.6 73.40780166767
P. K. Sarker. [13]10.61 25.5100 × 200 mm224.7571002442113
beam-end specimens13.02 25.5cylinder24.7571102444113
10.88 25.5 24.7571002444113
13.82 25.5 24.7571202465113
11.14 25.5 24.7571252466113
14.83 25.5 24.7571102464113
14.32 29.7 28.8351002045115
13.05 29.7 28.8351002045115
13.23 29.7 28.835952041115
15.19 29.7 28.8351102064115
12.88 29.7 28.8351052064115
11.07 29.7 28.8351152066115
12.20 32.5 31.5531002444113
14.59 32.5 31.5531002445113
13.00 32.5 31.5531002441113
14.72 32.5 31.5531002463113
17.64 32.5 31.5531002466113
17.24 32.5 31.5531002462113
14.96 39.5 38.351002042115
15.12 39.5 38.351002042115
16.71 39.5 38.351002046115
19.42 39.5 38.351002068115
14.01 39.5 38.351002068115
15.92 39.5 38.351002064115
M. Albitar et al. [23]17.68 33100 × 200 mm232.03960122469
direct pull-out specimens17.25 33cylinder32.03960122469
18.78 33 32.03960123669
19.33 33 32.03960123669
19.01 33 32.03960124869
19.12 33 32.03960124869
17.44 33 32.03980163267
16.71 33 32.03980163267
18.49 33 32.03980164867
18.52 33 32.03980164867
19.15 33 32.03980166467
19.37 33 32.03980166467
19.38 33 32.0398016117177
19.29 33 32.0398016117177
22.00 43 41.74860122469
23.68 43 41.74860123669
26.73 43 41.74880123669
28.02 43 41.74880123669
18.53 38 36.89360129494
20.44 38 36.89360129494
21.45 38 36.89360129494
23.70 38 36.89380169292
22.90 38 36.89380169292
23.79 38 36.89380169292
Ee Hui Chang [14]4.94 37100 × 200 mm235.922355242032
beam specimens6.03 37cylinder35.922303202832
7.34 30 29.126240162940
5.63 55 53.398356242528
7.13 55 53.398301202430
8.77 48 46.602243162840
4.85 30 29.126300242531
4.50 29 28.155452242327
3.59 29 28.155723242528
5.84 48 46.602300242427
5.70 51 49.515455242230
4.61 51 49.515722242430
Al-azzawi et al. [24]9.50 17100 × 200 mm216.50580167272
direct pull-out specimens10.20 18cylinder17.47680167272
10.40 21 20.38880167272
10.00 19 18.44780167272
12.00 20 19.41780167272
14.00 22 21.35980167272
10.40 22 21.35980167272
12.00 25 24.27280167272
14.00 26 25.24380167272
8.60 19 18.44780167272
10.00 20 19.41780167272
11.70 20 19.41780167272
9.20 20 19.41780167272
10.60 21 20.38880167272
12.60 22 21.35980167272
13.70 21 20.38880167272
14.00 25 24.27280167272
15.00 26 25.24380167272
7.50 16 15.53480167272
8.30 18 17.47680167272
9.80 19 18.44780167272
9.50 18 17.47680167272
10.50 19 18.44780167272
11.20 20 19.41780167272
10.50 21 20.38880167272
11.80 21 20.38880167272
13.00 23 22.3380167272
24.00 45 43.68980167272
22.00 39 37.86480167272
20.00 34 33.0180167272
26.00 58 56.31180167272
25.00 47 45.63180167272
24.00 42 40.77780167272
30.00 64 62.13680167272
29.60 62 60.19480167272
27.90 53 51.45680167272
17.00 30 29.12680167272
16.00 28 27.18480167272
14.00 27 26.21480167272
21.00 35 33.98180167272
19.60 30 29.12680167272
18.30 28 27.18480167272
25.80 49 47.57380167272
25.10 41 39.80680167272
22.70 36 34.95180167272
Sofi et al. [12] beam-end specimens9.50 30150 × 300 mm230168.81236106.5
6.80 30cylinder30216.81648106.5
5.80 30 302342070106.5
direct pull-out specimens10.90 59.8 59.860126969
Kim, Jee Sang [25]19.81 20150 × 300 mm22050109595
direct pull-out specimens21.08 20cylinder2050109595
28.35 20 2050109595
18.58 20 2080169292
14.48 20 2080169292
21.14 20 2080169292
18.76 20 201252587.587.5
14.93 20 201252587.587.5
18.09 20 201252587.587.5
Ganesan et al. [26]12.73 41.23150 mm32.984100126969
direct pull-out specimens16.57 41.23cube□32.984150166767
Table 7. Models of splitting tensile strength of FAGC.
EquationsBasic EquationModelt-Valuep ValueR2
(20) f s t = k f c n f s t = 0.203 f c 0.722 13.6930.0000.681
(21) f s t = a ( 0.556 f c 0.5 ) f s t = 0.880 ( 0.556 f c 0.5 ) 41.3640.0000.584
(22) f s t = a I n ( f c ) b f s t = 2.043 l n ( f c ) 4.417 11.9890.0000.620
(23) f s t = a ( 2.329 l n ( f c ) 4.71 ) f s t = 0.808 ( 2.329 l n ( f c ) 4.71 ) 43.1550.0000.616
Table 8. Results of FAGC for validation of splitting tensile strength model (MPa).
Specimens
for fc
Specimens
for fst
fcfstfcfst
100 mm 100 mm 69.87 4.086 57.23 3.371
cubecube69.87 3.848 57.23 3.175
69.87 4.503 57.23 3.715
69.87 4.330 57.23 3.572
69.87 4.243 57.23 3.500
62.23 4.128 50.97 3.406
62.23 3.520 50.97 2.904
62.23 3.333 50.97 2.750
62.23 3.034 50.97 2.503
62.23 3.966 50.97 3.272
92.86 4.928 78.74 4.065
92.86 4.889 78.74 4.033
92.86 5.678 78.74 4.684
92.86 5.967 78.74 4.923
92.86 5.371 78.74 4.431
56.80 4.073 44.87 3.360
56.80 4.327 44.87 3.569
56.80 3.226 44.87 2.662
56.80 4.684 44.87 3.865
56.80 4.284 44.87 3.534
79.83 3.322 66.50 2.741
79.83 3.563 66.50 2.939
79.83 4.086 66.50 3.371
79.83 5.609 66.50 4.628
79.83 4.765 66.50 3.931
Table 9. Bond strength for validation of bond strength model.
Experimentτ
(MPa)
fc
(MPa)
Specimens
for fc
fc
(MPa)
ldcmincmax
Specimens for Bond Test(mm)
This work13.98 69.87100 mm57.2380166767
modified direct pull-out specimens12.29 69.87cube57.2380166767
12.61 69.87 57.2380166767
11.79 62.23 49.19480166767
12.32 62.23 49.19480166767
11.99 62.23 49.19480166767
15.87 92.86 78.70780166767
14.53 92.86 78.70780166767
13.38 92.86 78.70780166767
12.25 56.8 44.89680166767
11.97 56.8 44.89680166767
11.86 56.8 44.89680166767
14.26 79.83 66.52580166767
14.54 79.83 66.52580166767
14.26 79.83 66.52580166767
Table 10. Comparison of test and predicted cracking moment of reinforced FAGC beams.
BeamfcbhMcrMcr Predicted by [37]Mcr Predicted by Equation (38)Test/Prediction
(MPa)(mm)(KN × m)(KN × m) (KN × m)Ratio
GB1-13720030013.4010.3912.681.06
GB1-24220030013.5510.8613.900.97
GB1-34220030013.5010.6113.900.97
GB1-43720030014.309.6612.681.13
GB2-14620030015.0011.6514.841.01
GB2-25320030016.2012.2716.440.99
GB2-35320030016.6512.0216.441.01
GB2-44620030016.0510.9114.841.08
GB3-17620030019.0015.1321.330.89
GB3-27220030020.0014.4320.510.98
GB3-37220030021.0014.1820.511.02
GB3-47620030019.9014.3921.330.93
Average1.00
Standard Deviation0.06
Table 11. Comparison of test and predicted crack spacing of reinforced FAGC beams.
ExperimentBeamLength of
Pure Bending Zone
Number
of Cracks
ScrPredicted
Scr
Test/Prediction
Ratio
(mm) (mm)(mm)
SumajouwGB1-210001476.92 68.17 1.13
and Rangan [37]GB1-310001383.33 65.97 1.26
GB3-110001383.33 76.82 1.08
GB3-210001290.91 72.70 1.25
Kumaravel and GPC-110001476.92 96.99 0.79
ThirugnanasambandamGPC-2100010111.11 96.99 1.15
[40] Average1.11
Standard Deviation0.17
Table 12. Details of the tested reinforced FAGC beams.
ExperimentBeamfcdcmaxcmin   O r At
(MPa)(mm)(mm)(mm)(mm)(mm2)
SumajouwGB1-2421625.525150.72129.52
and Rangan [37]GB1-342202522.5188.4155.65
GB3-1761228.525113.0488.94
GB3-2721625.525150.72112.51
Kumaravel and GPC-146.61162010.25138.16114.68
Thirugnanasambandam [40]GPC-246.61162010.25138.16114.68
Publisher’s Note: MDPI stays neutral with regard to jurisdictional claims in published maps and institutional affiliations.

