
Preparation of Methylcellulose Film-Based CO2 Indicator for Monitoring the Ripeness Quality of Mango Fruit cv. Nam Dok Mai Si Thong


1
Department of Postharvest Technology, Faculty of Engineering and Agro-Industry, Maejo University, Chiang Mai 50290, Thailand
2
Center for Advanced Studies for Agriculture and Food (CASAF), Department of Packaging and Materials Technology, Faculty of Agro-Industry, Kasetsart University, Bangkok 10900, Thailand
3
Department of Food Science and Biotechnology, and Center for Intelligent Agro-Food Packaging, College of Life Science and Biotechnology, Dongguk University-Seoul, Goyang-si 10326, Korea
4
Division of Packaging Technology, School of Agro-Industry, Faculty of Agro-Industry, Chiang Mai University, Chiang Mai 50100, Thailand
5
The Cluster of Agro Bio-Circular-Green Industry (Agro BCG), Chiang Mai University, Chiang Mai 50100, Thailand
6
Center of Excellence in Materials Science and Technology, Chiang Mai University, Chiang Mai 50200, Thailand
7
Postharvest Technology Innovation Center, Commission on Higher Education, Bangkok 10400, Thailand
*
Author to whom correspondence should be addressed.
Polymers 2022, 14(17), 3616; https://doi.org/10.3390/polym14173616
Submission received: 30 June 2022
/
Revised: 19 August 2022
/
Accepted: 23 August 2022
/
Published: 1 September 2022
(This article belongs to the Special Issue Multifunctional Polymeric Formulations for Sustainable Food Packaging Applications)
Abstract
:Day-to-day advancements in food science and technology have increased. Indicators, especially biopolymer-incorporated organic dye indicators, are useful for monitoring the ripeness quality of agricultural fruit products. In this investigation, methylcellulose films—containing pH dye-based indicators that change color depending on the carbon dioxide (CO2) levels—were prepared. The level of CO2 on the inside of the packaging container indicated the ripeness of the fruit. Changes in the CO2 level, caused by the ripeness metabolite during storage, altered the pH. The methylcellulose-based film contained pH-sensitive dyes (bromothymol blue and methyl red), which responded (through visible color change) to CO2 levels produced by ripeness metabolites formed during respiration. The indicator solution and indicator label were monitored for their response to CO2. In addition, a kinetic approach was used to correlate the response of the indicator label to the changes in mango ripeness. Color changes (the total color difference of a mixed pH dye-based indicator), correlated well with the CO2 levels in mango fruit. In the ‘Nam Dok Mai Si Thong’ mango fruit model, the indicator response correlated with respiration patterns in real-time monitoring of ripeness at various constant temperatures. Based on the storage test, the indicator labels exhibited color changes from blue, through light bright green, to yellow, when exposed to CO2 during storage time, confirming the minimal, half-ripe, and fully-ripe levels of mango fruit, respectively. The firmness and titratable acidity (TA) of the fruit decreased from 44.54 to 2.01 N, and 2.84 to 0.21%, respectively, whereas the soluble solid contents (SSC) increased from 10.70 to 18.26% when the fruit ripened. Overall, we believe that the application of prepared methylcellulose-based CO2 indicator film can be helpful in monitoring the ripeness stage, or quality of, mango and other fruits, with the naked eye, in the food packaging system.
1. Introduction
Mango (Mangifera indica Linn.) is regarded as the second-most significant fruit crop in tropical and subtropical countries. Its quality is determined by the size, shape, cultivar, taste, aroma, peel, and flesh color. Notably one of the most important cultivated varieties of Nam Dok Mai Si Thong, it is the outstanding export product in Thailand, due to its flavor and bright yellow flesh, and is exported to China, Korea, Japan, Malaysia, and Vietnam. It is produced in the north, central, and southern parts of Chiang Mai, Phitsanulok, Loei & Nakhon Ratchasima, and Prachuap Khiri Khan provinces of Thailand. Mangoes continue to ripen after harvest. Compositional change of the fruit is relevant for understanding metabolic processes [1,2,3,4,5]. Hence, postharvest handling techniques play a crucial role in the export to other countries [4,6]. This is because mangoes sold in markets are frequently at various stages of maturity. Therefore, it is critical to measure the fruit’s ripening state so that consumers can determine when it is perfect for eating.
Food packaging system-adjoined indicators provide detailed information on food’s integrity, freshness, microbial growth, temperature, and shelf life [7]. Food produce quality includes its sensory qualities, nutritional content, chemical components, mechanical characteristics, functional characteristics, and flaws [2,8]. Because buyers view ripeness as the primary quality indicator, monitoring and regulating it is becoming a crucial issue in fruit management. To assess fruit quality and ripeness quality, soluble solids concentration, titratable acidity, flesh firmness, and peel color are typically used. [2,9]. Generally, most of them require the destruction of the samples used for analysis. To assess fruit quality, numerous non-destructive methods have been developed. When fruit is being stored, non-destructive electronic nose technology can be used to assess its state of ripeness [10]. Lebrun et al. [11] attempted to differentiate between mango fruit maturity by employing FOX 4000 e-nose, and GC. When separating the fruit from different harvest maturities of green and ripe fruit, the e-nose showed better results than the GC testing. The e-nose could be a useful and rapid device with which to sort peaches into three categories: unripe, ripe, and over-ripe. The techniques have been used to assess the chemical and physical characteristics of pear from their e-nose signal [12,13,14]. However, Gomez et al. [15,16] reported that the association between the measured and anticipated values of fruit (tomato and mandarin) revealed a very low to reasonable prediction, using e-nose signals. The fruit ripeness stage was evaluated by firmness, which decreases as they ripen. Ultrasound is an acoustic method used, particularly, in the assessment of fruit quality. It has been demonstrated that variations in ultrasonic attenuation correspond to changes related to the fruit’s physiological and chemical composition. Using ultrasonic technology, mango fruit’s postharvest shelf-life has been measured [17]. Mizrach [18] measured the attenuation of the mango fruit’s ultrasonic signal after 10 days at room temperature storage and found that it increased from 2.7 dB/mm on the first day to 4.16 dB/mm at the end of the test. Vergara et al. [19] described the development of a radio frequency identification (RFID) reader, embedded with micro-machined metal oxide gas sensors, for monitoring climacteric fruit during shipping and vending. The reader can work as an alarm-level monitor, identifying abnormal ethylene levels or acetaldehyde and ethanol. Recently, imaging techniques have been used for monitoring fruit ripening and maturity [20]. The advancement of non-destructive technologies for determining fruit ripening stage has been the focus of all research, and these techniques have several benefits [21].
However, these ripeness indicator methods have been utilized to forecast fruit quality features that are frequently identified by conventional destructive techniques (SSC, TA, firmness, etc.). Therefore, there is still a need for a simple, accessible, and economical method. A ripeness indicator potentially offers a small, low-cost, and user-friendly device for monitoring fruit quality, which is used to indicate the fruit ripening state. The amount of published work on this subject is still limited. One alternate suggestion to meet this requirement is the development of intelligent packaging, in the form of a food quality indicator, to monitor freshness status. The term "intelligent packaging" refers to a type of packaging that can perform intelligent tasks to aid in decision-making for improving quality, extending shelf life, and providing information and warnings about potential issues [22]. Generally, the pH, temperature, and storage time play crucial roles in fruit ripening. For intelligent packaging, polymer-based indicators are used for food quality, fermentation, and ripeness, because of their hydrophilic, better adhesive, and non-toxic nature. The colorimetric indicator films are fabricated using various biopolymers (cellulose, starch, chitosan) with the pH dyes (bromophenol blue, chlorophenol red, methyl red, molybdenum blue). These indicators change color when reacting with CO2, ethylene, and volatile organic compounds [23,24,25,26]. These metabolite derivatives have been produced by agricultural fruits and products during the storage periods. The indicator color changes help to determine the quality of ripeness and spoilage of agricultural fruits and products. Kuswandi et al. investigated cellulose membrane–bromophenol blue-based indicator to determine the Psidium guajava freshness state. The indicator changed from blue to green with acetic acid, confirming the ripening [24]. Kuswandi and Murdyaningsih reported a chlorophenol red membrane package indicator label for grapes during storage time. The label reacted with reduced volatile organic acid, changing color from white to beige to yellow, due to the ripening stages [23]. Generally, biopolymers such as methylcellulose [27] are tough, non-toxic, odorless, and provide better adhesive properties. The fermentation and ripening stage is determined from the level of CO2, using the polymer-based poly(ether-block-amide) indicator [7,28]. A ripeness indicator is a type of intelligent packaging that employs metabolites as "information" with which to track the ripening of fruit. It can either be a packaging system or a material [29]. The goal of this work is to create a methylcellulose film containing a pH dye-based ripeness indicator for monitoring the ripening of mango fruit cv Dok Mai Si Thong, Nam Dok.
2. Materials and Methods
2.1. Chemicals
Food-grade methylcellulose (MC) (Methocel®, Dow Chemical, New York, NY, USA) was used as the carbohydrate biopolymer for the label base. Polyethylene glycol-400 (Chemipan Corporation Co., Ltd. Bangkok, Thailand), Bromothymol blue (Ajax Finechem, Auckland, Australia), and ethyl alcohol (Merck, Darmstadt, Germany) were used to prepare a dye mixture. Acetic acid (Merck, Darmstadt, Germany) was used to evaluate the sensitivity of dye mixtures.
2.2. Ripeness Indicator Fabrication
2.2.1. Preparation of Color Indicator Solution
2.2.2. Preparation of the Color Indicator Label
The coating solution was prepared by dissolving methylcellulose (3%, w/v) in 50% aqueous ethanol solution. Polyethylene glycol-400 (1%, w/v) was used as a plasticizer and this mixture was then homogenized at 22,000 rpm until complete dissolution. This solution was used to produce an indicator label by adding pH dye solution at a 3.8:1.2 ratio. Further, the film-forming solutions were applied to polyethylene film and allowed to dry for 24 h at ambient temperature (25 °C). The obtained ripeness indicator was conditioned at 25 °C and 65% relative humidity.
2.3. Sensitivity of Mixed pH Dyeing Indicator
2.3.1. Measurement of Mixed pH Dyeing Solution Sensitivity
The color change of the mixed pH- dyeing solution was observed by testing with 0.1 M acetic acid. The test tube contained 10 ml of mixed pH-dyeing solution, and then different concentrations (30, 35, 40, 45, 50, 55, 60, 65, 70, 75, and 80 µL) of 0.1 M acetic acid were added. The pH value and absorbance of solutions were measured with a pH meter and spectrophotometer (at 416 nm), respectively.
2.3.2. Color Changes in Indicator Labels Caused by Carbon Dioxide (CO2)
The ripeness indicator label was tested with carbon dioxide as a metabolite compound, known as the accurate weight. CO2 was diluted with nitrogen and injected into the glass jar with a gas-tight syringe, obtaining CO2 concentrations of 0–3.0 % (v/v). The color change in the label indicator was evaluated with a color meter (Minolta Model CR-400, Japan) and expressed as Hunter system [31].
2.4. Applications of Ripeness Indicator Label with “Nam Dok Mai Si Thong” Mangoes
2.4.1. Experiment Setup
Mangoes were harvested at commercial maturity and transported to the laboratory immediately. Mangoes of uniform size (320–350 g), and free from defects, were selected and placed into 800 mL plastic boxes. Each plastic container was attached to an indicator label, and the samples were kept at 13, 20, 27, and 34 °C. The quality changes of fruit stored at different temperatures were assessed, and this was compared to the color changes in the label indicators.
2.4.2. Quality Changes during the Fruits’ Ripening Period
2.4.3. Kinetics Study of Indicator Labels
The color changes in indicator labels that were attached inside the plastic boxes were measured with a color meter and expressed as total color difference (∆E). The ∆E was calculated according to the following equations:
where ΔL∗ is the difference in brightness between day zero and each time period.
∆E = [(ΔL∗)2 + (Δa∗)2 + (Δb∗)2]1/2
The redness–greenness difference between day zero and each time period is represented by Δa∗.
The yellow-blue difference between day zero and each time period is represented by Δb∗.
By fitting a zero-order Equation (2), a first-order Equation (3), a second-order kinetic model Equation (4), or the following [34] Equation (5) to the experimental data, the kinetics of indicator labels were explained:
where [X0] represents the initial values of total color difference (TCD) and [Xt] represents the values of TCD for a specified storage period and temperature. The values of TCD were measured using the corresponding value X as the dynamic parameter, and the relationship was described in terms of the response function, as follows:
where X represents the values of: ∆E; k: the reaction’s temperature-dependent rate constant; and t: the amount of time it has been stored. A straight line may be drawn by graphing a curve between the total color difference response function F(X), and time, and the slope used to determine the k of various storage temperatures. Taking the natural logarithm on both sides of the Arrhenius function:
by plotting a curve between ln k and 1/T, a straight line was obtained. The activation energy could be calculated from the slope, and A from the intercept, directly.
F(X) = [X0] − [Xt]
F(X) = ln [X0 − Xt]
F(X) = kt
lnk = lnA + Ea/RT
2.5. Statistical Analysis
The experiment followed a completely randomized design of three replicates per treatment (n = 3). SPSS was used to examine the data (Version 11). A one-way analysis of variance (ANOVA) was performed using Duncan’s multiple range test (p ≤ 0.05).
3. Results and Discussion
3.1. Color Change of Indicator Solution
Different concentrations (30, 35, 40, 45, 50, 55, 60, 65, 70, 75, and 80 µL) of 0.1 M acetic acid were added to the vials containing colorimetric mixed pH dye-based indicator solution, causing a visual color change of the solution from blue to yellow (Figure 1). As a result, the pH decreased from 10.59 to 5.91 (Table 1). The colorimetric changes were determined by absorption at 416 nm. Initially, the absorption increased, and the maximum value was observed at 45 µL concentration, then the absorption significantly decreased.
3.2. Change in Color of Color Indicator Label
The color of the indicator label was measured using a CIE L*, a*, and b* scale, when contrasted with CO2, where L* indicates lightness, a* indicates chromaticity on a green (−) to red (+) axis, and b* indicates chromaticity on a blue (−) to yellow (+) axis. Lightness (L*) value increased because the indicator label changed from blue, to light green, to yellow, similar to the a* value, which increased (Table 2). The various color changes of colorimetric indicator labels, as shown in Figure 2: when exposed to CO2 levels between 0 and 3.0 percent (v/v), indicator labels were found to exhibit, correspondingly, a clear spectrum from blue to light green to yellow. To simply and accurately track the degree of fruit ripening of packaged mango fruit in a non-destructive manner during distribution and retail sale, colorimetric mixed pH dye-based markers are being applied to mango fruit packaging. The levels of CO2% correlated with the L*, a*, and b* values of the indicator label, helping to determine the Mango fruit ripening stage during storage at various temperatures.
3.3. Color Changes and Kinetics Study of Indicator Labels during Mango Ripening
In packed mango fruits, headspace gas that has been dissolved in the hydrophilic material of the filter layer produces carbonic acid when moisture is present. Diprotic carbonic acid, pKa: 6.36 at 25 °C [35], has two hydrogen atoms that have the potential to separate from the parent molecule to create hydrogen ions (H+) and bicarbonate ions (HCO3−). A hydrogen ion then joins with a water molecule, as a proton, to create a hydronium ion (H3O+). Hydronium ions interact with the indicator label’s basic form (In), creating an acid form (HIn), which causes the indicator label to change color. [7,36,37]:
CO2(g) ↔ CO2 (aq)
CO2 (aq) + H2O ↔ H2CO3
H2CO3 ↔ HCO3‾ + H+
H+ + H2O → H3O+
H+ + In‾ → HIn
The indicator labels’ response caused a constant and consistent shift in the ∆E value as well. With time, ∆E values increased. The indicator labels’ final ∆E values ranged from 51 to 73, as shown in Figure 3. Based on the observation of this data, 27 °C storage, up to day 6, leads to better ∆E values when compared to other mango storage temperatures. It is generally accepted that ∆E values larger than 5.0 are plainly discernible to the naked eye and that ∆E values greater than 12.0 denote an entirely separate color space [38]. Even though they occurred at a distinct rate, the variations in the label of ∆E exhibited a Gaussian kinetic model [Equation (5)] [34]. Therefore, the observable ∆E change of the indicator label can be used as a model for kinetic technique.
Figure 4 illustrates what happens when the function F(X) of ∆E is plotted against storage time. Further, it shows four straight lines with various slopes at various temperatures. Table 3 lists the calculated kinetic parameters as rate constants (k) and coefficients of determination (R2). The R2 of each function parameter was adequately high (between 0.9150 and 0.9845, as shown in Table 3), demonstrating the model’s suitability. The Arrhenius equation [Equation (7)] was used to demonstrate that the temperature dependency was explained with the ∆E values, due to the temperature dependence. Based on the changes in ∆E of the indicator label during the mango fruit’s ripening, the values of Ea as 52.30 kJ/mol could be estimated (Table 3). The mango fruit’s firmness, SSC, and TA value all serve as ripening indicators. The values of Ea were 46.45, 43.05, and 54.22 kJ/mol, respectively, which changes the firmness, SSC, and TA of the mango fruit during ripening [4]. The indicator is used to accurately track the degree of fruit ripening, if it has a similar temperature dependence to the processes that lead to product quality decline, which translates into activation energies that differ by less than 25 kJ/mol. According to research on the kinetics of fresh produce, based on the Arrhenius equation, the activation energy of carbon dioxide, generated during golden drop spoiling, is 48.98 kJ/mol, and the overall color difference of freshness-indicator labels results in activation energy of 49.25 kJ/mol. The indicator response in samples of golden drops was discovered to be correlated with microbial growth patterns, allowing for the real-time monitoring of deterioration [30]. Rukchon et al. [39] developed the food spoilage indicator for monitoring the freshness of skinless chicken breast. The kinetic approach correlates the reaction of the indicator label with variations in skinless chicken breast spoilage. The overall color difference of a mixed pH dye-based indicator, which measures color variations, correlated well with the CO2 levels of skinless chicken breast.
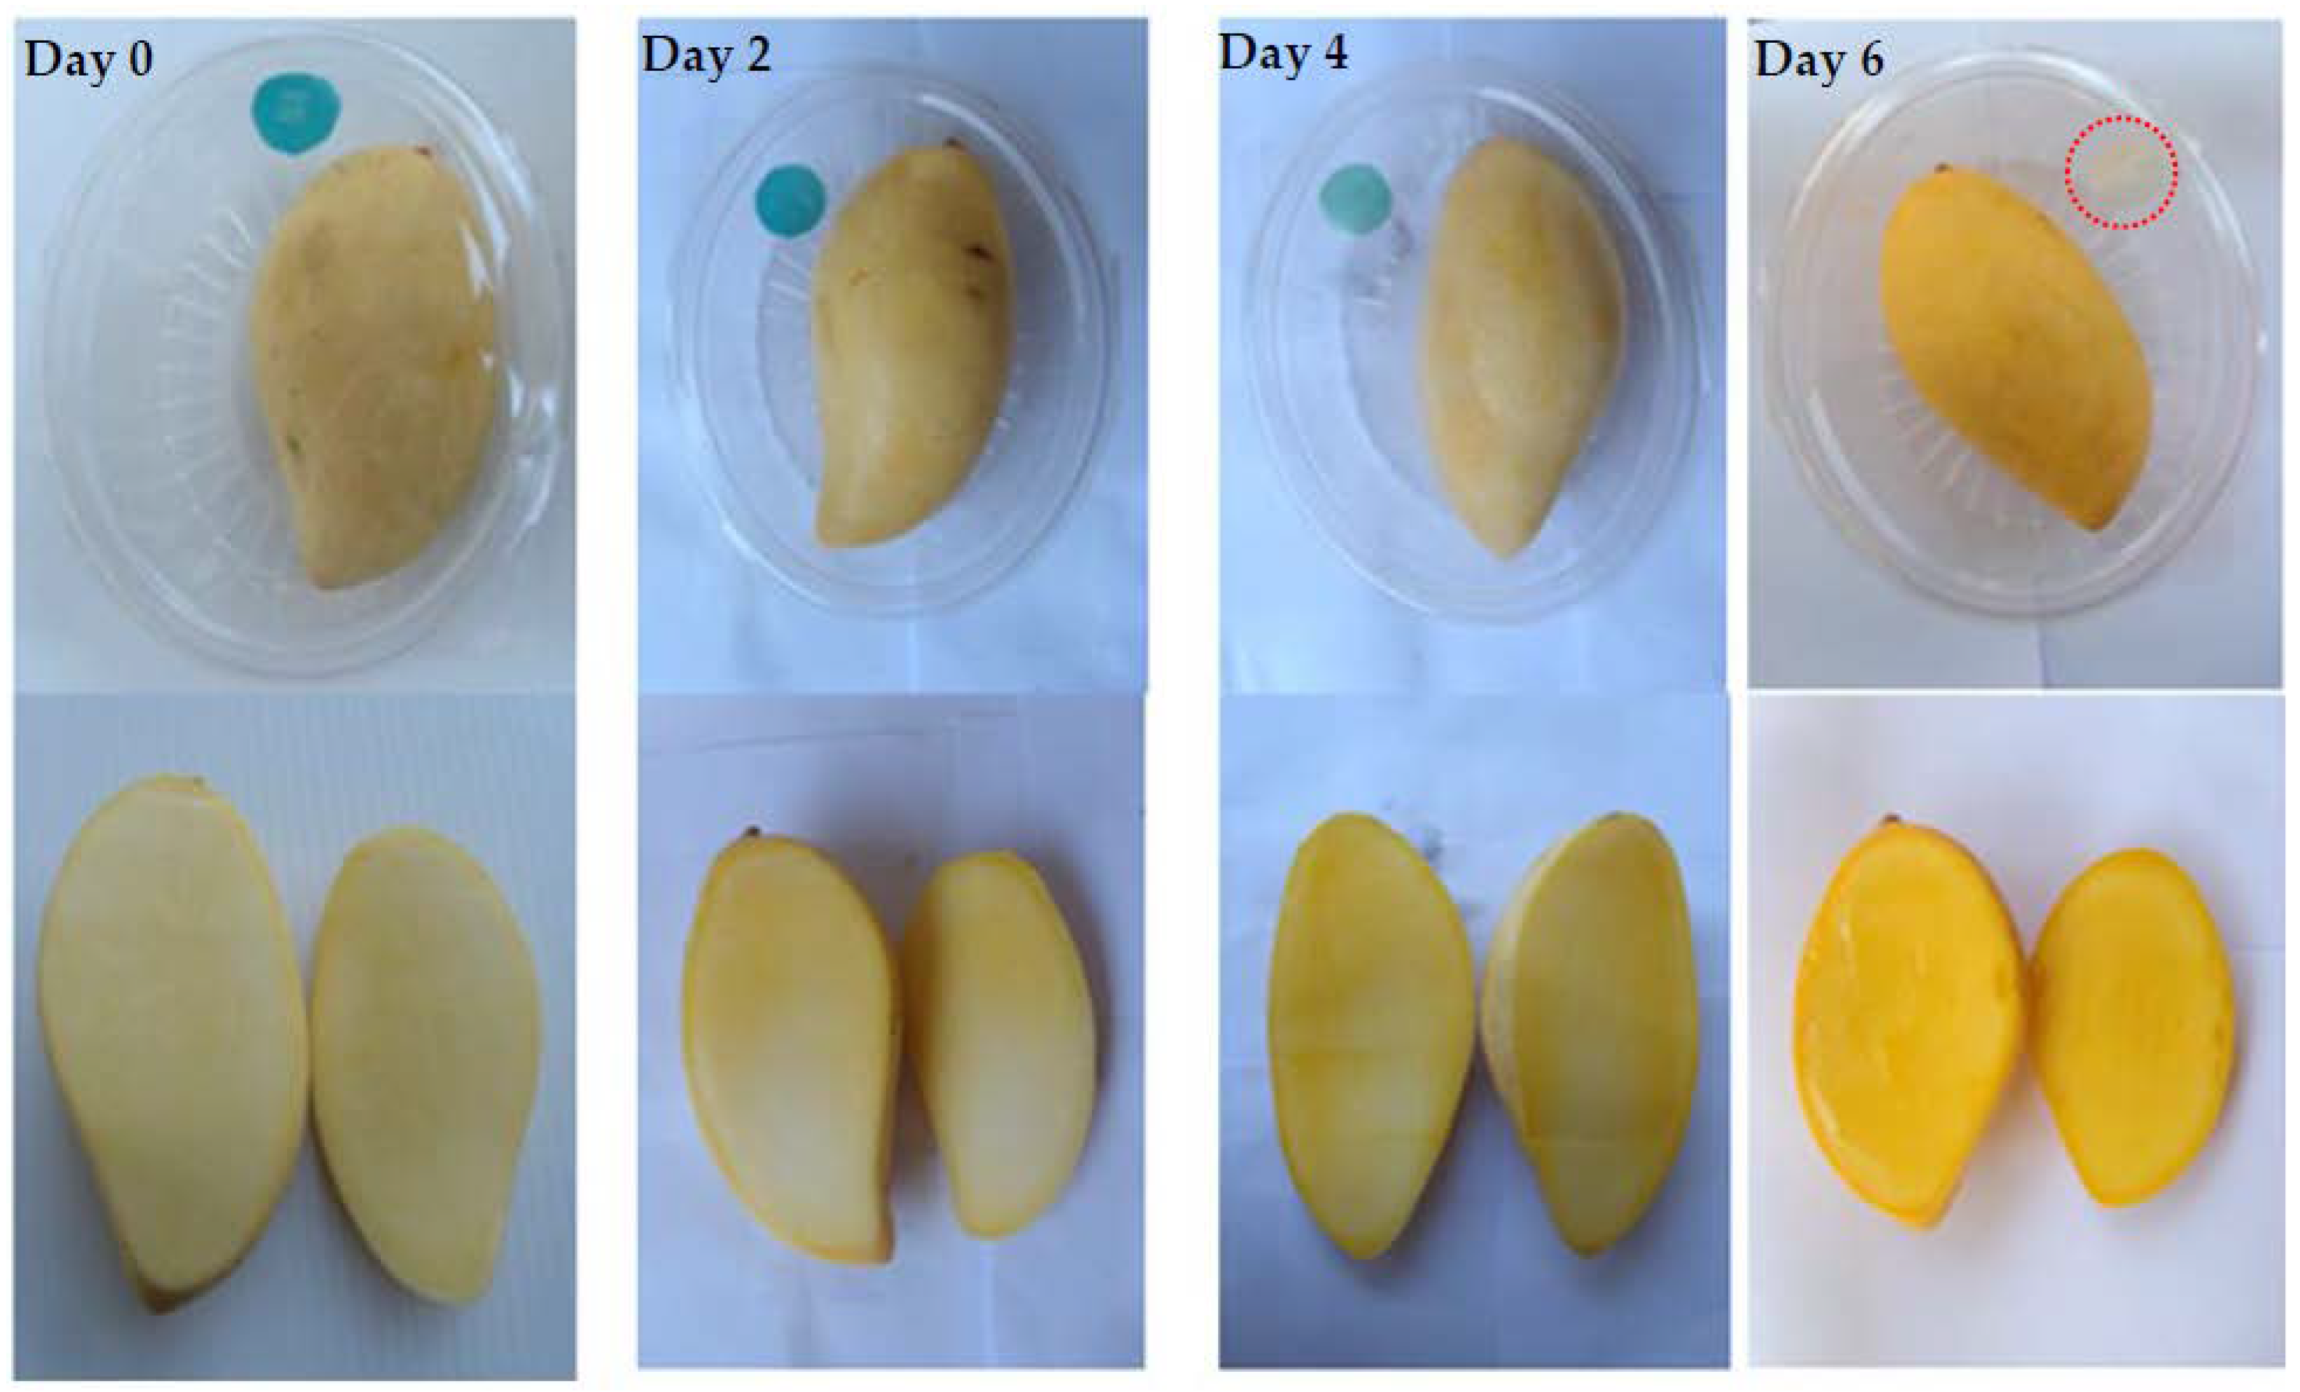
Recently, Perez et al. reported the ripening process, during storage, in sapote mamey fruit, showing that higher temperatures in the storage periods induced the more active softening enzymes. Further, low temperature (10 °C) created little change in the firmness of the fruit, and 20–25 °C temperature was considered suitable in softened fruit [40]. Figure 5 illustrates the shift in colorimetric mixed pH dye-based ripeness indicator labels on packaged mango fruit at 27 °C. These results demonstrate that, during storage at 27 °C, the minimal, half-ripe, and fully-ripe levels of mango fruit occurred on days 2, 4, and 6, respectively. When exposed to CO2 during storage, indicator labels displayed a distinct spectrum from blue to light bright green to yellow. According to the mango fruit’s hardness, SSC, and TA values, which serve as ripening indices, the obtained results revealed that the firmness and TA of fruits declined, whereas the SSC of fruits increased, as shown in Table 4. Similarly, Noiwan et al. [4], reported that over 6 days of ‘Nam Dok Mai Si Thong’ mango fruit storage, the firmness decreased, and all were most stable up to day 10. In the mango, on storage day 6, the SSC, and TA reached almost the maximum level. Carbon dioxide metabolite was emitted from mango fruit during ripening. Previous studies revealed that the ripening metabolites of mango produced CO2, malic and citric acids. During storage, the CO2 levels also increased as the days increased. Obtained results show that the incremental increase of CO2 levels is related to the temperature and activation energy, which changes the mango flesh color, taste, and texture during ripening [4,28,41]. Recently, Baek et al. [7,28] investigated the poly(ether-block-amide) film–based CO2 indicator that has been used for monitoring the quality of packaged kimchi during storage. Polymer-based indicators offer an improved understanding of ripening processes, whereas further advancements are required for improved commercial indicators useful in the food-packaging industries.
4. Conclusions
The ripeness indicator was developed in this study to monitor the ripeness quality of mango by CO2 concentrations in the headspace of mango packages. The Gaussian kinetic model and Arrhenius equation, used to evaluate the levels of mango fruit ripening via the formation of CO2, were correlated to the ∆E values of each indicator label. A kinetic model was well-fitted with a total color difference (∆E) during storage. The indicator response was found to correlate with carbon dioxide released in mango fruit. During fruit ripening periods of 0, 2, 4, and 6-day storage at 27°C, the prepared methylcellulose film containing mixed pH dye-based indicator reacted with different levels of CO2 and indicated the three different real-time monitoring-of-ripeness stages: blue in the minimal ripening; light bright green during half-ripening; and yellow at full ripeness. These color changes are evaluated by the quality index of ripeness of mango. During storage days 0~6, mango firmness was drastically reduced from 44.54 to 2.01 N. Due to the ripening process of mango, the hard texture changed to soft, and the flesh color changed from light yellow to dark yellow. In addition, the total acidity was decreased, which produced an impact on flavor as well as pH. The physiological process of respiration in the mango led to the creation of simple sugars, having an effect on the maturity and taste of the fruit. Therefore, The SSC increased from 10.70 to 18.26% when the fruit ripened. The ripeness indicator label could be a useful and rapid device for showing the ripening stages of mango fruit cv. Nam Dok Mai Si Thong. However, we hope that this slight advancement of the methylcellulose indicator label will be helpful in allowing consumers to easily monitor, with the naked eye, the ripening quality and shelf life of the mango.
Author Contributions
Conceived and planned the whole experiment, project administration, funding acquisition, resources, contributed reagents and materials, supervised the project, P.R.; conceptualization, validation, P.S. and P.R.; investigation and methodology, writing—original draft preparation, formal analysis, writing—review and editing, D.N., P.S. and P.R.; All authors have read and agreed to the published version of the manuscript.
Funding
This research is financially supported by office of the Higher Education Commission and the Postharvest Technology Innovation Center, Commission on Higher Education, Bangkok, Thailand. The present study was partially supported by The Thailand Research Fund (TRF).
Institutional Review Board Statement
Not applicable.
Informed Consent Statement
Not applicable.
Data Availability Statement
The data presented in this study are available on request from the corresponding author.
Acknowledgments
We wish to thank the Center of Excellence in Materials Science and Technology, Chiang Mai University, for financial support under the administration of the Materials Science Research Center, Faculty of Science, and Chiang Mai University. This research work was partially supported by Chiang Mai University.
Conflicts of Interest
The authors declare that there are no conflict of interest regarding the publication of this paper.
References
- Kader, A.A.; Holcroft, D.M. Postharvest: An introduction to the physiology and handling of fruit, vegetables and ornamentals. Horttechnology 1999, 9, 299. [Google Scholar] [CrossRef]
- Oldoni, F.C.A.; Florencio, C.; Bertazzo, G.B.; Grizotto, P.A.; Junior, S.B.; Carneiro, R.L.; Colnago, L.A.; Ferreira, M.D. Fruit quality parameters and volatile compounds from ‘Palmer’mangoes with internal breakdown. Food Chem. 2022, 388, 132902. [Google Scholar] [CrossRef]
- Beauvoit, B.; Belouah, I.; Bertin, N.; Cakpo, C.B.; Colombié, S.; Dai, Z.; Gautier, H.; Génard, M.; Moing, A.; Roch, L. Putting primary metabolism into perspective to obtain better fruits. Ann. Bot. 2018, 122, 1–21. [Google Scholar] [CrossRef]
- Noiwan, D.; Suppakul, P.; Joomwong, A.; Uthaibutra, J.; Rachtanapun, P. Kinetics of mango fruits (Mangifera indica cv.‘Nam Dok Mai Si Thong’) quality changes during storage at various temperatures. J. Agric. Sci. 2017, 9, 199–212. [Google Scholar] [CrossRef]
- Busatto, N.; Vittani, L.; Farneti, B.; Khomenko, I.; Caffini, M.; Faccini, S.; Boschetti, M.; Costa, F. Physiological and molecular characterization of the late ripening stages in Mangifera indica cv Keitt. Postharvest Biol. Technol. 2022, 183, 111746. [Google Scholar] [CrossRef]
- Matulaprungsan, B.; Wongs-Aree, C.; Penchaiya, P.; Boonyaritthongchai, P.; Srisurapanon, V.; Kanlayanarat, S. Analysis of Critical Control Points of Post-Harvest Diseases in the Material Flow of Nam Dok Mai Mango Exported to Japan. Agriculture 2019, 9, 200. [Google Scholar] [CrossRef]
- Baek, S.; Maruthupandy, M.; Lee, K.; Kim, D.; Seo, J. Preparation and characterization of a poly (ether-block-amide) film–based CO2 indicator for monitoring kimchi quality. React. Funct. Polym. 2018, 131, 75–83. [Google Scholar] [CrossRef]
- Abbott, J.A. Quality measurement of fruits and vegetables. Postharvest Biol. Technol. 1999, 15, 207–225. [Google Scholar] [CrossRef]
- Ziosi, V.; Noferini, M.; Fiori, G.; Tadiello, A.; Trainotti, L.; Casadoro, G.; Costa, G. A new index based on vis spectroscopy to characterize the progression of ripening in peach fruit. Postharvest Biol. Technol. 2008, 49, 319–329. [Google Scholar] [CrossRef]
- Peris, M.; Escuder-Gilabert, L. A 21st century technique for food control: Electronic noses. Anal. Chim. Acta 2009, 638, 1–15. [Google Scholar] [CrossRef]
- Lebrun, M.; Plotto, A.; Goodner, K.; Ducamp, M.-N.; Baldwin, E. Discrimination of mango fruit maturity by volatiles using the electronic nose and gas chromatography. Postharvest Biol. Technol. 2008, 48, 122–131. [Google Scholar] [CrossRef]
- Zhang, H.; Wang, J.; Ye, S. Predictions of acidity, soluble solids and firmness of pear using electronic nose technique. J. Food Eng. 2008, 86, 370–378. [Google Scholar] [CrossRef]
- Zakaria, A.; Shakaff, A.Y.M.; Masnan, M.J.; Saad, F.S.A.; Adom, A.H.; Ahmad, M.N.; Jaafar, M.N.; Abdullah, A.H.; Kamarudin, L.M. Improved maturity and ripeness classifications of magnifera indica cv. harumanis mangoes through sensor fusion of an electronic nose and acoustic sensor. Sensors 2012, 12, 6023–6048. [Google Scholar] [CrossRef]
- Hor, S.; Léchaudel, M.; Mith, H.; Bugaud, C. Fruit density: A reliable indicator of sensory quality for mango. Sci. Hortic. 2020, 272, 109548. [Google Scholar] [CrossRef]
- Gomez, A.H.; Wang, J.; Hu, G.; Pereira, A.G. Discrimination of storage shelf-life for mandarin by electronic nose technique. LWT-Food Sci. Technol. 2007, 40, 681–689. [Google Scholar] [CrossRef]
- Gómez, A.H.; Wang, J.; Hu, G.; Pereira, A.G. Monitoring storage shelf life of tomato using electronic nose technique. J. Food Eng. 2008, 85, 625–631. [Google Scholar] [CrossRef]
- Mizrach, A. Determination of avocado and mango fruit properties by ultrasonic technique. Ultrasonics 2000, 38, 717–722. [Google Scholar] [CrossRef]
- Mizrach, A. Ultrasonic technology for quality evaluation of fresh fruit and vegetables in pre-and postharvest processes. Postharvest Biol. Technol. 2008, 48, 315–330. [Google Scholar] [CrossRef]
- Vergara, A.; Llobet, E.; Ramírez, J.; Ivanov, P.; Fonseca, L.; Zampolli, S.; Scorzoni, A.; Becker, T.; Marco, S.; Wöllenstein, J. An RFID reader with onboard sensing capability for monitoring fruit quality. Sens. Actuators B Chem. 2007, 127, 143–149. [Google Scholar] [CrossRef]
- Hussain, A.; Pu, H.; Sun, D.-W. Innovative nondestructive imaging techniques for ripening and maturity of fruits–a review of recent applications. Trends Food Sci. Technol. 2018, 72, 144–152. [Google Scholar] [CrossRef]
- Li, B.; Lecourt, J.; Bishop, G. Advances in non-destructive early assessment of fruit ripeness towards defining optimal time of harvest and yield prediction—A review. Plants 2018, 7, 3. [Google Scholar] [CrossRef] [PubMed]
- Yam, K.L.; Takhistov, P.T.; Miltz, J. Intelligent packaging: Concepts and applications. J. Food Sci. 2005, 70, R1–R10. [Google Scholar] [CrossRef]
- Kuswandi, B.; Murdyaningsih, E.A. Simple on package indicator label for monitoring of grape ripening process using colorimetric pH sensor. J. Food Meas. Charact. 2017, 11, 2180–2194. [Google Scholar] [CrossRef]
- Kuswandi, B.; Maryska, C.; Abdullah, A.; Heng, L.Y. Real time on-package freshness indicator for guavas packaging. J. Food Meas. Charact. 2013, 7, 29–39. [Google Scholar] [CrossRef]
- Niponsak, A.; Laohakunjit, N.; Kerdchoechuen, O.; Wongsawadee, P. Development of smart colourimetric starch–based indicator for liberated volatiles during durian ripeness. Food Res. Int. 2016, 89, 365–372. [Google Scholar] [CrossRef] [PubMed]
- Lang, C.; Hübert, T. A colour ripeness indicator for apples. Food Bioprocess Technol. 2012, 5, 3244–3249. [Google Scholar] [CrossRef]
- Ebnesajjad, S. Handbook of Adhesives and Surface Preparation: Technology, Applications and Manufacturing; William Andrew: Norwich, NY, USA, 2010. [Google Scholar]
- Baek, S.; Maruthupandy, M.; Lee, K.; Kim, D.; Seo, J. Freshness indicator for monitoring changes in quality of packaged kimchi during storage. Food Packag. Shelf Life 2020, 25, 100528. [Google Scholar] [CrossRef]
- Alavi, S.; Thomas, S.; Sandeep, K.; Kalarikkal, N.; Varghese, J.; Yaragalla, S. Polymers for Packaging Applications; CRC Press: Boca Raton, FL, USA, 2014. [Google Scholar]
- Nopwinyuwong, A.; Trevanich, S.; Suppakul, P. Development of a novel colorimetric indicator label for monitoring freshness of intermediate-moisture dessert spoilage. Talanta 2010, 81, 1126–1132. [Google Scholar] [CrossRef]
- Monisha, S.; Niveditha, A.; Pavithra, D.; Chidanand, D.; Sunil, C.; Rawson, A. Effect of microwave treatment on colour of turmeric (Curcuma longa L.). Int. J. Sci. Environ. Technol. 2016, 5, 2062–2070. [Google Scholar]
- Sivakumar, D.; Naudé, Y.; Rohwer, E.; Korsten, L. Volatile compounds, quality attributes, mineral composition and pericarp structure of South African litchi export cultivars Mauritius and McLean’s Red. J. Sci. Food Agric. 2008, 88, 1074–1081. [Google Scholar] [CrossRef]
- AOAC. Acidity (Titratable) of Fruitproducts with AOAC Official Method 920, 17th ed.; AOAC: Scottsdale, AZ, USA, 2002. [Google Scholar]
- Taoukis, P. Modelling the use of time-temperature indicators in distribution and stock rotation PS Taoukis, National Technical University of Athens. Food Process. Model. 2001, 59, 402–431. [Google Scholar]
- Mook, W.; Rozanski, K. Environmental Isotopes in the Hydrological Cycle. Principles and Applications, Volumes I, IV and V; IAEA Publish: New York, NY, USA, 2000. [Google Scholar]
- Sabnis R, W. Handbook Of Acid Base Indicators; CRC Press: Boca Raton, FL, USA, 2007. [Google Scholar]
- Puligundla, P.; Jung, J.; Ko, S. Carbon dioxide sensors for intelligent food packaging applications. Food Control. 2012, 25, 328–333. [Google Scholar] [CrossRef]
- Peleg, M.; Bagley, E.B. Physical properties of foods. In Proceedings of the IFT Basic Symposium Series (USA), Las Vegas, NV, USA, 1 January 1983. [Google Scholar]
- Rukchon, C.; Nopwinyuwong, A.; Trevanich, S.; Jinkarn, T.; Suppakul, P. Development of a food spoilage indicator for monitoring freshness of skinless chicken breast. Talanta 2014, 130, 547–554. [Google Scholar] [CrossRef]
- Diaz-Perez, J.C.; Bautista, S.; Villanueva, R. Quality changes in sapote mamey fruit during ripening and storage. Postharvest Biol. Technol. 2000, 18, 67–73. [Google Scholar] [CrossRef]
- Rumainum, I.M.; Worarad, K.; Srilaong, V.; Yamane, K. Fruit quality and antioxidant capacity of six Thai mango cultivars. Agric. Nat. Resour. 2018, 52, 208–214. [Google Scholar] [CrossRef]
Figure 1.
Colorimetric changes of indicator solution with addition of different concentrations (30, 35, 40, 45, 50, 55, 60, 65, 70, 75, and 80 µL) of 0.1 M acetic acid.
Figure 1.
Colorimetric changes of indicator solution with addition of different concentrations (30, 35, 40, 45, 50, 55, 60, 65, 70, 75, and 80 µL) of 0.1 M acetic acid.
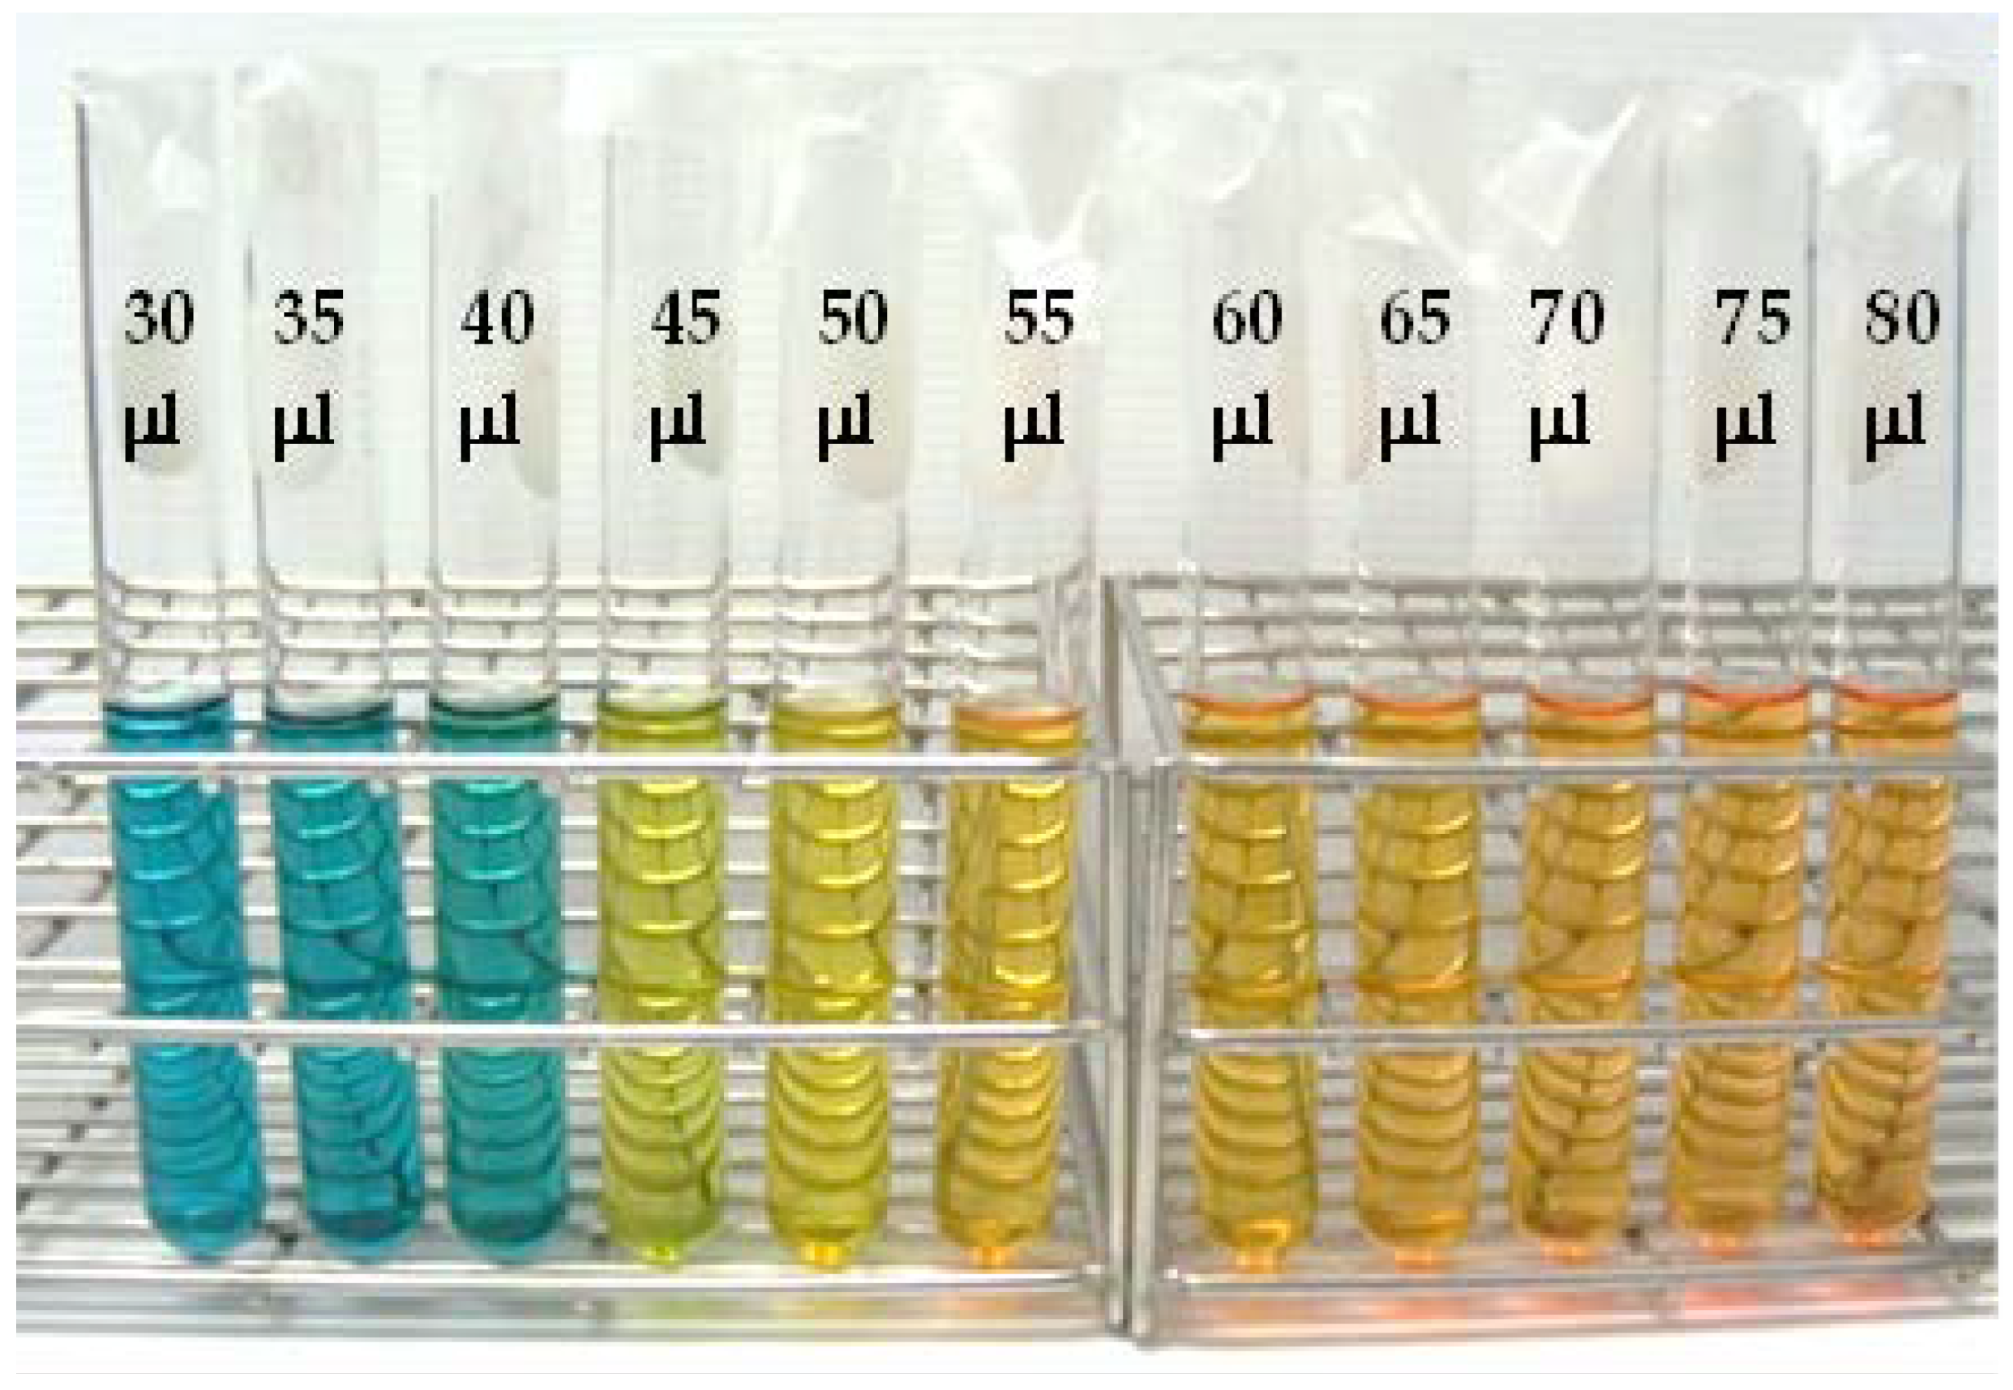
Figure 2.
Change in color of indicator label in response to CO2.
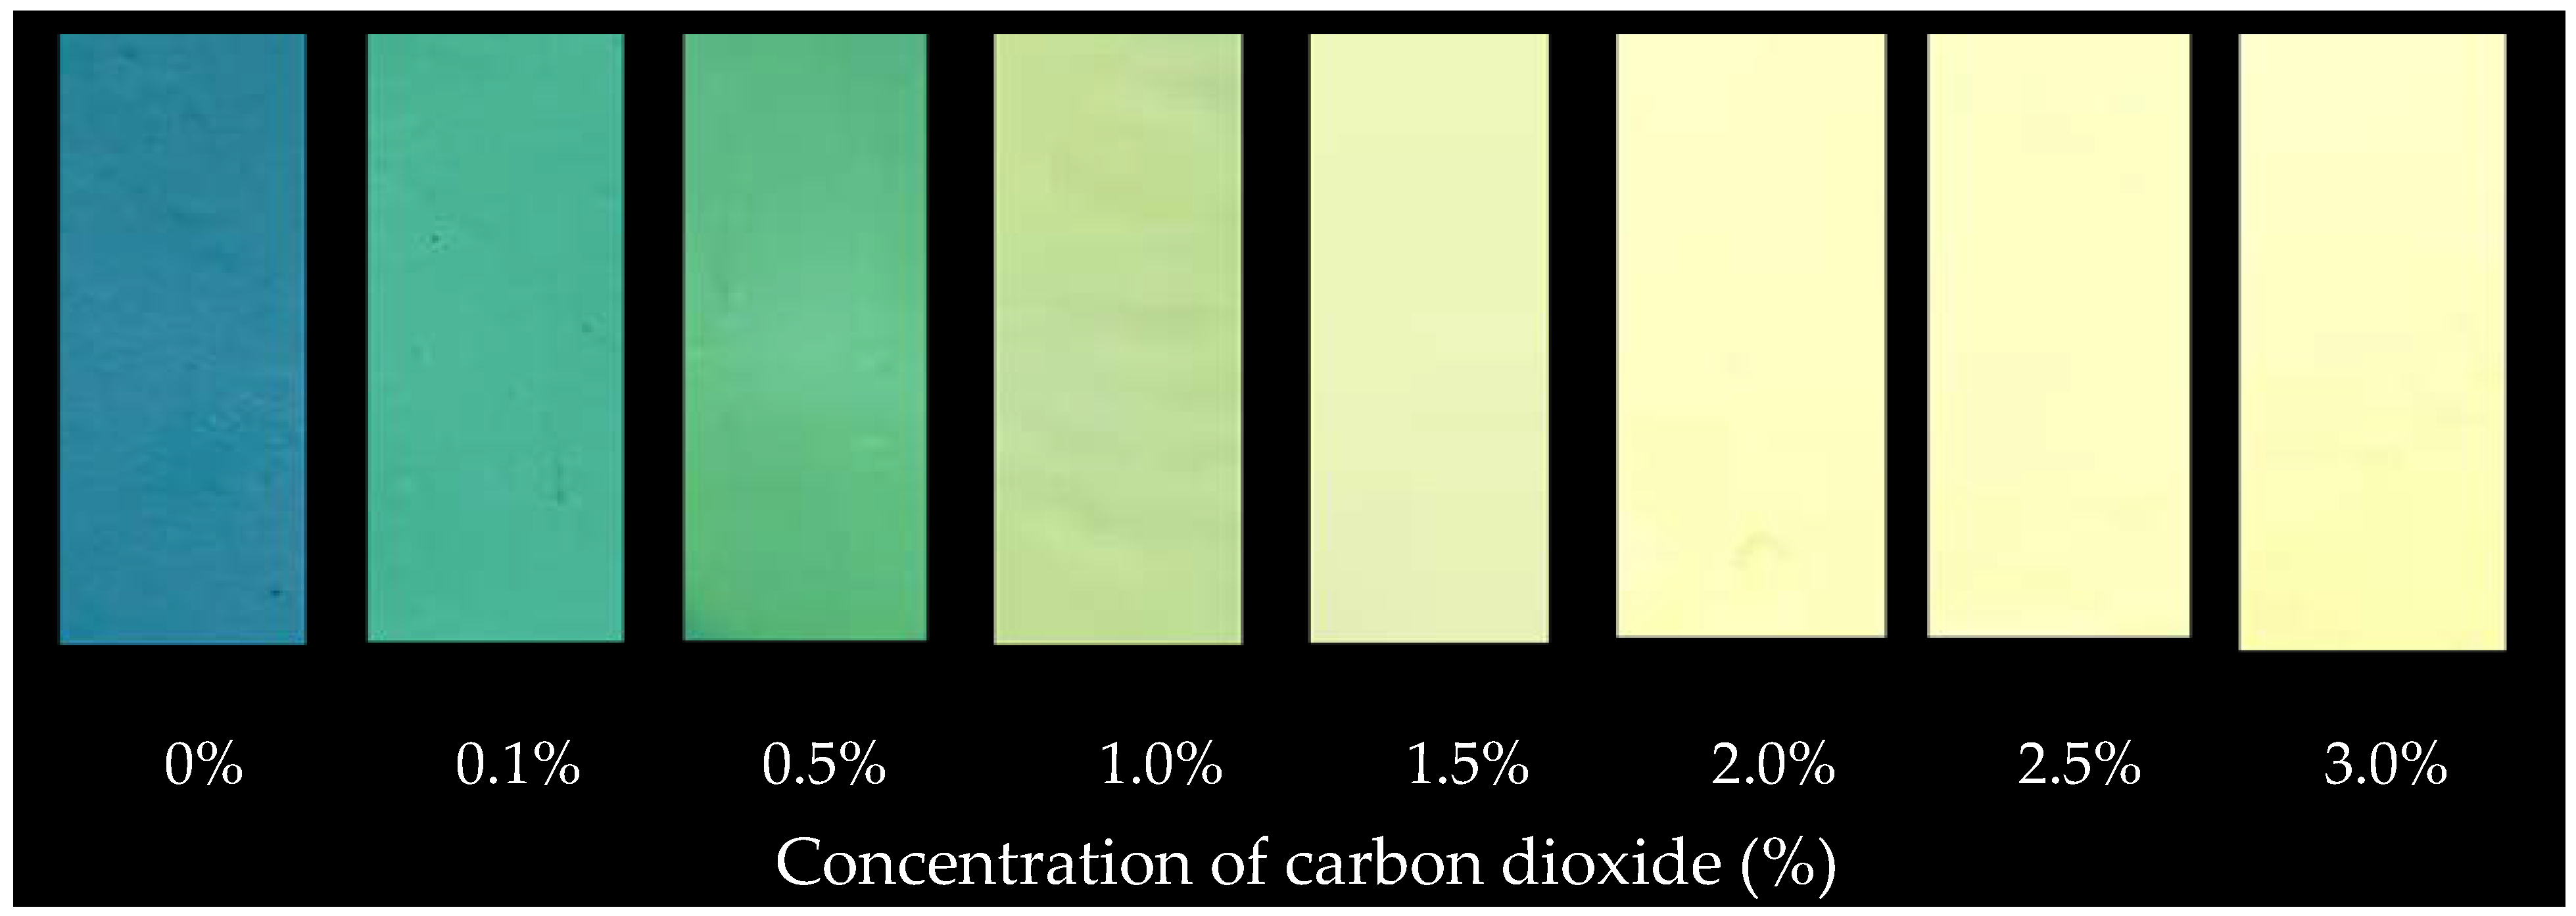
Figure 3.
Effect of storage time and temperatures on ∆E values of indicator labels in the packaged mangoes.
Figure 3.
Effect of storage time and temperatures on ∆E values of indicator labels in the packaged mangoes.
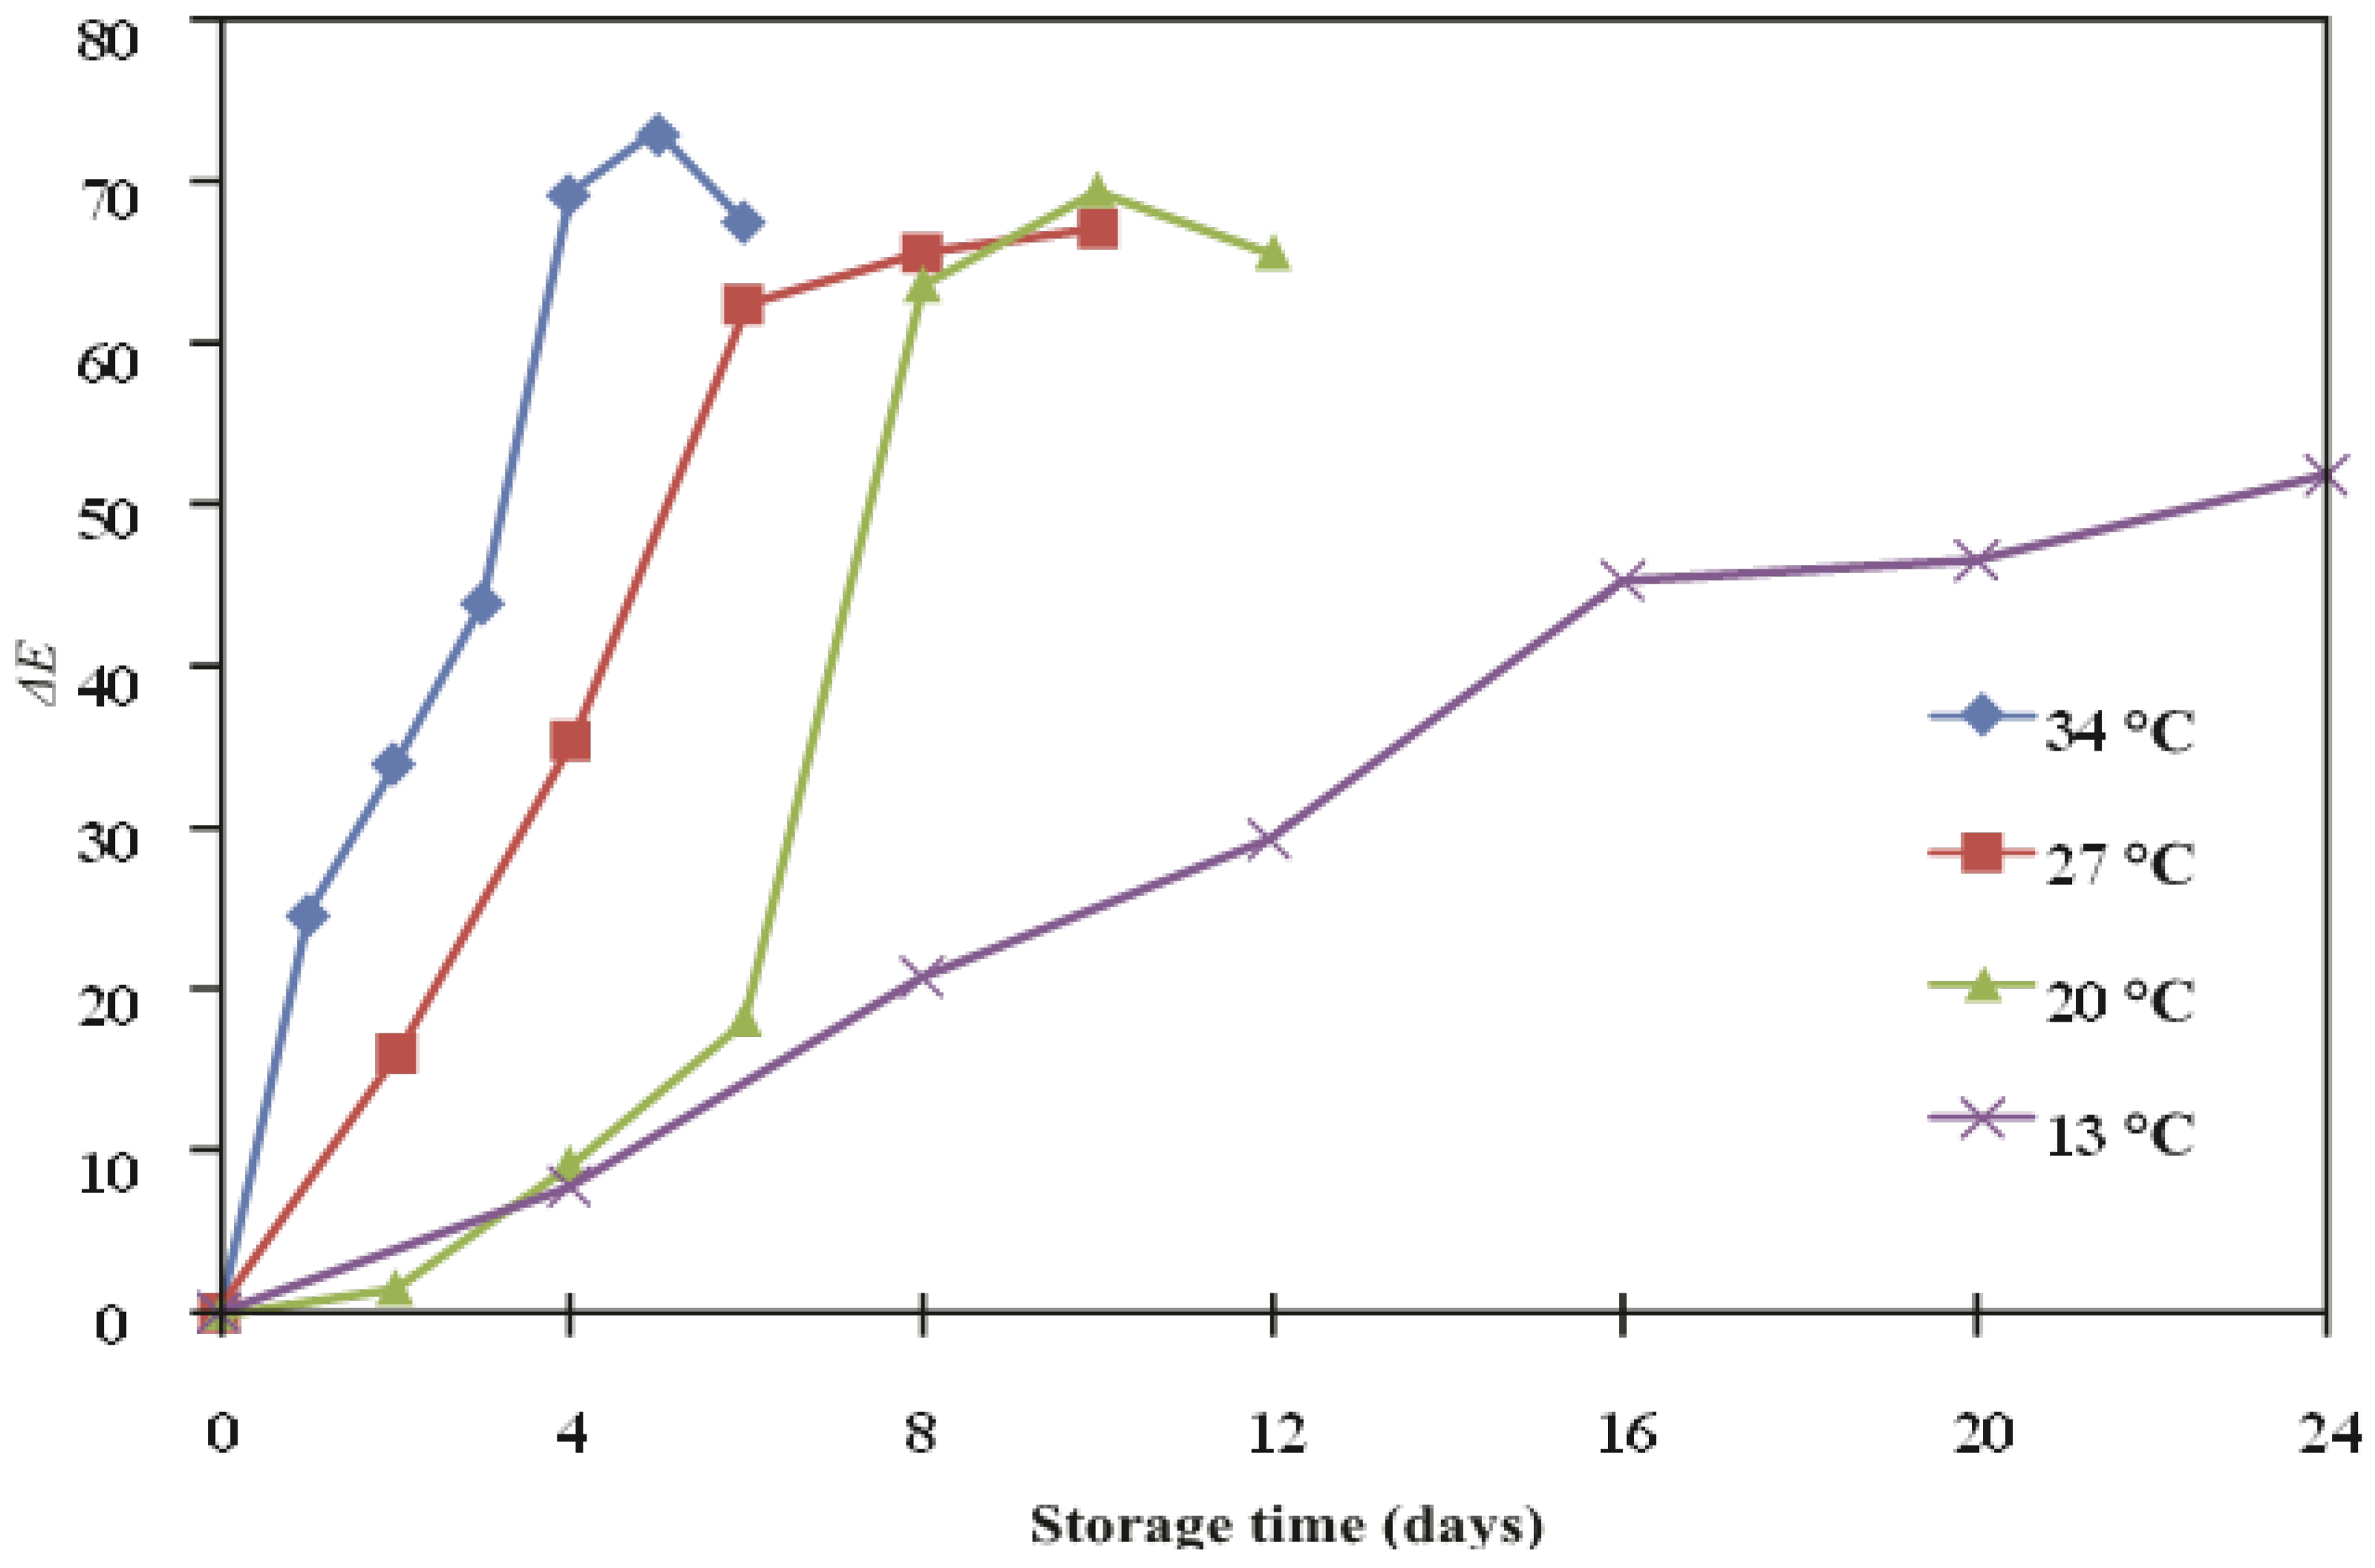
Figure 4.
Plot of the response function F(X) with storage time for ∆E value of indicator label applied with mango fruit at different temperatures.
Figure 4.
Plot of the response function F(X) with storage time for ∆E value of indicator label applied with mango fruit at different temperatures.

Figure 5.
Color change of ripeness-indicator label with packaged mango fruit cv. Nam Dok Mai Si Thong at 27 °C; blue = unripe, light green = half-ripe and yellow = fully-ripe.
Figure 5.
Color change of ripeness-indicator label with packaged mango fruit cv. Nam Dok Mai Si Thong at 27 °C; blue = unripe, light green = half-ripe and yellow = fully-ripe.

Table 1.
Change in pH and Absorbance of indicator solution in response to acetic acid.
| 0.1 M Acetic Acid (µL) | pH | Absorbance (416 nm) |
|---|---|---|
| 30 | 10.59 | 1.4191 |
| 35 | 10.04 | 1.5552 |
| 40 | 9.04 | 1.6053 |
| 45 | 8.1 | 1.6082 |
| 50 | 7.64 | 1.6065 |
| 55 | 7.04 | 1.6009 |
| 60 | 6.66 | 1.5987 |
| 65 | 6.35 | 1.5765 |
| 70 | 6.17 | 1.5624 |
| 75 | 6.01 | 1.5616 |
| 80 | 5.91 | 1.5524 |
Table 2.
Change in L* a* and b* value of indicator label in response to CO2.
| Carbon Dioxide (%) | L* | a* | b* |
|---|---|---|---|
| 0 | 40.38 | −16.3 | −19.14 |
| 0.1 | 41.52 | −21.9 | −6.18 |
| 0.5 | 49.34 | −25.74 | −4.57 |
| 1 | 58.09 | −22.38 | 10.18 |
| 1.5 | 62.72 | −18.22 | 17.28 |
| 2 | 70.84 | −8.34 | 26.78 |
| 2.5 | 74.93 | −3.81 | 29.6 |
| 3 | 78.41 | −0.28 | 34.09 |
Table 3.
Response of rate constants (k), the correlation coefficient (R2) of the fit and activation energy (Ea) obtained from the ∆E model.
Table 3.
Response of rate constants (k), the correlation coefficient (R2) of the fit and activation energy (Ea) obtained from the ∆E model.
| Temperature (°C) | ∆E | ||
|---|---|---|---|
| k (day−1) | R2 | Ea (kJ/mol) | |
| 13 | 0.77 | 0.9737 | 52.3 |
| 20 | 0.16 | 0.9417 | |
| 27 | 0.249 | 0.9845 | |
| 34 | 0.271 | 0.915 | |
Table 4.
Effect of changes in mango fruit cv. Nam Dok Mai Si Thong firmness, SSC, and TA during storage at 27 °C.
Table 4.
Effect of changes in mango fruit cv. Nam Dok Mai Si Thong firmness, SSC, and TA during storage at 27 °C.
| Storage Time (Days) | 0 | 2 | 4 | 6 |
|---|---|---|---|---|
| SSC (%) | 10.70 | 11.78 | 14.82 | 18.26 |
| TA (%) | 2.84 | 2.38 | 1.29 | 0.21 |
| firmness (N) | 44.54 | 12.94 | 3.44 | 2.01 |
Publisher’s Note: MDPI stays neutral with regard to jurisdictional claims in published maps and institutional affiliations. |
© 2022 by the authors. Licensee MDPI, Basel, Switzerland. This article is an open access article distributed under the terms and conditions of the Creative Commons Attribution (CC BY) license (https://creativecommons.org/licenses/by/4.0/).
Share and Cite
MDPI and ACS Style
Noiwan, D.; Suppakul, P.; Rachtanapun, P. Preparation of Methylcellulose Film-Based CO2 Indicator for Monitoring the Ripeness Quality of Mango Fruit cv. Nam Dok Mai Si Thong. Polymers 2022, 14, 3616. https://doi.org/10.3390/polym14173616
AMA Style
Noiwan D, Suppakul P, Rachtanapun P. Preparation of Methylcellulose Film-Based CO2 Indicator for Monitoring the Ripeness Quality of Mango Fruit cv. Nam Dok Mai Si Thong. Polymers. 2022; 14(17):3616. https://doi.org/10.3390/polym14173616
Chicago/Turabian StyleNoiwan, Duangjai, Panuwat Suppakul, and Pornchai Rachtanapun. 2022. "Preparation of Methylcellulose Film-Based CO2 Indicator for Monitoring the Ripeness Quality of Mango Fruit cv. Nam Dok Mai Si Thong" Polymers 14, no. 17: 3616. https://doi.org/10.3390/polym14173616
Note that from the first issue of 2016, this journal uses article numbers instead of page numbers. See further details here.