
3D Printing Processability of a Thermally Conductive Compound Based on Carbon Nanofiller-Modified Thermoplastic Polyamide 12

 , , , , , , ,
  and
and
Abstract
:1. Introduction
2. Materials and Methods
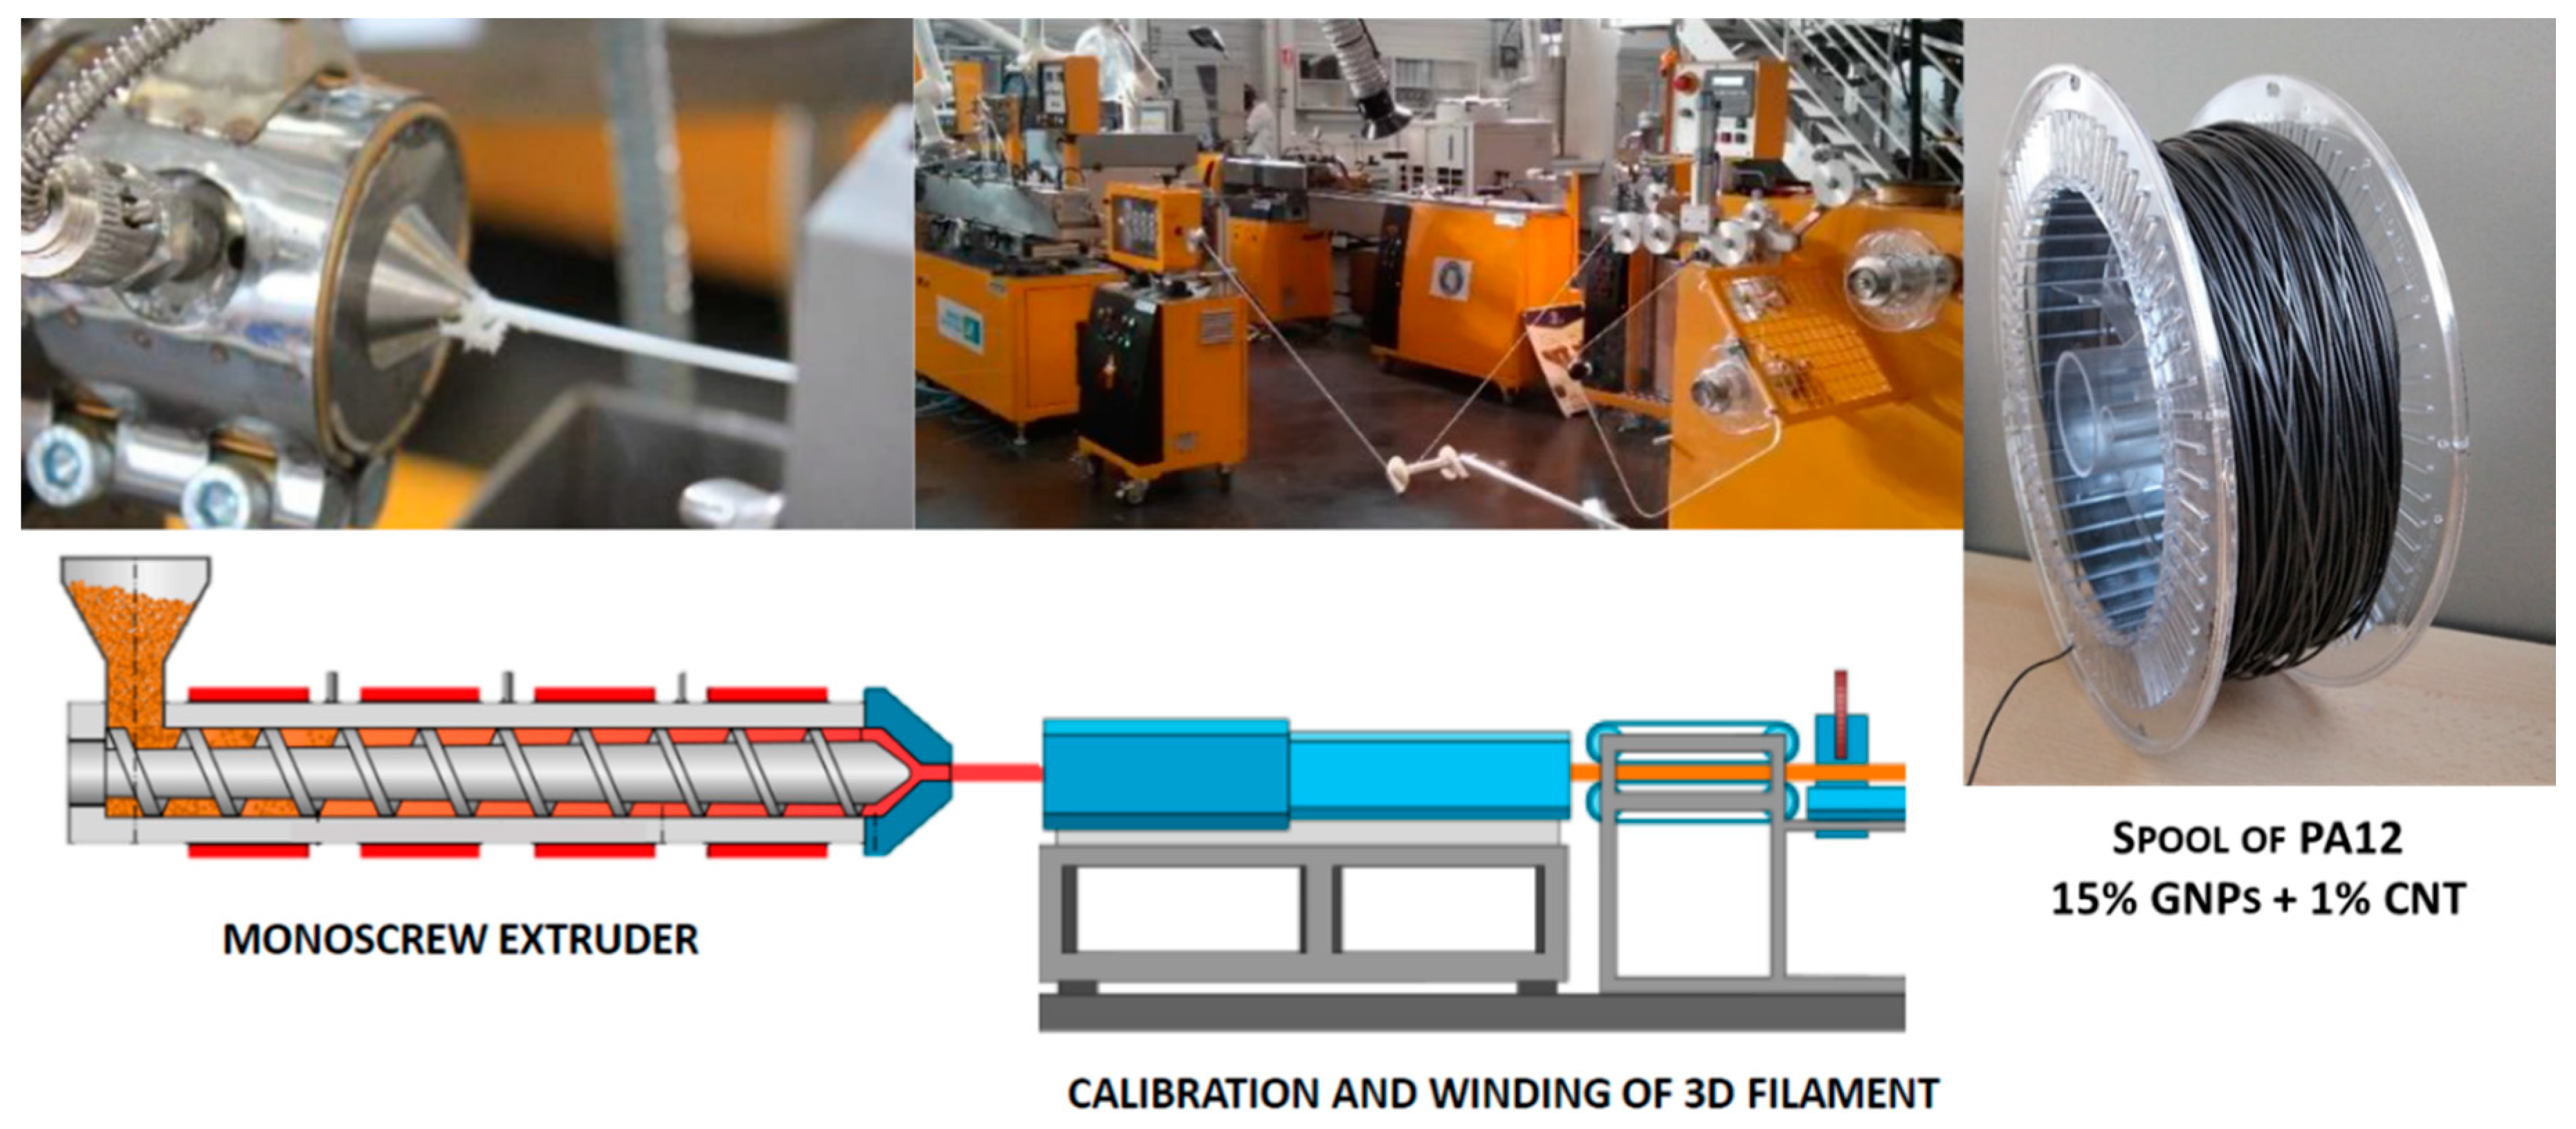
2.1. The Materials
2.2. Characterizations
2.3. Theremal Conductivity and Electrical Conductivity Test Methods
2.4. FFF Process Parameters
3. Results
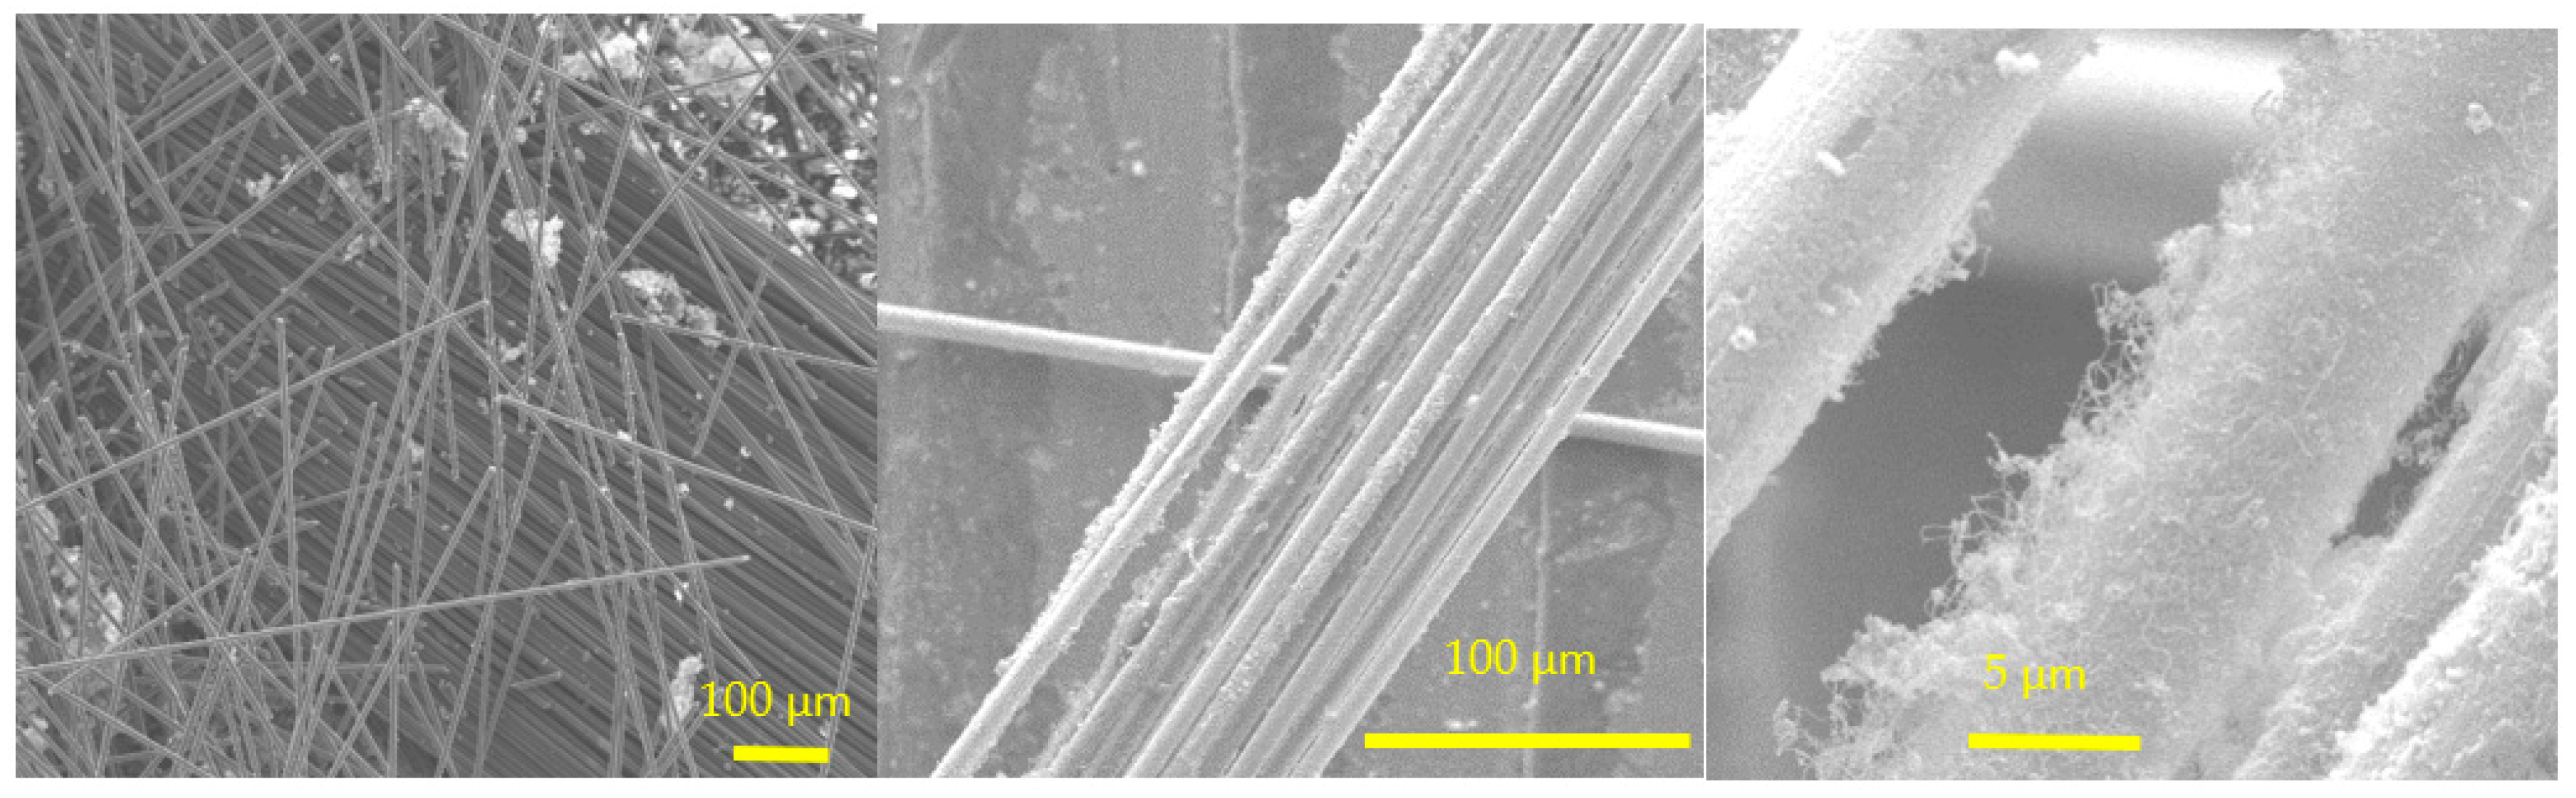
3.1. Carbon-Based Nanofillers
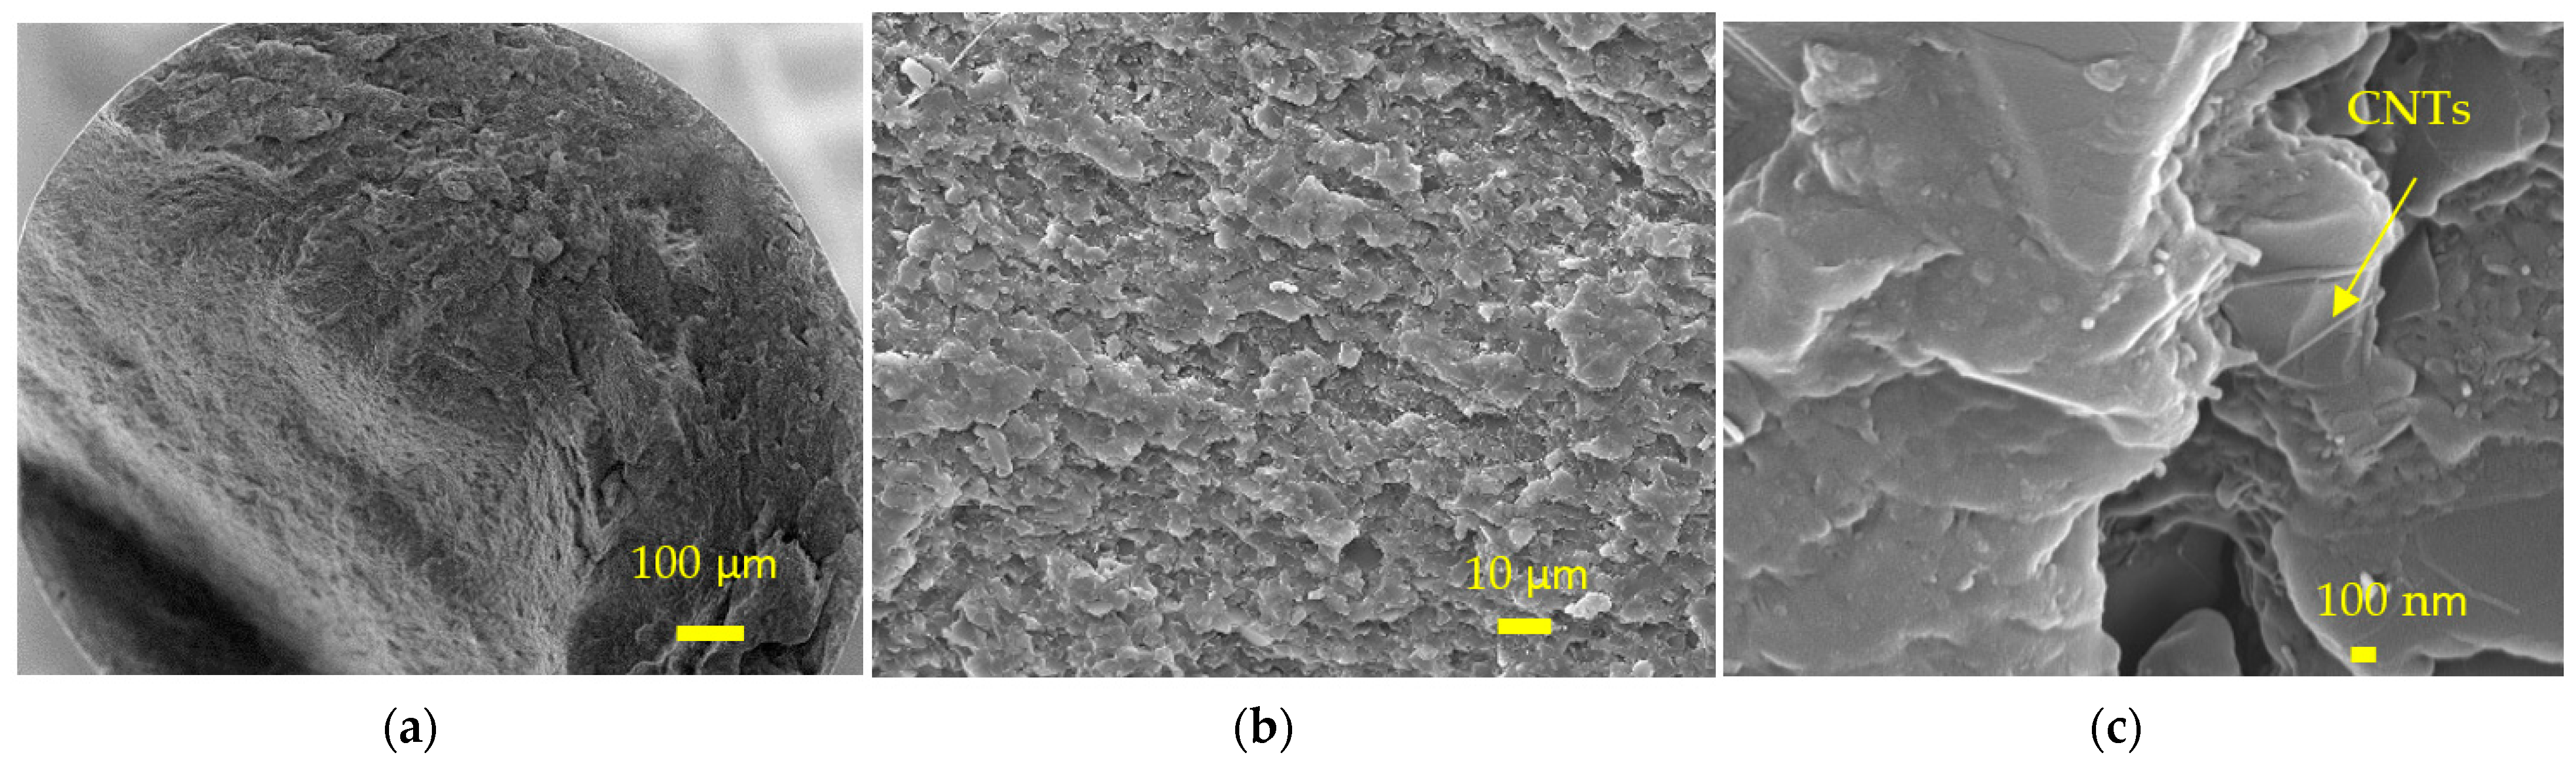
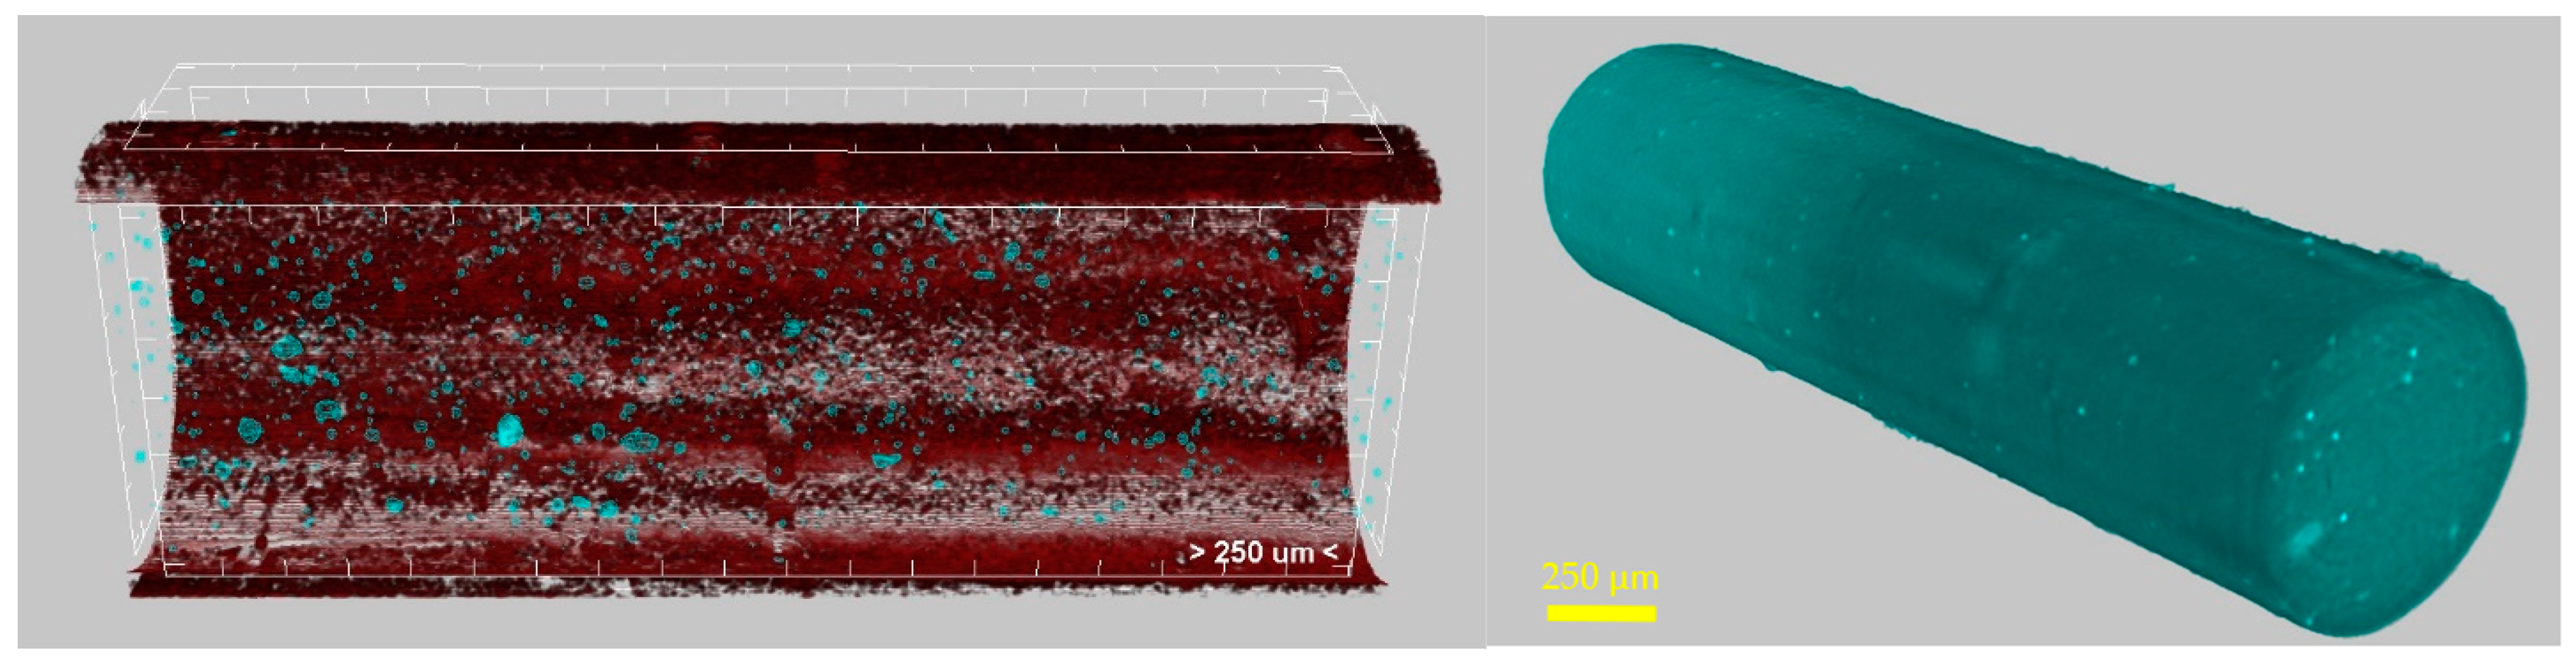
3.2. Composite Structure Characterization by SEM/Micro-CT
3.3. Thermal Conductivity and Electrical Conductivity Results
3.4. FFF Processability Assessment
4. Conclusions
Author Contributions
Funding
Institutional Review Board Statement
Informed Consent Statement
Data Availability Statement
Conflicts of Interest
References
- Vadivelu, M.A.; Kumar, C.R.; Joshi, G.M. Polymer Composites for Thermal Management: A Review. Compos. Interfaces 2016, 23, 847–872. [Google Scholar] [CrossRef]
- Kwon, Y.-J.; Park, J.-B.; Jeon, Y.-P.; Hong, J.-Y.; Park, H.-S.; Lee, J.-U. A Review of Polymer Composites Based on Carbon Fillers for Thermal Management Applications: Design, Preparation, and Properties. Polymers 2021, 13, 1312. [Google Scholar] [CrossRef] [PubMed]
- Bai, J.; Goodridge, R.D.; Yuan, S.; Zhou, K.; Chua, C.K.; Wei, J. Thermal Influence of CNT on the Polyamide 12 Nanocomposite for Selective Laser Sintering. Molecules 2015, 20, 19041–19050. [Google Scholar] [CrossRef] [PubMed]
- Tofail, S.A.M.; Koumoulos, E.P.; Bandyopadhyay, A.; Bose, S.; O’Donoghue, L.; Charitidis, C. Additive Manufacturing: Scientific and Technological Challenges, Market Uptake and Opportunities. Mater. Today 2018, 21, 22–37. [Google Scholar] [CrossRef]
- Feng, C.; Yu, S.-S. 3D Printing of Thermal Insulating Polyimide/Cellulose Nanocrystal Composite Aerogels with Low Dimensional Shrinkage. Polymers 2021, 13, 3614. [Google Scholar] [CrossRef] [PubMed]
- Vanaei, H.R.; Shirinbayan, M.; Deligant, M.; Khelladi, S.; Tcharkhtchi, A. In-Process Monitoring of Temperature Evolution during Fused Filament Fabrication: A Journey from Numerical to Experimental Approaches. Thermo 2021, 10, 21. [Google Scholar] [CrossRef]
- Bahadur, R.; Bar-Cohen, A. Orthotropic Thermal Conductivity Effect on Cylindrical Pin Fin Heat Transfer. Int. J. Heat Mass Transf. 2007, 50, 1155–1162. [Google Scholar] [CrossRef]
- Guo, R.; Ren, Z.; Jia, X.; Bi, H.; Yang, H.; Ji, T.; Xu, M.; Cai, L. Preparation and Characterization of 3D Printed PLA-Based Conductive Composites Using Carbonaceous Fillers by Masterbatch Melting Method. Polymers 2019, 11, 1589. [Google Scholar] [CrossRef] [Green Version]
- Rafiee, M.; Farahani, R.D.; Therriault, D. Multi-Material 3D and 4D Printing: A Survey. Adv. Sci. 2020, 7, 1902307. [Google Scholar] [CrossRef]
- Diogo José, H.; Pedro Paulo Andrade, J. 3D-Printed Conductive Filaments Based on Carbon Nanostructures Embedded in a Polymer Matrix: A Review. IJANR 2019, 4, 26–40. [Google Scholar] [CrossRef]
- Guo, H.; Lv, R.; Bai, S. Recent Advances on 3D Printing Graphene-Based Composites. Nano Mater. Sci. 2019, 1, 101–115. [Google Scholar] [CrossRef]
- Shemelya, C.; De La Rosa, A.; Torrado, A.R.; Yu, K.; Domanowski, J.; Bonacuse, P.J.; Martin, R.E.; Juhasz, M.; Hurwitz, F.; Wicker, R.B.; et al. Anisotropy of Thermal Conductivity in 3D Printed Polymer Matrix Composites for Space Based Cube Satellites. Addit. Manuf. 2017, 16, 186–196. [Google Scholar] [CrossRef]
- Han, Z.; Fina, A. Thermal Conductivity of Carbon Nanotubes and Their Polymer Nanocomposites: A Review. Prog. Polym. Sci. 2011, 36, 914–944. [Google Scholar] [CrossRef] [Green Version]
- Chen, B.; Davies, R.; Liu, Y.; Yi, N.; Qiang, D.; Zhu, Y.; Ghita, O. Laser Sintering of Graphene Nanoplatelets Encapsulated Polyamide Powders. Addit. Manuf. 2020, 35, 101363. [Google Scholar] [CrossRef]
- Lupone, F.; Padovano, E.; Ostrovskaya, O.; Russo, A.; Badini, C. Innovative Approach to the Development of Conductive Hybrid Composites for Selective Laser Sintering. Compos. Part A: Appl. Sci. Manuf. 2021, 147, 106429. [Google Scholar] [CrossRef]
- Guo, N.; Leu, M.C. Effect of Different Graphite Materials on the Electrical Conductivity and Flexural Strength of Bipolar Plates Fabricated Using Selective Laser Sintering. Int. J. Hydrog. Energy 2012, 37, 3558–3566. [Google Scholar] [CrossRef]
- Szeluga, U.; Kumanek, B.; Trzebicka, B. Synergy in Hybrid Polymer/Nanocarbon Composites. A review. Compos. Part A Appl. Sci. Manuf. 2015, 73, 204–231. [Google Scholar] [CrossRef]
- Dey, A.; Roan Eagle, I.N.; Yodo, N. A Review on Filament Materials for Fused Filament Fabrication. J. Manuf. Mater. Process. 2021, 5, 69. [Google Scholar] [CrossRef]
- Wang, J.; Mubarak, S.; Dhamodharan, D.; Divakaran, N.; Wu, L.; Zhang, X. Fabrication of Thermoplastic Functionally Gradient Composite Parts with Anisotropic Thermal Conductive Properties Based on Multicomponent Fused Deposition Modeling 3D Printing. Compos. Commun. 2020, 19, 142–146. [Google Scholar] [CrossRef]
- El Magri, A.; Vanaei, S.; Shirinbayan, M.; Vaudreuil, S.; Tcharkhtchi, A. An Investigation to Study the Effect of Process Parameters on the Strength and Fatigue Behavior of 3D-Printed PLA-Graphene. Polymers 2021, 13, 3218. [Google Scholar] [CrossRef]
- Vanaei, H.R.; Shirinbayan, M.; Vanaei, S.; Fitoussi, J.; Khelladi, S.; Tcharkhtchi, A. Multi-Scale Damage Analysis and Fatigue Behavior of PLA Manufactured by Fused Deposition Modeling (FDM). Rapid Prototyp. J. 2021, 27, 371–378. [Google Scholar] [CrossRef]
- Kozior, T. The Influence of Selected Selective Laser Sintering Technology Process Parameters on Stress Relaxation, Mass of Models, and Their Surface Texture Quality. 3D Print. Addit. Manuf. 2020, 7, 126–138. [Google Scholar] [CrossRef]
- Adamczak, S.; Zmarzły, P.; Kozior, T.; Gogolewski, D. Assessment of Roundness and Waviness Deviations of Elements Produced by Selective Laser Sintering Technology. In Proceedings of the 23rd International Conference Engineering Mechanics, Svratka, Czech Republic, 15–18 May 2017; pp. 70–73. [Google Scholar]
- Turner, B.N.; Strong, R.; Gold, S.A. A Review of Melt Extrusion Additive Manufacturing Processes: I. Process Design and Modeling. Rapid Prototyp. J. 2014, 20, 192–204. [Google Scholar] [CrossRef]
- Bakrani Balani, S.; Chabert, F.; Nassiet, V.; Cantarel, A. Influence of the Printing Parameters on the Stability of the Deposited Beads in Fused Filament Fabrication of Poly(lactic) Acid. Addit. Manuf. 2019, 25, 112–121. [Google Scholar] [CrossRef] [Green Version]
- Ajinjeru, C.; Kishore, V.; Liu, P.; Lindahl, J.; Hassen, A.A.; Kunc, V.; Post, B.; Love, L.; Duty, C. Determination of Melt Processing Conditions for High Performance Amorphous Thermoplastics for Large Format Additive Manufacturing. Addit. Manuf. 2018, 21, 125–132. [Google Scholar] [CrossRef]
- Gao, X.; Qi, S.; Kuang, X.; Su, Y.; Li, J.; Wang, D. Fused Filament Fabrication of Polymer Materials: A Review of Interlayer Bond. Addit. Manuf. 2021, 37, 101658. [Google Scholar] [CrossRef]
- Rashid, A.A.; Koç, M. Fused Filament Fabrication Process: A Review of Numerical Simulation Techniques. Polymers 2021, 13, 3534. [Google Scholar] [CrossRef]
- Comminal, R.; Serdeczny, M.P.; Pedersen, D.B.; Spangenberg, J. Numerical Modeling of the Strand Deposition Flow in Extrusion-Based Additive Manufacturing. Addit. Manuf. 2018, 20, 68–76. [Google Scholar] [CrossRef] [Green Version]
- Trompeta, A.-F.; Koklioti, M.A.; Perivoliotis, D.K.; Lynch, I.; Charitidis, C.A. Towards a Holistic Environmental Impact Assessment of Carbon Nanotube Growth through Chemical Vapour Deposition. J. Clean. Prod. 2016, 129, 384–394. [Google Scholar] [CrossRef] [Green Version]


| Base Polymer Material | PA12 AMNO TLD |
|---|---|
| Fillers | 15 wt% GNP + 1 wt% CNTs |
| Melting point (°C)-peak | 189 °C |
| Glass transition temperature (°C) | 51 °C |
| Max. printing temperature (°C) | 280 °C |
| Diameter | 1.75 mm |
| Color | Black |
| Translucency | No |
| Density (g/cm3) | 1.16 |
| Humidity take-up (w%) | ~0.35% |
| Parameters | Filament |
|---|---|
| Object Surface Density (mm−1) | 3.82 |
| Structure Thickness (mm) | 0.58 |
| Structure Separation (mm) | 0.05 |
| Structure Linear Density (mm-1) | 1.72 |
| Degree of Anisotropy | 5.6 |
| Fractal Dimension | 2.09 |
| Total Porosity (%) | 0.18 |
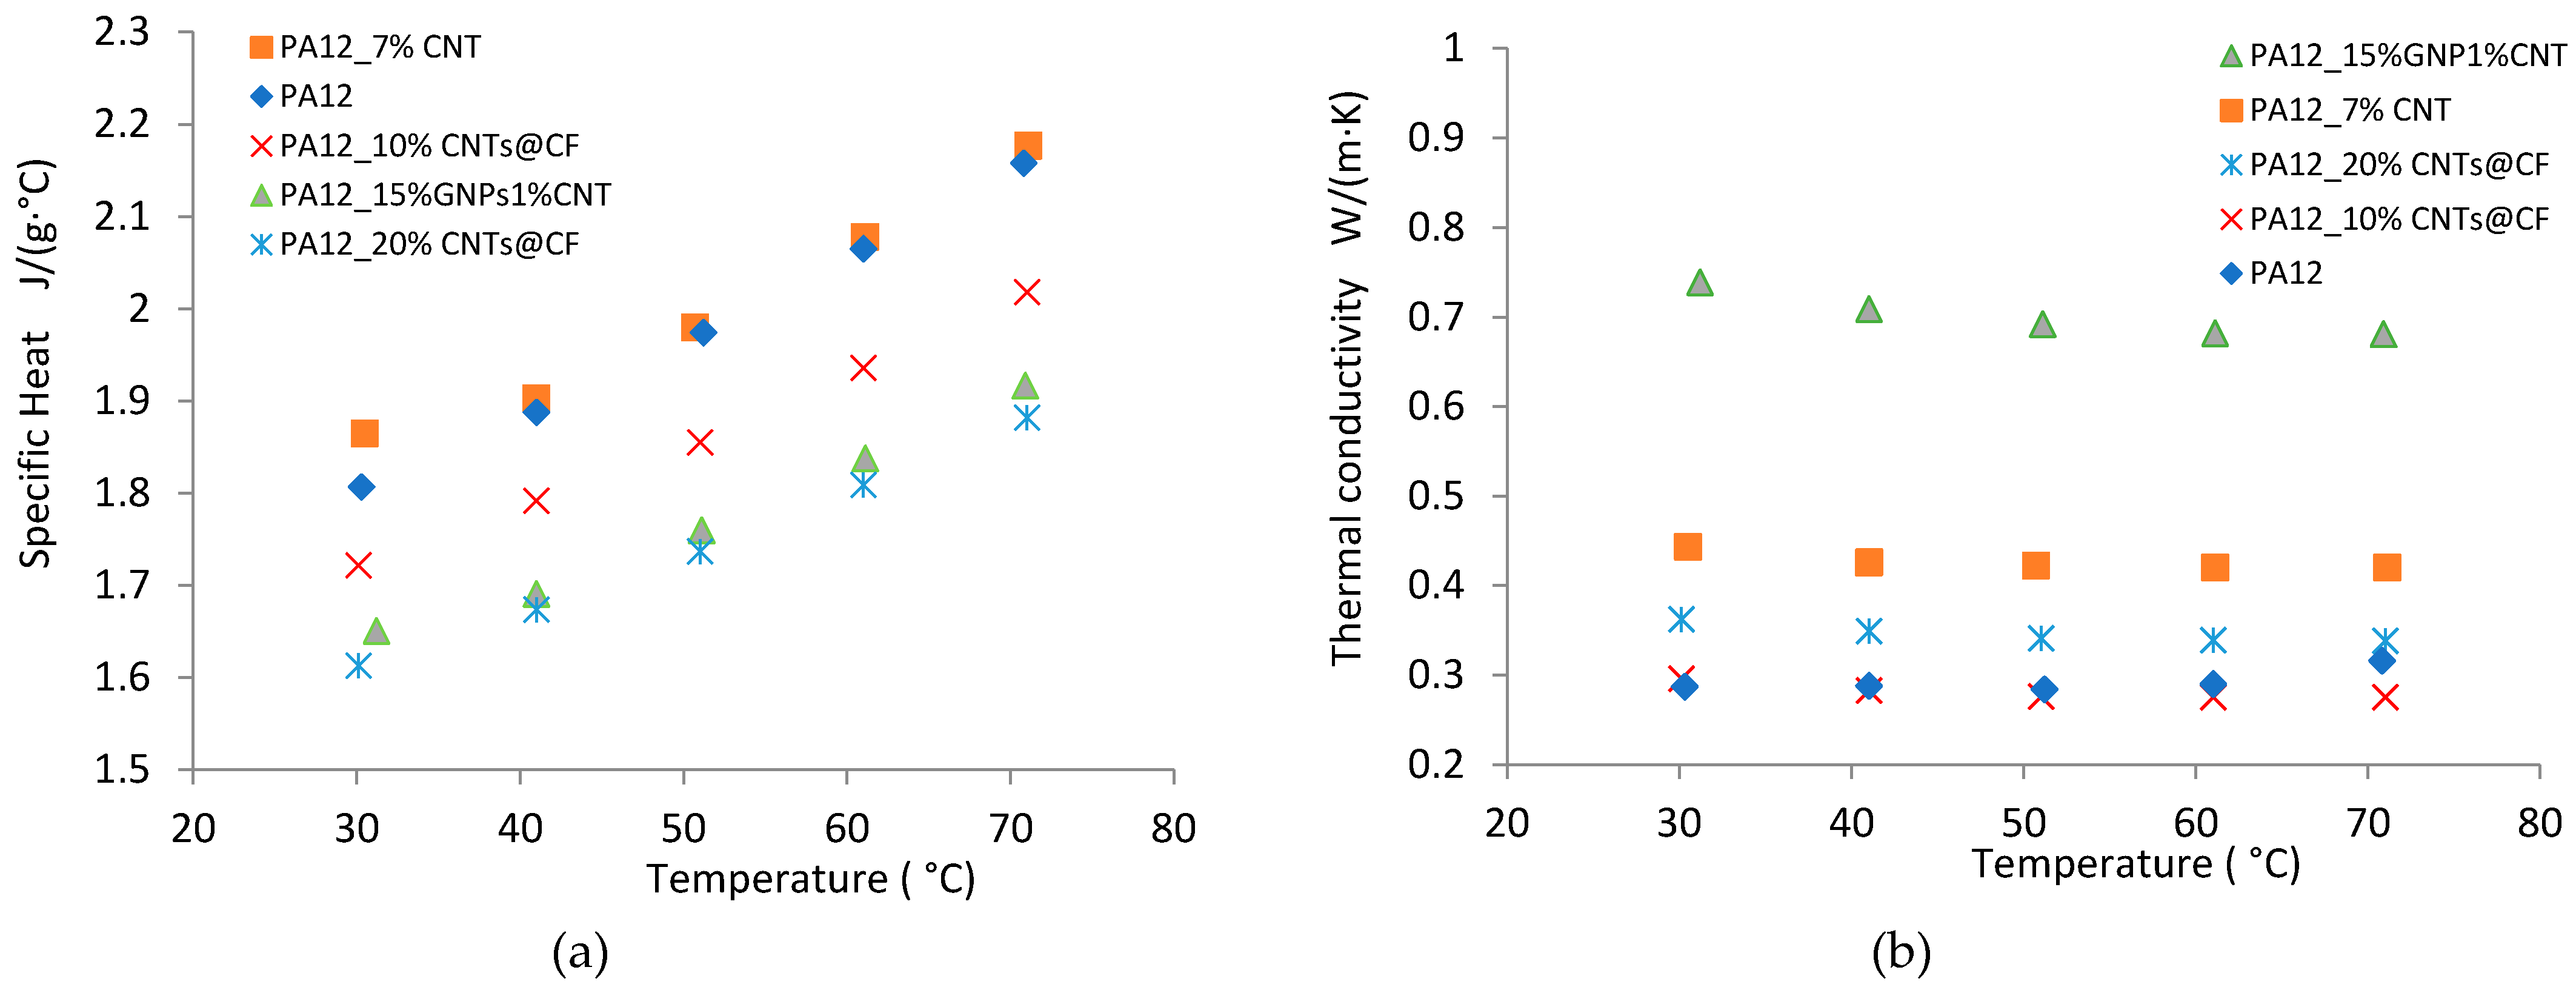
| Sample | Detail | Density (g/cm3) | Thermal Conductivity at 30 °C (W/mk) | Thermal Conductivity Improvement vs. Neat PA12 |
|---|---|---|---|---|
| PA12 | Neat | 1.005 | 0.28 | - |
| PA12_7% CNT | 7 wt% CNTs | 1.124 | 0.44 | 57% |
| PA12_15%GNP1%CNT | 15 wt% GNPs + 1 wt% CNTs | 1.065 | 0.73 | 161% |
| PA12_10%CNT@CFs | 10 wt% CNTs @ CFs | 0.988 | 0.3 | 7% |
| PA12_20%CNT@CFs | 20 wt% CNTs @ CFs | 1.117 | 0.37 | 32% |
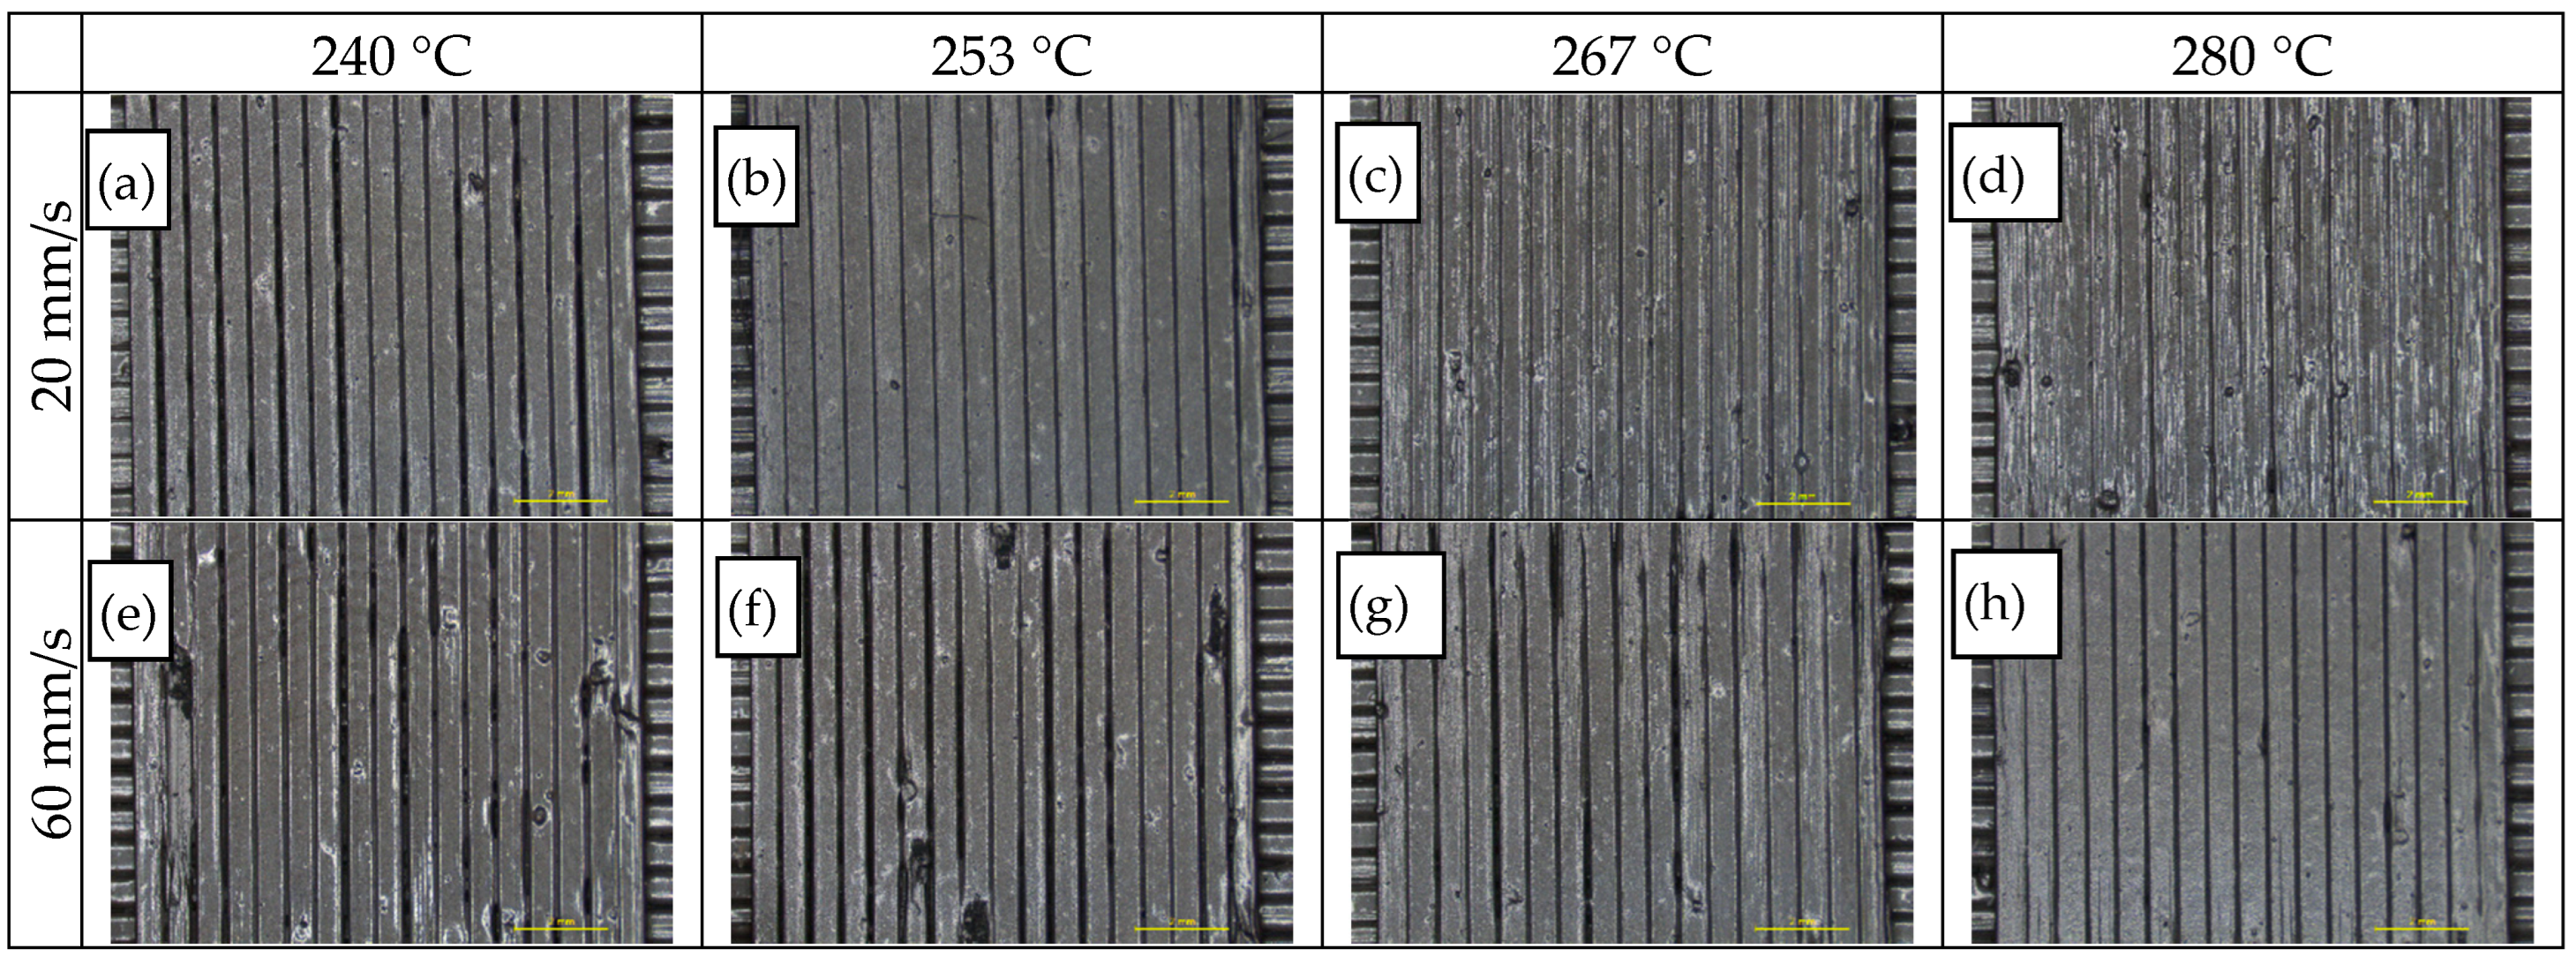
| Extrusion temperature (°C) | 240 | 247 | 253 | 260 | 267 | 273 | 280 |
| Printing speed (mm/s) | 20 | 33 | 47 | 60 | - | - | - |
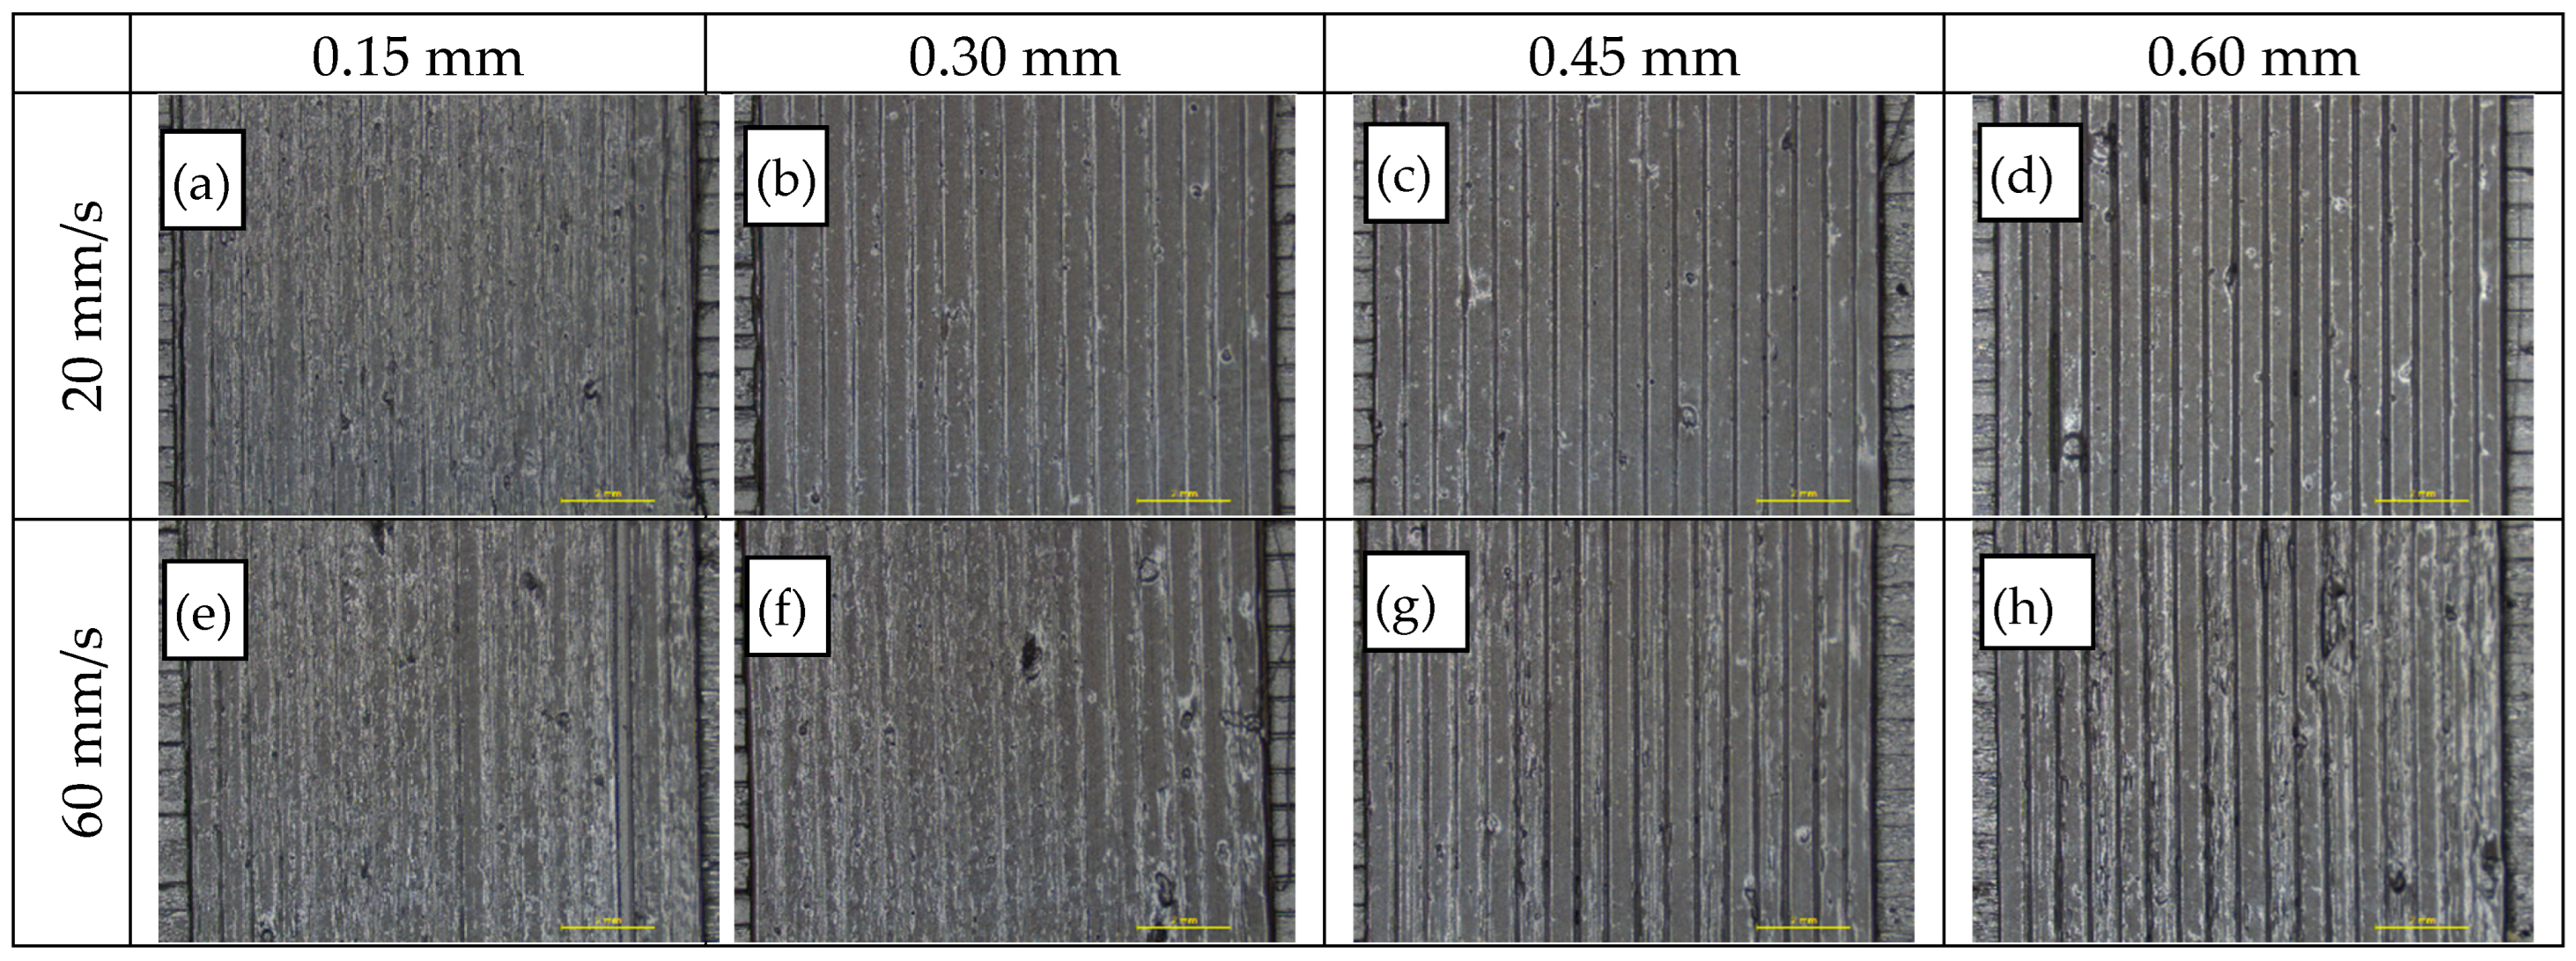
| Strand height (mm) | 0.15 | 0.22 | 0.30 | 0.37 | 0.45 | 0.52 | 0.60 |
| Strand width (mm) | 0.80 | 0.85 | 0.90 | 0.95 | 1.00 | 1.05 | 1.10 |
| Extrusion multiplier | 0.8 | 0.9 | 1.0 | 1.1 | 1.2 | 1.3 | 1.4 |
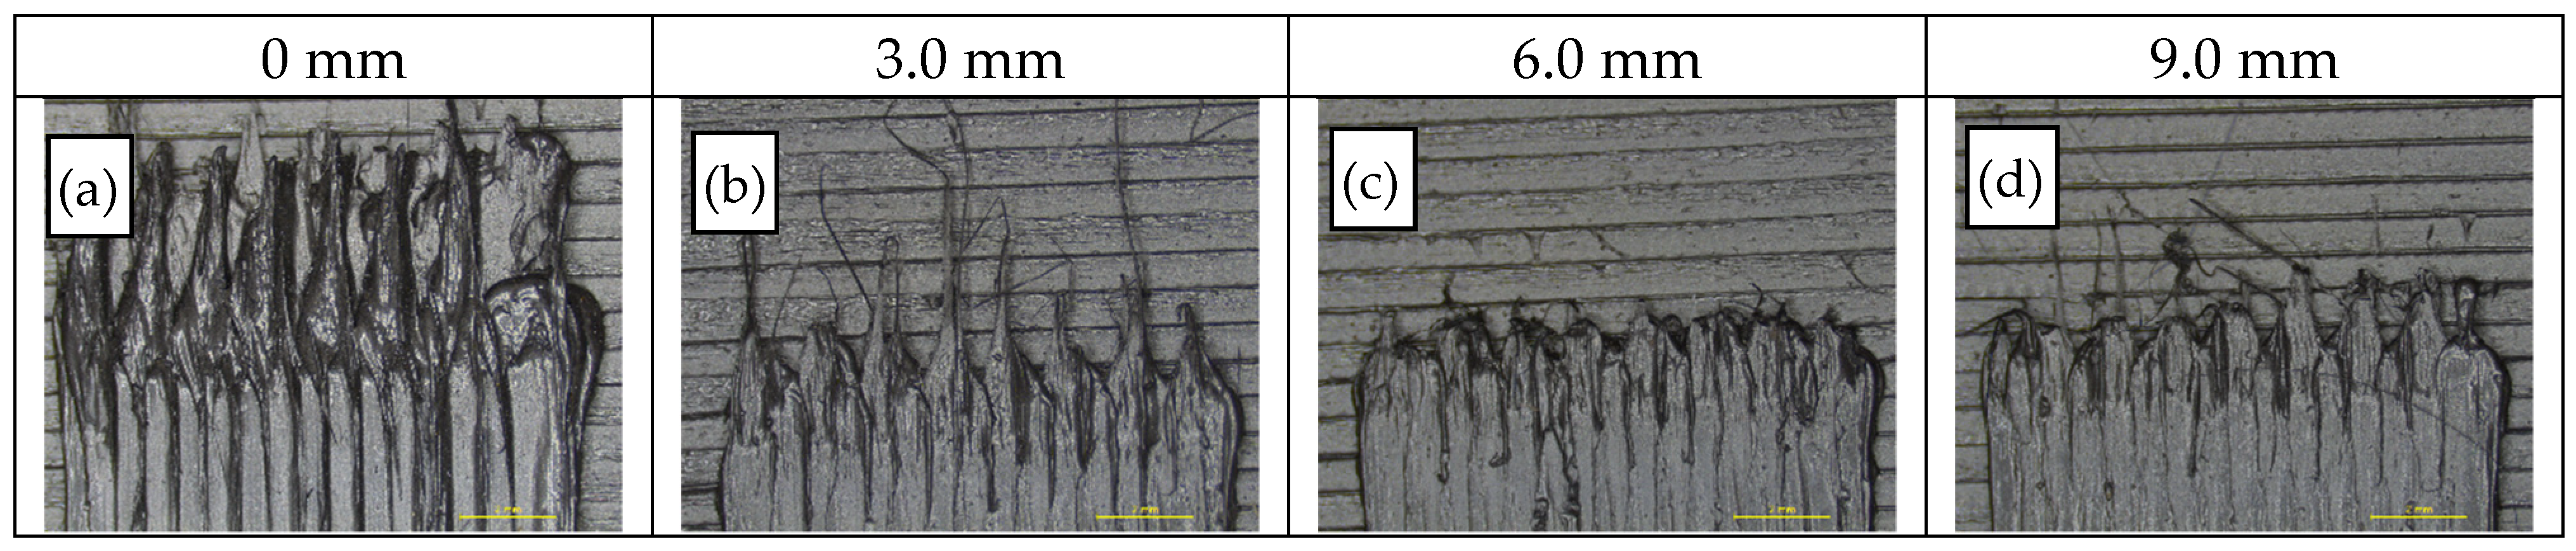
| Retraction distance (mm) | 0 | 1.5 | 3.0 | 4.5 | 6.0 | 7.5 | 9.0 |
Publisher’s Note: MDPI stays neutral with regard to jurisdictional claims in published maps and institutional affiliations. |
© 2022 by the authors. Licensee MDPI, Basel, Switzerland. This article is an open access article distributed under the terms and conditions of the Creative Commons Attribution (CC BY) license (https://creativecommons.org/licenses/by/4.0/).
Share and Cite
Zhang, Z.; Gkartzou, E.; Jestin, S.; Semitekolos, D.; Pappas, P.-N.; Li, X.; Karatza, A.; Zouboulis, P.; Trompeta, A.-F.; Koutroumanis, N.; et al. 3D Printing Processability of a Thermally Conductive Compound Based on Carbon Nanofiller-Modified Thermoplastic Polyamide 12. Polymers 2022, 14, 470. https://doi.org/10.3390/polym14030470
Zhang Z, Gkartzou E, Jestin S, Semitekolos D, Pappas P-N, Li X, Karatza A, Zouboulis P, Trompeta A-F, Koutroumanis N, et al. 3D Printing Processability of a Thermally Conductive Compound Based on Carbon Nanofiller-Modified Thermoplastic Polyamide 12. Polymers. 2022; 14(3):470. https://doi.org/10.3390/polym14030470
Chicago/Turabian StyleZhang, Zhenxue, Eleni Gkartzou, Simon Jestin, Dionisis Semitekolos, Panagiotis-Nektarios Pappas, Xiaoying Li, Anna Karatza, Panagiotis Zouboulis, Aikaterini-Flora Trompeta, Nikolaos Koutroumanis, and et al. 2022. "3D Printing Processability of a Thermally Conductive Compound Based on Carbon Nanofiller-Modified Thermoplastic Polyamide 12" Polymers 14, no. 3: 470. https://doi.org/10.3390/polym14030470