
Shear Strength of Repaired 3D-Printed and Milled Provisional Materials Using Different Resin Materials with and without Chemical and Mechanical Surface Treatment

 , , ,
, , ,
Abstract
:1. Introduction
2. Material and Methods
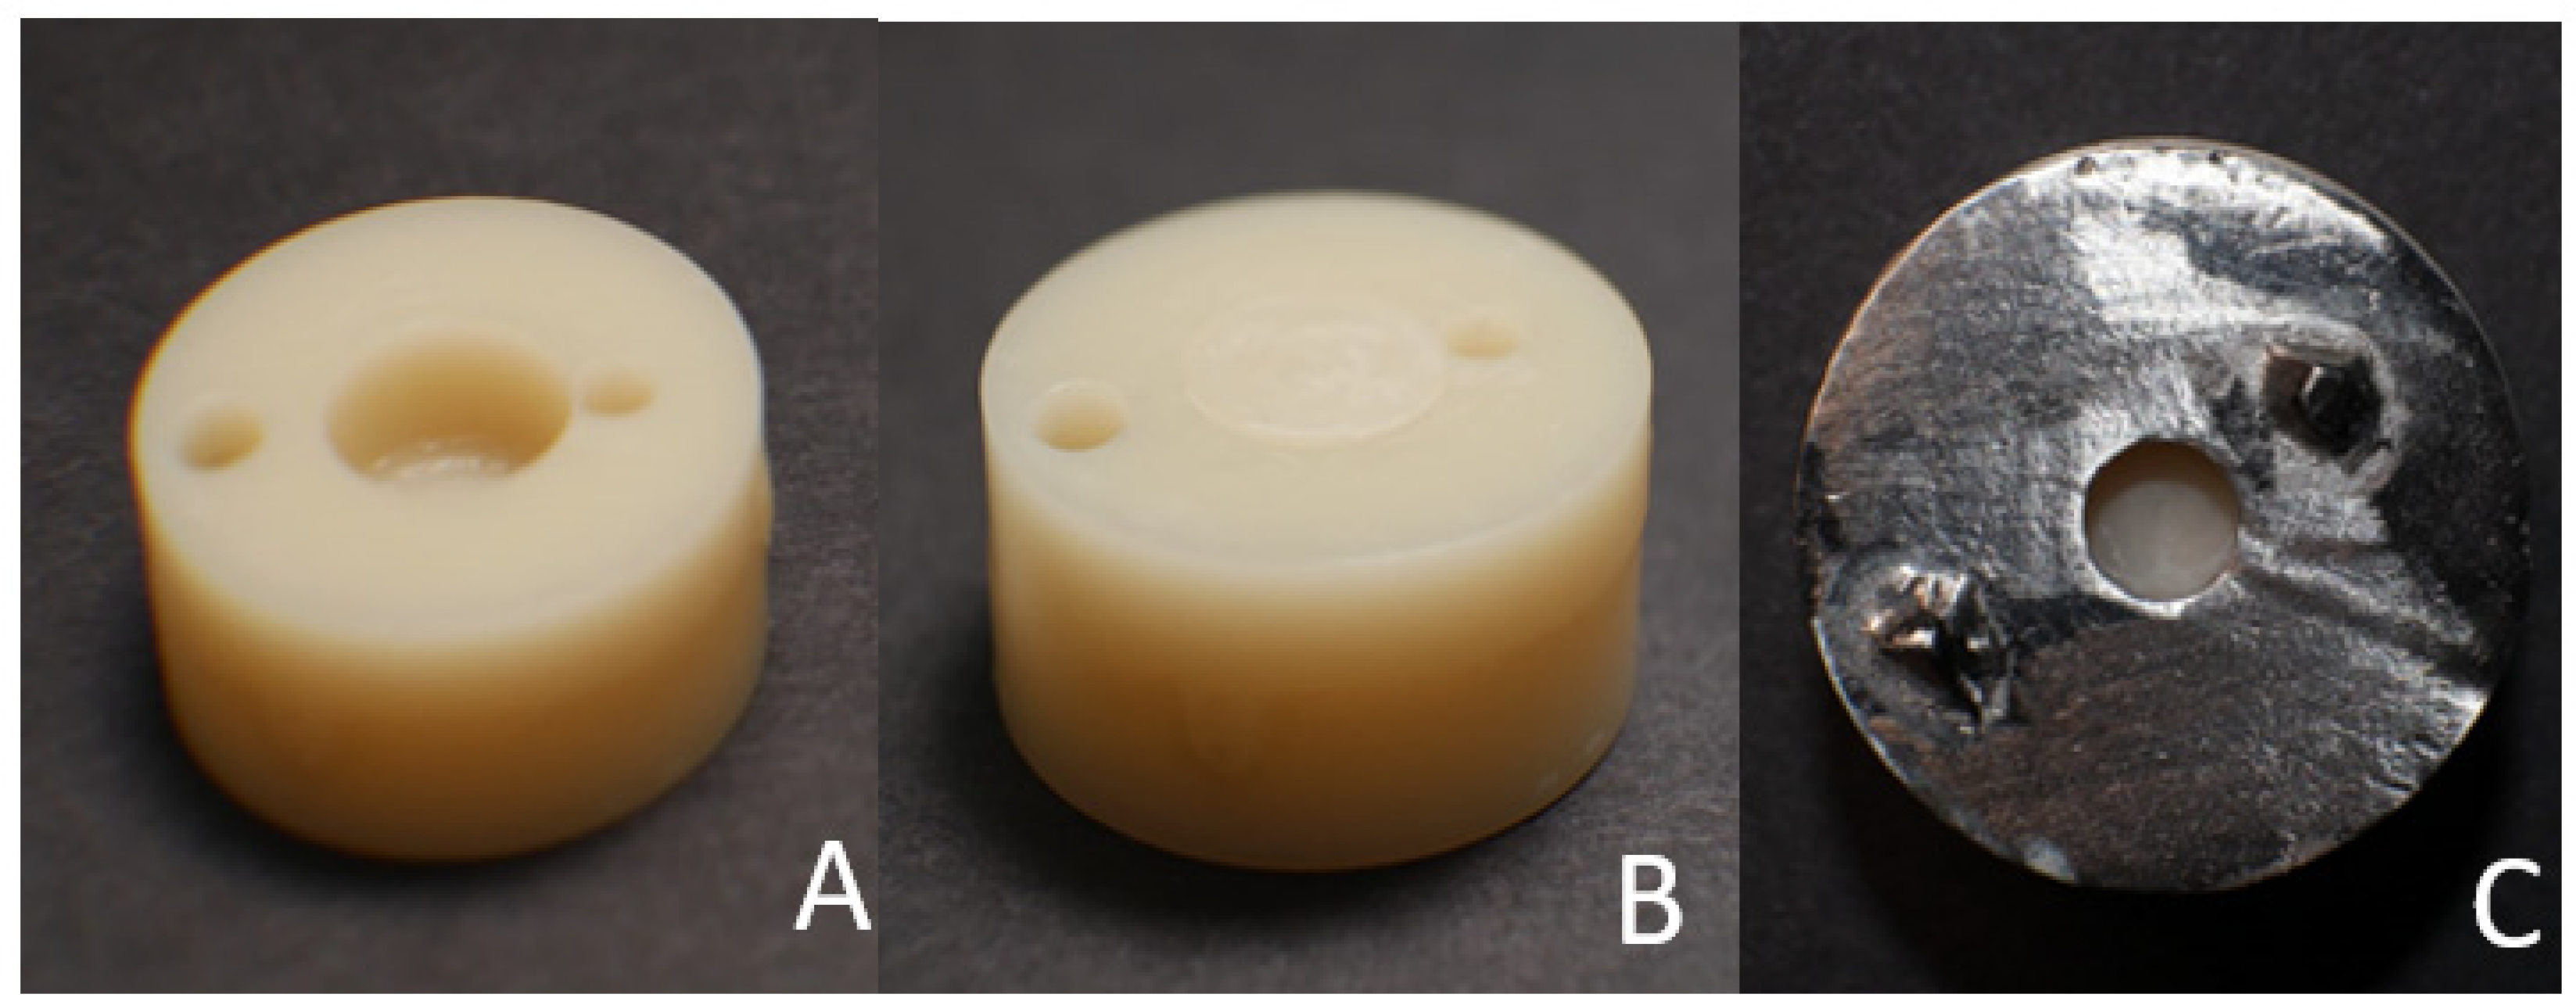
2.1. Base Cylinder Preparation
2.2. Groups Distribution
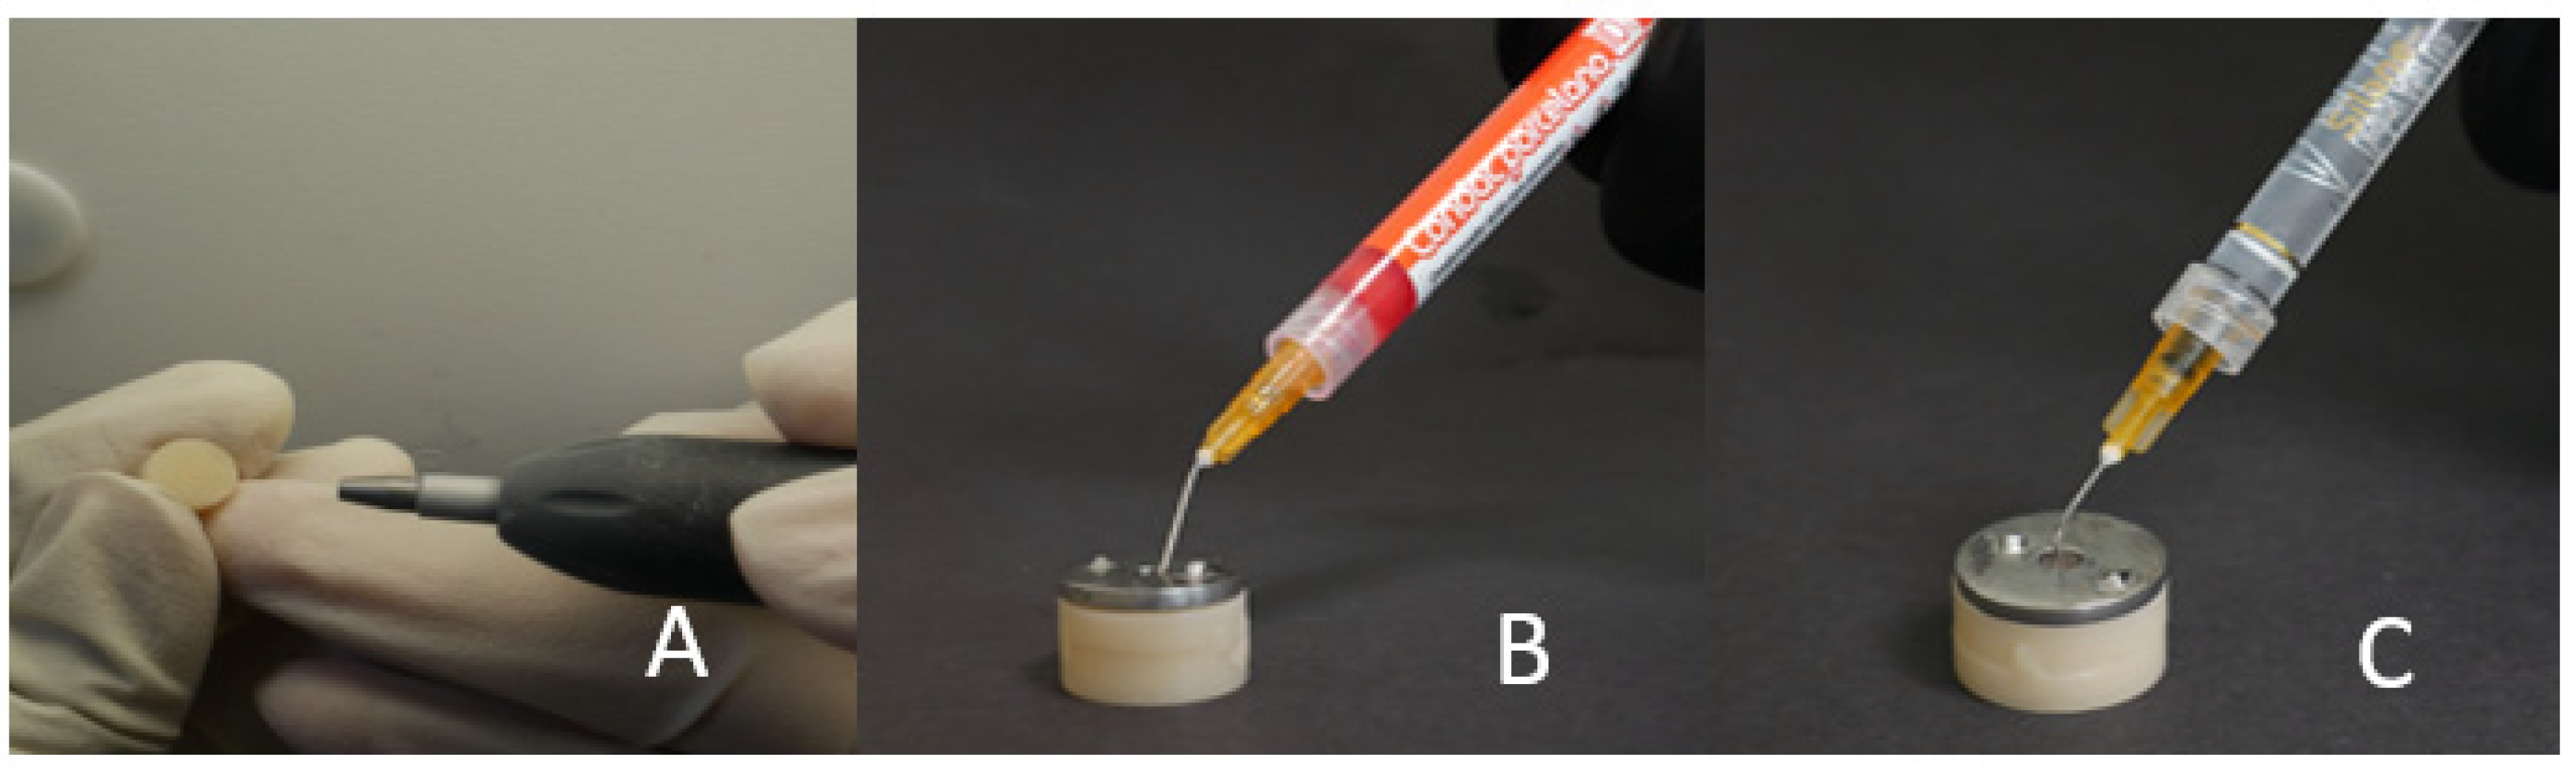
2.3. Sample Completion by Adding Composite/PMMA Repair Material
2.3.1. Groups MC and PC
2.3.2. Groups MP and PP
2.3.3. Groups MCA and PCA
2.3.4. Groups MCE and PCE
2.3.5. Groups MCC and PCC
2.3.6. Groups MPA and PPA
2.3.7. Groups MPE and PPE
2.3.8. Groups MPC and PPC
2.3.9. Positive Control
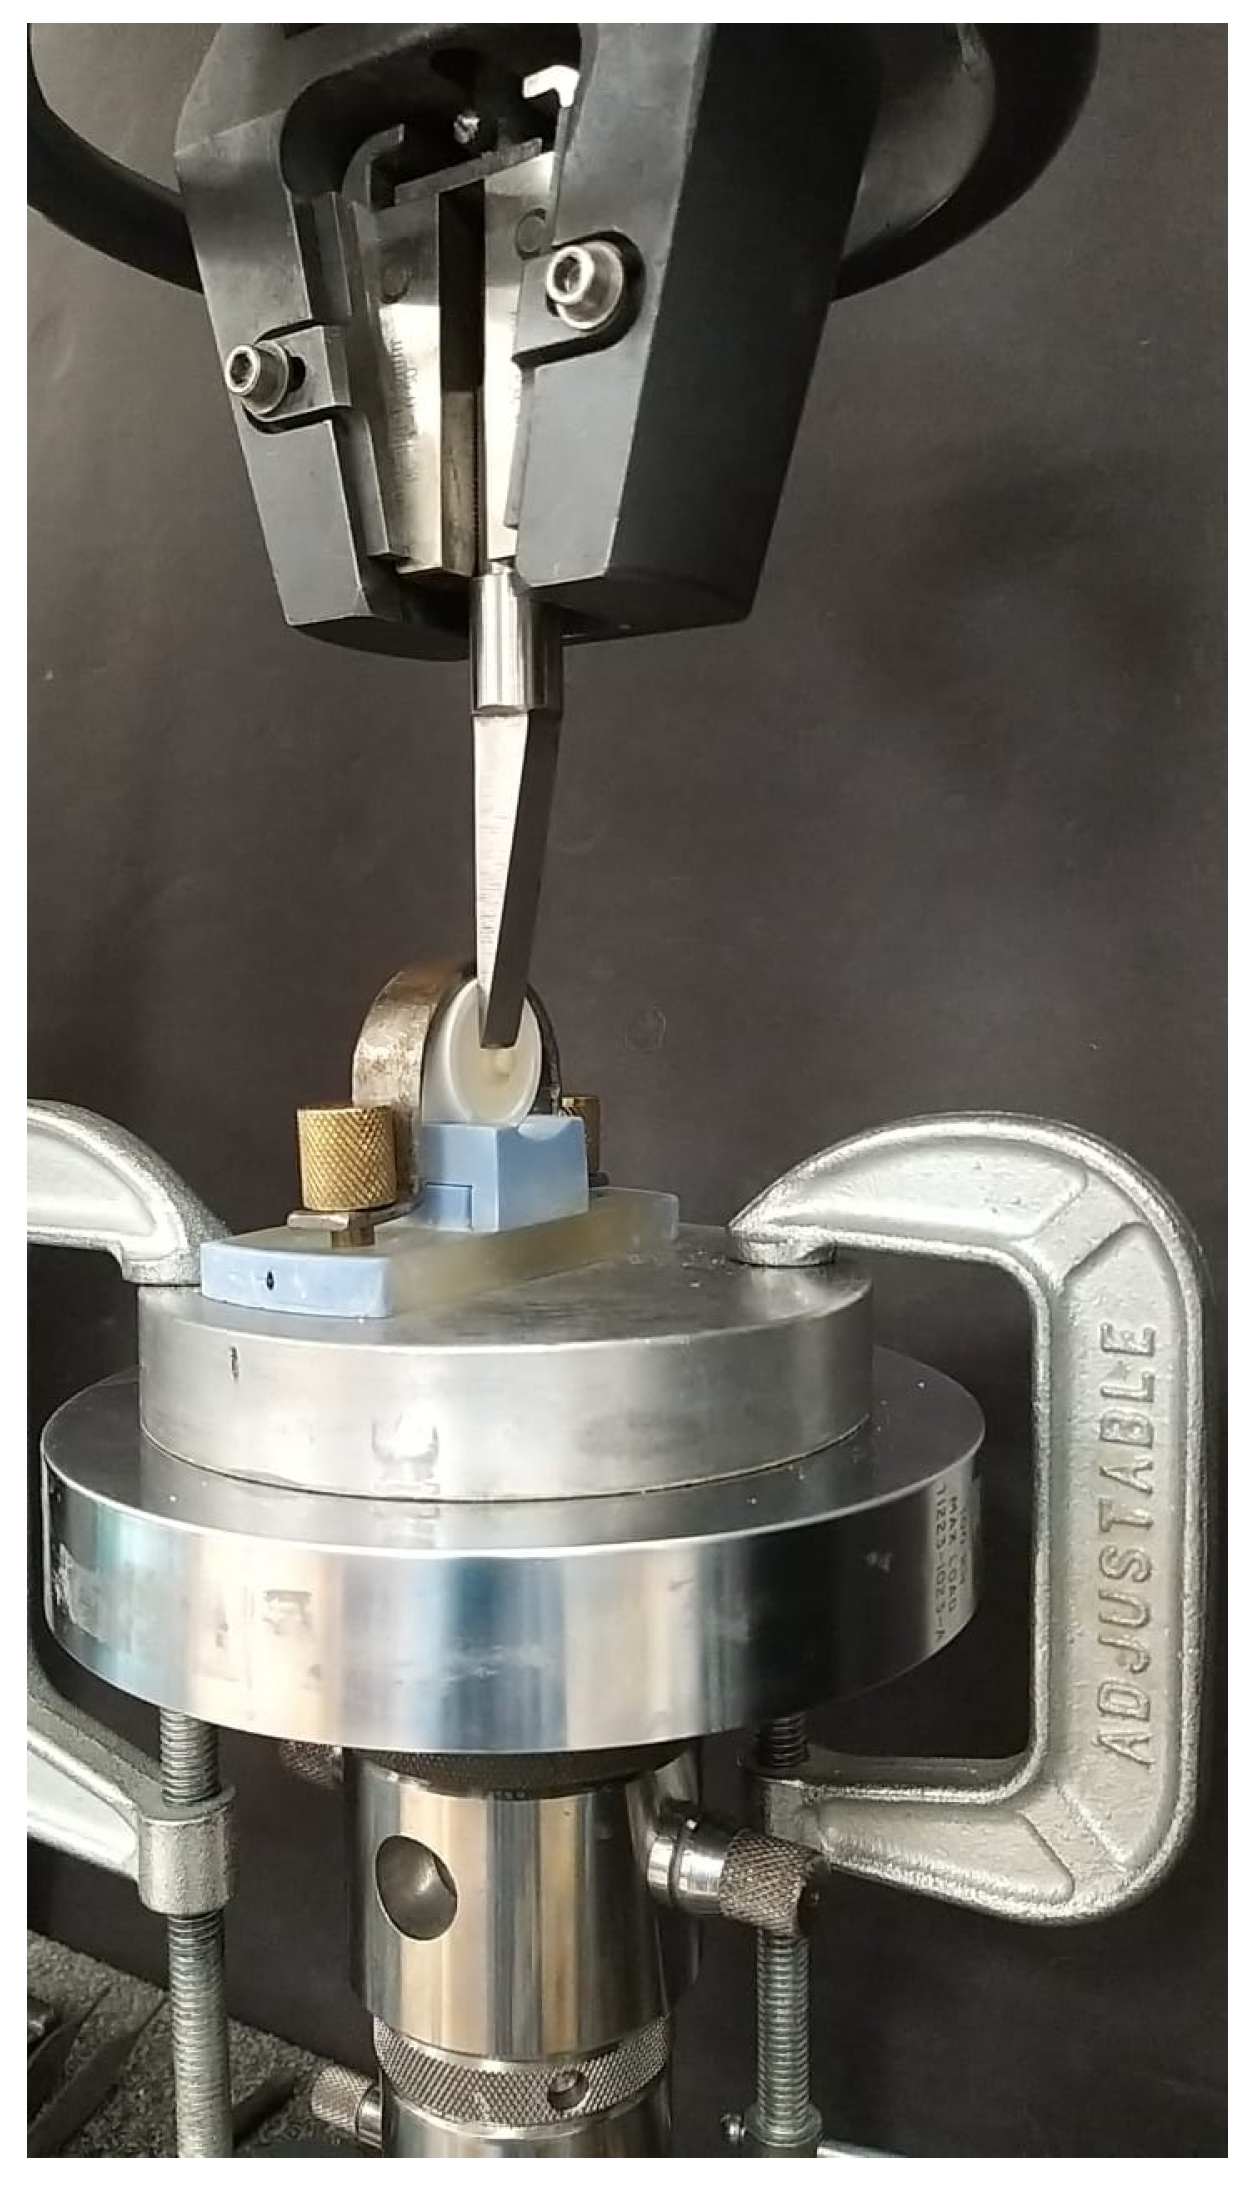
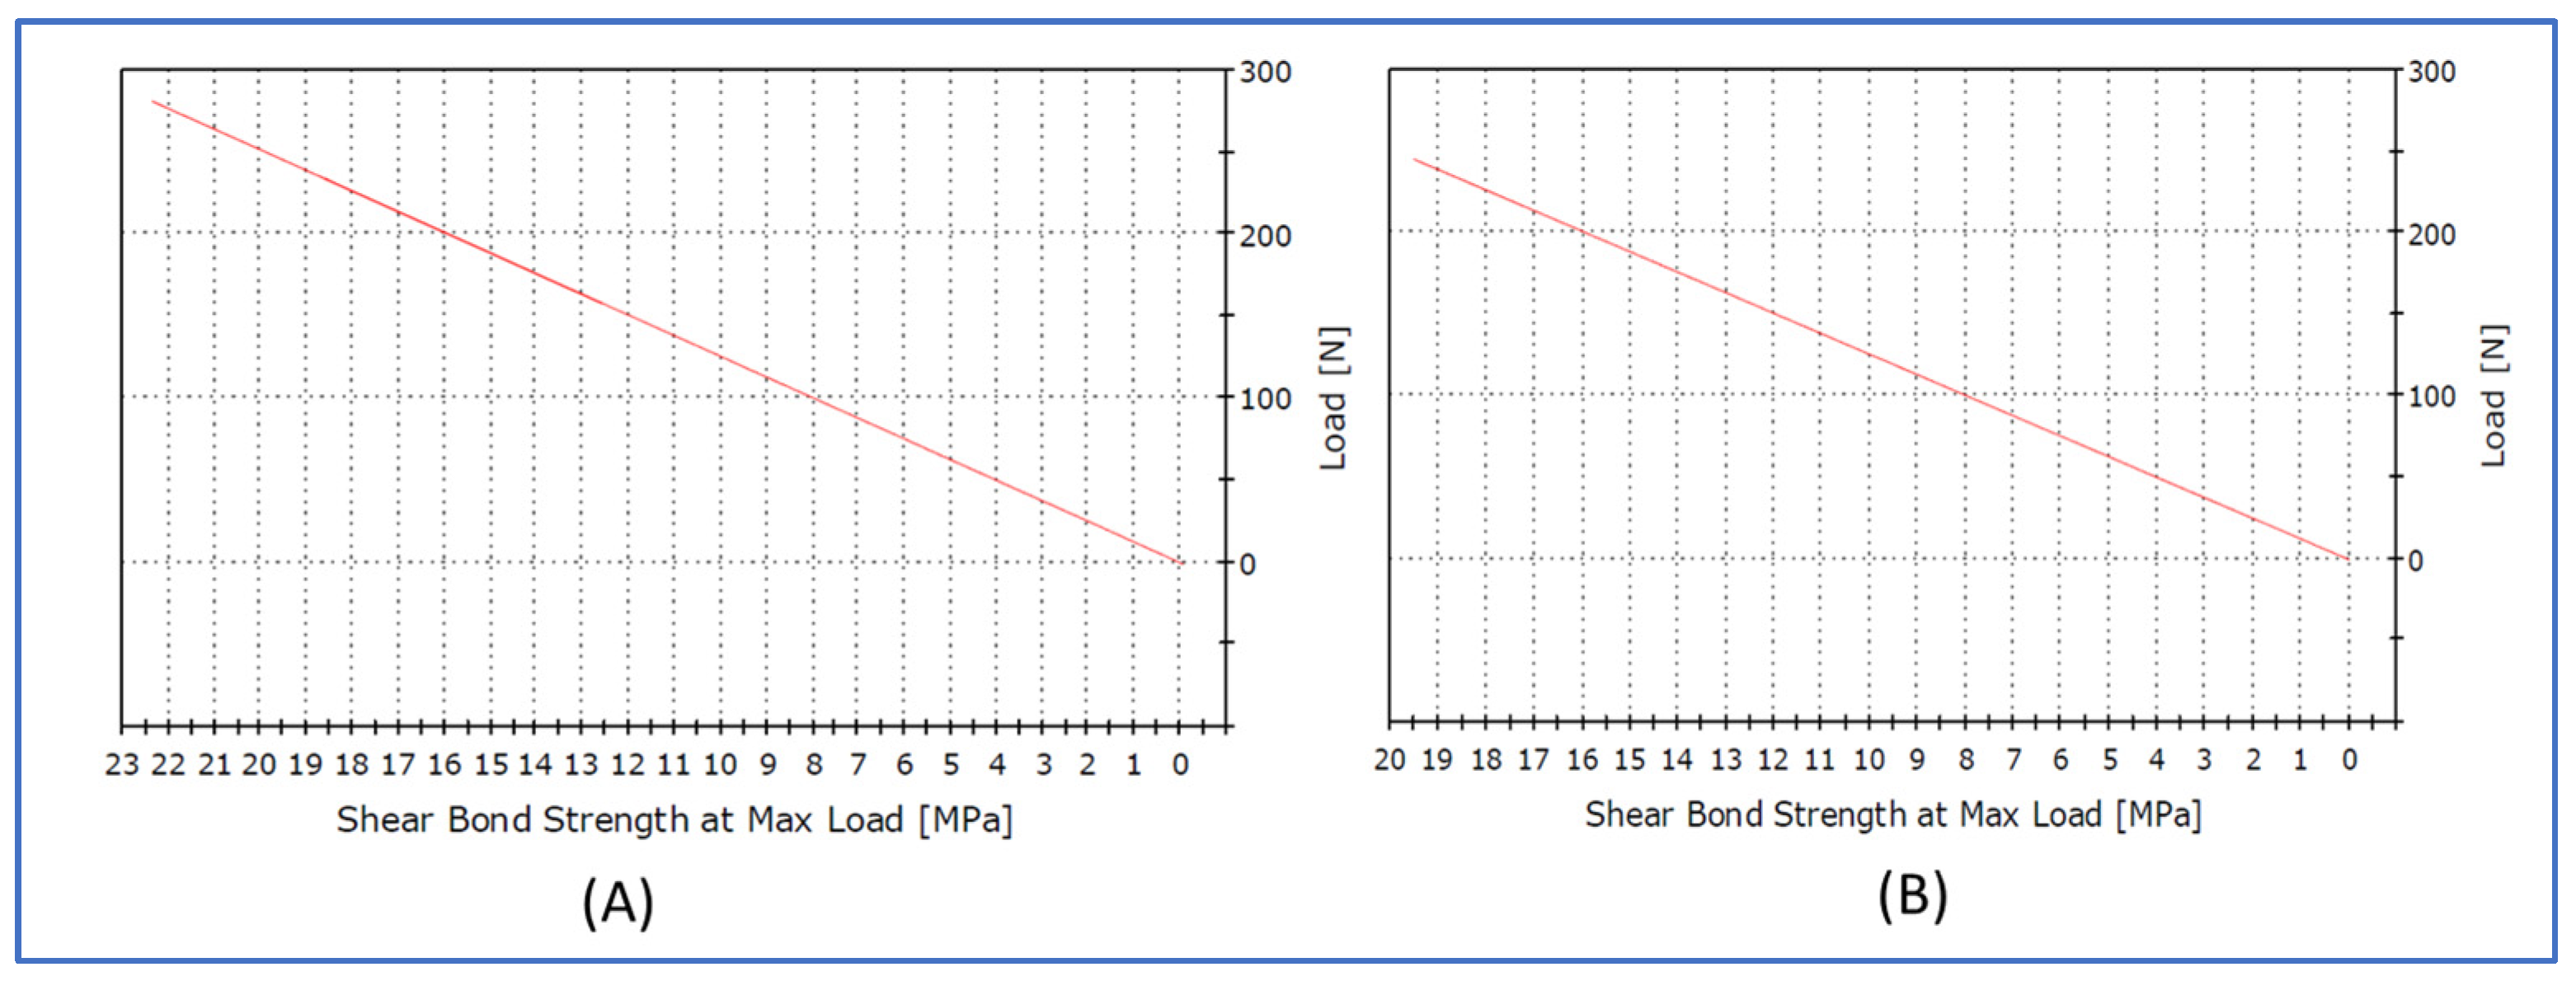
2.4. Shear Bond Strength Test
2.5. Statistical Analysis
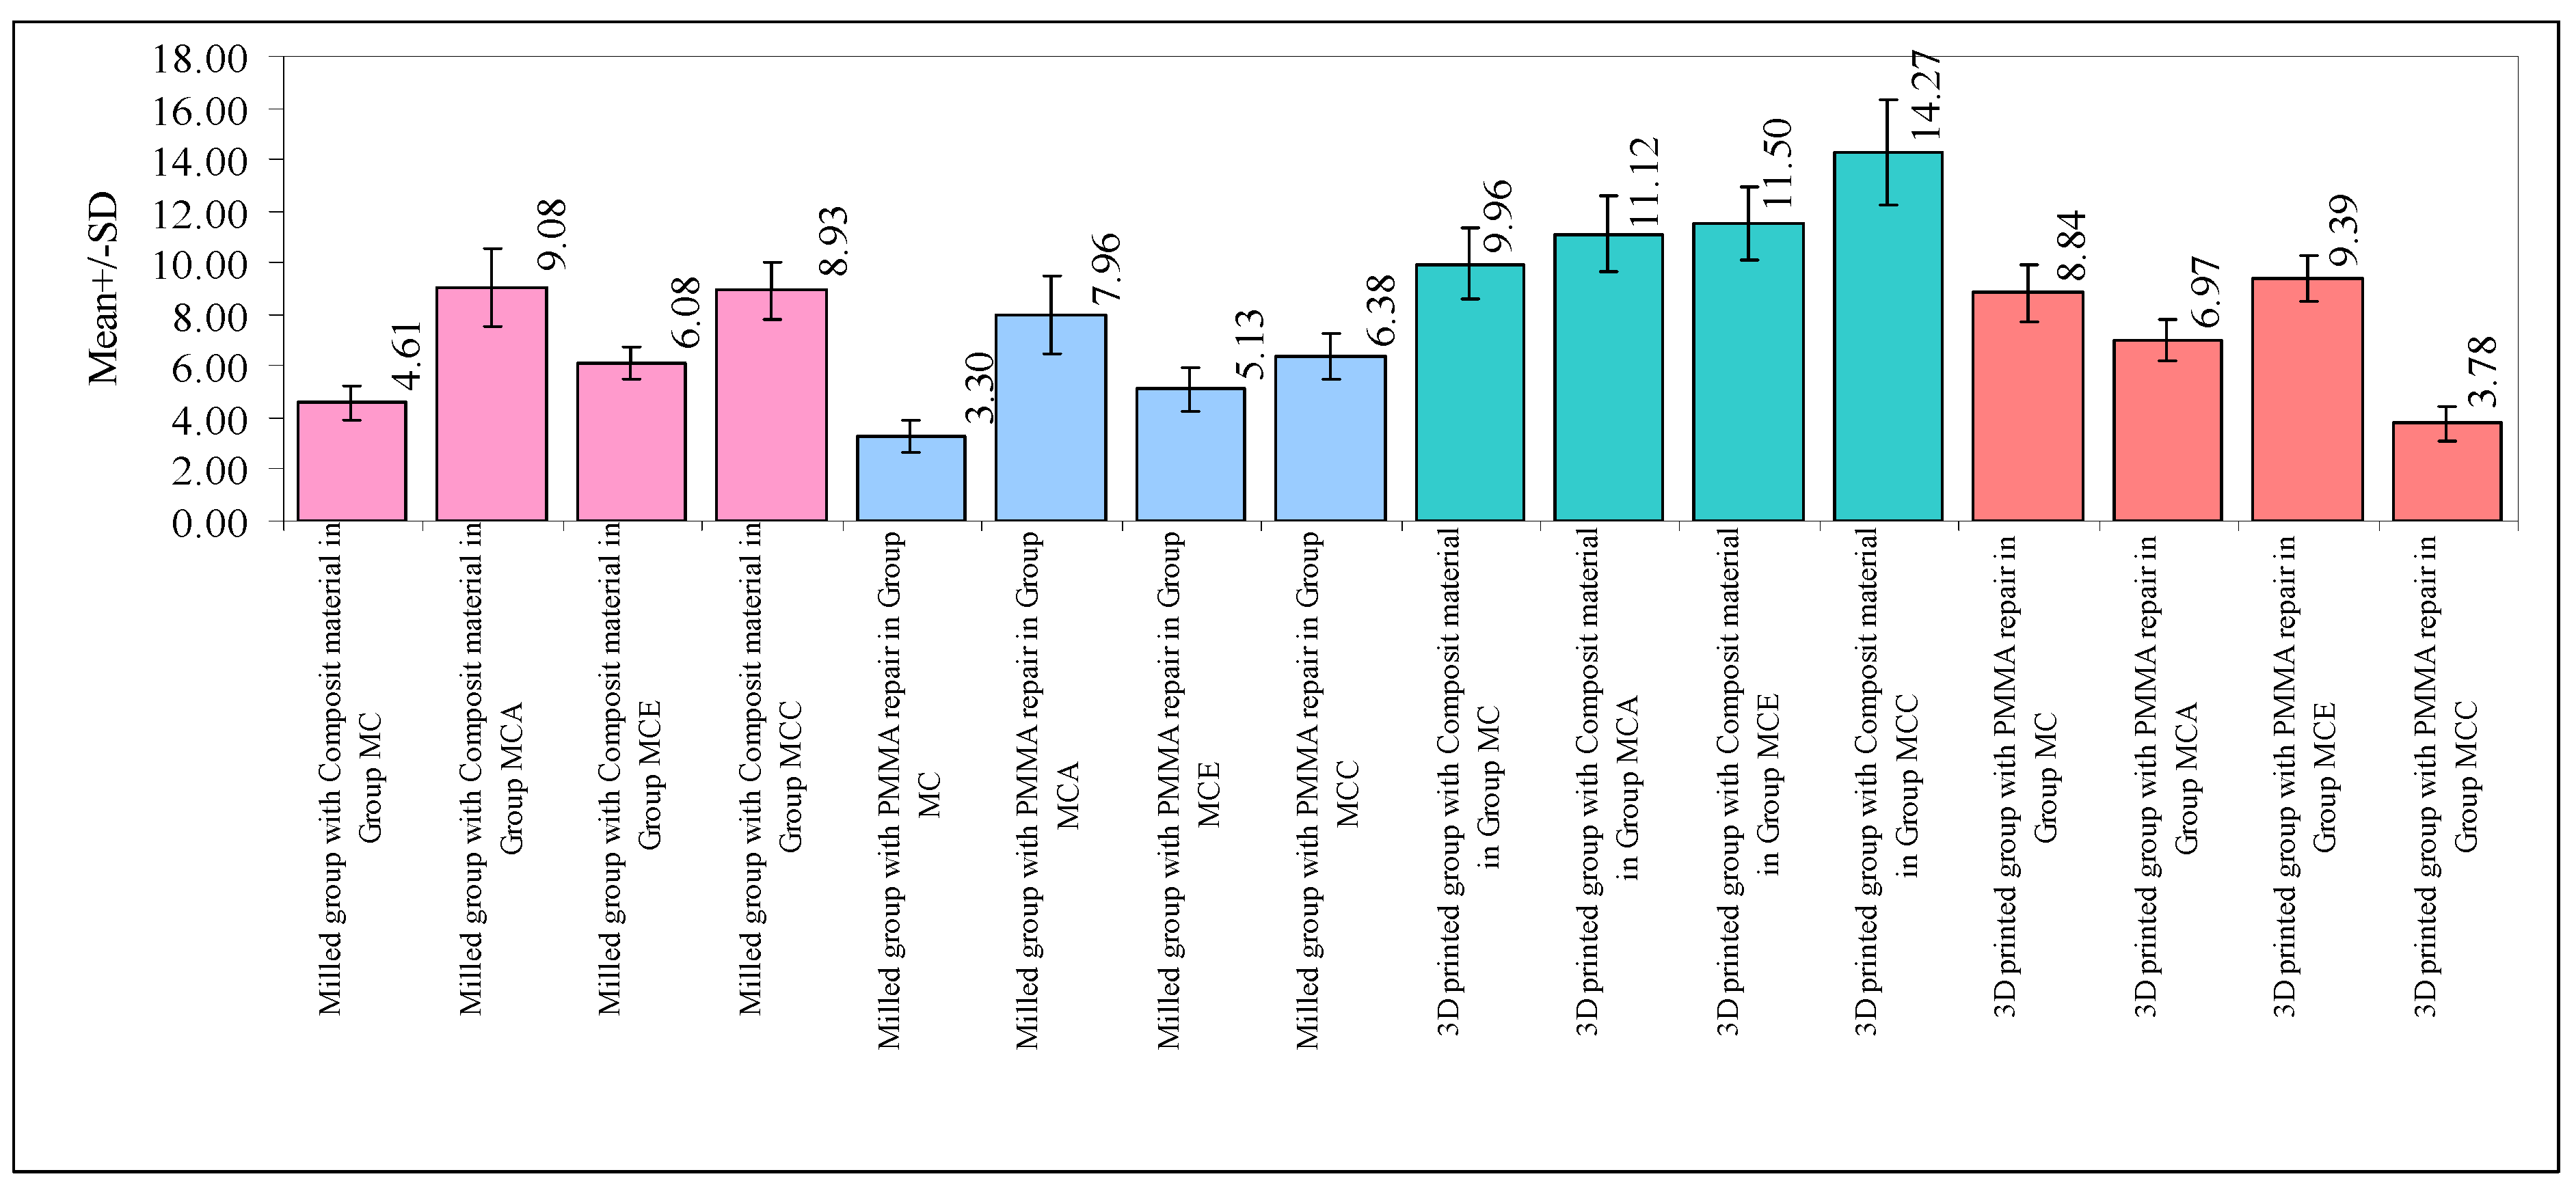
3. Results
4. Discussion
5. Conclusions
Author Contributions
Funding
Institutional Review Board Statement
Data Availability Statement
Conflicts of Interest
References
- Maló, P.; de Araújo Nobre, M.; Lopes, A.; Francischone, C.; Rigolizzo, M. “All-on-4” immediate-function concept for completely edentulous maxillae: A clinical report on the medium (3 years) and long-term (5 years) outcomes. Clin. Implant Dent. Relat. Res. 2012, 14 (Suppl. S1), e139–e150. [Google Scholar] [CrossRef] [PubMed]
- Mizrahi, B. Temporary restorations: The key to success. Br. Dent. J. 2019, 226, 761–768. [Google Scholar] [CrossRef] [PubMed]
- Regish, K.M.; Sharma, D.; Prithviraj, D.R. Techniques of fabrication of provisional restoration: An overview. Int. J. Dent. 2011, 2011, 134659. [Google Scholar] [CrossRef] [PubMed]
- Holst, S.; Geiselhoeringer, H.; Wichmann, M.; Holst, A.I. The effect of provisional restoration type on micromovement of implants. J. Prosthet. Dent. 2008, 100, 173–182. [Google Scholar] [CrossRef] [PubMed]
- Att, W.; Kurun, S.; Gerds, T.; Strub, J.R. Fracture resistance of single-tooth implant-supported all-ceramic restorations: An in vitro study. J. Prosthet. Dent. 2006, 95, 111–116. [Google Scholar] [CrossRef] [PubMed]
- Pieralli, S.; Kohal, R.J.; Jung, R.E.; Vach, K.; Spies, B.C. Clinical Outcomes of Zirconia Dental Implants: A Systematic Review. J. Dent. Res. 2017, 96, 38–46. [Google Scholar] [CrossRef]
- Tinschert, J.; Natt, G.; Mautsch, W.; Augthun, M.; Spiekermann, H. Fracture resistance of lithium disilicate-, alumina-, and zirconia-based three-unit fixed partial dentures: A laboratory study. Int. J. Prosthodont. 2001, 14, 231–238. [Google Scholar]
- Davoodi, E.; Montazerian, H.; Mirhakimi, A.S.; Zhianmanesh, M.; Ibhadode, O.; Shahabad, S.I.; Esmaeilizadeh, R.; Sarikhani, E.; Toorandaz, S.; Sarabi, S.A.; et al. Additively manufactured metallic biomaterials. Bioact. Mater. 2022, 15, 214–249. [Google Scholar] [CrossRef]
- Ma, L.; Guess, P.C.; Zhang, Y. Load-bearing properties of minimal-invasive monolithic lithium disilicate and zirconia occlusal onlays: Finite element and theoretical analyses. Dent. Mater. Off. Publ. Acad. Dent. Mater. 2013, 29, 742–751. [Google Scholar] [CrossRef]
- Grachev, D.I.; Chizhmakov, E.A.; Stepanov, D.Y.; Buslovich, D.G.; Khulaev, I.V.; Deshev, A.V.; Kirakosyan, L.G.; Arutyunov, A.S.; Kardanova, S.Y.; Panin, K.S.; et al. Dental Material Selection for the Additive Manufacturing of Removable Complete Dentures (RCD). Int. J. Mol. Sci. 2023, 24, 6432. [Google Scholar] [CrossRef]
- Bajraktarova-Valjakova, E.; Korunoska-Stevkovska, V.; Kapusevska, B.; Gigovski, N.; Bajraktarova-Misevska, C.; Grozdanov, A. Contemporary Dental Ceramic Materials, A Review: Chemical Composition, Physical and Mechanical Properties, Indications for Use. Open Access Maced. J. Med. Sci. 2018, 6, 1742–1755. [Google Scholar] [CrossRef]
- Alharbi, N.; Osman, R.; Wismeijer, D. Effects of build direction on the mechanical properties of 3D-printed complete coverage interim dental restorations. J. Prosthet. Dent. 2016, 115, 760–767. [Google Scholar] [CrossRef] [PubMed]
- Salmi, M.; Paloheimo, K.-S.; Tuomi, J.; Wolff, J.; Mäkitie, A. Accuracy of medical models made by additive manufacturing (rapid manufacturing). J. Cranio-Maxillo-Facial Surg. Off. Publ. Eur. Assoc. Cranio-Maxillo-Facial Surg. 2013, 41, 603–609. [Google Scholar] [CrossRef] [PubMed]
- Abdelfattah Mohamed, A.M.; El Homossany, M.E.-M.B.; Abdelmoniem, S.M.; Abdelrahman, T.Y. Comparison of tensile bond strength of ball attachments made of different materials to root canal dentin after chewing simulation. BMC Oral Health 2022, 22, 254. [Google Scholar] [CrossRef] [PubMed]
- Klaiber, D.; Spintzyk, S.; Geis-Gerstorfer, J.; Klink, A.; Unkovskiy, A.; Huettig, F. Bonding Behavior of Conventional PMMA towards Industrial CAD/CAM PMMA and Artificial Resin Teeth for Complete Denture Manufacturing in a Digital Workflow. Materials 2021, 14, 3822. [Google Scholar] [CrossRef]
- Barutcigil, K.; Barutcigil, Ç.; Kul, E.; Özarslan, M.M.; Buyukkaplan, U.S. Effect of Different Surface Treatments on Bond Strength of Resin Cement to a CAD/CAM Restorative Material. J. Prosthodont. Off. J. Am. Coll. Prosthodont. 2019, 28, 71–78. [Google Scholar] [CrossRef]
- Bishara, S.E.; Laffoon, J.F.; Vonwald, L.; Warren, J.J. The effect of repeated bonding on the shear bond strength of different orthodontic adhesives. Am. J. Orthod. Dentofac. Orthop. Off. Publ. Am. Assoc. Orthod. Its Const. Soc. Am. Board Orthod. 2002, 121, 521–525. [Google Scholar] [CrossRef]
- Watts, D.C.; Issa, M.; Ibrahim, A.; Wakiaga, J.; Al-Samadani, K.; Al-Azraqi, M.; Silikas, N. Edge strength of resin-composite margins. Dent. Mater. Off. Publ. Acad. Dent. Mater. 2008, 24, 129–133. [Google Scholar] [CrossRef]
- Lee, K.-S.; Shin, M.-S.; Lee, J.-Y.; Ryu, J.-J.; Shin, S.-W. Shear bond strength of composite resin to high performance polymer PEKK according to surface treatments and bonding materials. J. Adv. Prosthodont. 2017, 9, 350–357. [Google Scholar] [CrossRef]
- Ruwaida, Z.A.; Dalea, M.B.; Mohammed, A.A.; Naflaa, O.A.; Abeer, H.A.; Hayam, A.A. Repair of temporary fixed dental prostheses using a flowable resin composite: Effect of material, bonding, and aging. Saudi Dent. J. 2021, 33, 495–502. [Google Scholar]
- Alizadeh Oskoee, P.; Kimyai, S.; Talatahari, E.; Rikhtegaran, S.; Pournaghi-Azar, F.; Sajadi Oskoee, J. Effect of Mechanical Surface Treatment on the Repair Bond Strength of the Silorane-based Composite Resin. J. Dent. Res. Dent. Clin. Dent. Prospect. 2014, 8, 61–66. [Google Scholar] [CrossRef]
- Jain, S.; Sayed, M.E.; Shetty, M.; Alqahtani, S.M.; Al Wadei, M.H.D.; Gupta, S.G.; Othman, A.A.A.; Alshehri, A.H.; Alqarni, H.; Mobarki, A.H.; et al. Physical and Mechanical Properties of 3D-Printed Provisional Crowns and Fixed Dental Prosthesis Resins Compared to CAD/CAM Milled and Conventional Provisional Resins: A Systematic Review and Meta-Analysis. Polymers 2022, 14, 2691. [Google Scholar] [CrossRef]
- Ibrahim, A.; Shehawy, D.E.; El-Naggar, G. Fracture resistance of interim restoration constructed by 3D printing versus CAD/CAM technique (in vitro study). Ain Shams Dent. J. 2020, 23, 13–20. [Google Scholar]
- Tahayeri, A.; Morgan, M.; Fugolin, A.P.; Bompolaki, D.; Athirasala, A.; Pfeifer, C.S.; Ferracane, J.L.; Bertassoni, L.E. 3D printed versus conventionally cured provisional crown and bridge dental materials. Dent. Mater. 2018, 34, 192–200. [Google Scholar] [CrossRef]
- Reymus, M.; Fabritius, R.; Keßler, A.; Hickel, R.; Edelhoff, D.; Stawarczyk, B. Fracture load of 3D-printed fixed dental pros-theses compared with milled and conventionally fabricated ones: The impact of resin material, build direction, post-curing, and artificial aging-an in vitro study. Clin. Oral Investig. 2020, 24, 701–710. [Google Scholar] [CrossRef] [PubMed]
- Mugri, M.H.; Dewan, H.; Sayed, M.E.; Shaabi, F.I.; Hakami, H.I.; Jokhadar, H.F.; Alqahtani, N.M.; Alshahrani, A.A.; Alabdullah, A.S.; Alshehri, A.H.; et al. The Effect of a Digital Manufacturing Technique, Preparation Taper, and Finish Line Design on the Marginal Fit of Temporary Molar Crowns: An In vitro Study. Biomedicines 2023, 11, 570. [Google Scholar] [CrossRef] [PubMed]
- Dewan, H. Clinical Effectiveness of 3D-Milled and 3D-Printed Zirconia Prosthesis—A Systematic Review and Meta-Analysis. Biomimetics 2023, 8, 394. [Google Scholar] [CrossRef]
- Hamouda, I.M.; Shehata, S.H. Fracture resistance of posterior teeth restored with modern restorative materials. J. Biomed. Res. 2011, 25, 418–424. [Google Scholar] [CrossRef] [PubMed]
- Demarco, F.F.; Corrêa, M.B.; Cenci, M.S.; Moraes, R.R.; Opdam, N.J.M. Longevity of posterior composite restorations: Not only a matter of materials. Dent. Mater. Off. Publ. Acad. Dent. Mater. 2012, 28, 87–101. [Google Scholar] [CrossRef]


| Machines/Materials | Manufacturer | Composition | Lot No./Model No. |
|---|---|---|---|
| Five-axis milling machine | DG SHAPE, Roland DGA, Irvine, CA, USA | DWX-52D | |
| 3D-printing material | Asiga Pvt Ltd., Alexandria, Australia | 7,7,9(or 7,9,9)-trimethyl-4,13-dioxo-3,14-dioxa-5,12-diazahexadecane-1,16-diyl bismethacrylate, tetrahydrofurfuryl methacrylate, diphenyl(2,4,6-trimethylbenzoyl) phosphine oxide | MO/16020 |
| 3D-printing machine | Asiga 3D printer, Alexandria, Australia | PN01233 | |
| Copra temp | WhitePeaks Dental Solutions GmbH, Wesel, Germany | PMMA (polymethylmethacrylate)/pigments | P10690 |
| Korox 250 | BEGO East Coast, New England, Northeastern USA | Aluminum oxide particles 250 µm | 1825064 |
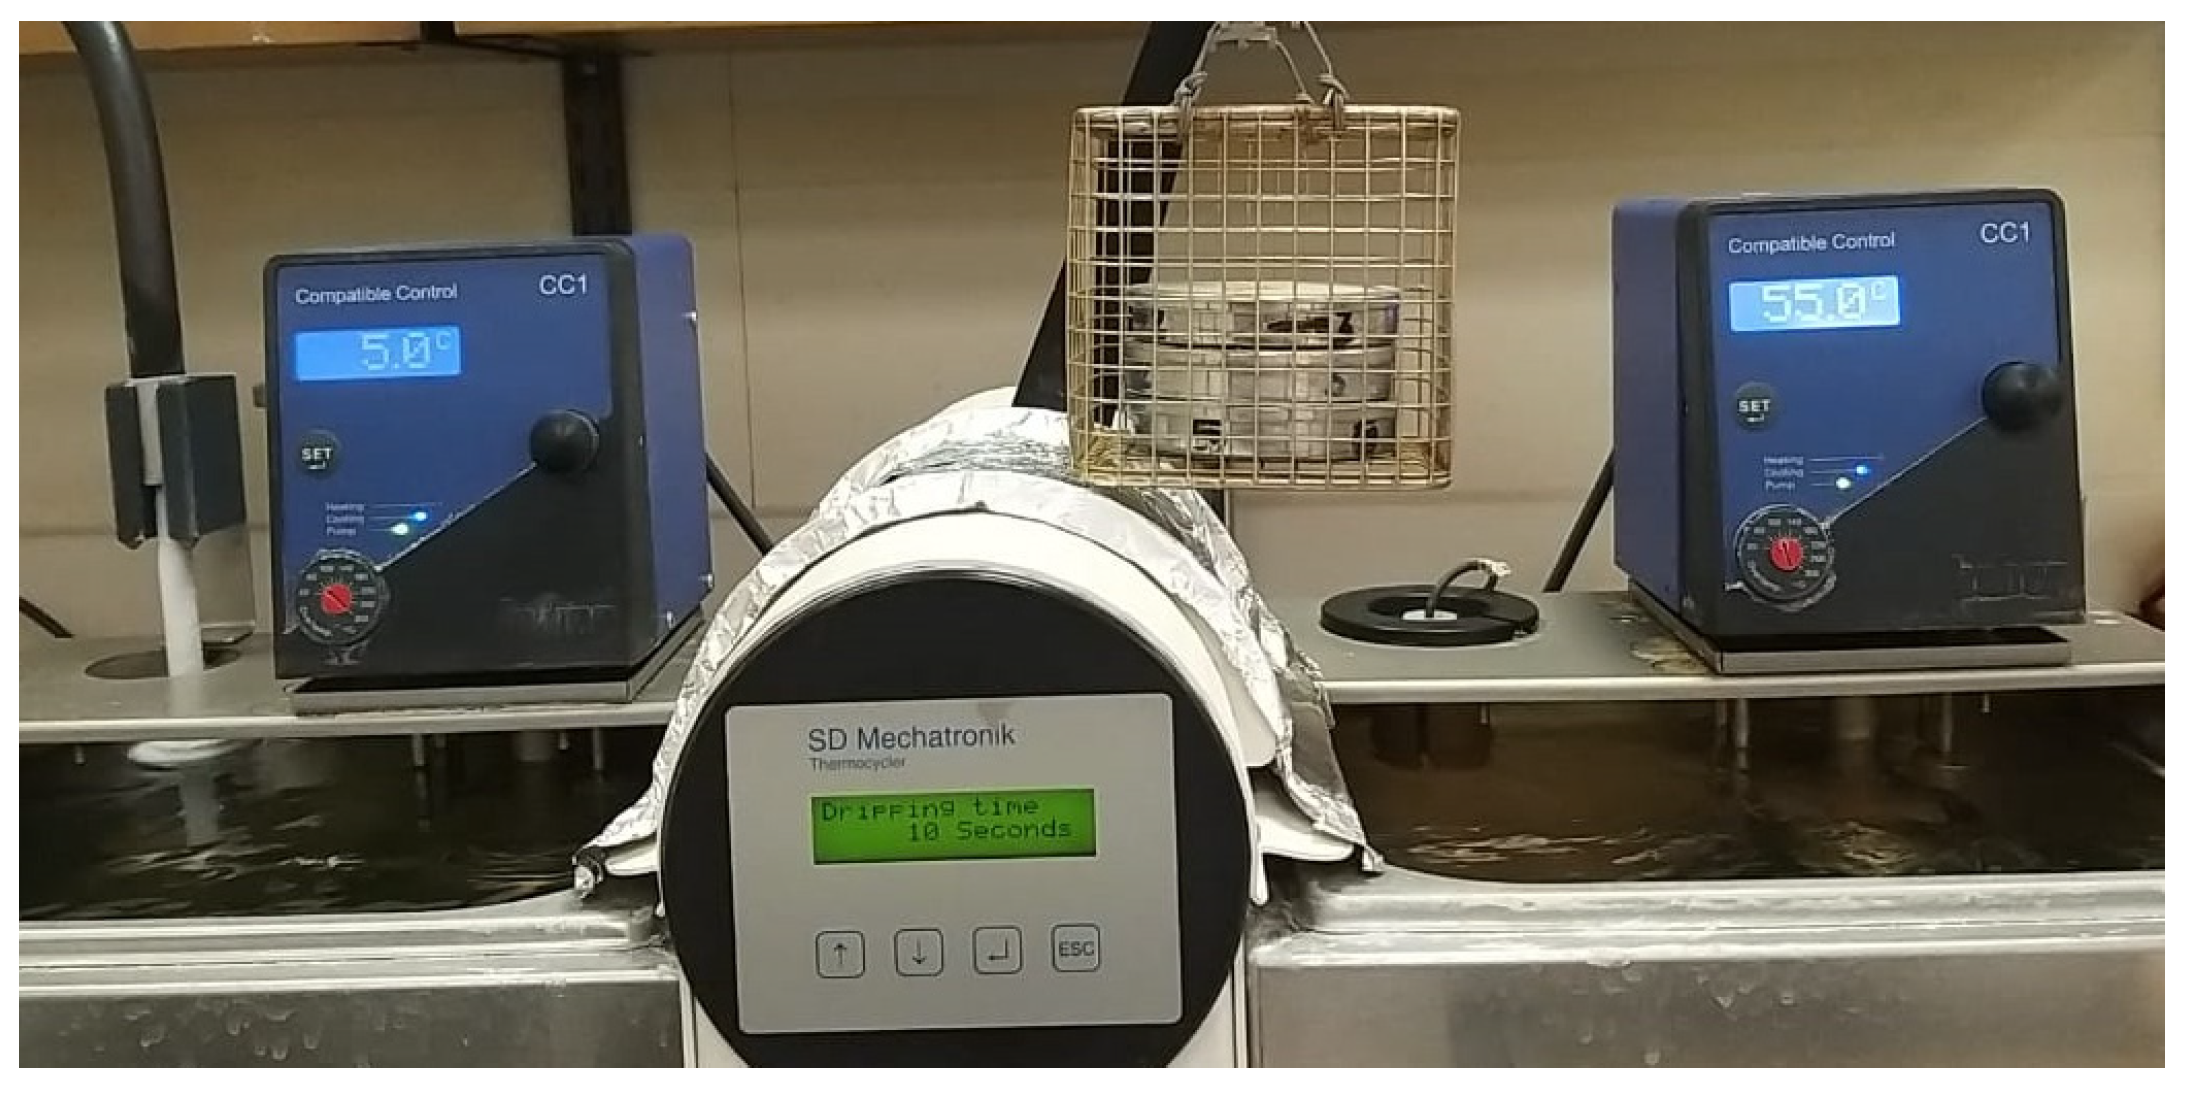
| Thermocycling unit | SD Mechatronik, Bayern, Germany | 1100 | |
| Instron | Instron, Norwood, MA, USA | 3345 | |
| Field emission Scanning electron microscope | Hitachi, Tokyo, Japan | FE-SEM S4700 | |
| Bonding agent | |||
| Meta P & Bond Condac Porcelana Silane Tetric N-Bond | METABIOMED Co., Ltd., Cheongwon-Gun Chungcheongbuk-Do, South Korea FGM dental Products, Brazil Ultradent Products Inc., South Jordan, UT, USA Ivoclar Vivadent, Schaan, Liechtenstein | Bisphenol A glycerolate dimethacrylate, urethane dimethacrylate, pyromellitic glyceryl dimethacrylate, 2-hydroxy ethyl methacrylate, ethyl alcohol 10% hydrofluoric acid 2–1.2 mm ultradent silane hydrofluoric acid (<10%) phosphoric acid acrylate, HEMA, Bis-GMA, urethane dimethacrylate, ethanol, film-forming agent, initiators, and stabilizers | MET2110221 240322 BLG9B Z01PMJ |
| Repair materials Tetric N-Flow Refill UNIFAST III | Ivoclar Vivadent, Schaan, Liechtenstein GC Asia Dental Pte Ltd., Singapore | 36 wt.% dimethacrylate (TEGDMA) 63 wt.% fillers (barium glass, ytterbium trifluoride, highly dispersed silica and mixed oxide). 1 wt.% initiators, stabilizers and pigments, PMMA, dimethyl-p-toluidine benzyl peroxide | Z01W37 2112081 |
| Group | Number of Specimens | Base Cylinder Material | Surface Treatments | Repair Material |
|---|---|---|---|---|
| Group MC: Control | 10 | Milled | No treatment | Composite |
| Group MCA | 10 | Milled | Air abrasion | Composite |
| Group MCE | 10 | Milled | Etch-primer | Composite |
| Group MCC | 10 | Milled | Combination (air abrasion and etch-primer) | Composite |
| Group MP: Control | 10 | Milled | No treatment | PMMA |
| Group MPA | 10 | Milled | Air abrasion | PMMA |
| Group MPE | 10 | Milled | Etch-primer | PMMA |
| Group MPC | 10 | Milled | Combination (air abrasion and etch-primer) | PMMA |
| Group | Number of Specimens | Base Cylinder Material | Surface Treatments | Repair Material |
|---|---|---|---|---|
| Group PC: Control | 10 | 3D-printed | No treatment | Composite |
| Group PCA | 10 | 3D-printed | Air abrasion | Composite |
| Group PCE | 10 | 3D-printed | Etch-primer | Composite |
| Group PCC | 10 | 3D-printed | Combination (air abrasion and etch-primer) | Composite |
| Group PP: Control | 10 | 3D-printed | No treatment | PMMA |
| Group PPA | 10 | 3D-printed | Air abrasion | PMMA |
| Group PPE | 10 | 3D-printed | Etch-primer | PMMA |
| Group PPC | 10 | 3D-printed | Combination (air abrasion and etch-primer) | PMMA |
| Type of Specimen | Cohesive | Adhesive | Mixed |
|---|---|---|---|
| Milled specimen repaired by PMMA | 10% (4 samples) | - | 90% (36 samples) |
| Milled sample repaired by composite | 13% (5 samples) | - | 87% (35 samples) |
| 3D-printed sample repaired by PMMA | - | 10% (4 samples) | 90% (36 samples) |
| 3D-printed sample repaired by composite | - | - | 100% (40 samples) |
| Sources of Variation | Degrees of Freedom | Sum of Squares | Mean Sum of Squares | F-Value | p-Value |
|---|---|---|---|---|---|
| Main effects | |||||
| Main groups | 1 | 370.89 | 370.89 | 270.9076 | 0.0001 * |
| Materials | 1 | 354.86 | 354.86 | 259.2048 | 0.0001 * |
| Subgroups | 3 | 98.92 | 32.97 | 24.0838 | 0.0001 * |
| 2-way interaction effects | |||||
| Main groups × Materials | 1 | 89.23 | 89.23 | 65.1731 | 0.0001 * |
| Main groups × Subgroups | 3 | 181.61 | 60.54 | 44.2177 | 0.0001 * |
| Materials × Subgroups | 3 | 178.28 | 59.43 | 43.4077 | 0.0001 * |
| 3-way interaction effects | |||||
| Main groups × Materials × Subgroups | 3 | 94.67 | 31.56 | 23.0496 | 0.0001 * |
| Error | 144 | 197.14 | 1.37 | - | - |
| Total | 159 | 1565.60 | - | - | - |
| Subgroups | Group MC | Group MCA | Group MCE | Group MCC |
|---|---|---|---|---|
| Mean | 6.68 | 8.78 | 8.02 | 8.34 |
| SD | 2.98 | 2.03 | 2.76 | 4.12 |
| p-value | ||||
| Group MC | - | |||
| Group MCA | 0.0001 * | - | - | - |
| Group MCE | 0.0001 * | 0.0196 * | - | - |
| Group MCC | 0.0001 * | 0.3292 | 0.6205 | - |
| Main Groups × Materials | Milled Group with Composite Material | Milled Group with PMMA Repair | 3D-Printed Group with Composite Material | 3D-Printed Group with PMMA Repair |
|---|---|---|---|---|
| Mean | 7.18 | 5.69 | 11.72 | 7.24 |
| SD | 2.17 | 1.99 | 2.22 | 2.38 |
| p-value | ||||
| Milled group with composite material | - | - | - | - |
| Milled group with PMMA repair | 0.0001 * | - | - | - |
| 3D-printed group with composite material | 0.0001 * | 0.0001 * | - | - |
| 3D-printed group with PMMA repair | 0.9942 | 0.0001 * | 0.0001 * | - |
| Main Groups × Subgroups | Milled Group with Group MC | Milled Group with Group MCA | Milled Group with Group MCE | Milled Group with Group MCC | 3D-Printed Group with Group MC | 3D-Printed Group with Group MCA | 3D-Printed Group with Group MCE | 3D-Printed Group with Group MCC |
|---|---|---|---|---|---|---|---|---|
| Mean | 3.95 | 8.52 | 5.60 | 7.66 | 9.40 | 9.05 | 10.45 | 9.03 |
| SD | 0.92 | 1.58 | 0.87 | 1.63 | 1.34 | 2.42 | 1.59 | 5.59 |
| p-value | ||||||||
| Milled group with Group MC | - | - | - | - | - | - | - | - |
| Milled group with Group MCA | 0.0001 * | - | - | - | - | - | - | - |
| Milled group with Group MCE | 0.0002 | 0.0001 * | - | - | - | - | - | - |
| Milled group with Group MCC | 0.0001 * | 0.2731 | 0.0001 * | - | - | - | - | - |
| 3D-printed group with Group MC | 0.0001 * | p = 0.2533 | 0.0001 * | 0.0001 * | - | - | - | - |
| 3D-printed group with Group MCA | 0.0001 * | 0.8509 | 0.0001 * | 0.0044 * | 0.9797 * | - | - | - |
| 3D-printed group with Group MCE | 0.0001 * | 0.0001 * | 0.0001 * | 0.0001 * | 0.0894 | 0.0039 * | - | - |
| 3D-printed group with Group MCC | 0.0001 * | 0.8741 | 0.0001 * | 0.0053 * | 0.9727 | 1.0000 | 0.0032 * | - |
| Main Groups × Subgroups | Composite Material with Group MC | Composite Material with Group MCA | Composite Material with Group MCE | Composite Material with Group MCC | PMMA Repair with Group MC | PMMA Repair with Group MCA | PMMA Repair with Group MCE | PMMA Repair with Group MCC |
|---|---|---|---|---|---|---|---|---|
| Mean | 7.29 | 10.10 | 8.79 | 11.60 | 6.07 | 7.46 | 7.26 | 5.08 |
| SD | 2.94 | 1.78 | 2.98 | 3.18 | 2.97 | 1.29 | 2.35 | 1.54 |
| p-value | ||||||||
| Composite material with Group MC | - | -- | - | - | - | - | - | - |
| Composite material with Group MCA | 0.0001 * | - | - | - | - | - | - | - |
| Composite material with Group MCE | 0.0012 * | 0.0097 * | - | - | - | - | - | - |
| Composite material with Group MCC | 0.0001 * | 0.0013 * | 0.0001 * | - | - | - | - | - |
| PMMA repair with Group MC | 0.0223 | 0.0001 * | 0.0001 * | 0.0001 * | - | - | - | - |
| PMMA repair with Group MCA | 0.9997 | 0.0001 * | 0.0078 | 0.0001 * | 0.0040 * | - | - | - |
| PMMA repair with Group MCE | 0.0000 | 0.0001 * | 0.0009 * | 0.0001 * | 0.0291 * | 0.9993 | - | - |
| PMMA repair with Group MCC | 0.0001 * | 0.0001 * | 0.0001 * | 0.0001 * | 0.1328 | 0.0001 * | 0.0001 * | - |
Disclaimer/Publisher’s Note: The statements, opinions and data contained in all publications are solely those of the individual author(s) and contributor(s) and not of MDPI and/or the editor(s). MDPI and/or the editor(s) disclaim responsibility for any injury to people or property resulting from any ideas, methods, instructions or products referred to in the content. |
© 2023 by the authors. Licensee MDPI, Basel, Switzerland. This article is an open access article distributed under the terms and conditions of the Creative Commons Attribution (CC BY) license (https://creativecommons.org/licenses/by/4.0/).
Share and Cite
Dewan, H.; Sayed, M.E.; Jundus, A.; Gharawi, M.; Baeshen, S.; Alali, M.; Almarzouki, M.; Jokhadar, H.F.; AlResayes, S.S.; Al Wadei, M.H.D.; et al. Shear Strength of Repaired 3D-Printed and Milled Provisional Materials Using Different Resin Materials with and without Chemical and Mechanical Surface Treatment. Polymers 2023, 15, 4284. https://doi.org/10.3390/polym15214284
Dewan H, Sayed ME, Jundus A, Gharawi M, Baeshen S, Alali M, Almarzouki M, Jokhadar HF, AlResayes SS, Al Wadei MHD, et al. Shear Strength of Repaired 3D-Printed and Milled Provisional Materials Using Different Resin Materials with and without Chemical and Mechanical Surface Treatment. Polymers. 2023; 15(21):4284. https://doi.org/10.3390/polym15214284
Chicago/Turabian StyleDewan, Harisha, Mohammed E. Sayed, Asayil Jundus, Mafaz Gharawi, Safeyah Baeshen, Maimonah Alali, Mai Almarzouki, Hossam F. Jokhadar, Saad Saleh AlResayes, Mohammed H. D. Al Wadei, and et al. 2023. "Shear Strength of Repaired 3D-Printed and Milled Provisional Materials Using Different Resin Materials with and without Chemical and Mechanical Surface Treatment" Polymers 15, no. 21: 4284. https://doi.org/10.3390/polym15214284