

Study on Shear Behaviors and Damage Assessment of Circular Concrete Short Columns Reinforced with GFRP Bars and Spiral Stirrups


Abstract
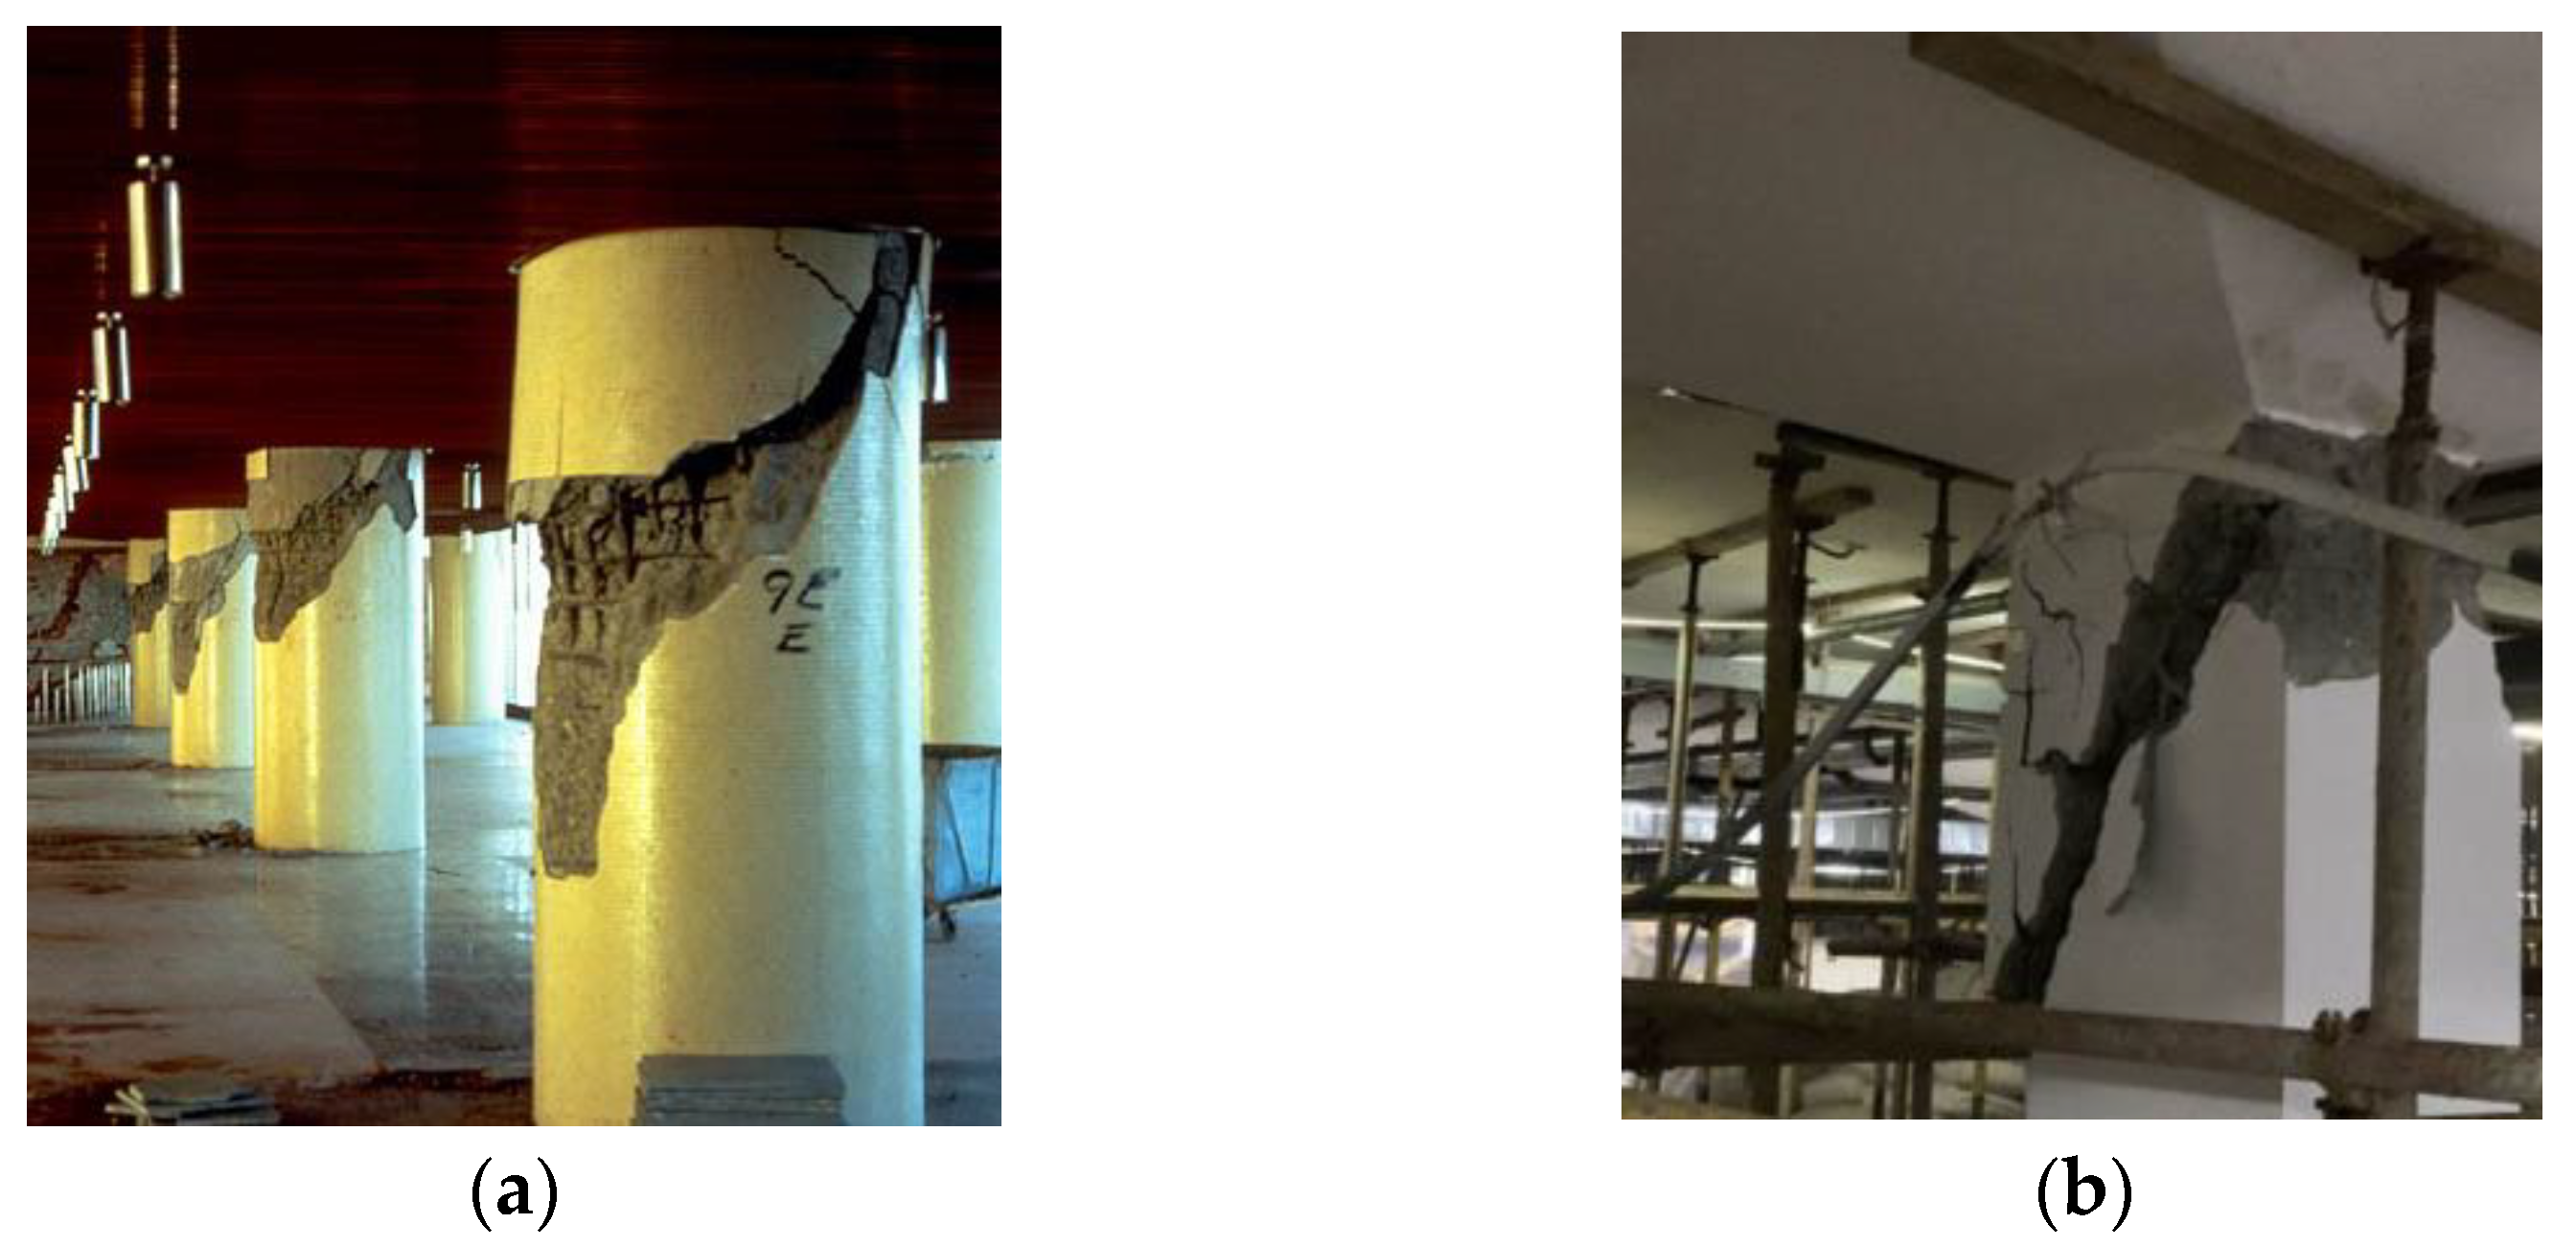
:1. Introduction
2. Experimental Program
2.1. Materials
2.1.1. Concrete Materials
2.1.2. Reinforcing Materials
2.2. Specimen Design and Fabrication
2.3. Test Setup and Procedure
3. Results and Discussion of Shear Behaviors
3.1. Crack Patterns and Failure Mode
3.2. Load-Displacement Curves
3.3. Strain Responses
3.3.1. Concrete Strain
3.3.2. Reinforcement Strain
3.4. Crack Development
3.5. Theoretical Analysis of Shear Capacity
3.5.1. Shear Strength Contribution of FRP Spiral Stirrups
3.5.2. Prediction and Comparison of Shear Capacity
4. Damage Assessment and Discussion Based on Piezoceramic Transducers
4.1. Damage Detection Principles of Concrete Short Column Enabled Active Sensing
4.2. Time-Domain and Frequency-Domain Analysis
4.3. Energy Ratio Index (ERI) Analysis Based on Wavelet Decomposition Method
4.4. Damage Assessment
5. Conclusions
- GFRP spiral stirrups and longitudinal reinforcement can inhibit the formation of the main diagonal crack, increase the shear capacity and improve the ductility of a concrete short column. The load-displacement curve of a short column reinforced by GFRP spiral stirrups is similar to that of one reinforced by round steel stirrups, indicating that it is feasible to use GFRP bars and GFRP spiral stirrups in column constructions.
- GFRP spiral stirrups increase the shear capacity of a circular concrete short column by 5.6% and 31.1% at a stirrup reinforcement ratio of 0.19% and 0.47%, respectively. The shear capacity of a concrete short column with GFRP spiral stirrups is improved by 18.95% by increasing the longitudinal reinforcement ratio from 1.5% to 2.25%. Notably, the lateral ultimate displacement is increased by 67.7% and 400% at a stirrup reinforcement ratio of 0.19% and 0.47% in a circular concrete short column.
- The effective stress of the GFRP spiral stirrups at failure, which is from 20.1% to 26.0% of the ultimate tensile strength of a GFRP straight bar, is decreased with the increase in the stirrup reinforcement ratio and is improved by increasing the longitudinal reinforcement ratio.
- For circular concrete short columns with GFRP bars and spiral stirrups, the shear capacity can be accurately predicted by using the equation proposed by Ali et al., with a strain limit of . The CSA code provides relatively accurate shear capacity predictions and the ACI, JSCE and BISE codes provide relatively conservative shear capacity predictions.
- The energy ratio index (ERI) established by wavelet decomposition can help to identify the location of cracks in a column and the loads corresponding to the formation of cracks. Damage indices determined using smart aggregate are consistent with those obtained from load-displacement curves, indicating that with the proposed damage index based on the smart aggregate it is feasible to evaluate the damage level of the concrete short columns.
Author Contributions
Funding
Institutional Review Board Statement
Informed Consent Statement
Data Availability Statement
Acknowledgments
Conflicts of Interest
Abbreviations
| GFRP | Glass fiber reinforced polymer |
| DIC | digital image correlation |
| SA | smart aggregate |
| LVDT | linear variable differential transformer |
| ERI | energy ratio index |
| RMSD | root-mean-square deviation |
| shear strength provided by the stirrups | |
| the shear strength provided by the concrete | |
| shear strength of the test specimen at failure | |
| the angle of inclination of main the diagonal crack | |
| the cross-sectional area of the spiral stirrup | |
| pitch of spiral stirrups | |
| the effective depth of spiral stirrups | |
| diameter of the circular cross-section | |
| diameter of the circle passing through the centers of the longitudinal reinforcement | |
| effective stress of spiral stirrups | |
| ultimate tensile strength | |
| elasticity modulus of GFRP stirrup | |
| predicted shear capacities | |
| tested shear capacities | |
| the effective height of concrete members | |
| signals in different frequency bands | |
| energy of those signals in different frequency bands | |
| 𝐸𝐼𝑅 | energy in different frequency bands obtained by the n-level wavelet decomposition |
| energy ratio index in the different frequency bands | |
| energy ratio index | |
| damage index based on the load-displacement curve | |
| applied load | |
| cracking load | |
| displacements corresponding to the applied loads | |
| displacements corresponding to the cracking loads |
References
- Cabrera, J.G. Deterioration of concrete due to reinforcement steel corrosion. Cem. Concr. Compos. 1996, 18, 47–59. [Google Scholar] [CrossRef]
- Tang, F.J.; Chen, G.D.; Yi, W.J. Corrosion-induced concrete cracking, steel-concrete bond loss, and mechanical degradation of steel bars. Adv. Mater. Res. 2014, 919–921, 1760–1770. [Google Scholar] [CrossRef]
- Tahri, W.; Hu, X.; Shi, C.; Zhang, Z. Review on corrosion of steel reinforcement in alkali-activated concretes in chloride-containing environments. Constr. Build. Mater. 2021, 293, 123484. [Google Scholar] [CrossRef]
- Al-Khafaji, A.F.; Myers, J.J.; Nanni, A. Assessment study of glass fiber-reinforced polymer reinforcement used in two concrete bridges after more than 15 years of service. ACI Mater. J. 2020, 117, 209–220. [Google Scholar] [CrossRef]
- Dong, Z.; Sun, Y.; Zhu, H.; Wu, G.; Shao, X. Shear behavior of hybrid seawater sea-sand concrete short beams reinforced with BFRP reinforcements. Eng. Struct. 2022, 252, 113615. [Google Scholar] [CrossRef]
- Bouguerra, K.; Ahmed, E.A.; El-Gamal, S.; Benmokrane, B. Testing of full-scale concrete bridge deck slabs reinforced with fiber-reinforced polymer (FRP) bars. Constr. Build. Mater. 2011, 25, 3956–3965. [Google Scholar] [CrossRef]
- Dong, Z.; Sun, Y.; Zhu, H.; Wu, G.; Yan, Z.; Lu, F. Behavior and modeling of seawater sea-sand coral aggregate concrete-filled BFRP tubular columns under eccentric compression. Compos. Struct. 2022, 288, 115392. [Google Scholar] [CrossRef]
- Elsanadedy, H.M.; Al-Salloum, Y.A.; Alsayed, S.H.; Iqbal, R.A. Experimental and numerical investigation of size effects in FRP-wrapped concrete columns. Constr. Build. Mater. 2012, 29, 56–72. [Google Scholar] [CrossRef]
- Alajarmeh, O.; Manalo, A.; Benmokrane, B.; Ferdous, W.; Mohammed, A.; Abousnina, R.; Elchalakani, M.; Edoo, A. Behavior of circular concrete columns reinforced with hollow composite sections and GFRP bars. Mar. Struct. 2020, 72, 102785. [Google Scholar] [CrossRef]
- Mohamed, H.M.; Ali, A.H.; Benmokrane, B. Behavior of circular concrete members reinforced with carbon-FRP bars and spirals under shear. J. Compos. Constr. 2017, 21, 04016090. [Google Scholar] [CrossRef]
- Ali, A.H.; Mohamed, H.M.; Chaallal, O.; Benmokrane, B.; Ghrib, F. Shear resistance of RC circular members with FRP discrete hoops versus spirals. Eng. Struct. 2018, 174, 688–700. [Google Scholar] [CrossRef]
- Jumaa, G.B.; Yousif, A.R. Size effect on the shear failure of high-strength concrete beams reinforced with basalt FRP bars and stirrups. Constr. Build. Mater. 2019, 209, 77–94. [Google Scholar] [CrossRef]
- Al-Hamrani, A.; Alnahhal, W.; Elahtem, A. Shear behavior of green concrete beams reinforced with basalt FRP bars and stirrups. Compos. Struct. 2021, 277, 114619. [Google Scholar] [CrossRef]
- Machial, R.; Alam, M.S.; Rteil, A. Revisiting the shear design equations for concrete beams reinforced with FRP rebar and stirrup. Mater. Struct. 2012, 45, 1593–1612. [Google Scholar] [CrossRef]
- Arslan, M.H.; Yazman, Ş.; Hamad, A.A.; Aksoylu, C.; Özkılıç, Y.O.; Gemi, L. Shear strengthening of reinforced concrete T-beams with anchored and non-anchored CFRP fabrics. Structures 2022, 39, 527–542. [Google Scholar] [CrossRef]
- Aksoylu, C.; Yazman, Ş.; Özkılıç, Y.O.; Gemi, L.; Arslan, M.H. Experimental analysis of reinforced concrete shear deficient beams with circular web openings strengthened by CFRP composite. Compos. Struct. 2020, 249, 112561. [Google Scholar] [CrossRef]
- Al-Hamrani, A.; Alnahhal, W. Shear behavior of basalt FRC beams reinforced with basalt bars and glass stirrups: Experimental and analytical investigations. Eng. Struct. 2021, 242, 112612. [Google Scholar] [CrossRef]
- Razaqpur, A.G.; Spadea, S. Shear strength of FRP reinforced concrete members with stirrups. J. Compos. Constr. 2015, 19, 04014025. [Google Scholar] [CrossRef]
- Ali, A.H.; Mohamed, H.M.; Benmokrane, B. Shear behavior of circular concrete members reinforced with GFRP bars and spirals at shear span-to-depth ratios between 1.5 and 3.0. J. Compos. Constr. 2016, 20, 04016055. [Google Scholar] [CrossRef]
- Mohamed, H.M.; Ali, A.H.; Benmokrane, B. Mechanism of distributed composite GFRP bars in circular concrete members with and without spirals under shear. Compos. Part B Eng. 2018, 162, 62–72. [Google Scholar] [CrossRef]
- American Concrete Institute (ACI). Committee 440 Guide for the Design and Construction of Concrete Reinforced with FRP Bars; ACI 440.1R-15; American Concrete Institute (ACI) Committee 440: Farmington Hills, MI, USA, 2015. [Google Scholar]
- Canadian Standards Association (CSA). Design and Construction of Building Components with Fiber Reinforced Polymers; CAN/CSAS806-12; Canadian Standards Association (CSA): Rexdale, ON, Canada, 2012. [Google Scholar]
- Japan Society of Civil Engineers (JSCE). Recommendation for Design and Construction of Concrete Structures Using Continuous Fiber Reinforcing Materials; Japan Society of Civil Engineers (JSCE): Tokyo, Japan, 1997. [Google Scholar]
- British Institution of Structural Engineers (BISE). Interim Guidance on the Design of Reinforced Concrete Structures Using Fiber Composite Reinforcement; British Institution of Structural Engineers (BISE): London, UK, 1999. [Google Scholar]
- Zhao, B.; Lei, D.; Fu, J.; Yang, L.; Xu, W. Experimental study on micro-damage identification in reinforced concrete beam with wavelet packet and DIC method. Constr. Build. Mater. 2019, 210, 338–346. [Google Scholar] [CrossRef]
- Huo, L.; Chen, D.; Kong, Q.; Li, H.; Song, G. Smart washer–a piezoceramic-based transducer to monitor looseness of bolted connection. Smart Mater. Struct. 2017, 26, 025033. [Google Scholar] [CrossRef]
- Chen, Y.Z.; Xue, X.W. Advances in the structural health monitoring of bridges using piezoelectric transducers. Sensors 2018, 18, 4312–4336. [Google Scholar] [CrossRef] [PubMed] [Green Version]
- Ai, D.M.; Zhu, H.P.; Luo, H. Sensitivity of embedded active PZT sensor for concrete structural impact damage detection. Constr. Build. Mater. 2016, 111, 348–357. [Google Scholar] [CrossRef]
- Zhou, L.; Zheng, Y.; Huo, L.; Ye, Y.; Chen, D.; Ma, H.; Song, G. Monitoring of bending stiffness of BFRP reinforced concrete beams using piezoceramic transducer enabled active sensing. Smart Mater. Struct. 2020, 29, 105012. [Google Scholar] [CrossRef]
- Zhou, L.; Zheng, Y.; Song, G.; Chen, D.; Ye, Y. Identification of the structural damage mechanism of BFRP bars reinforced concrete beams using smart transducers based on time reversal method. Constr. Build. Mater. 2019, 220, 615–627. [Google Scholar] [CrossRef]
- Moslehy, Y.; Gu, H.; Belarbi, A.; Mo, Y.L.; Song, G. Smart aggregate based damage detection of circular RC columns under cyclic combined loading. Smart Mater. Struct. 2010, 19, 065021. [Google Scholar] [CrossRef]
- Xu, K.; Deng, Q.; Cai, L.; Ho, S.; Song, G. Damage detection of a concrete column subject to blast loads using embedded piezoceramic transducers. Sensors 2018, 18, 1377. [Google Scholar] [CrossRef] [Green Version]
- Zhou, K.; Lei, D.; He, J.; Zhang, P.; Bai, P.; Zhu, F. Real-time localization of micro-damage in concrete beams using DIC technology and wavelet packet analysis. Cem. Concr. Compos. 2021, 123, 104198. [Google Scholar] [CrossRef]
- Li, D.; Huang, P.; Chen, Z.; Yao, G.; Guo, X.; Zheng, X.; Yang, Y. Experimental study on fracture and fatigue crack propagation processes in concrete based on DIC technology. Eng. Fract. Mech. 2020, 235, 107166. [Google Scholar] [CrossRef]
- Yuan, F.; Cheng, L.; Shao, X.; Dong, Z.; Zhang, L.; Wu, G.; He, X. Full-field measurement and fracture and fatigue characterizations of asphalt concrete based on the SCB test and stereo-DIC. Eng. Fract. Mech. 2020, 235, 107127. [Google Scholar] [CrossRef]
- American Concrete Institute (ACI). Committee 440 Guide Test Methods for Fiber-Reinforced Polymer (FRP) Composites for Reinforcing or Strengthening Concrete and Masonry Structures; ACI 440.3R-12; American Concrete Institute (ACI) Committee 440: Farmington Hills, MI, USA, 2012. [Google Scholar]
- Razaqpur, A.G.; Isgor, O.B. Proposed shear design method for FRP-reinforced concrete members without stirrups. ACI Struct. J. 2006, 103, 93–102. [Google Scholar]
- Turmo, J.; Ramos, G.; Aparicio, A.C. Shear truss analogy for concrete members of solid and hollow circular cross section. Eng. Struct. 2009, 31, 455–465. [Google Scholar] [CrossRef]
- American Association of State Highway and Transportation Officials (ASHTO). AASHTO LRFD Bridge Design Guide Specifications; American Association of State Highway and Transportation Officials (ASHTO): Washington, DC, USA, 2012. [Google Scholar]
- Du, G.F.; Kong, Q.Z.; Hua, Z.; Gu, H.C. Multiple cracks detection in pipeline using damage index matrix based on piezoceramic transducer-enabled stress wave propagation. Sensors 2017, 17, 1812–1822. [Google Scholar] [CrossRef] [PubMed] [Green Version]
- Zhang, H.; Li, J.J.; Kang, F.; Zhang, J.N. Monitoring and evaluation of the repair quality of concrete cracks using piezoelectric smart aggregates. Constr. Build. Mater. 2022, 317, 125775. [Google Scholar] [CrossRef]
- Zhou, L.; Zheng, Y.; Li, H.; Song, G. Identification of bond behavior between FRP/steel bars and self-compacting concrete using piezoceramic transducers based on wavelet energy analysis. Arch. Civ. Mech. Eng. 2020, 20, 1–16. [Google Scholar] [CrossRef] [Green Version]
- Howser, R.; Moslehy, Y.; Gu, H.; Dhonde, H.; Mo, Y.L.; Ayoub, A.; Song, G. Smart-aggregate-based damage detection of fiber-reinforced-polymer-strengthened columns under reversed cyclic loading. Smart Mater. Struct. 2011, 20, 075014. [Google Scholar] [CrossRef]
- Taghavipour, S.; Kharkovsky, S.; Kang, W.H.; Samali, B.; Mirza, O. Detection and monitoring of flexural cracks in reinforced concrete beams using mounted smart aggregate transducers. Smart Mater. Struct. 2017, 26, 104009. [Google Scholar] [CrossRef]
- Song, G.; Gu, H.; Mo, Y.L. Smart aggregates: Multi-functional sensors for concrete structures–a tutorial and a review. Smart Mater. Struct. 2008, 17, 033001. [Google Scholar] [CrossRef]


| Type | Diameter (mm) | Area (mm2) | Surface Treatment | Yield Strength (MPa) | Tensile Strength (MPa) | Elastic Modulus (GPa) | Fracture Strain (%) |
|---|---|---|---|---|---|---|---|
| A | 13 | 132.7 | SWSC | - | 1047.2 | 57.9 | 1.81 |
| B | 6 | 28.3 | SWSC | - | 860.0 | 46.5 | 1.85 |
| C | 6 | 28.3 | - | 444.3 | 483.2 | 210.0 | - |
| Name | Shear-Span Ratio | Type of Longitudinal Bars | Type of Stirrups | Longitudinal Reinforcement Ratio (%) | Stirrup Reinforcement Ratio (%) |
|---|---|---|---|---|---|
| G1 | 1.33 | GFRP | GFRP | 1.50 | 0.19 |
| G2 | 1.33 | GFRP | GFRP | 1.50 | 0.47 |
| G3 | 1.33 | GFRP | - | 1.50 | 0.00 |
| G4 | 1.33 | GFRP | GFRP | 2.25 | 0.19 |
| S1 | 1.33 | GFRP | Round steel | 1.50 | 0.19 |
| Name | The Load Corresponding to Crack Occurrence (kN) | Shear Capacity (kN) | Ultimate Displacement (mm) | Ratio of Cracking Load to Shear Capacity (%) | Failure Mode | |||
|---|---|---|---|---|---|---|---|---|
| First Crack | Second Crack | Third Crack | Fourth Crack | |||||
| G1 | 24 | 51 | 70 | - | 95 | 10.4 | 25.3 | Shear-compression |
| G2 | 36 | 56 | 61 | - | 118 | 31.0 | 30.5 | Shear-compression |
| G3 | 33 | 59 | 69 | - | 90 | 6.2 | 36.7 | Shear-compression |
| G4 | 36 | 42 | 60 | 85 | 113 | 15.6 | 31.9 | Shear-compression |
| S1 | 24 | 50 | 65 | 80 | 108 | 12.2 | 22.2 | Shear-compression |
| Code | Shear Design Equation | |
|---|---|---|
| ACI 440.1R-15 [21] | ||
| CSA-S806 [22] | ||
| JSCE 1997 [23] | ||
| BISE 1999 [24] | ||
| Name | ACI 440.1R-15 | CSA-S806 | JSCE 1997 | BISE 1999 | Proposed by Ali et al. | ||||||||||
|---|---|---|---|---|---|---|---|---|---|---|---|---|---|---|---|
| G1 | 25.9 | 23.4 | 1.93 | 90.4 | 26.6 | 0.81 | 50.7 | 8.0 | 1.62 | 54.5 | 14.8 | 1.37 | 90.4 | 15.4 | 0.90 |
| G2 | 25.9 | 59.1 | 1.39 | 90.4 | 66.6 | 0.75 | 50.7 | 11.7 | 1.89 | 54.5 | 37.0 | 1.29 | 90.4 | 38.5 | 0.92 |
| G3 | 25.9 | - | 3.47 | 90.4 | - | 1.00 | 50.7 | - | 1.78 | 54.5 | - | 1.65 | 90.4 | - | 1.00 |
| G4 | 31.1 | 23.4 | 2.0 | 102.0 | 26.6 | 0.88 | 58.1 | 9.8 | 1.66 | 62.4 | 14.8 | 1.46 | 102.0 | 15.4 | 0.96 |
| Average | - | - | 2.22 | - | - | 0.86 | - | - | 1.74 | - | - | 1.44 | - | - | 0.94 |
| SD | - | - | 0.77 | - | - | 0.09 | - | - | 0.11 | - | - | 0.13 | - | - | 0.04 |
Disclaimer/Publisher’s Note: The statements, opinions and data contained in all publications are solely those of the individual author(s) and contributor(s) and not of MDPI and/or the editor(s). MDPI and/or the editor(s) disclaim responsibility for any injury to people or property resulting from any ideas, methods, instructions or products referred to in the content. |
© 2023 by the authors. Licensee MDPI, Basel, Switzerland. This article is an open access article distributed under the terms and conditions of the Creative Commons Attribution (CC BY) license (https://creativecommons.org/licenses/by/4.0/).
Share and Cite
Wang, X.; Zhou, L.; Liang, Y.; Zheng, Y.; Li, L.; Di, B. Study on Shear Behaviors and Damage Assessment of Circular Concrete Short Columns Reinforced with GFRP Bars and Spiral Stirrups. Polymers 2023, 15, 567. https://doi.org/10.3390/polym15030567
Wang X, Zhou L, Liang Y, Zheng Y, Li L, Di B. Study on Shear Behaviors and Damage Assessment of Circular Concrete Short Columns Reinforced with GFRP Bars and Spiral Stirrups. Polymers. 2023; 15(3):567. https://doi.org/10.3390/polym15030567
Chicago/Turabian StyleWang, Xiaolu, Lingzhu Zhou, Yuke Liang, Yu Zheng, Lixiao Li, and Bo Di. 2023. "Study on Shear Behaviors and Damage Assessment of Circular Concrete Short Columns Reinforced with GFRP Bars and Spiral Stirrups" Polymers 15, no. 3: 567. https://doi.org/10.3390/polym15030567