
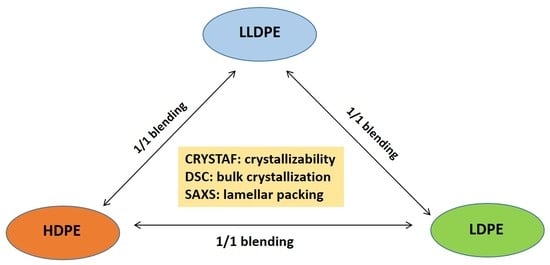
CRYSTAF, DSC and SAXS Study of the Co-Crystallization, Phase Separation and Lamellar Packing of the Blends with Different Polyethylenes
 , ,
, ,
Abstract
:
1. Introduction
2. Materials and Methods
2.1. Preparation of PE Blends with Different Types of PE
2.2. Differential Scanning Calorimetry (DSC)
2.3. Crystallization Analysis Fractionation (CRYSTAF)
2.4. Small-Angle X-ray Scattering (SAXS)
3. Results and Discussion
3.1. Crystallization-Driven Phase Separation of PE Molecules Due to Large Difference in Branching Degree
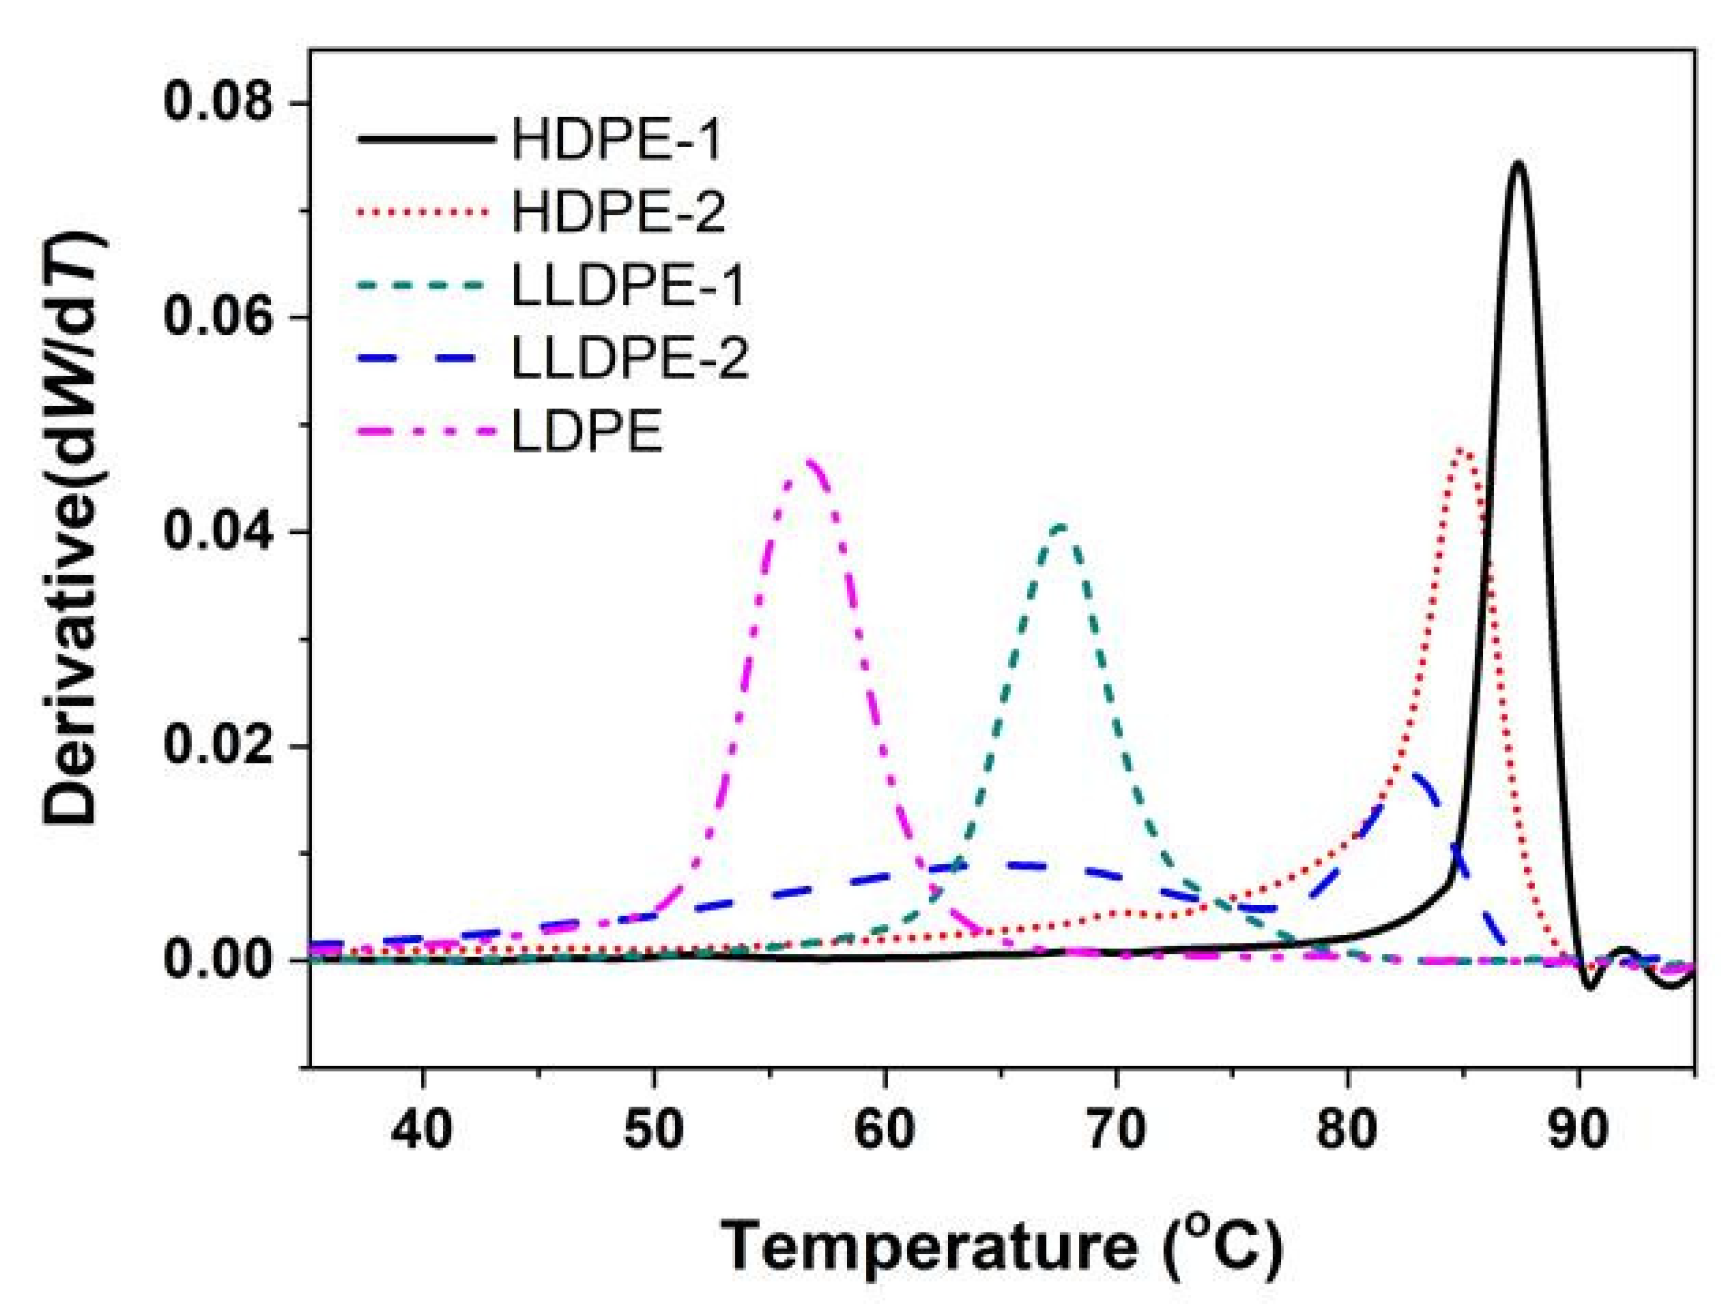
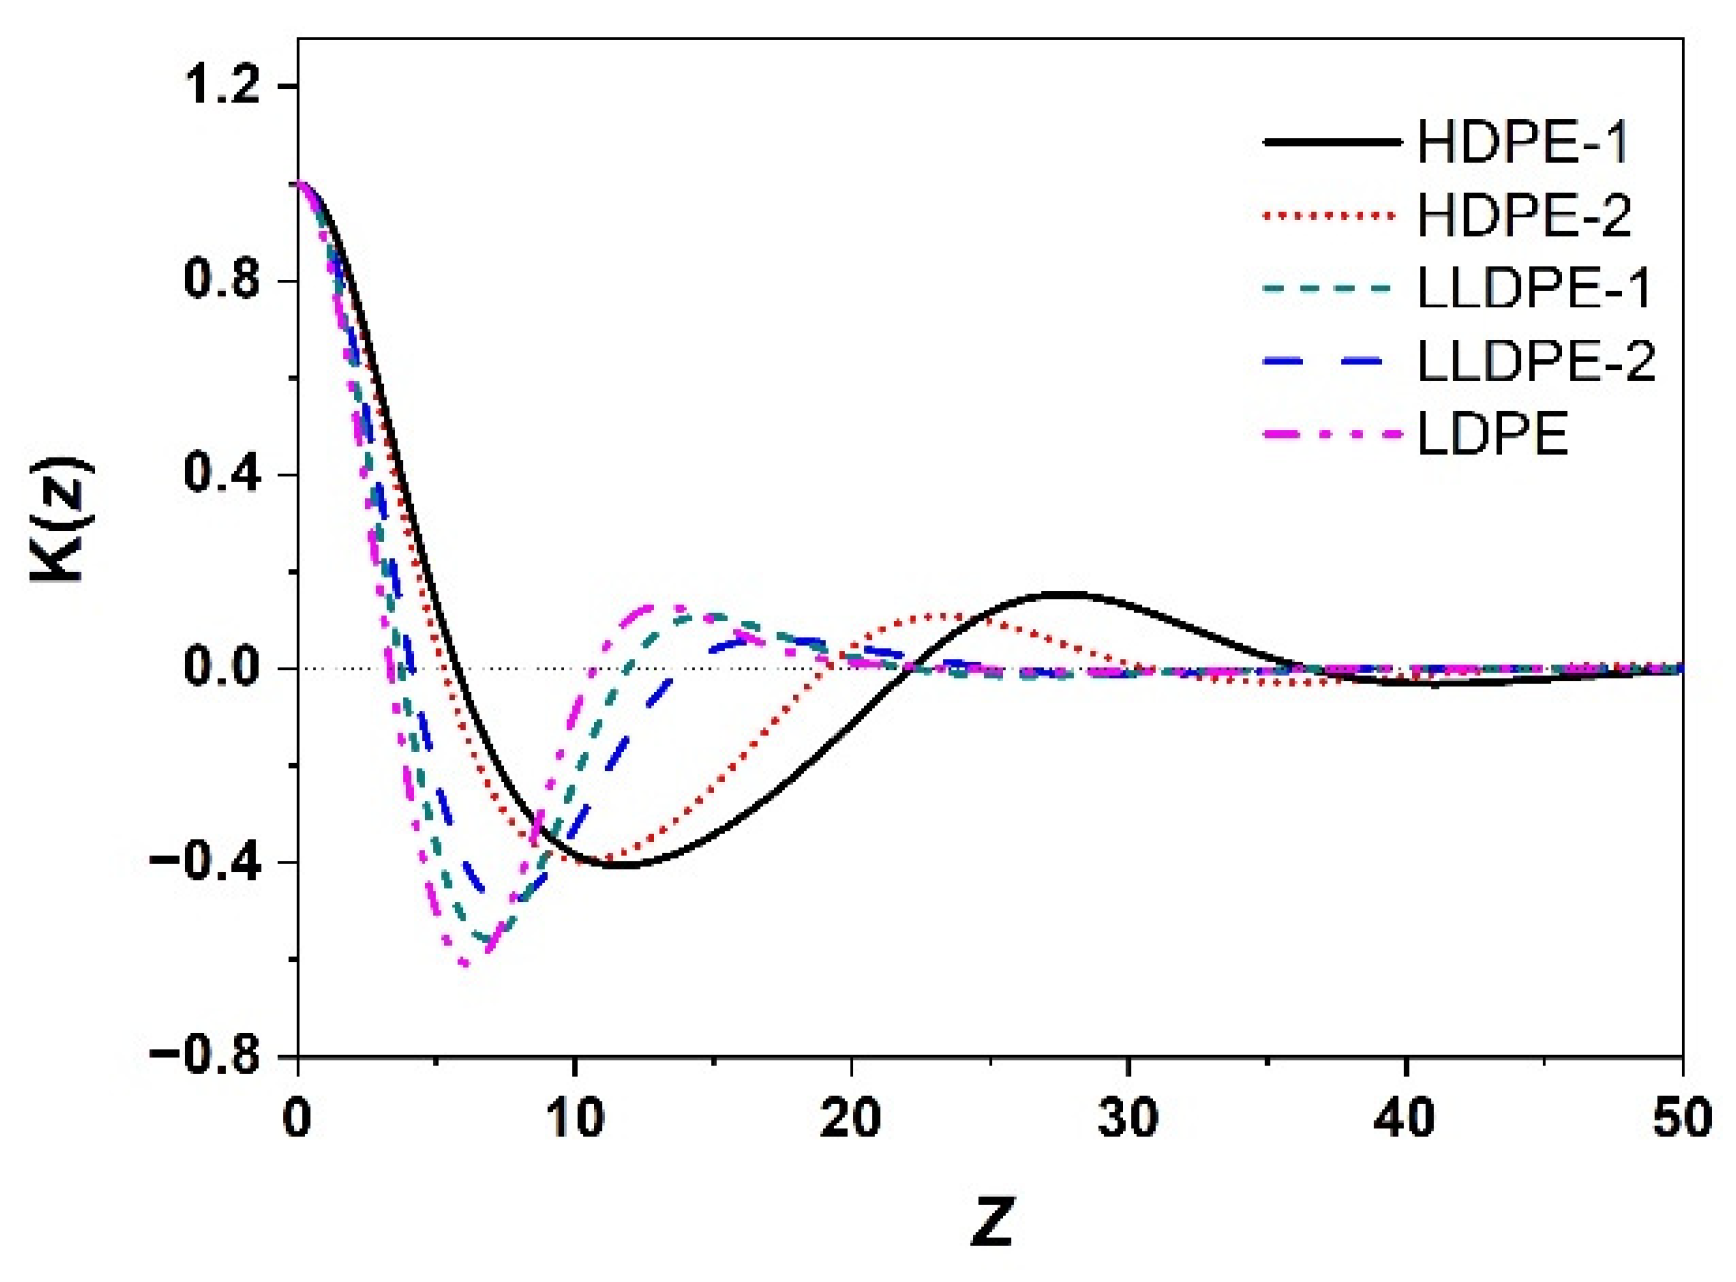
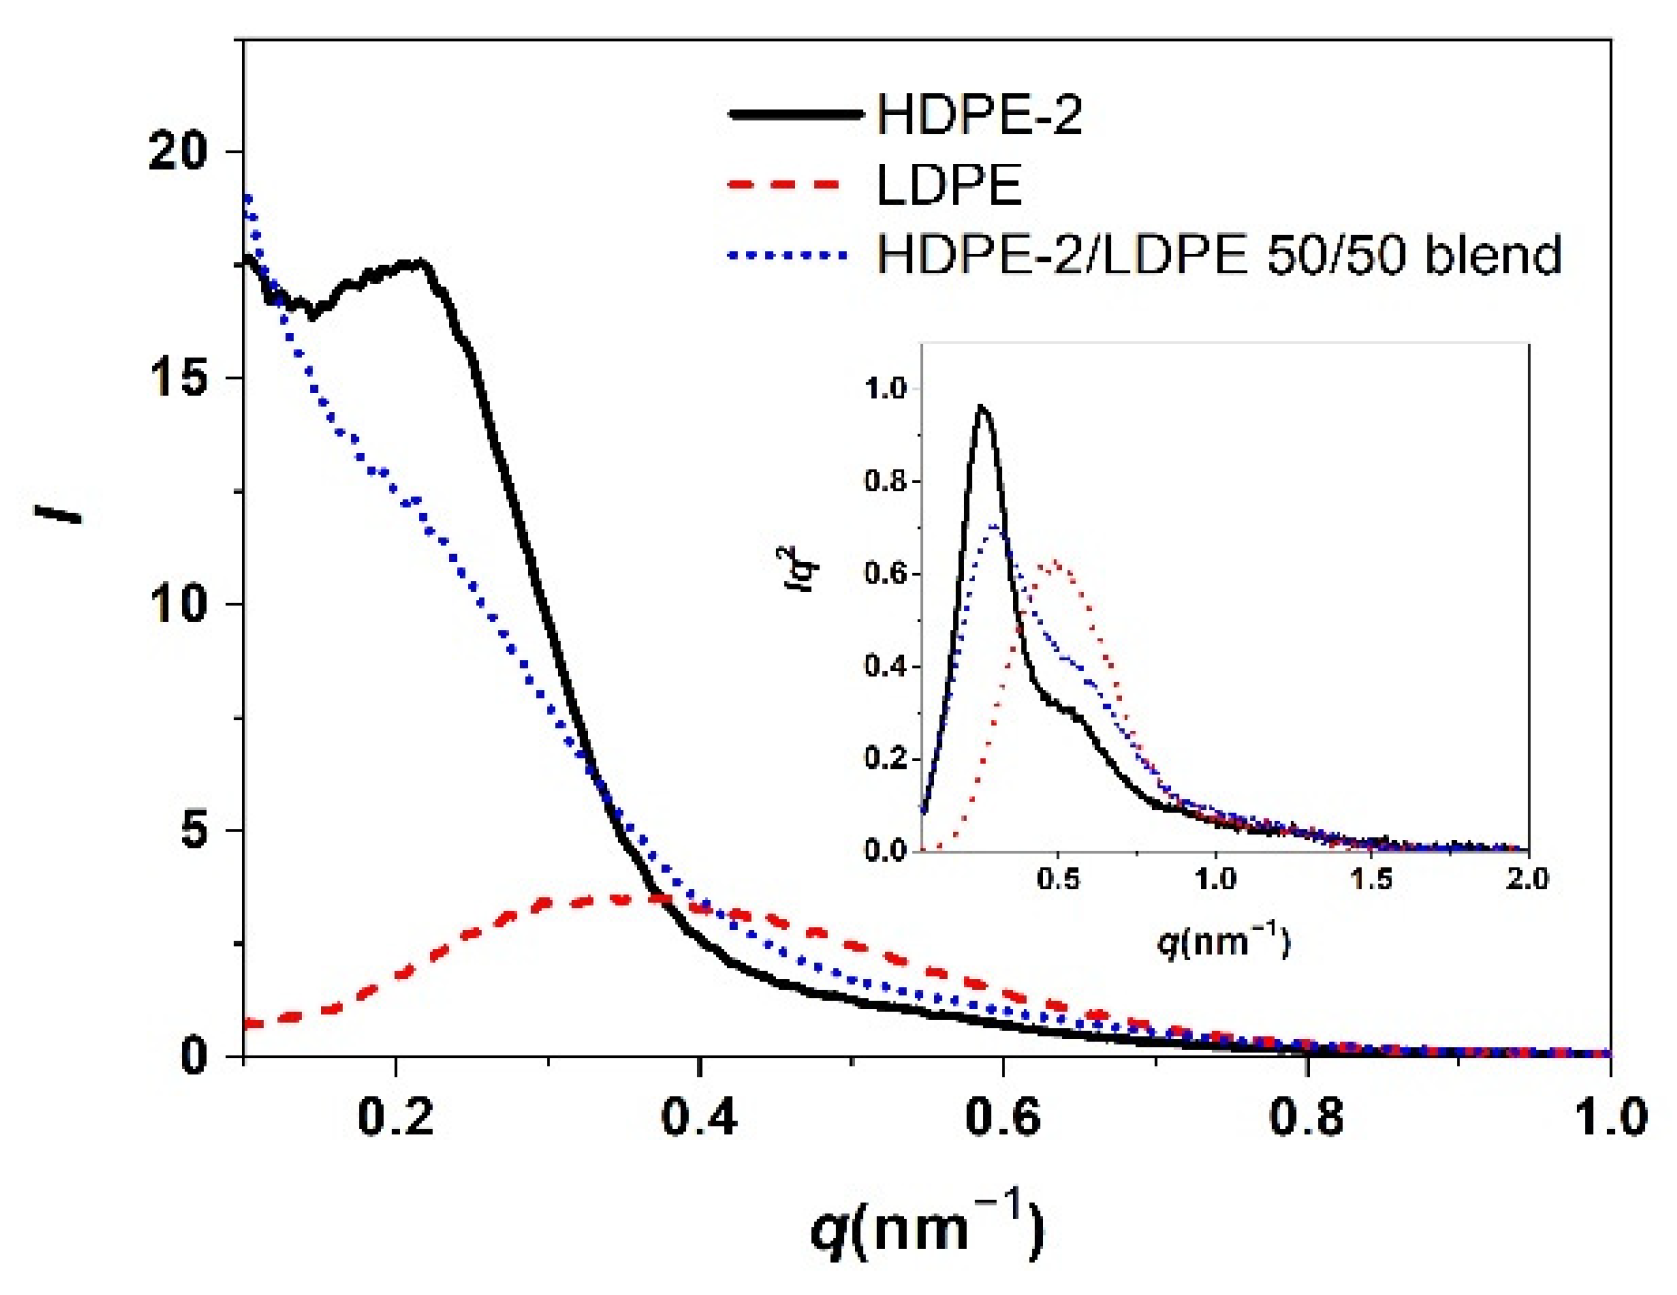
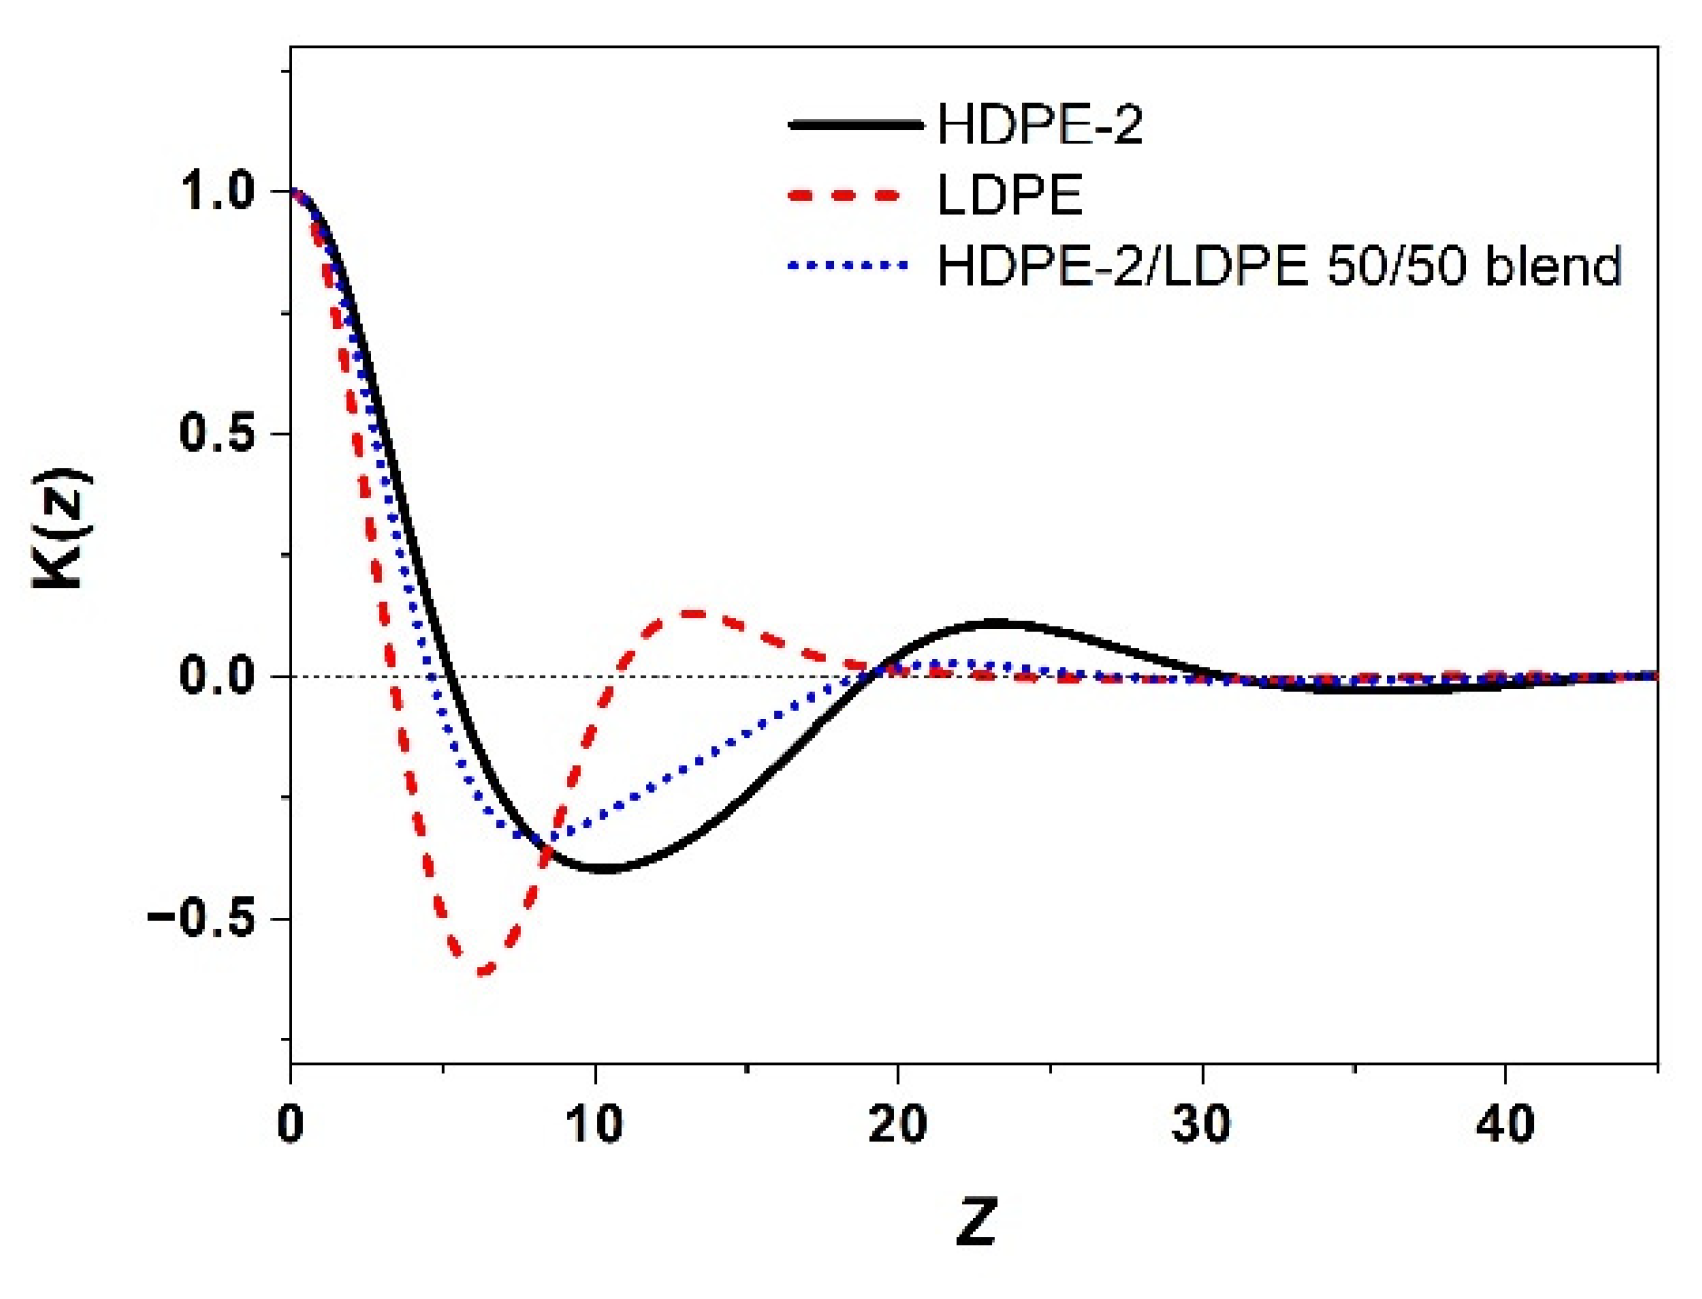
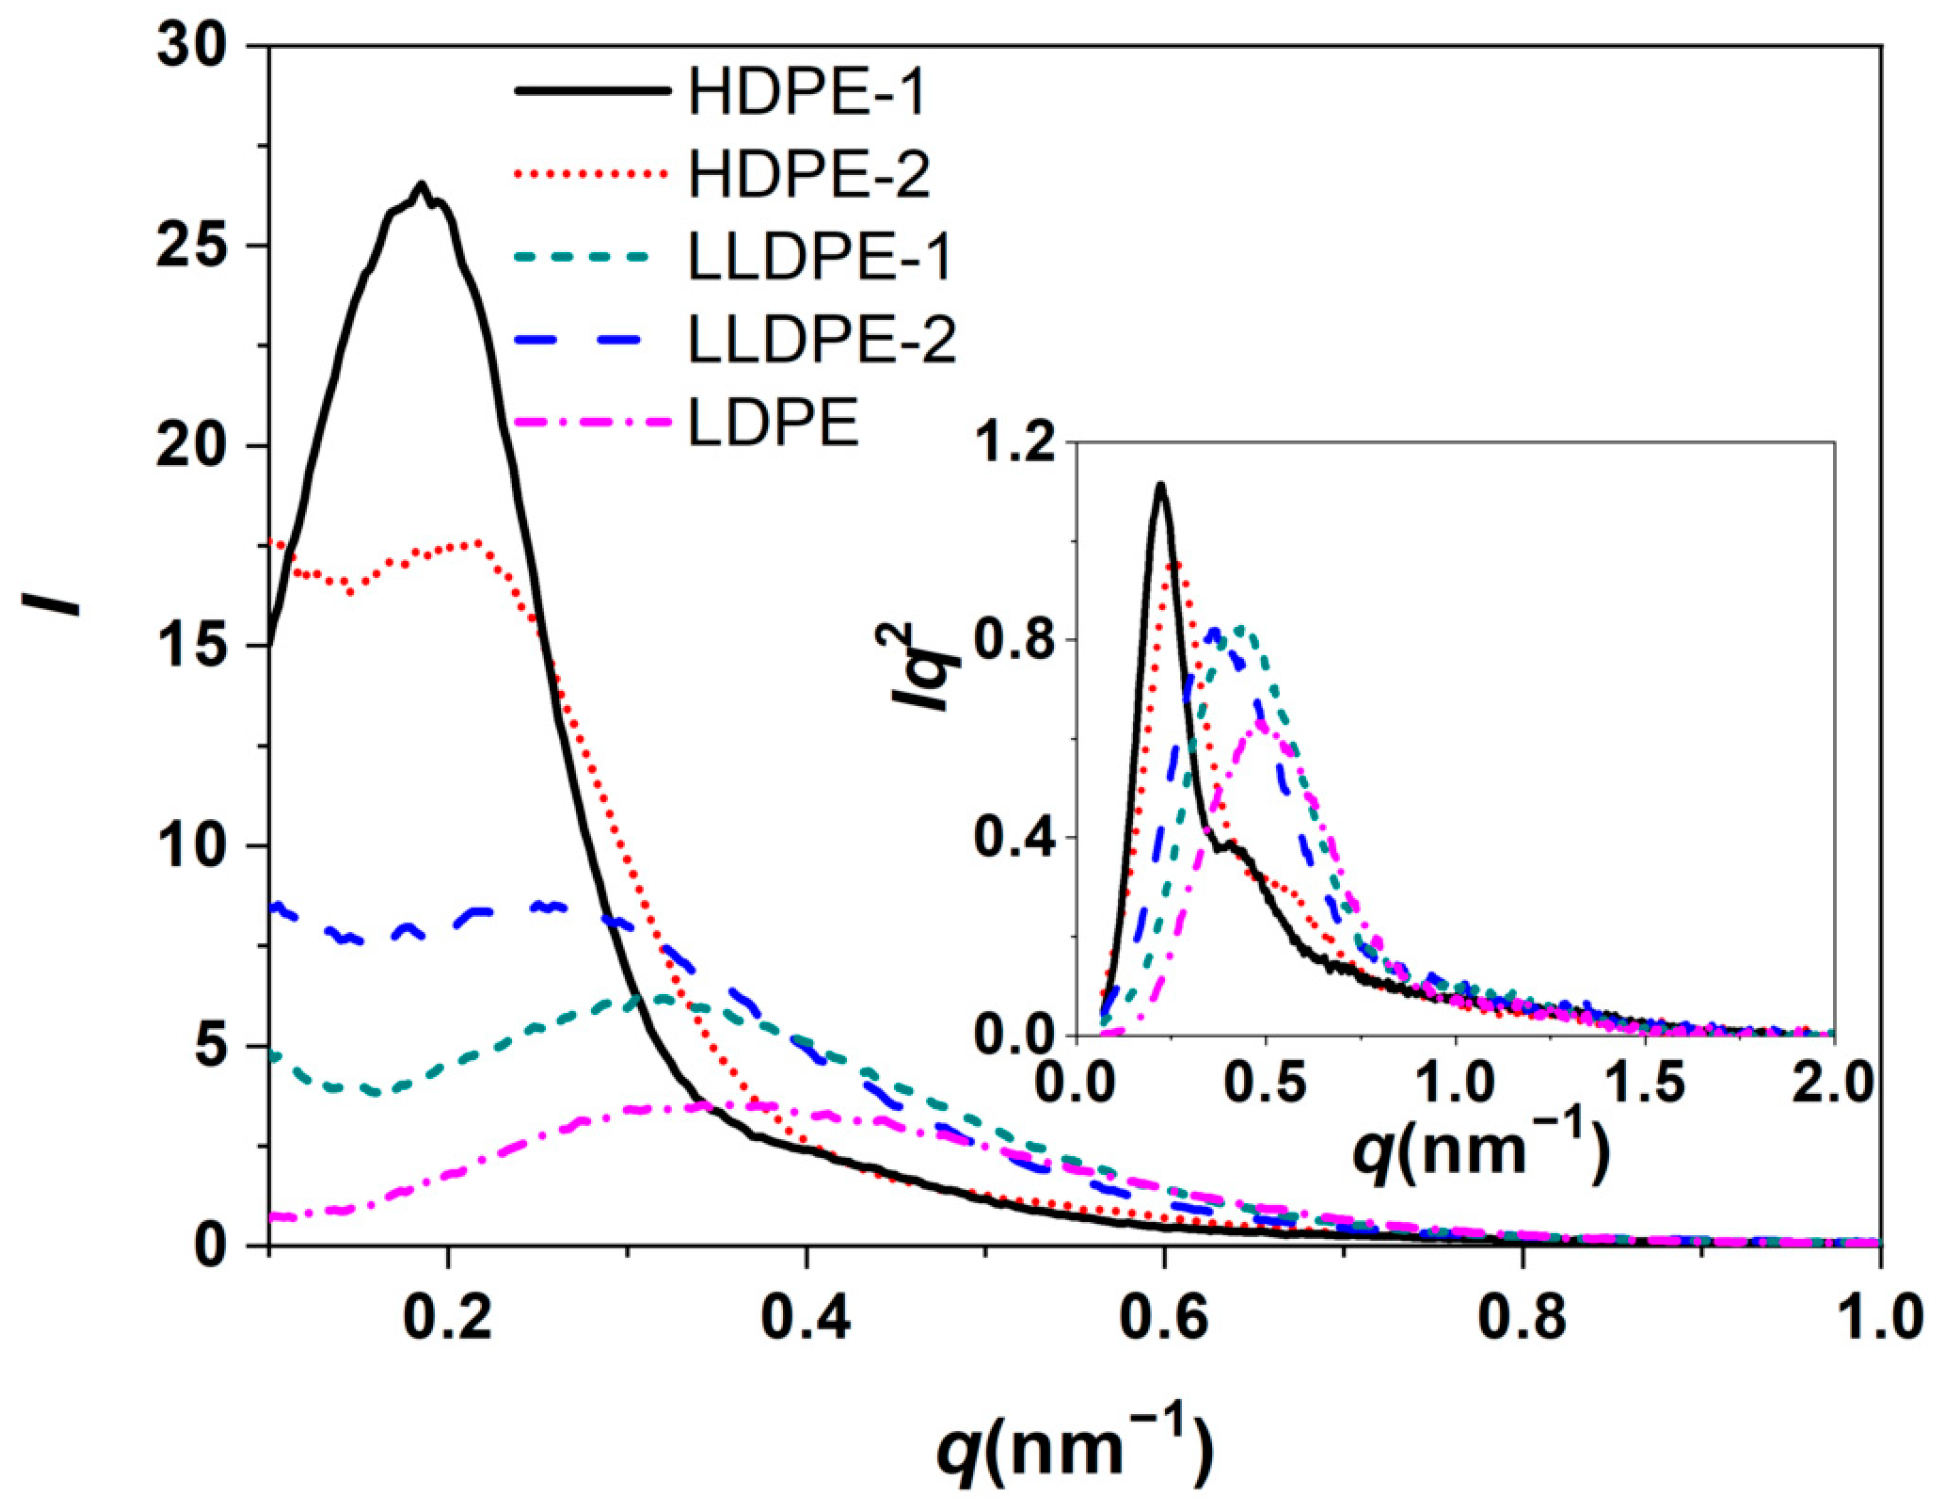
3.2. Correlation of PE Sequence Distribution from CRYSTAF and Lamellar Packing from SAXS for HDPE, LLDPE, and LDPE
3.3. Crystallization of Different PE Component in a Mixture of Different Types of PE and Its Lamellar Packing
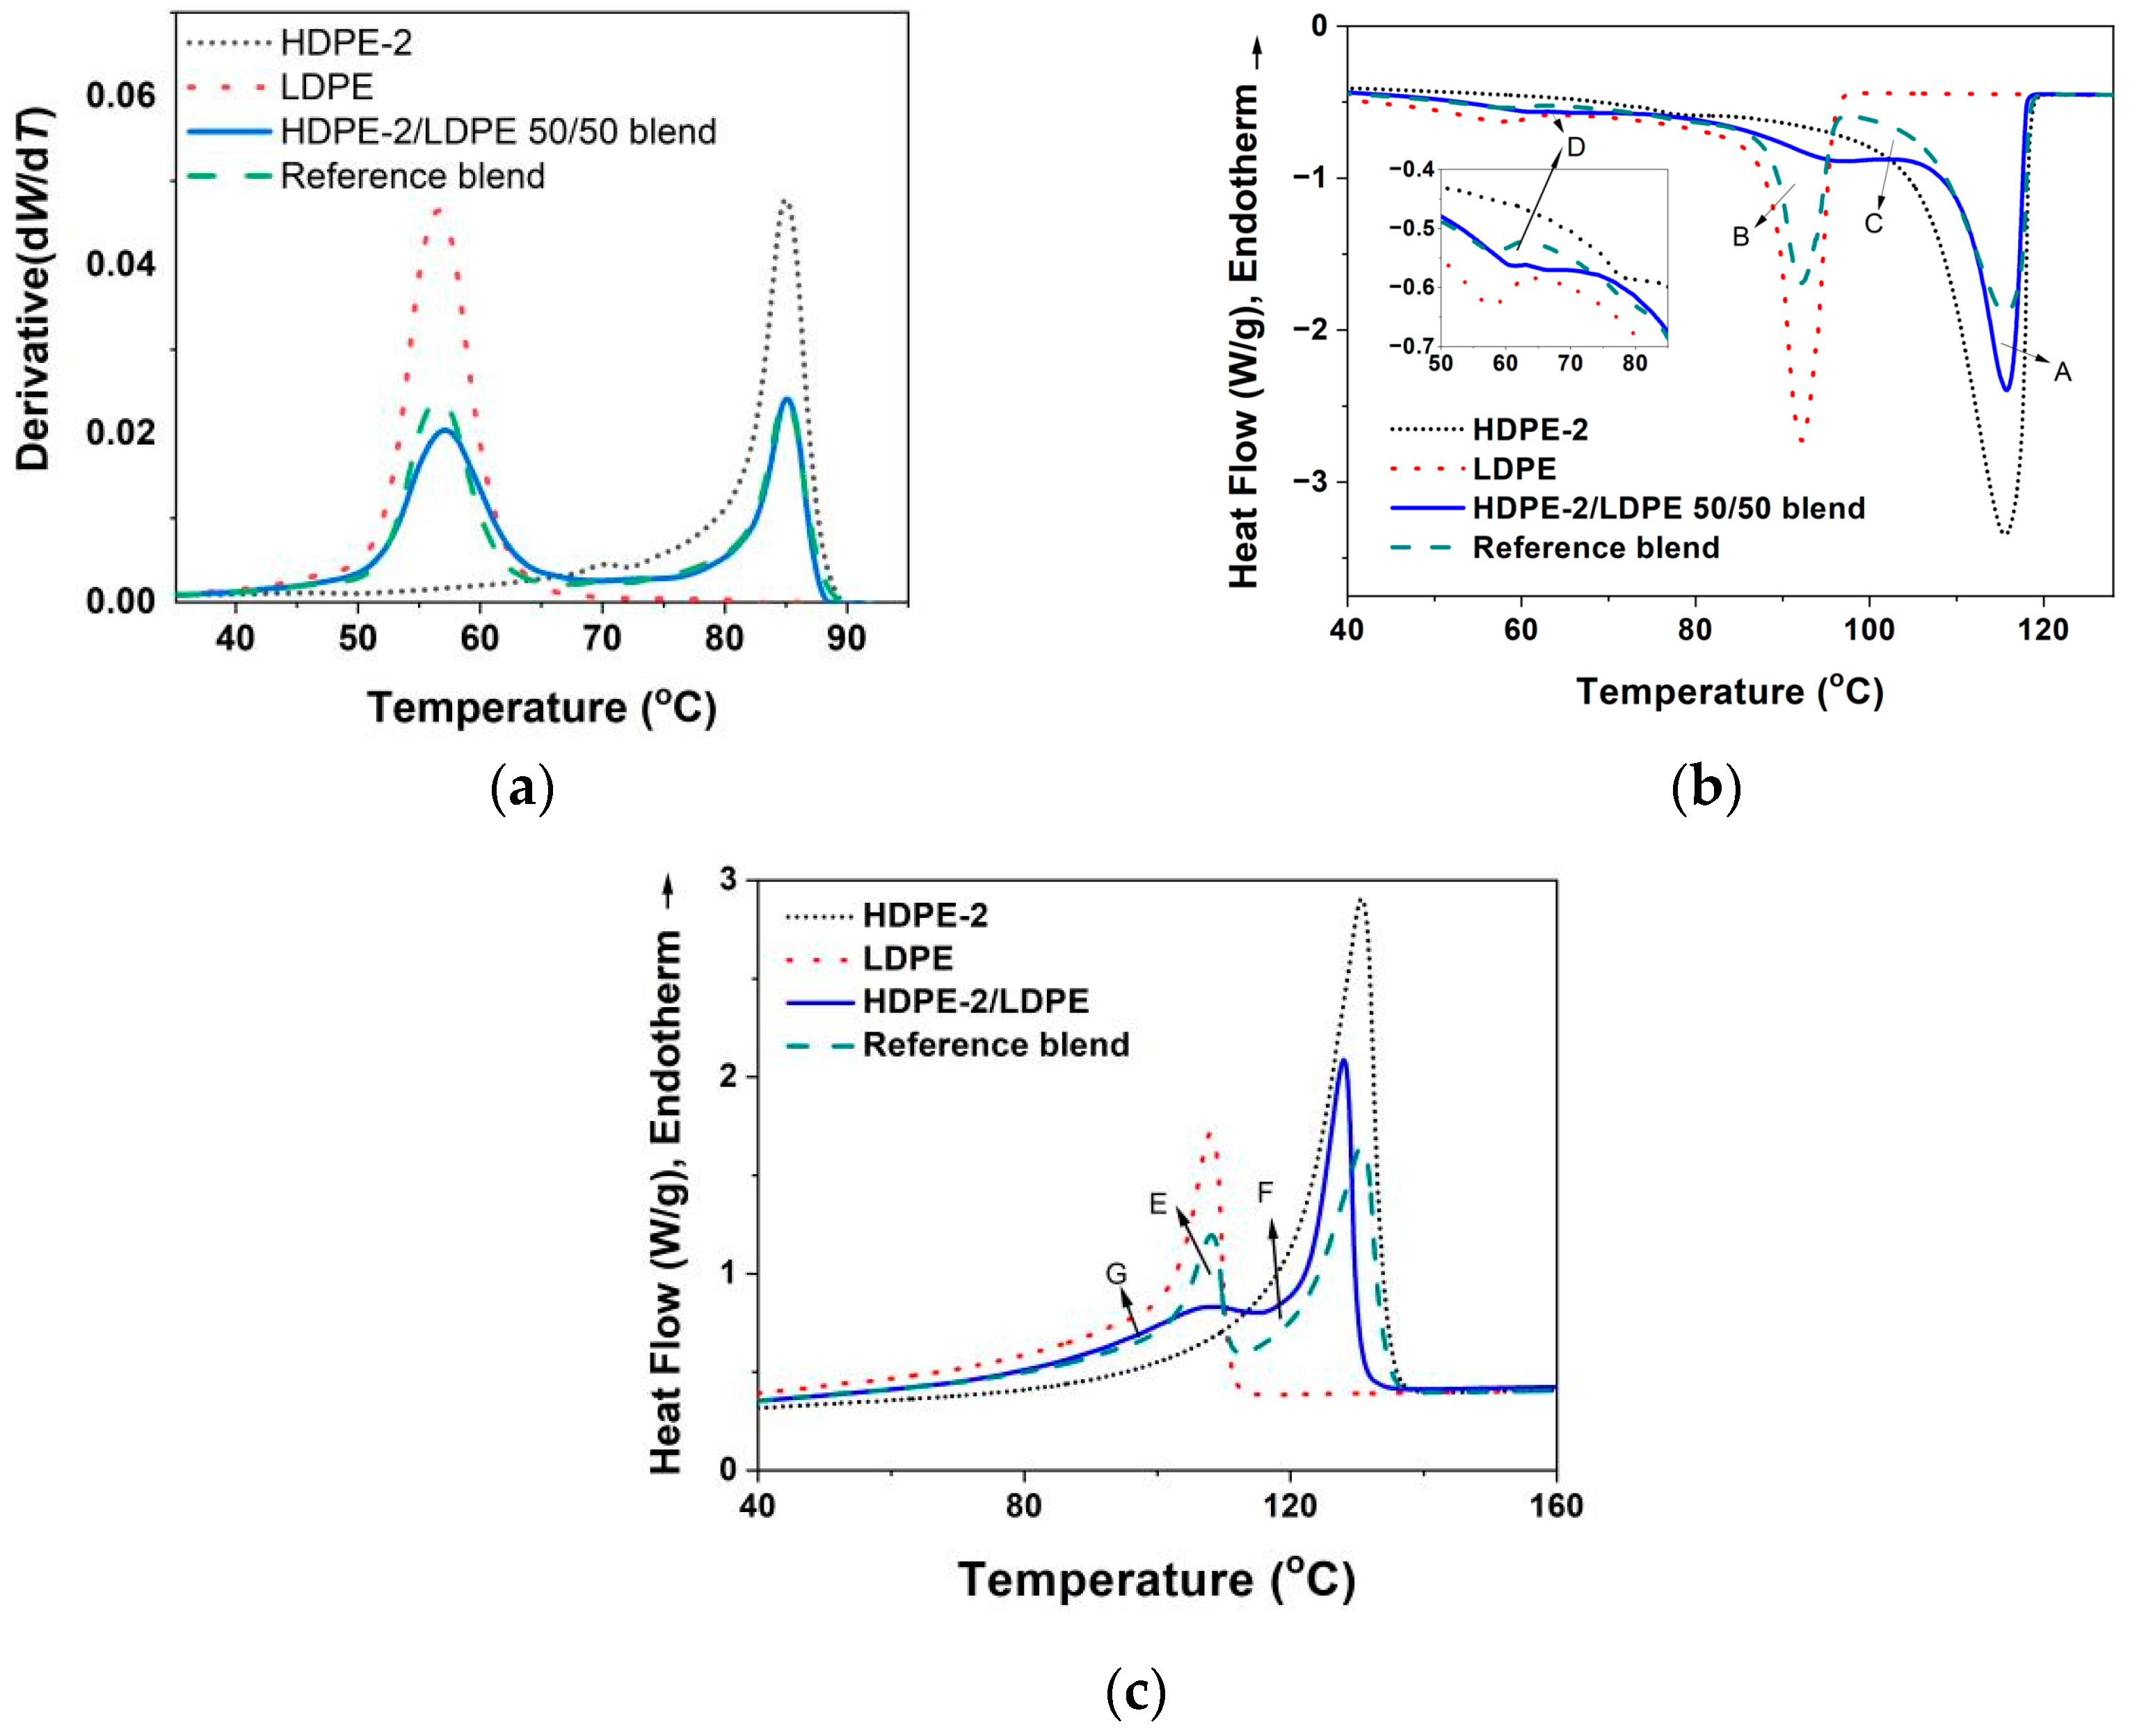
3.3.1. Crystallization of PE with Different Composition and Crystal Packing Structure in the HDPE-2/LDPE 50/50 Blend
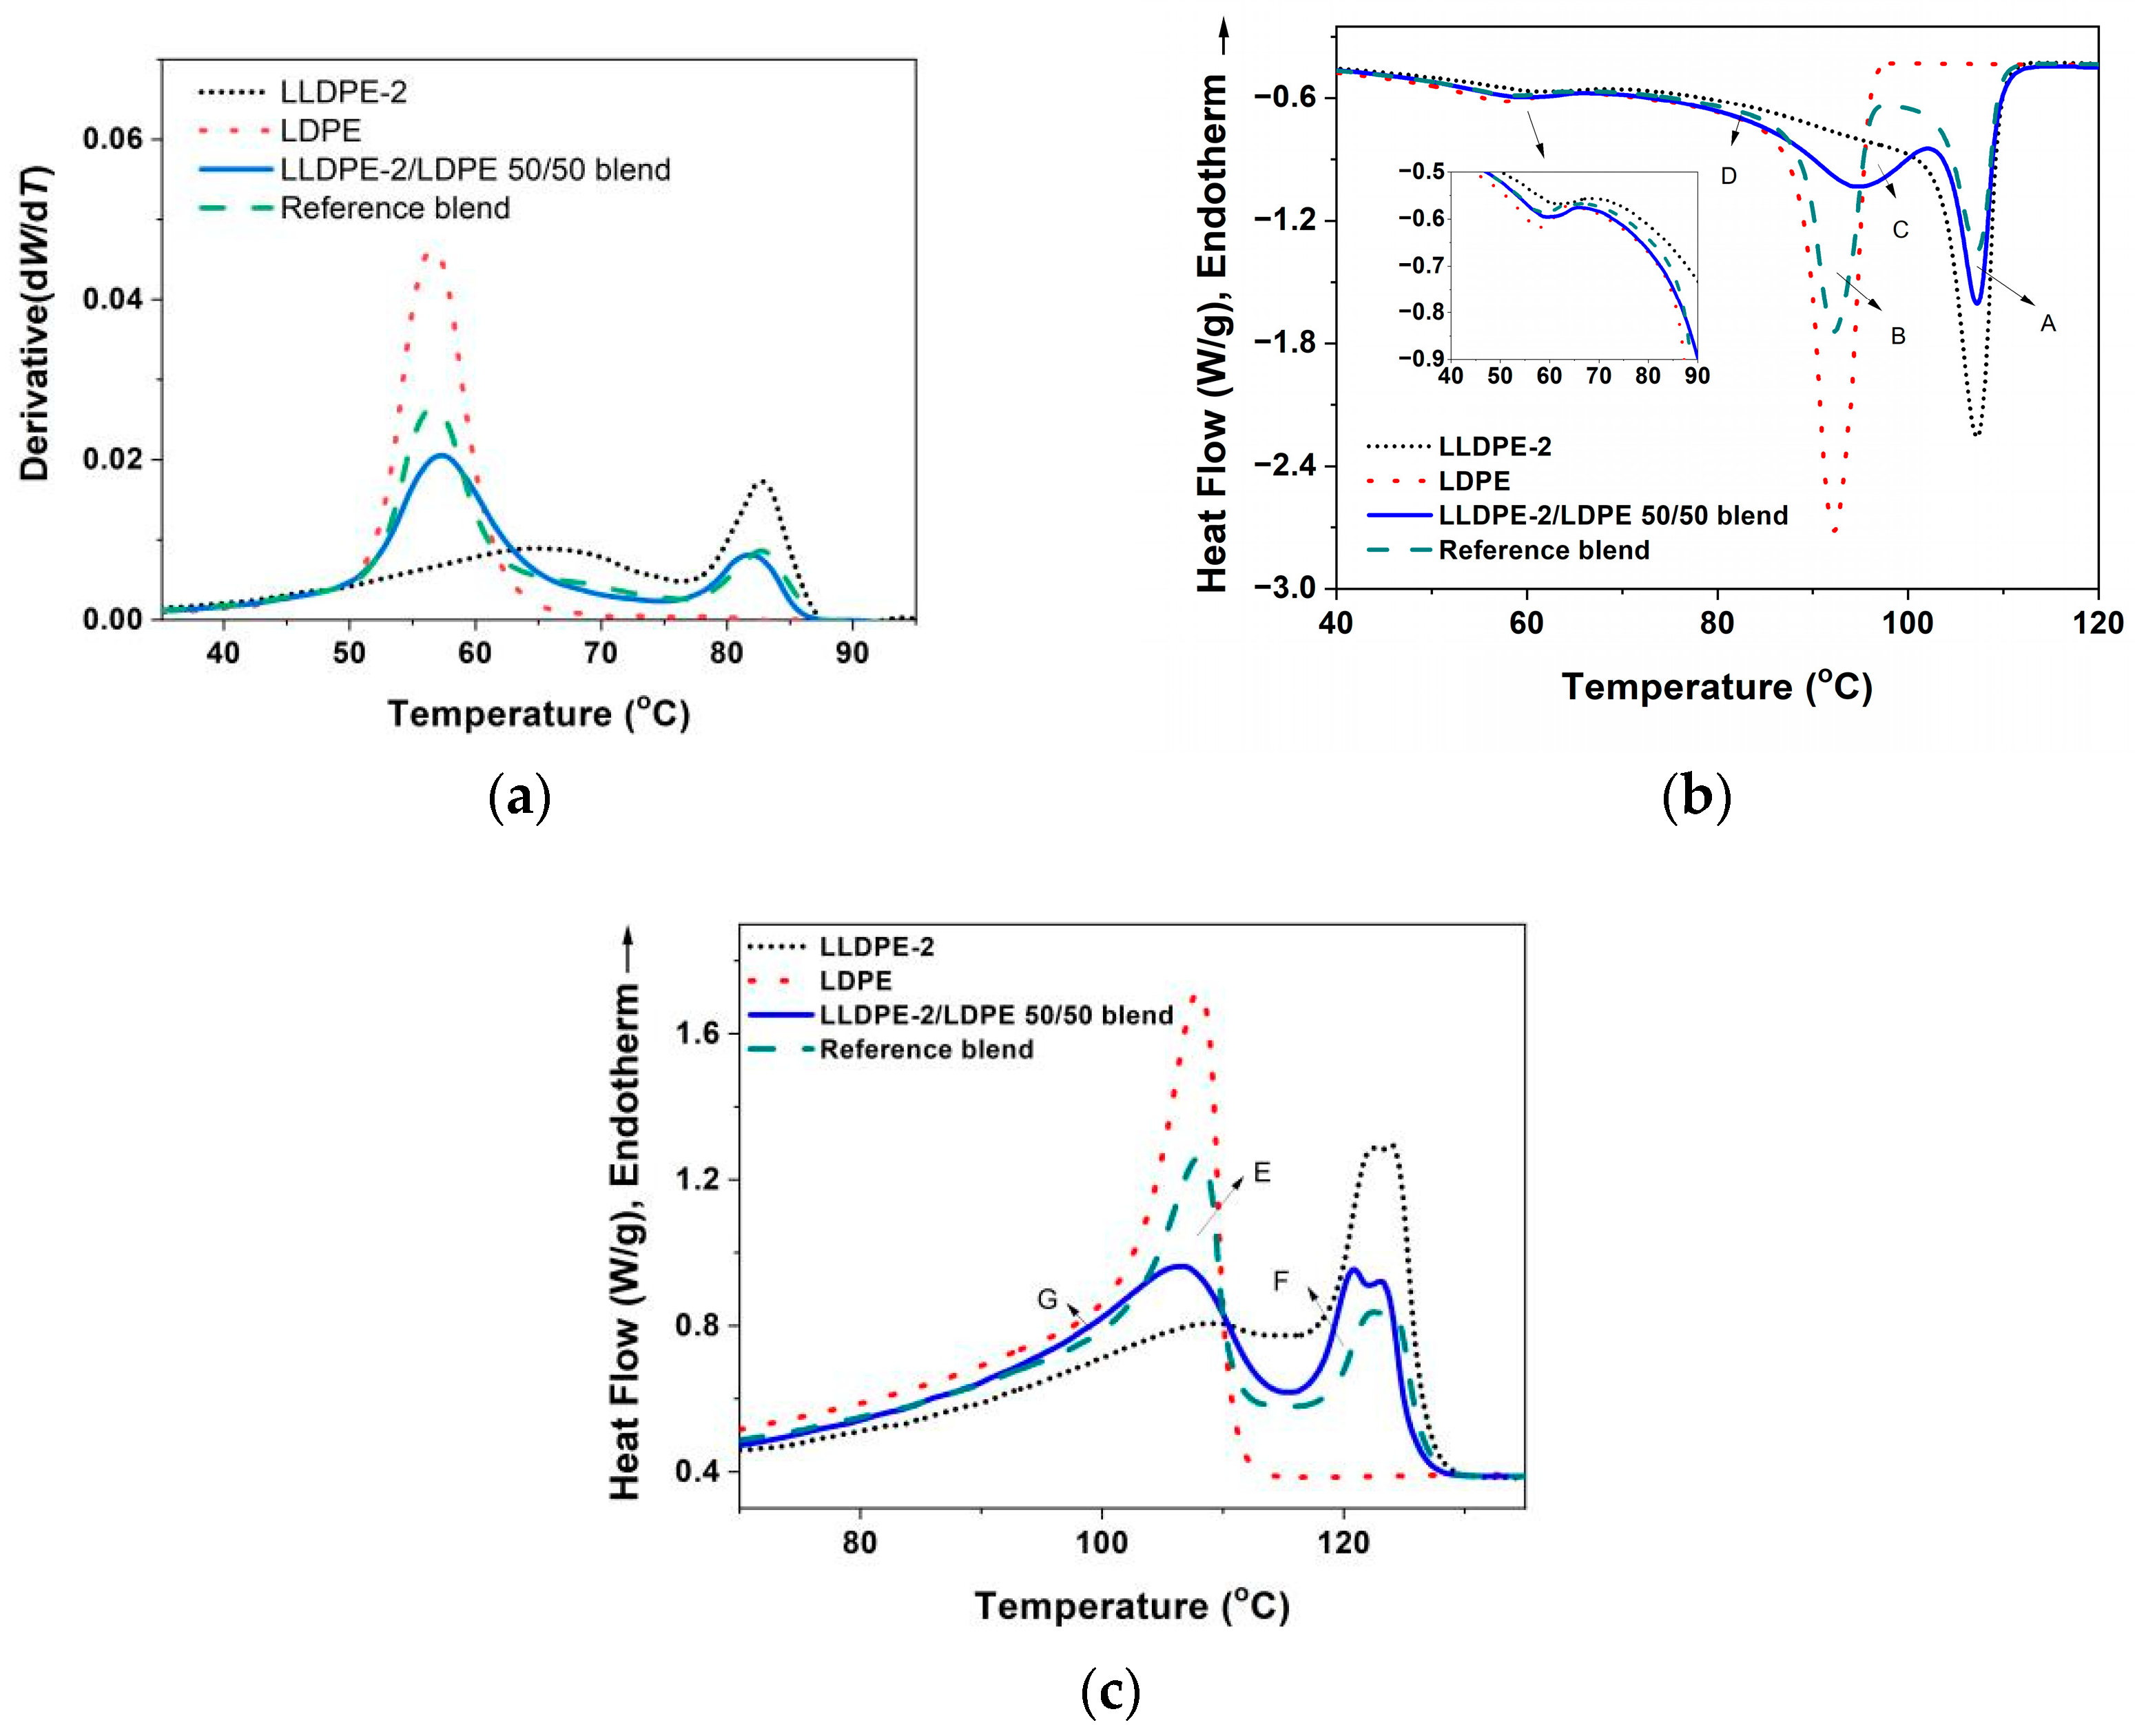
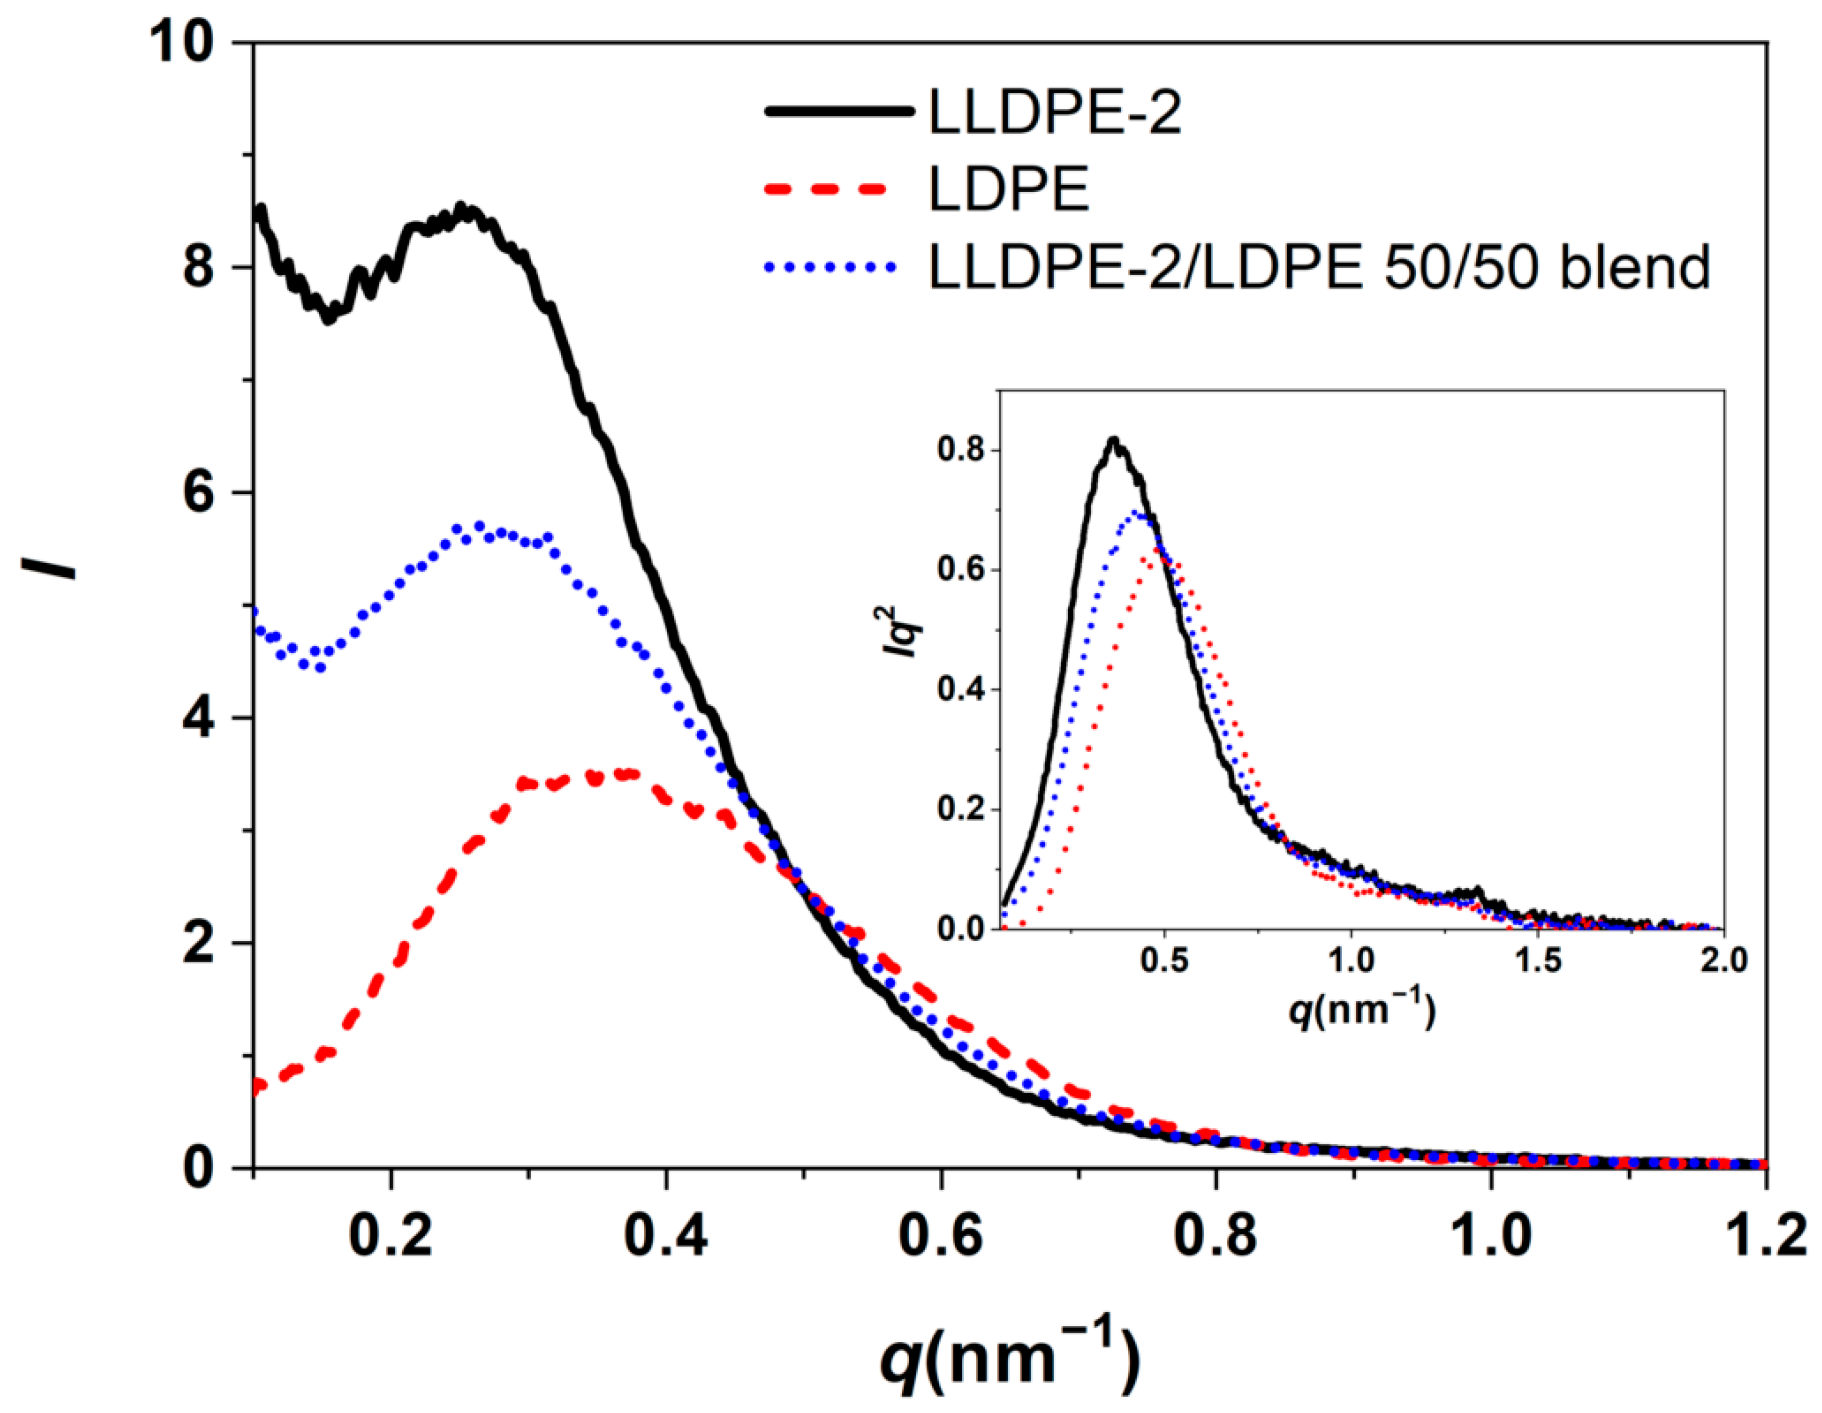
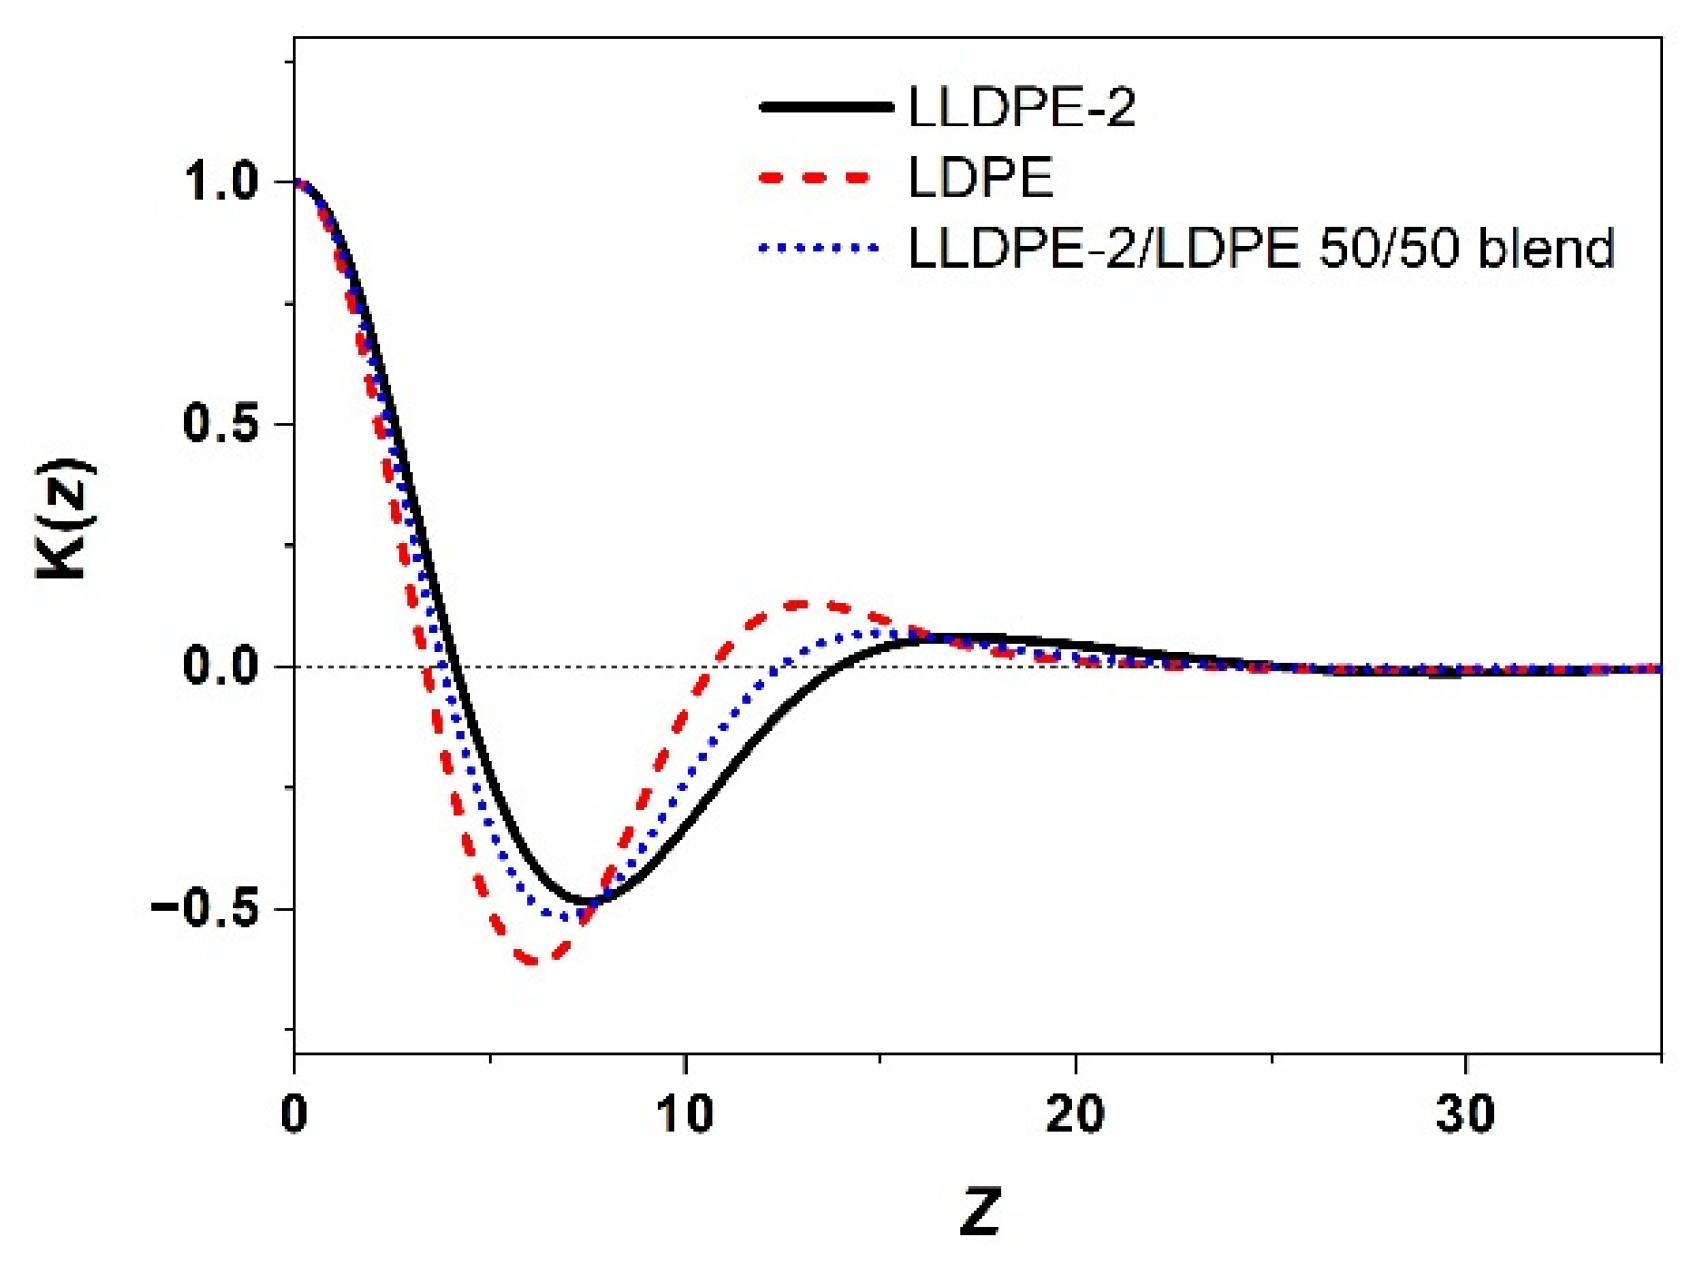
3.3.2. Crystallization of PE with Different Composition and Crystal Packing Structure in the LLDPE-2/LDPE 50/50 Blend
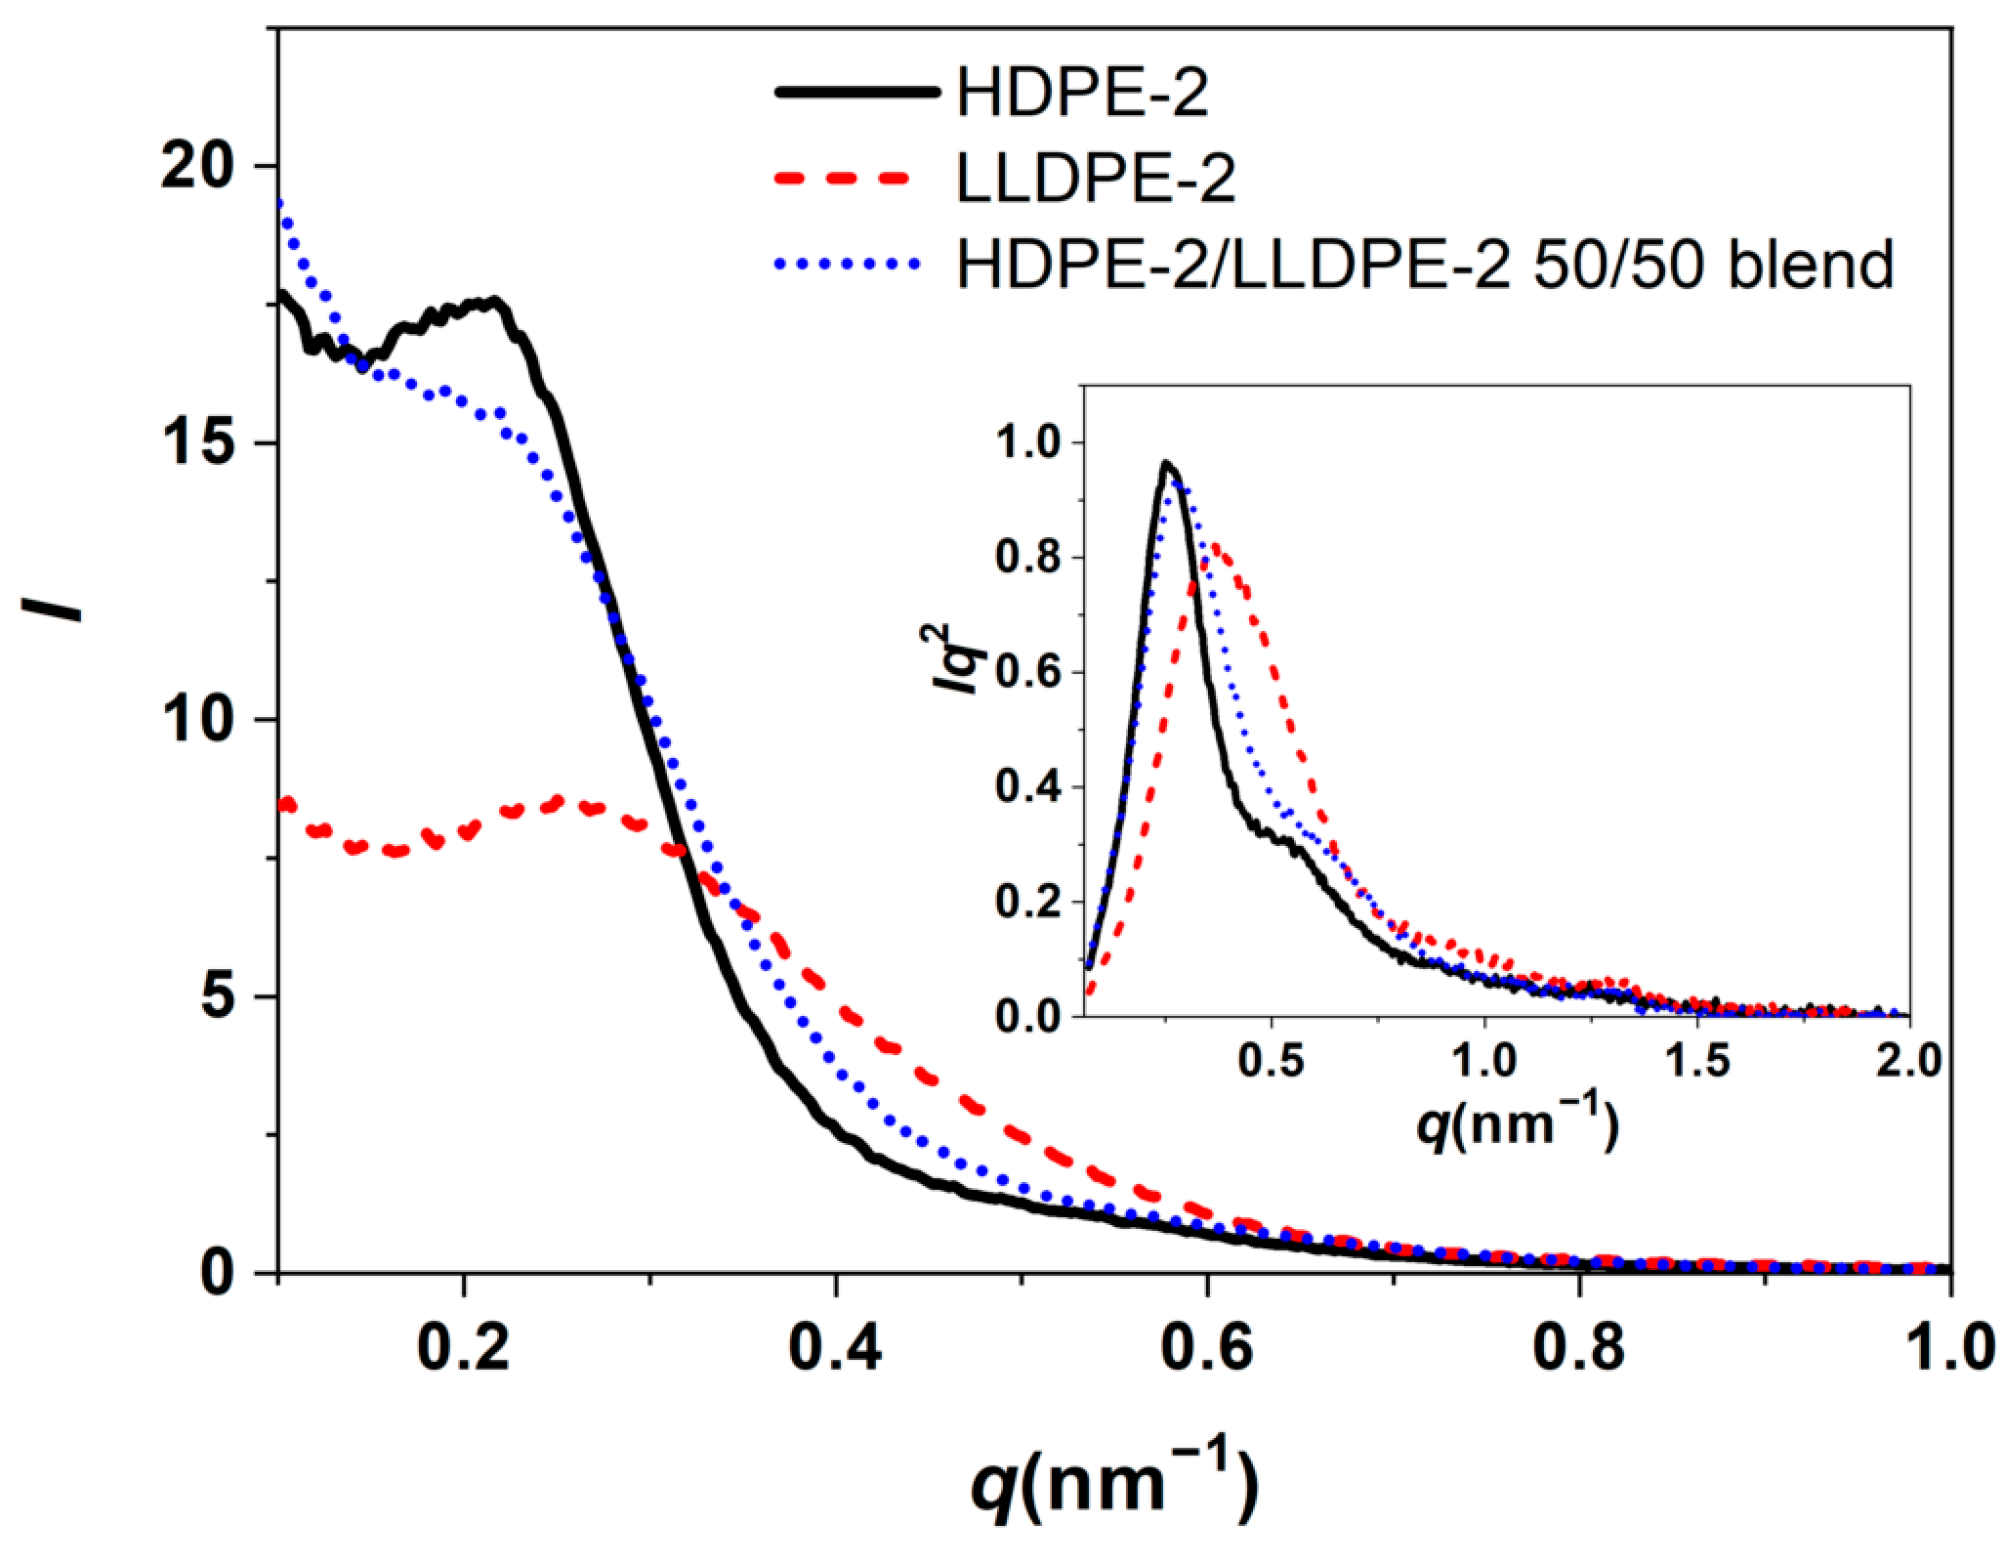
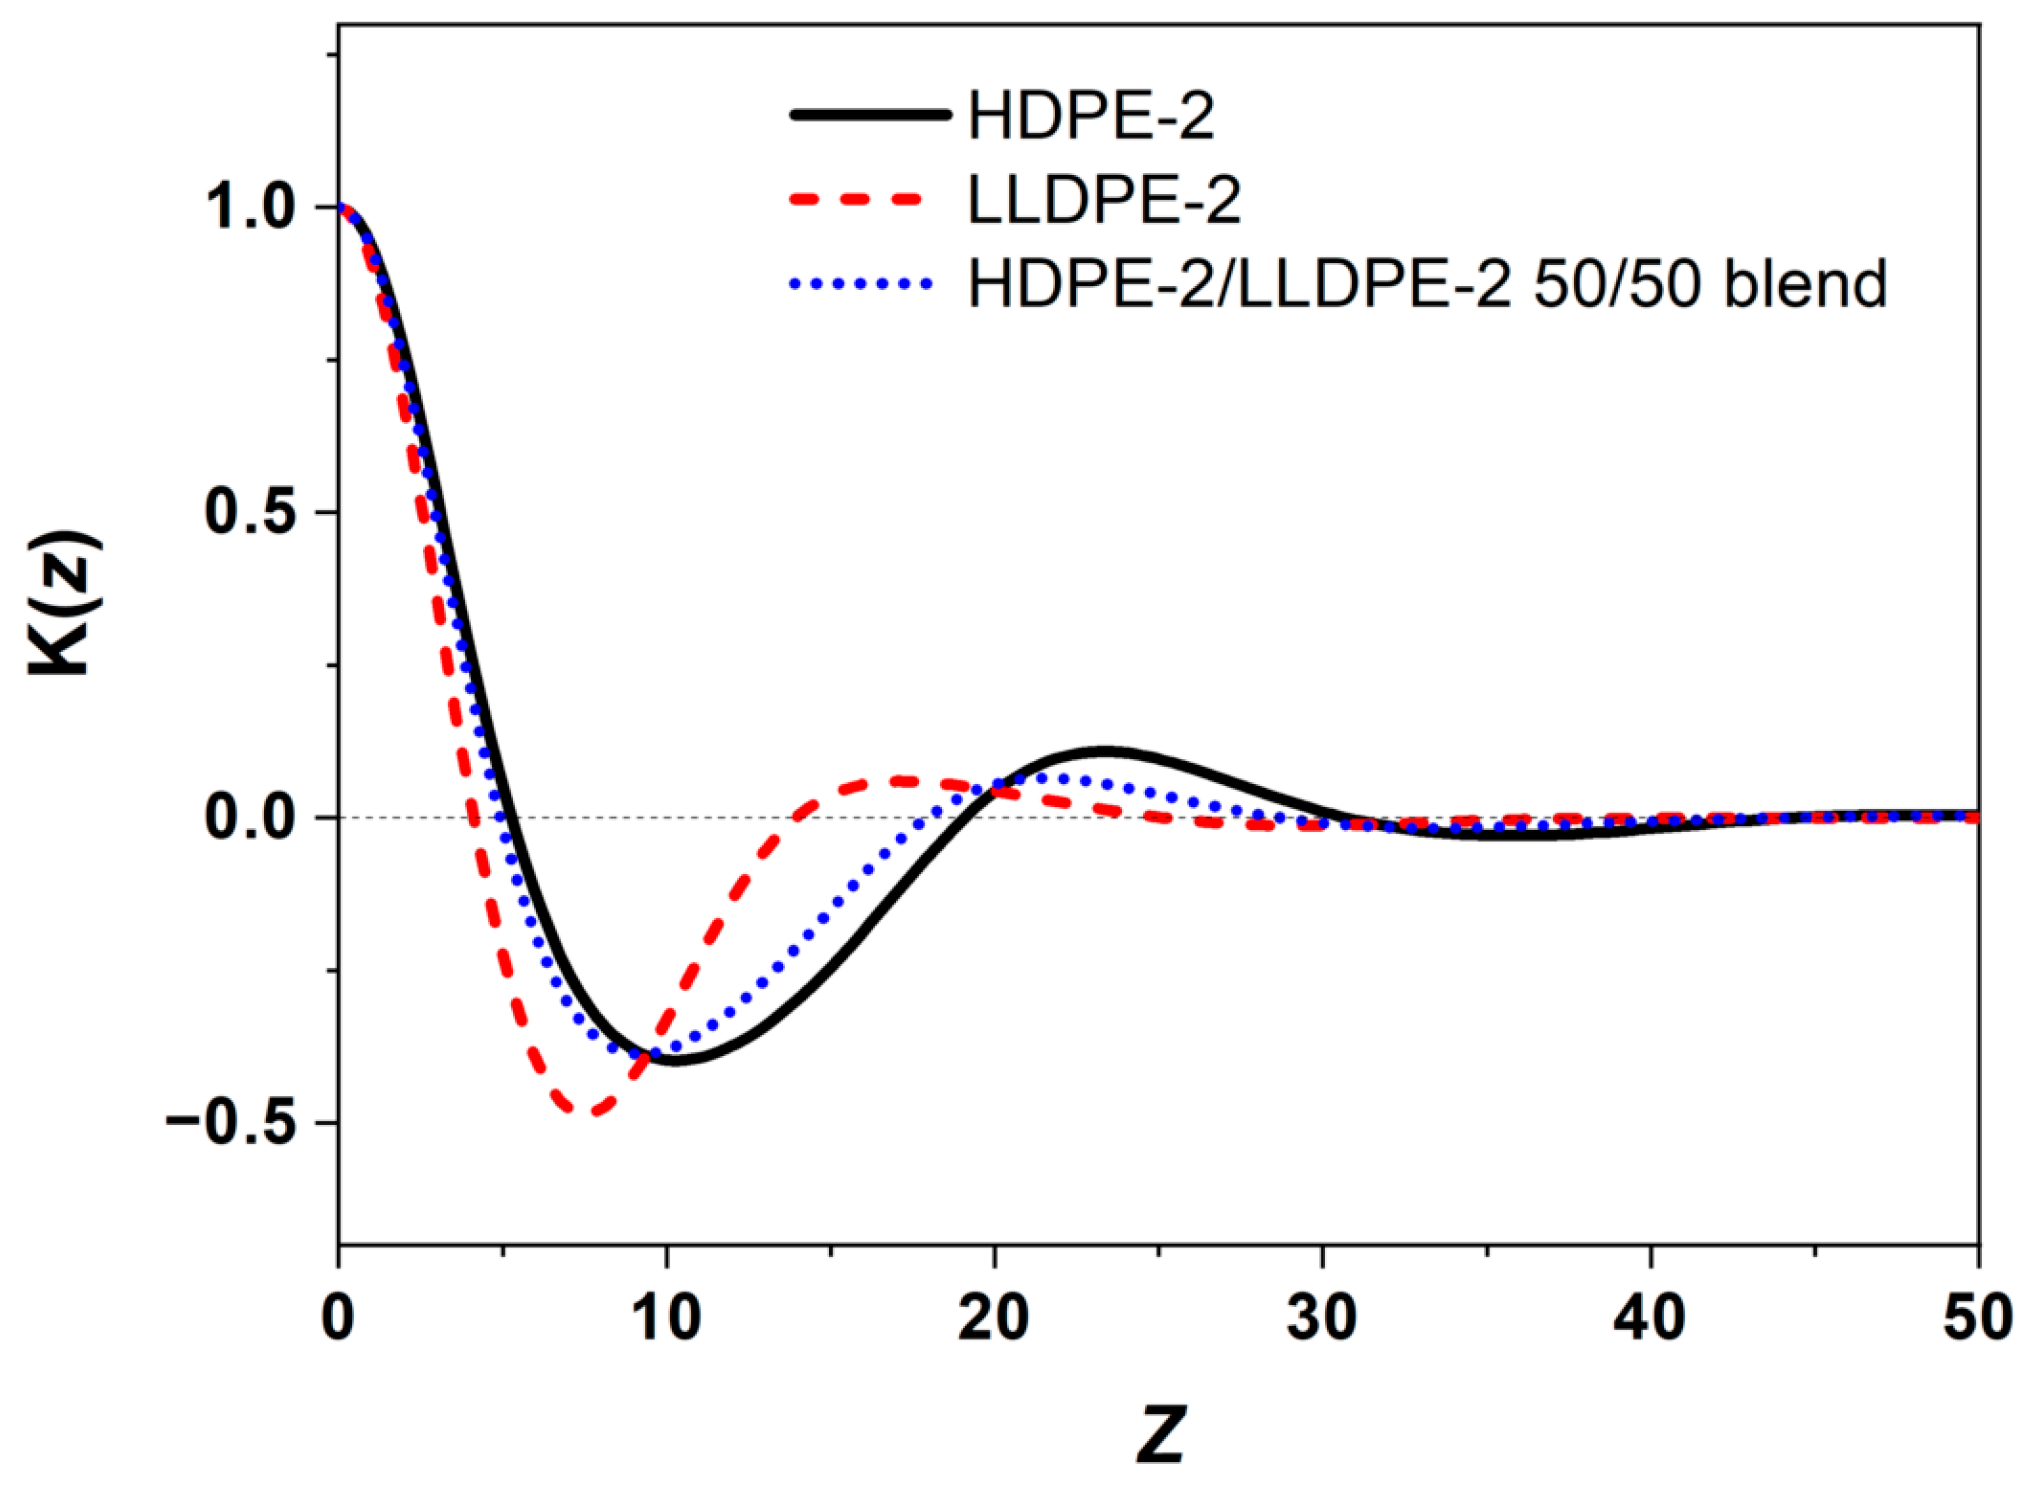
3.3.3. Crystallization of PE with Different Composition and Crystal Packing Structure in the HDPE-2/LLDPE-2 50/50 Blend
4. Conclusions
Author Contributions
Funding
Institutional Review Board Statement
Data Availability Statement
Acknowledgments
Conflicts of Interest
List of Abbreviations
| PE | polyethylene |
| HDPE | high-density polyethylene |
| LLDPE | linear low-density polyethylene |
| LDPE | low-density polyethylene |
| CRYSTAF | crystallization analysis fractionation |
| TREF | temperature rising elution fractionation |
| DSC | differential scanning calorimetry |
| SAXS | small-angle X-ray scattering |
| SANS | small-angle neutron scattering |
| SALS | small-angle light scattering |
| TEM | transmission electron microscopy |
References
- Burdett, I.D.; Eisinger, R.S. Ethylene polymerization processes and manufacture of polyethylene. In Handbook of Industrial Polyethylene and Technology; Spalding, M.A., Chatterjee, A.M., Eds.; John Wiley & Sons, Inc.: Hoboken, NJ, USA; Scrivener Publishing LLC: Beverly, MA, USA, 2017; Part 1, pp. 93–95. [Google Scholar]
- Peacock, A.J. Handbook of Polyethylene; Marcel Dekker, Inc.: New York, NY, USA, 2000; pp. 1–26. [Google Scholar]
- van Drongelen, M.; Roozemond, P.C.; Troisi, E.M.; Doufas, A.K.; Peters, G.W.M. Characterization of the primary and secondary crystallization kinetics of a linear low-density polyethylene in quiescent- and flow-conditions. Polymer 2015, 76, 254–270. [Google Scholar] [CrossRef]
- Anantawaraskul, S.; Soares, J.B.P.; Wood-Adams, P.M. Fractionation of semicrystalline polymers by crystallization analysis fractionation and temperature rising elution fractionation. Adv. Polym. Sci. 2005, 182, 1–54. [Google Scholar]
- Fu, Q.; Chiu, F.C.; He, T.B.; Liu, J.P.; Hsieh, E.T. Molecular heterogeneity of metallocene short-chain branched polyethylenes and their fractions. Macromol. Chem. Phys. 2001, 202, 927–932. [Google Scholar] [CrossRef]
- Chen, X.; López-Barrón, C.; Zeng, Y.; Alamo, R.G. Concentration fluctuations in the early stages of LLPS and partial dissolution of melt-memory in broadly distributed ethylene copolymers. Polymer 2018, 148, 181–190. [Google Scholar] [CrossRef]
- Chen, X.; Wignall, G.D.; He, L.; Lopez-Barron, C.; Alamo, R.G. SANS evidence of liquid-liquid phase separation leading to inversion of crystallization rate of broadly distributed random ethylene copolymers. Macromolecules 2017, 50, 4406–4414. [Google Scholar] [CrossRef]
- Ren, M.; Chen, X.; Sang, Y.; Alamo, R.G. Effect of heterogeneous short chain branching distribution on acceleration or retardation of the rate of crystallization from melts of ethylene copolymers synthesized with Ziegler-Natta catalysts. Macromol. Symp. 2015, 356, 131–141. [Google Scholar] [CrossRef]
- Nesarikar, A.; Crist, B.; Davidovich, A. Liquid–liquid phase separation in linear low-density polyethylene. J. Polym. Sci. B Polym. Phys. 1994, 32, 641–646. [Google Scholar] [CrossRef]
- Chum, P.S.; Swogger, K.W. Olefin polymer technologies-History and recent progress at the Dow Chemical Company. Prog. Polym. Sci. 2008, 33, 797–819. [Google Scholar] [CrossRef]
- Monrabal, B. Crystaf: Crystallization analysis fractionation. A new approach to the composition analysis of semicrystalline polymers. Macromol. Symp. 1996, 110, 81–86. [Google Scholar] [CrossRef]
- Xia, W.; Taniike, T.; Terano, M.; Fujitani, T.; Liu, B.P.; Soares, J.B.P. Crystaf analysis of polyethylene synthesized with Phillips catalyst. Macromol. Symp. 2009, 285, 74–80. [Google Scholar] [CrossRef]
- Soares, J.B.P.; Abbott, R.F.; Kimi, J.D. Environmental stress cracking resistance of polyethylene: The use of Crystaf and SEC to establish structure-property relationships. J. Polym. Sci. B Polym. Phys. 2000, 38, 1267–1275. [Google Scholar] [CrossRef]
- Anantawaraskul, S.; Soares, J.B.P.; Jirachaithorn, P.; Limtrakul, J. Mathematical modeling of crystallization analysis fractionation (Crystaf) of polyethylene. J. Polym. Sci. B Polym. Phys. 2006, 44, 2749–2759. [Google Scholar] [CrossRef]
- Kelusky, E.C.; Elston, C.T.; Murray, R.E. Characterizing polyethylene-based blends with temperature rising elution fractionation (TREF) techniques. Polym. Eng. Sci. 1987, 27, 1562–1571. [Google Scholar] [CrossRef]
- Zhang, M.Q.; Lynch, D.T.; Wanke, S.E. Characterization of commercial linear low-density polyethylene by TREF-DSC and TREF-SEC cross-fractionation. J. Appl. Polym. Sci. 2000, 75, 960–967. [Google Scholar] [CrossRef]
- Ramachandran, R.; Beaucage, G.; McFaddin, D.; Merrick-Mack, J.; Galiatsatos, V.; Mirabella, F. Branch length distribution in TREF fractionated polyethylene. Polymer 2011, 52, 2661–2666. [Google Scholar] [CrossRef]
- Pasch, H.; Brull, R.; Wahner, U.; Monrabal, B. Analysis of polyolefin blends by crystallization analysis fractionation. Macromol. Mater. Eng. 2000, 279, 46–51. [Google Scholar] [CrossRef]
- Jeremic, L.; Albrecht, A.; Sandholzer, M.; Gahleitner, M. Rapid characterization of high-impact ethylene-propylene copolymer composition by crystallization extraction separation: Comparability to standard separation methods. Int. J. Polym. Anal. Charact. 2020, 25, 581–596. [Google Scholar] [CrossRef]
- Shanks, R.A. Miscibility, morphology, and properties of polyethylene blends. In Polyolefin Blends; Nwabunma, D., Kyu, T., Eds.; John Wiley & Sons, Inc.: Hoboken, NJ, USA, 2007; Chapter 3; pp. 59–72. [Google Scholar]
- Zhao, L.; Choi, P. A Review of the Miscibility of Polyethylene Blends. Mater. Manuf. Process. 2006, 21, 135–142. [Google Scholar] [CrossRef]
- Mohammadi, M.; Yousefi, A.A.; Ehsani, M. Study of the thermal and mechanical properties of blown films of high- and low-density polyethylene blends. J. Appl. Polym. Sci. 2012, 125, 755–767. [Google Scholar] [CrossRef]
- Munaro, M.; Akcelrud, L. Polyethylene blends: A correlation study between morphology and environmental resistance. Polym. Degrad. Stab. 2008, 93, 43–49. [Google Scholar] [CrossRef]
- Torres, A.; Colls, N.; Mendez, F. Properties predictor for HDPE/LDPE/LLDPE blends for shrink film applications. J. Plast. Film Sheeting 2006, 22, 29–37. [Google Scholar] [CrossRef]
- Garcia, R.A.; Carrero, A.; Martin, C.; Dominguez, C. Effects of the structural components on slow crack growth process in polyethylene blends. Composition intervals prediction for pipe applications. J. Appl. Polym. Sci. 2011, 121, 3269–3276. [Google Scholar] [CrossRef]
- Liang, S.; Wang, K.; Tang, C.; Zhang, Q.; Du, R.; Fu, Q. Unexpected molecular weight dependence of shish-kebab structure in the oriented linear low density polyethylene/high density polyethylene blends. J. Chem. Phys. 2008, 128, 174902. [Google Scholar] [CrossRef] [PubMed]
- Najarzadeh, Z.; Ajji, A.; Bruchet, J.B. Interfacial self-adhesion of polyethylene blends: The role of long chain branching and extensional rheology. J. Rheol. Acta 2015, 54, 377–389. [Google Scholar] [CrossRef]
- Donatella, D.; Amalia, M.; Sossio, C.; Clara, S.; Finizia, A.; Claudio, D.R.; Beniamino, P.; Robert, M.G. Structure-property relationships in polyethylene based films obtained by blow molding as model system of industrial relevance. Eur. Polym. J. 2015, 62, 97–107. [Google Scholar]
- Savargaonkar, N.; Patel, R.M.; Karjala, T.; Salibi, P.; Liu, L. Formulating LLDPE/LDPE blends for abuse–resistant blown film. Plast. Technol. 2014, 60, 44. [Google Scholar]
- Crist, B.; Hill, M.J. Recent developments in phase separation of polyolefin melt blends. J. Polym. Sci. B Polym. Phys. 1997, 35, 2329–2353. [Google Scholar] [CrossRef]
- Agamalian, M.; Alamo, R.G.; Kim, M.H.; Londono, J.D.; Mandelkern, L.; Wignall, G.D. Phase behavior of blends of linear and branched polyethylenes on micron length scales via ultra-small-angle neutron scattering. Macromolecules 1999, 32, 3093–3096. [Google Scholar] [CrossRef]
- Balsara, N.P.; Fetters, L.J.; Hadjichristidis, N.; Lohse, D.J.; Han, C.C.; Graessley, W.W.; Krishnamoorti, R. Thermodynamic interactions in model polyolefin blends obtained by small-angle neutron scattering. Macromolecules 1992, 25, 6137–6147. [Google Scholar] [CrossRef]
- Wignall, G.D.; Alamo, R.G.; Londono, J.D.; Mandelkern, L.; Kim, M.H.; Lin, J.S.; Brown, G.M. Morphology of blends of linear and short-chain branched polyethylenes in the solid state by small-angle neutron and X-ray scattering, differential scanning calorimetry, and transmission electron microscopy. Macromolecules 2000, 33, 551–561. [Google Scholar] [CrossRef]
- Wang, H.; Shimizu, K.; Hobbie, E.K.; Wang, Z.G.; Meredith, J.C.; Karim, A.; Amis, E.J.; Hsiao, B.S.; Hsieh, E.T.; Han, C.C. Phase diagram of a nearly isorefractive polyolefin blend. Macromolecules 2002, 35, 1072–1078. [Google Scholar] [CrossRef]
- Tashiro, K.; Satkowski, M.M.; Stein, R.S.; Li, Y.; Chu, B.; Hsu, S.L. Cocrystallization and phase segregation of polyethylene blends. 2. synchrotron-sourced x-ray scattering and small-angle light scattering study of the blends between the d and h species. Macromolecules 1992, 25, 1809–1815. [Google Scholar] [CrossRef]
- Ree, M.; KYU, T.; Stein, R.S. Quantitative small-angle light-scattering studies of the melting and crystallization of LLDPE/LDPE blends. J. Polym. Sci. B Polym. Phys. 1987, 25, 105–126. [Google Scholar] [CrossRef]
- Hussein, I.A. Influence of composition distribution and branch content on the miscibility of m-LLDPE and HDPE blends: Rheological investigation. Macromolecules 2003, 36, 2024–2031. [Google Scholar] [CrossRef]
- Husseina, I.A.; Hameeda, T.; Sharkha, B.F.A.; Mezghanib, K. Miscibility of hexene-LLDPE and LDPE blends: Influence of branch content and composition distribution. Polymer 2003, 44, 4665–4672. [Google Scholar] [CrossRef]
- Niu, Y.H.; Wang, Z.G. Rheologically determined phase diagram and dynamically investigated phase separation kinetics of polyolefin blends. Macromolecules 2006, 39, 4175–4183. [Google Scholar] [CrossRef]
- Alamo, R.G.; Glaser, R.H.; Mandelkern, L. The cocrystallization of polymers: Polyethylene and its copolymers. J. Polym. Sci. B. Polym. Phys. 1988, 26, 2169–2195. [Google Scholar] [CrossRef]
- Galante, M.J.; Mandelkern, L.; Alamo, R.G. The crystallization of blends of different types of polyethylene: The role of crystallization conditions. Polymer 1998, 39, 5105–5119. [Google Scholar] [CrossRef]
- Morgan, R.L.; Hill, M.J.; Barham, P.J. Morphology, melting behaviour and co-crystallization in polyethylene blends: The effect of cooling rate on two homogeneously mixed blends. Polymer 1999, 40, 337–348. [Google Scholar] [CrossRef]
- Hu, S.; KYU, T.; Stein, R.S. Characterization and properties of polyethylene blends I. Linear low-density polyethylene with high-density polyethylene. J. Polym. Sci. B Polym. Phys. 1987, 25, 71–87. [Google Scholar] [CrossRef]
- Kyu, T.; Hu, S.; Stein, R.S. Characterization and properties of polyethylene blends II. Linear low-density with conventional low-density polyethylene. J. Polym. Sci. B Polym. Phys. 1987, 25, 89–103. [Google Scholar] [CrossRef]
- Salakhov, I.I.; Chalykh, A.E.; Shaidullin, N.M.; Shapagin, A.V.; Budylin, N.Y.; Khasbiullin, R.R.; Nifant’ev, I.E.; Gerasimov, V.K. Phase equilibria and interdiffusion in bimodal high-density polyethylene (HDPE) and linear low-density polyethylene (LLDPE) based compositions. Polymers 2021, 13, 811. [Google Scholar] [CrossRef] [PubMed]
- Lorenzo, A.T.; Arnal, M.L.; Muller, A.J.; Lin, M.-C.; Chen, H.-L. SAXS/DSC analysis of the lamellar thickness distribution on a SSA thermally fractionated model polyethylene. Macromol. Chem. Phys. 2011, 212, 2009–2016. [Google Scholar] [CrossRef]
- Sun, X.; Shen, G.H.; Shen, H.W.; Xie, B.H.; Yang, W.; Yang, M.B. Co-crystallization of blends of high-density polyethylene with linear low-density polyethylene: An investigation with successive self-nucleation and annealing (SSA) technique. J. Macromol. Sci. B 2013, 52, 1372–1387. [Google Scholar] [CrossRef]
- Song, H.H.; Wu, D.Q.; Chu, B.; Satkowski, M.; Ree, M.; Stein, R.S.; Phillips, J.C. Time-resolved small-angle X-ray scattering of a high density polyethylene/low density polyethylene blend. Macromolecules 1990, 23, 2380–2384. [Google Scholar] [CrossRef]
- Brana, M.T.C.; Sainz, J.I.I.; Terselius, B.; Gedde, U.W. Morphology of binary blends of linear and branched polyethylene: Transmission electron microscopy. Polymer 1989, 30, 410–415. [Google Scholar] [CrossRef]
- Lu, J.J.; Sue, H.-J. Morphology and mechanical properties of blown films of a low-density polyethylene/linear low-density polyethylene blend. J. Polym. Sci. B Polym. Phys. 2002, 40, 507–518. [Google Scholar] [CrossRef]
- Arnal, M.L.; Cañizales, E.; Müller, A.J. Thermal and morphological evaluation of very low density polyethylene/high density polyethylene blends. Polym. Eng. Sci. 2002, 42, 2048–2063. [Google Scholar] [CrossRef]
- Sweed, M. Co-Crystallization in Polyolefin BLENDS Studied by Various Crystallization Analysis Techniques; University of Stellenbosch: Stellenbosch, South Africa, 2006. [Google Scholar]
- Suriya, K.; Anantawaraskul, S.; Soares, J.B.P. Cocrystallization of ethylene/1-octene copolymer blends during crystallization analysis fractionation and crystallization elution fractionation. J. Polym. Sci. B Polym. Phys. 2011, 49, 678–684. [Google Scholar] [CrossRef]
- Fonseca, C.A.; Harrison, I.R. An investigation of co-crystallization in LDPE/HDPE blends using DSC and TREF. Thermochim. Acta 1998, 313, 37–41. [Google Scholar] [CrossRef]
- Alamo, R.G.; Londono, J.D.; Mandelkern, L.; Stehling, F.C.; Wignall, G.D. Phase behavior of blends of linear and branched polyethylenes in the molten and solid states by small-angle neutron scattering. Macromolecule 1994, 27, 411–417. [Google Scholar] [CrossRef]
- Zhao, Y.; Liu, S.S.; Yang, D.C. Crystallization behavior of blends of high-density polyethylene with novel linear low-density polyethylene. Macromol. Chem. Phys. 1997, 198, 1427–1436. [Google Scholar] [CrossRef]
- Eslamian, M.; Bagheri, R.; Pircheraghi, G. Co-crystallization in ternary PE blends: Tie crystal formation and mechanical properties improvement. Polym. Int. 2016, 65, 1405–1416. [Google Scholar] [CrossRef]
- Fodor, J.S.; Lamborn, M.J.; DesLauriers, P.J. Correlating polyethylene microstructure to stress cracking: Development of primary structure parameters. Polymer 2018, 147, 8–19. [Google Scholar] [CrossRef]
- Moyassari, A.; Mostafavi, H.; Gkourmpis, T.; Hedenqvist, M.S.; Gedde, U.W.; Nilsson, F. Simulation of semi-crystalline polyethylene: Effect of short-chain branching on tie chains and trapped entanglements. Polymer 2015, 72, 177–184. [Google Scholar] [CrossRef]
- Nilsson, F.; Lan, X.; Gkourmpis, T.; Hedenqvist, M.S.; Gedde, U.W. Modelling tie chains and trapped entanglements in polyethylene. Polymer 2012, 53, 3594–3601. [Google Scholar] [CrossRef]
- Krishnaswamy, R.K.; Yang, Q.; Fernandez-Ballester, L.; Kornfield, J.A. Effect of the distribution of short-chain branches on crystallization kinetics and mechanical properties of high-density polyethylene. Macromolecules 2008, 41, 1693–1704. [Google Scholar] [CrossRef]
- Cazenave, J.; Seguela, R.; Sixou, B.; Germain, Y. Short-term mechanical and structural approaches for the evaluation of polyethylene stress crack resistance. Polymer 2006, 47, 3904–3914. [Google Scholar] [CrossRef]
- Roland, S.J. Critical review of the molecular topology of semicrystalline polymers: The origin and assessment of intercrystalline tie molecules and chain entanglements. J. Polym. Sci. B Polym. Phys. 2005, 43, 1729–1748. [Google Scholar]
- Puig, C.C. Enhanced crystallization in branched polyethylenes when blended with linear polyethylene. Polymer 2001, 42, 6579–6585. [Google Scholar] [CrossRef]
- Puig, C.C. On the cocrystallization phenomenon in blends of high density polyethylene and low density polyethylene. Polym. Bull. 1997, 38, 715–720. [Google Scholar] [CrossRef]
- Liu, J.K.; Nozue, Y.; Nagamatsu, T.; Hosoda, S. Effect of blending high-pressure low-density polyethylene on the crystallization kinetics of linear low-density polyethylene. J. Appl. Polym. Sci. 2007, 105, 3673. [Google Scholar]
- Siegmann, A.; Nir, Y. Structure-property relationships in blends of linear low- and conventional low-density polyethylene as blown films. Polym. Eng. Sci. 1987, 27, 1182–1186. [Google Scholar] [CrossRef]
- Gilbert, R.G.; Hess, M.; Jenkins, A.D.; Jones, R.G.; Kratochvíl, P.; Stepto, R.F.T. Dispersity in polymer science. Pure Appl. Chem. 2009, 81, 351–353. [Google Scholar]
- Wang, S.; Wu, C.; Ren, M.; Horn, R.M.V.; Graham, M.J.; Han, C.C.; Chen, E.; Cheng, S.Z.D. Liquid–liquid phase separation in a polyethylene blend monitored by crystallization kinetics and crystal-decorated phase morphologies. Polymer 2009, 50, 1025–1033. [Google Scholar] [CrossRef]
- Jiang, Z.; Tang, Y.; Rieger, J.; Enderle, H.F.; Lilge, D.; Roth, S.V.; Gehrke, R.; Wue, Z.; Li, Z.; Li, X.; et al. Structural evolution of melt-drawn transparent high-density polyethylene during heating and annealing: Synchrotron small-angle X-ray scattering study. Eur. Polym. J. 2010, 46, 1866–1877. [Google Scholar] [CrossRef]
- Liu, L.Z.; Chu, B.; Penning, J.P.; Manley, R.S.J. A synchrotron SAXS study of miscible blends of semicrystalline poly (vinylidene fluoride) and semicrystalline poly (1,4-butylene adipate). Macromolecules 1997, 30, 4398–4404. [Google Scholar] [CrossRef]


| Type | Manufacture | Grade | Comonomer | Density (a) /(g/cm3) | (×104) | ĐM(b) | Branching Content (/1000C) |
|---|---|---|---|---|---|---|---|
| HDPE-1 | Sinopec | B5703 | Propylene | 0.960 | 19.9 | 10.71 | 0.4 |
| HDPE-2 | Sinopec | YEM-4902T | Butene | 0.951 | 24.4 | 26.99 | 3 |
| LLDPE-1 | ExxonMobil | Enable 2010HA | Hexene | 0.920 | 10.1 | 3.67 | 12.2 |
| LLDPE-2 | DOW | Dowlex 2045G | Octene | 0.920 | 12.7 | 3.85 | 11.1 |
| LDPE | Sinopec | LD607 | —— | 0.921 | 8.6 | 5.23 | 13.6 (c) |
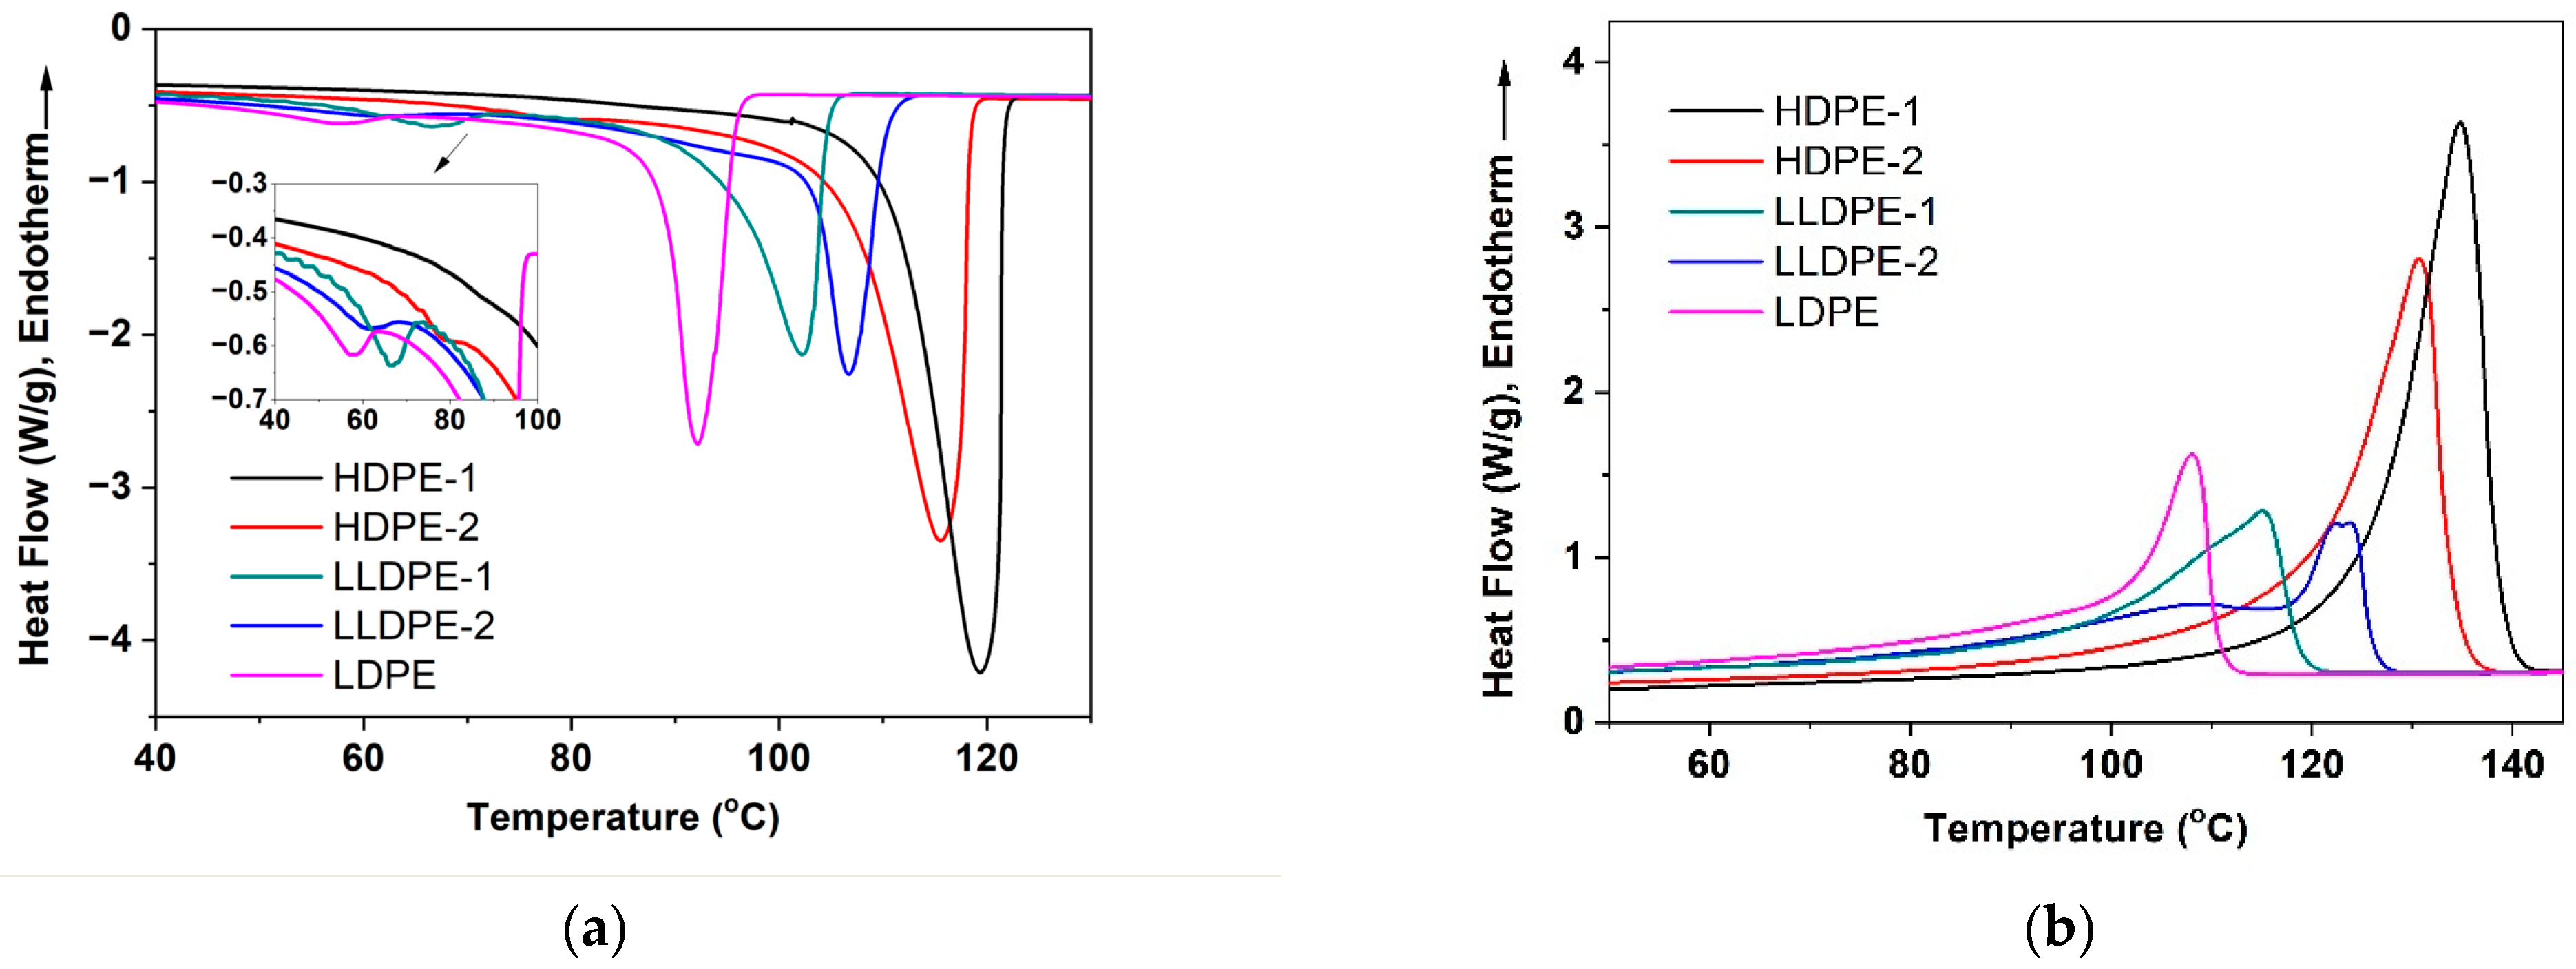
| Sample | Higher Tc/Lower Tc (°C) | Tm (°C) | Crystallinity (%) |
|---|---|---|---|
| HDPE-1 | 119.3/86.1 | 135.5 | 76.4 |
| HDPE-2 | 115.5/79.8 | 130.7 | 69.0 |
| LLDPE-1 | 102.4/66.4 | 115.3 | 41.8 |
| LLDPE-2 | 107.2/61.7 | 123.9/122.4/109.4 | 40.9 |
| LDPE | 93.3/57.8 | 107.5 | 39.9 |
| Sample | L (nm) | Lc (nm) | La (nm) |
|---|---|---|---|
| HDPE-1 | 27.5 | 20.1 | 7.4 |
| HDPE-2 | 23.2 | 16.5 | 6.7 |
| LLDPE-1 | 14.6 | 5.3 | 9.3 |
| LLDPE-2 | 17.1 | 5.7 | 11.4 |
| LDPE | 13.2 | 4.9 | 8.3 |
| Sample | Higher Tc/Lower Tc (°C) | Tm (°C) | Crystallinity (%) |
|---|---|---|---|
| HDPE-2 | 115.5/79.8 | 130.7 | 72 |
| LDPE | 93.3/57.8 | 107.5 | 42 |
| HDPE-2/LDPE 50/50 blend | 115.2/96.9/61.6 | 128.1/108.4 | 58 |
| Sample | L (nm) | Lc (nm) | La (nm) |
|---|---|---|---|
| HDPE-2 | 23.2 | 16.5 | 6.7 |
| LDPE | 13.2 | 4.9 | 8.3 |
| HDPE-2/LDPE 50/50 blend | 21.6 | 15.9 | 5.7 |
| Sample | Higher Tc/Lower Tc (°C) | Tm (°C) | Crystallinity (%) |
|---|---|---|---|
| LLDPE-2 | 107.2/61.7 | 123.9/122.4/109.4 | 45 |
| LDPE | 93.3/57.8 | 107.5 | 42 |
| LLDPE-2/LDPE 50/50 blend | 106.9/95.2/59.5 | 123.1/120.9/106.4 | 44 |
| Sample | L (nm) | Lc (nm) | La (nm) |
|---|---|---|---|
| LLDPE-2 | 17.1 | 5.7 | 11.4 |
| LDPE | 13.2 | 4.9 | 8.3 |
| LLDPE-2/LDPE 50/50 blend | 15.1 | 5.3 | 9.8 |
| Sample | Higher Tc/Lower Tc (°C) | Tm (°C) | Crystallinity (%) |
|---|---|---|---|
| HDPE-2 | 115.5/79.8 | 130.7 | 72 |
| LLDPE-2 | 107.2/61.7 | 123.9/122.4/109.4 | 45 |
| HDPE-2/LLDPE-2 50/50 | 114.1/67.0 | 127.2 | 56 |
| Sample | L (nm) | Lc (nm) | La (nm) |
|---|---|---|---|
| HDPE-2 | 23.2 | 16.5 | 6.7 |
| LLDPE-2 | 17.1 | 5.7 | 11.4 |
| HDPE-2/LLDPE-2 50/50 | 21.6 | 15.4 | 6.2 |
Disclaimer/Publisher’s Note: The statements, opinions and data contained in all publications are solely those of the individual author(s) and contributor(s) and not of MDPI and/or the editor(s). MDPI and/or the editor(s) disclaim responsibility for any injury to people or property resulting from any ideas, methods, instructions or products referred to in the content. |
© 2023 by the authors. Licensee MDPI, Basel, Switzerland. This article is an open access article distributed under the terms and conditions of the Creative Commons Attribution (CC BY) license (https://creativecommons.org/licenses/by/4.0/).
Share and Cite
Yao, X.; Shi, Y.; Tang, Y.; Luo, C.; Hou, L.; Ren, M.; Zheng, C.; Liu, L.-Z. CRYSTAF, DSC and SAXS Study of the Co-Crystallization, Phase Separation and Lamellar Packing of the Blends with Different Polyethylenes. Polymers 2023, 15, 1940. https://doi.org/10.3390/polym15081940
Yao X, Shi Y, Tang Y, Luo C, Hou L, Ren M, Zheng C, Liu L-Z. CRYSTAF, DSC and SAXS Study of the Co-Crystallization, Phase Separation and Lamellar Packing of the Blends with Different Polyethylenes. Polymers. 2023; 15(8):1940. https://doi.org/10.3390/polym15081940
Chicago/Turabian StyleYao, Xuerong, Ying Shi, Yujing Tang, Chunxia Luo, Liping Hou, Minqiao Ren, Cui Zheng, and Li-Zhi Liu. 2023. "CRYSTAF, DSC and SAXS Study of the Co-Crystallization, Phase Separation and Lamellar Packing of the Blends with Different Polyethylenes" Polymers 15, no. 8: 1940. https://doi.org/10.3390/polym15081940