
Isobornyl and Isocamphyl Photostabilizers in Poly(lactic acid)-Based Electrospun Fibers

 , , ,
, , , 
Abstract
:1. Introduction
2. Materials and Methods
2.1. Materials
2.2. Formation of Electrospun Fiber Mats
2.3. Irradiation of Electrospun Fiber Mats
2.4. Characterization of Electrospun Fiber Mats
2.5. TG–DSC Analyses
2.6. FTIR Analyses
2.7. NMR Analyses
2.8. Gel Permeation Chromatography
2.9. Py–GC/MS Analyses
2.10. Texture Characterization
2.11. Cell Morphology
2.12. Statistical Analysis
3. Results and Discussion
3.1. Texture Characterization
3.2. Chemical Structure Analysis
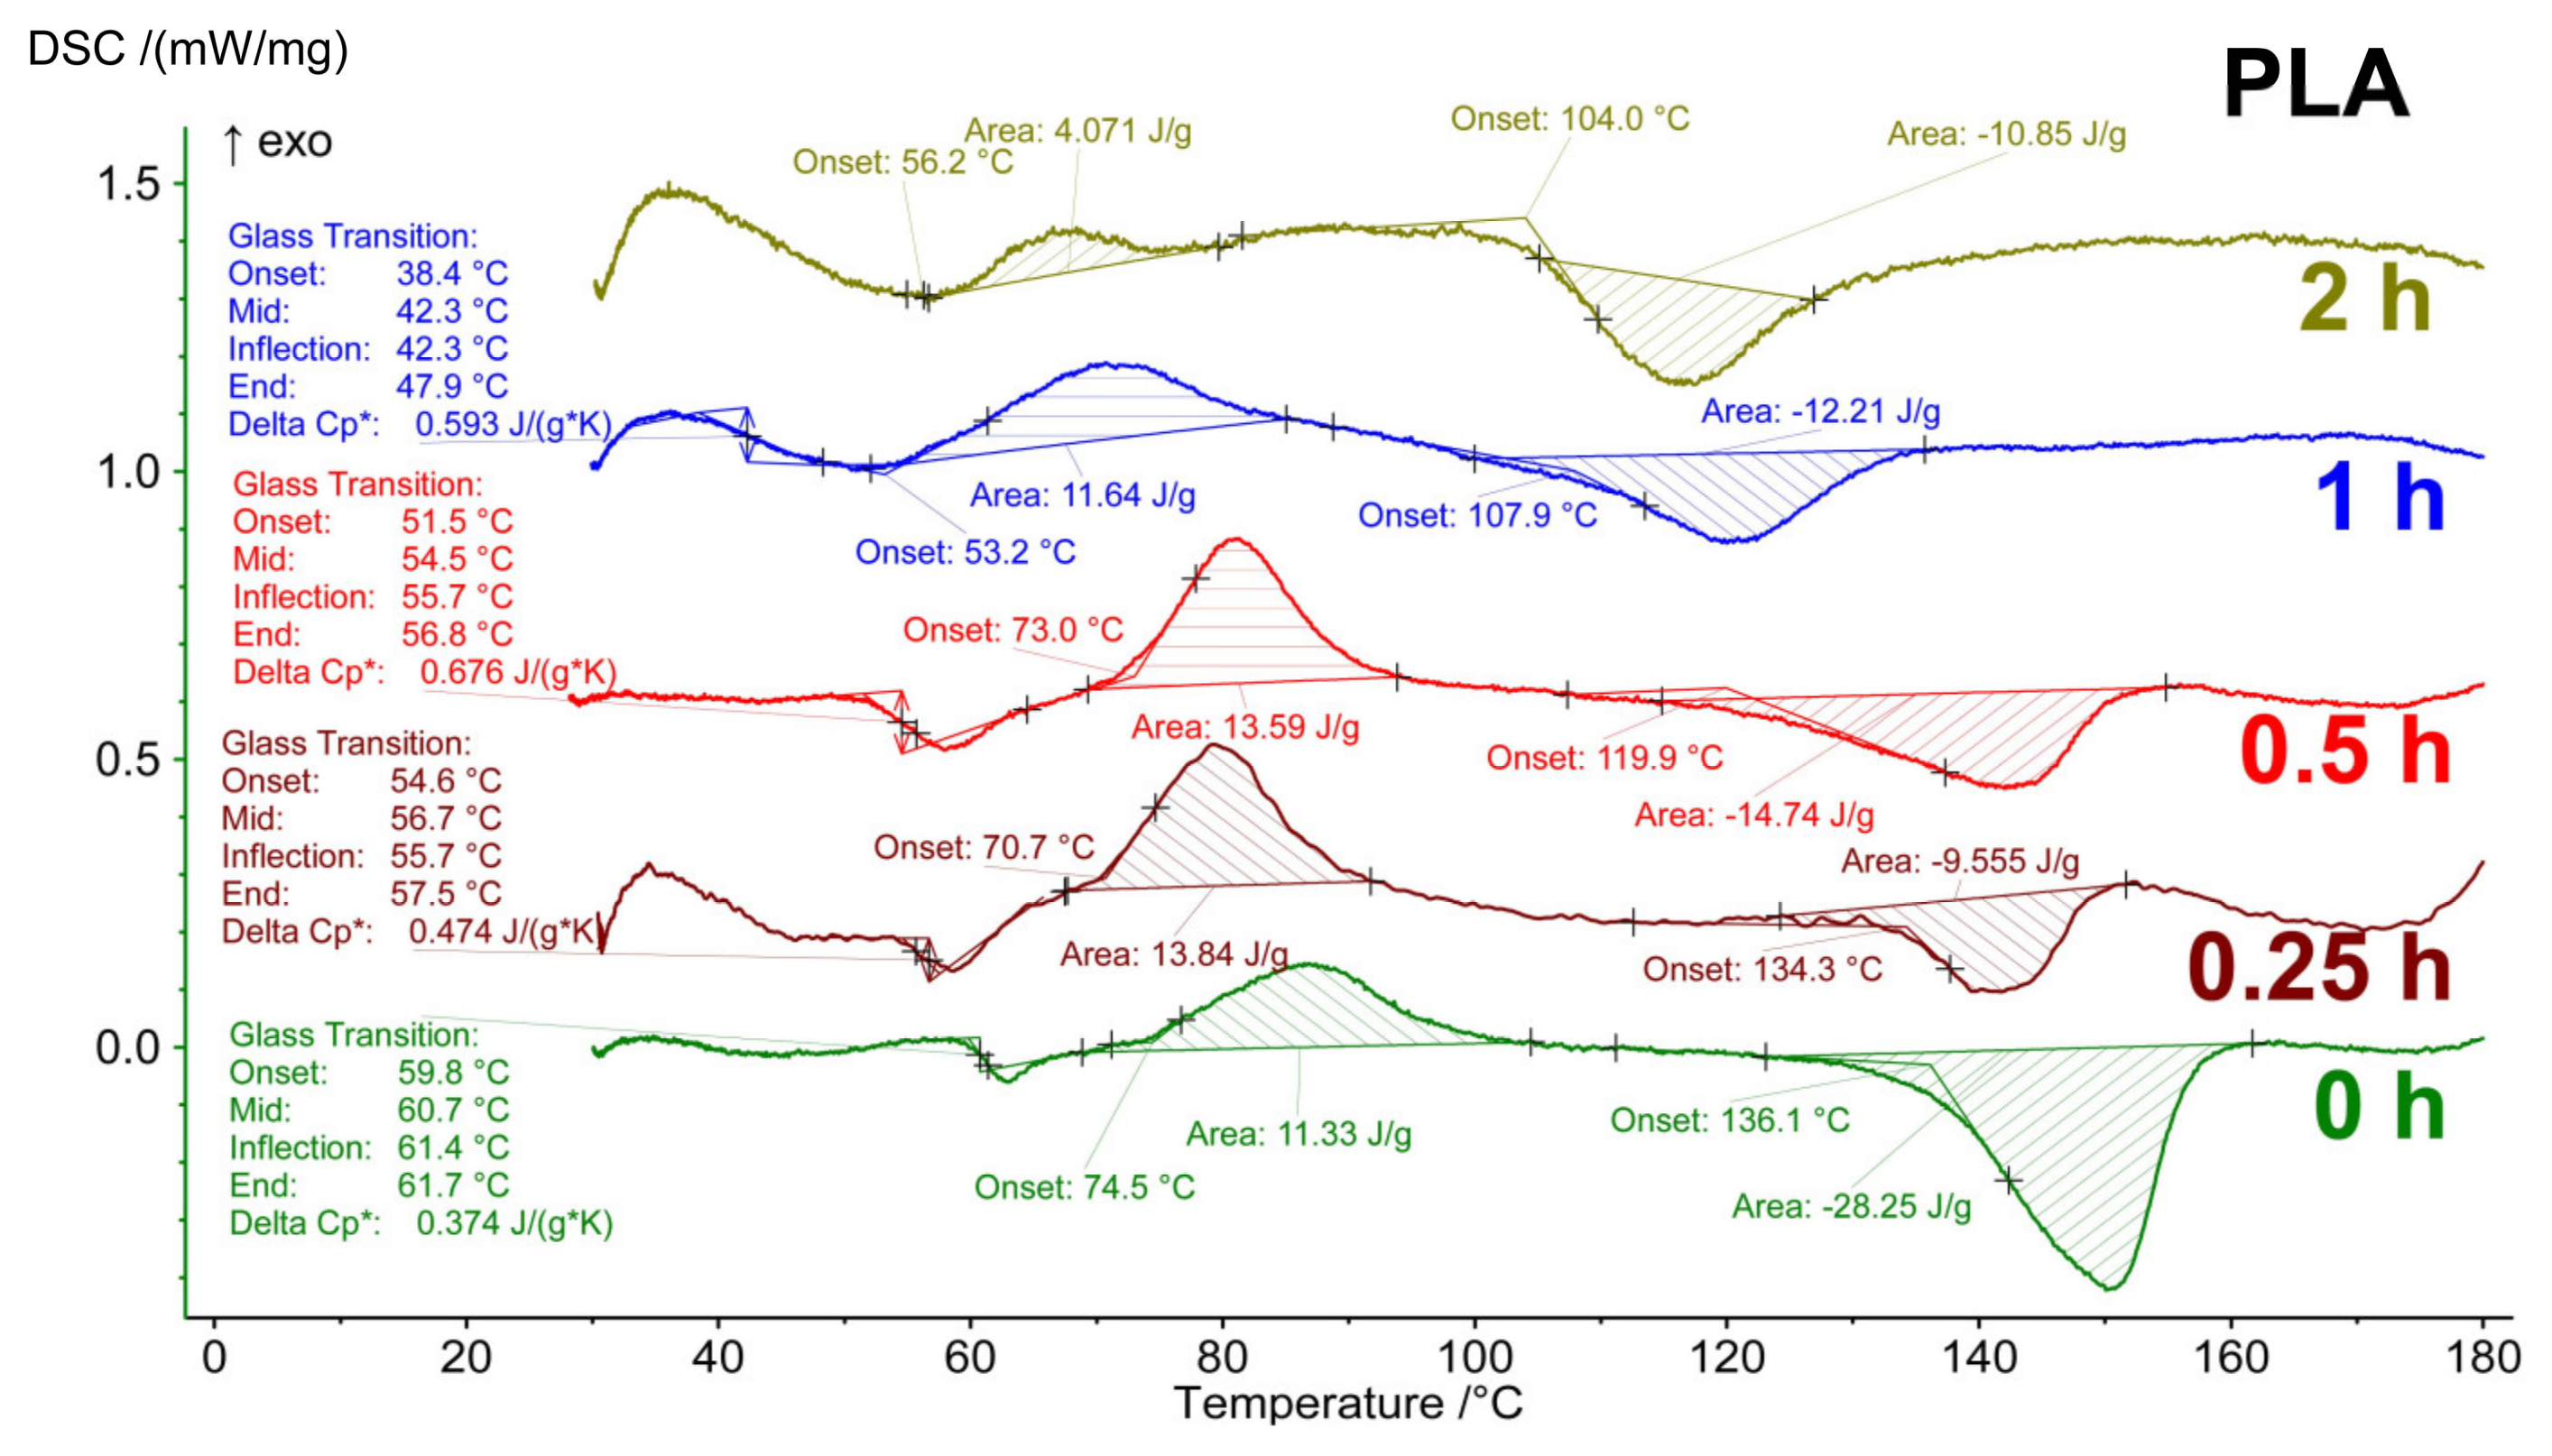
3.3. TG–DSC Analysis
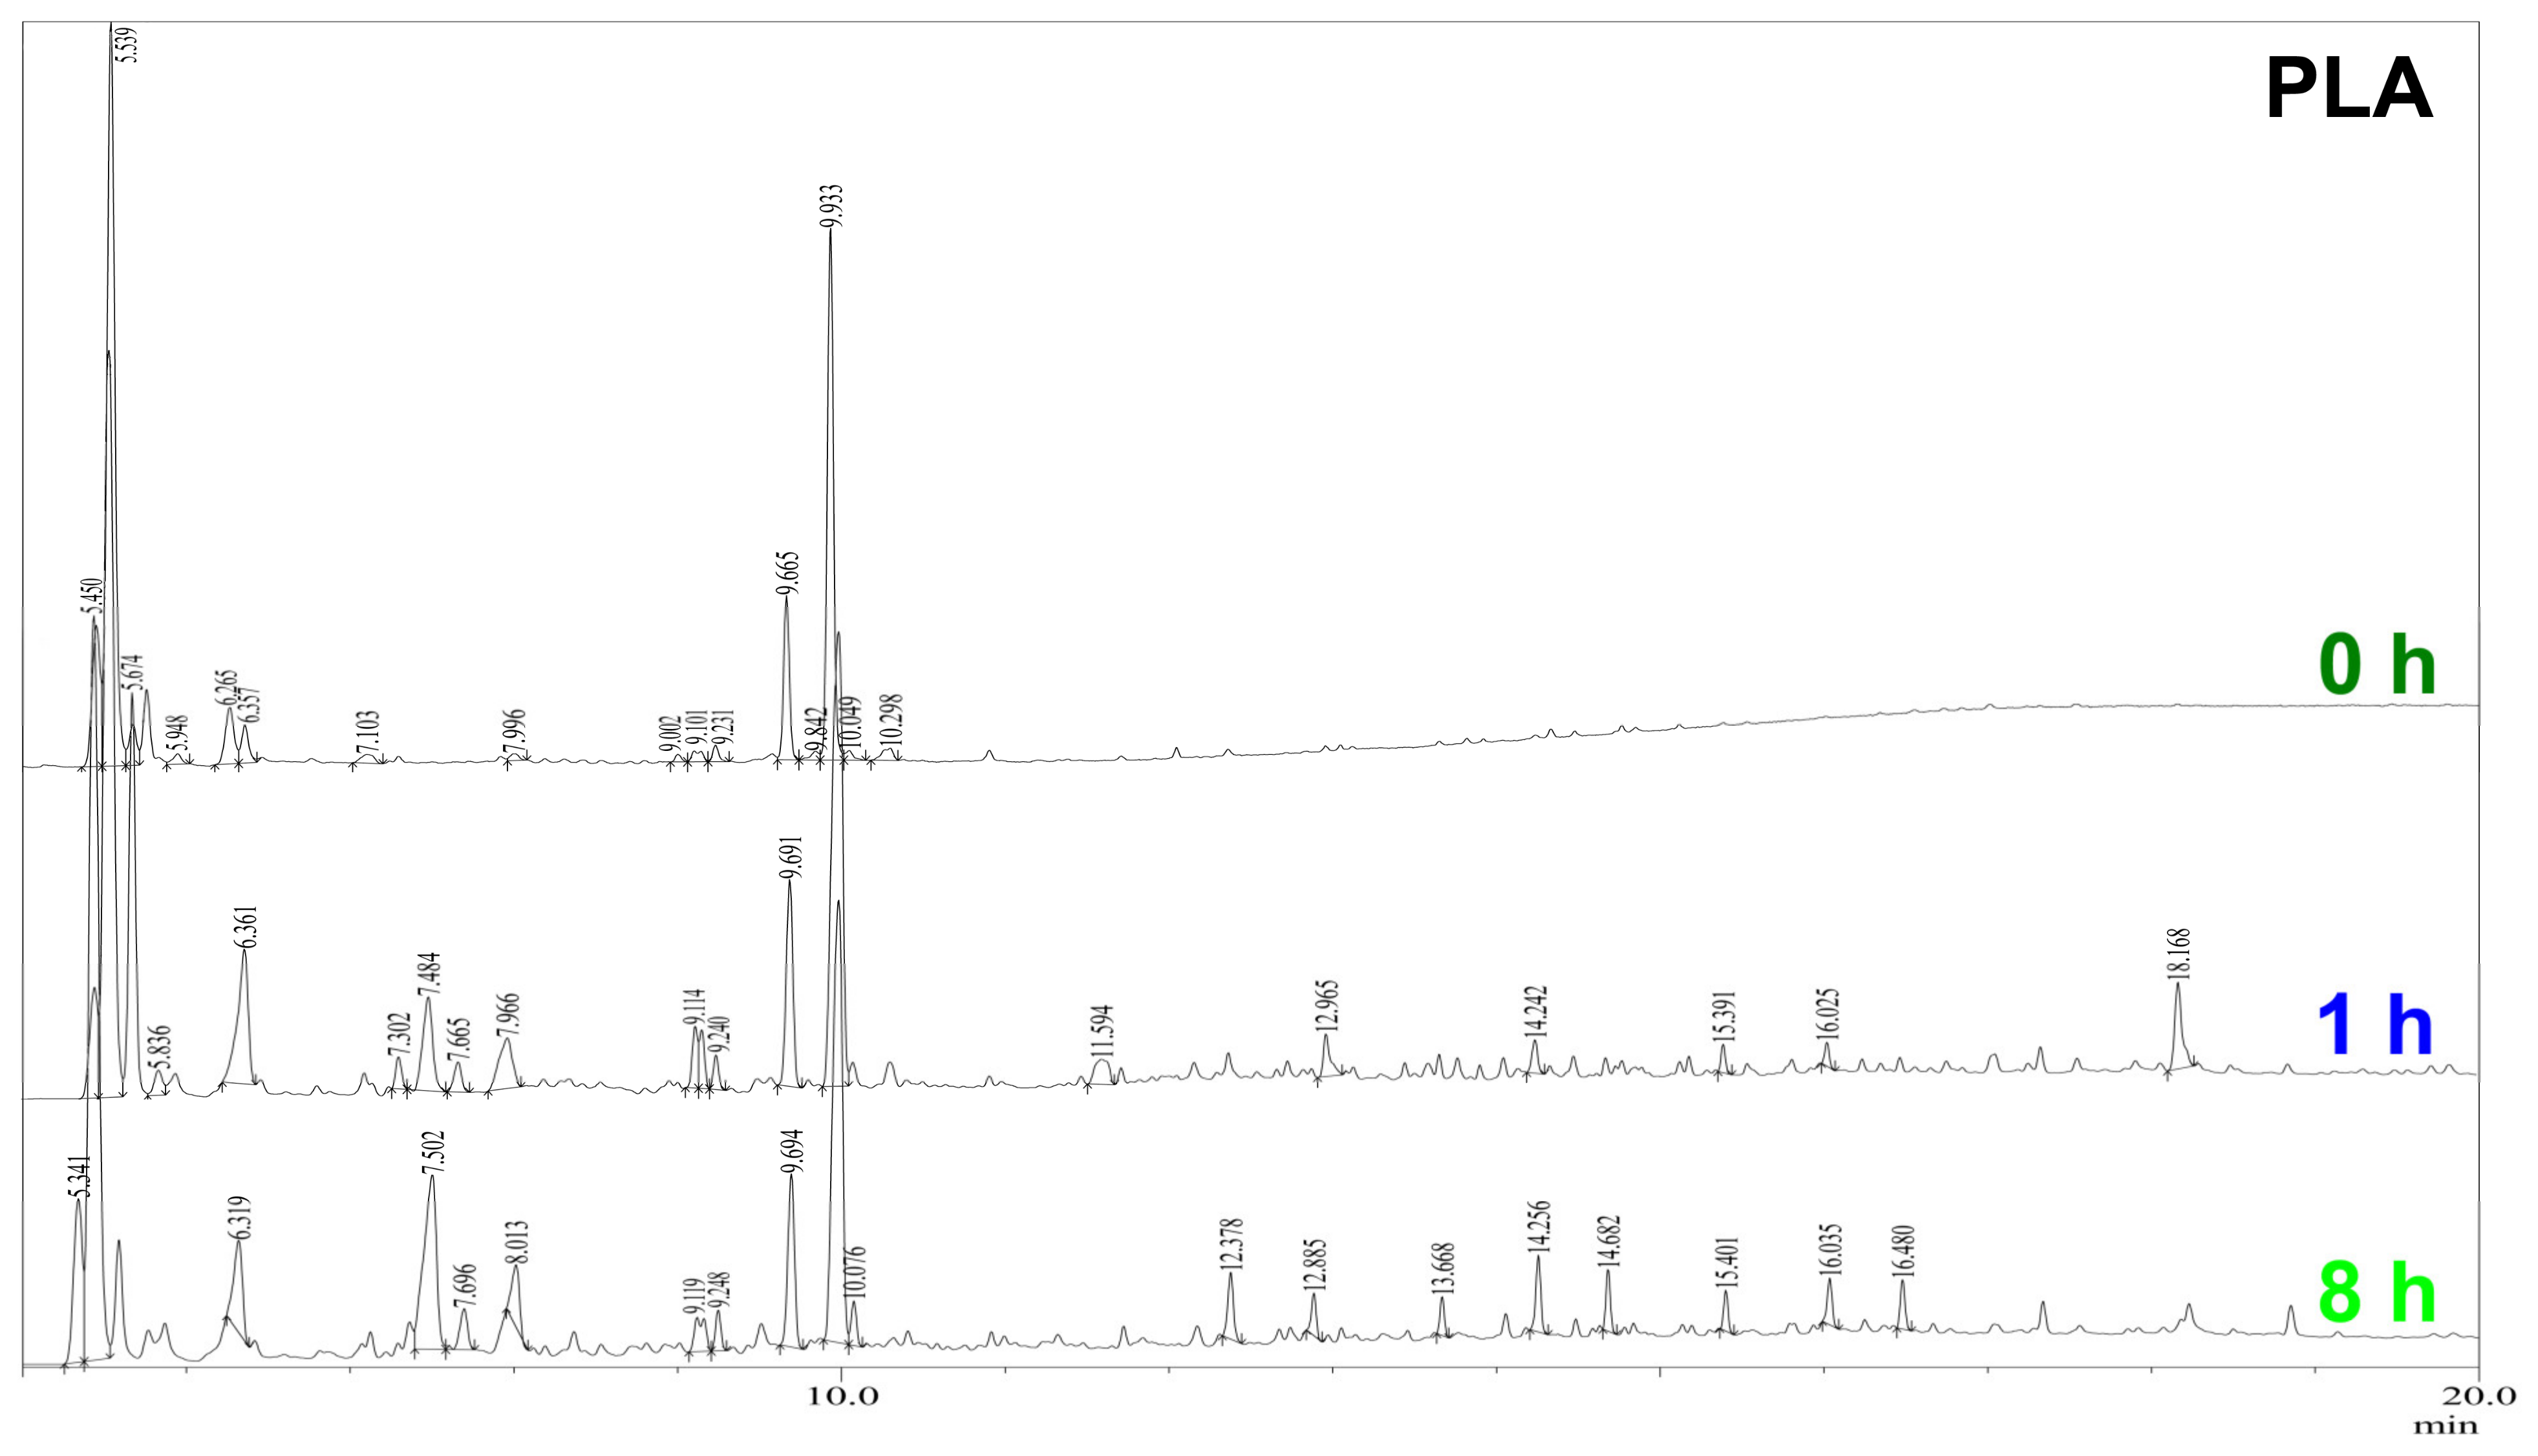
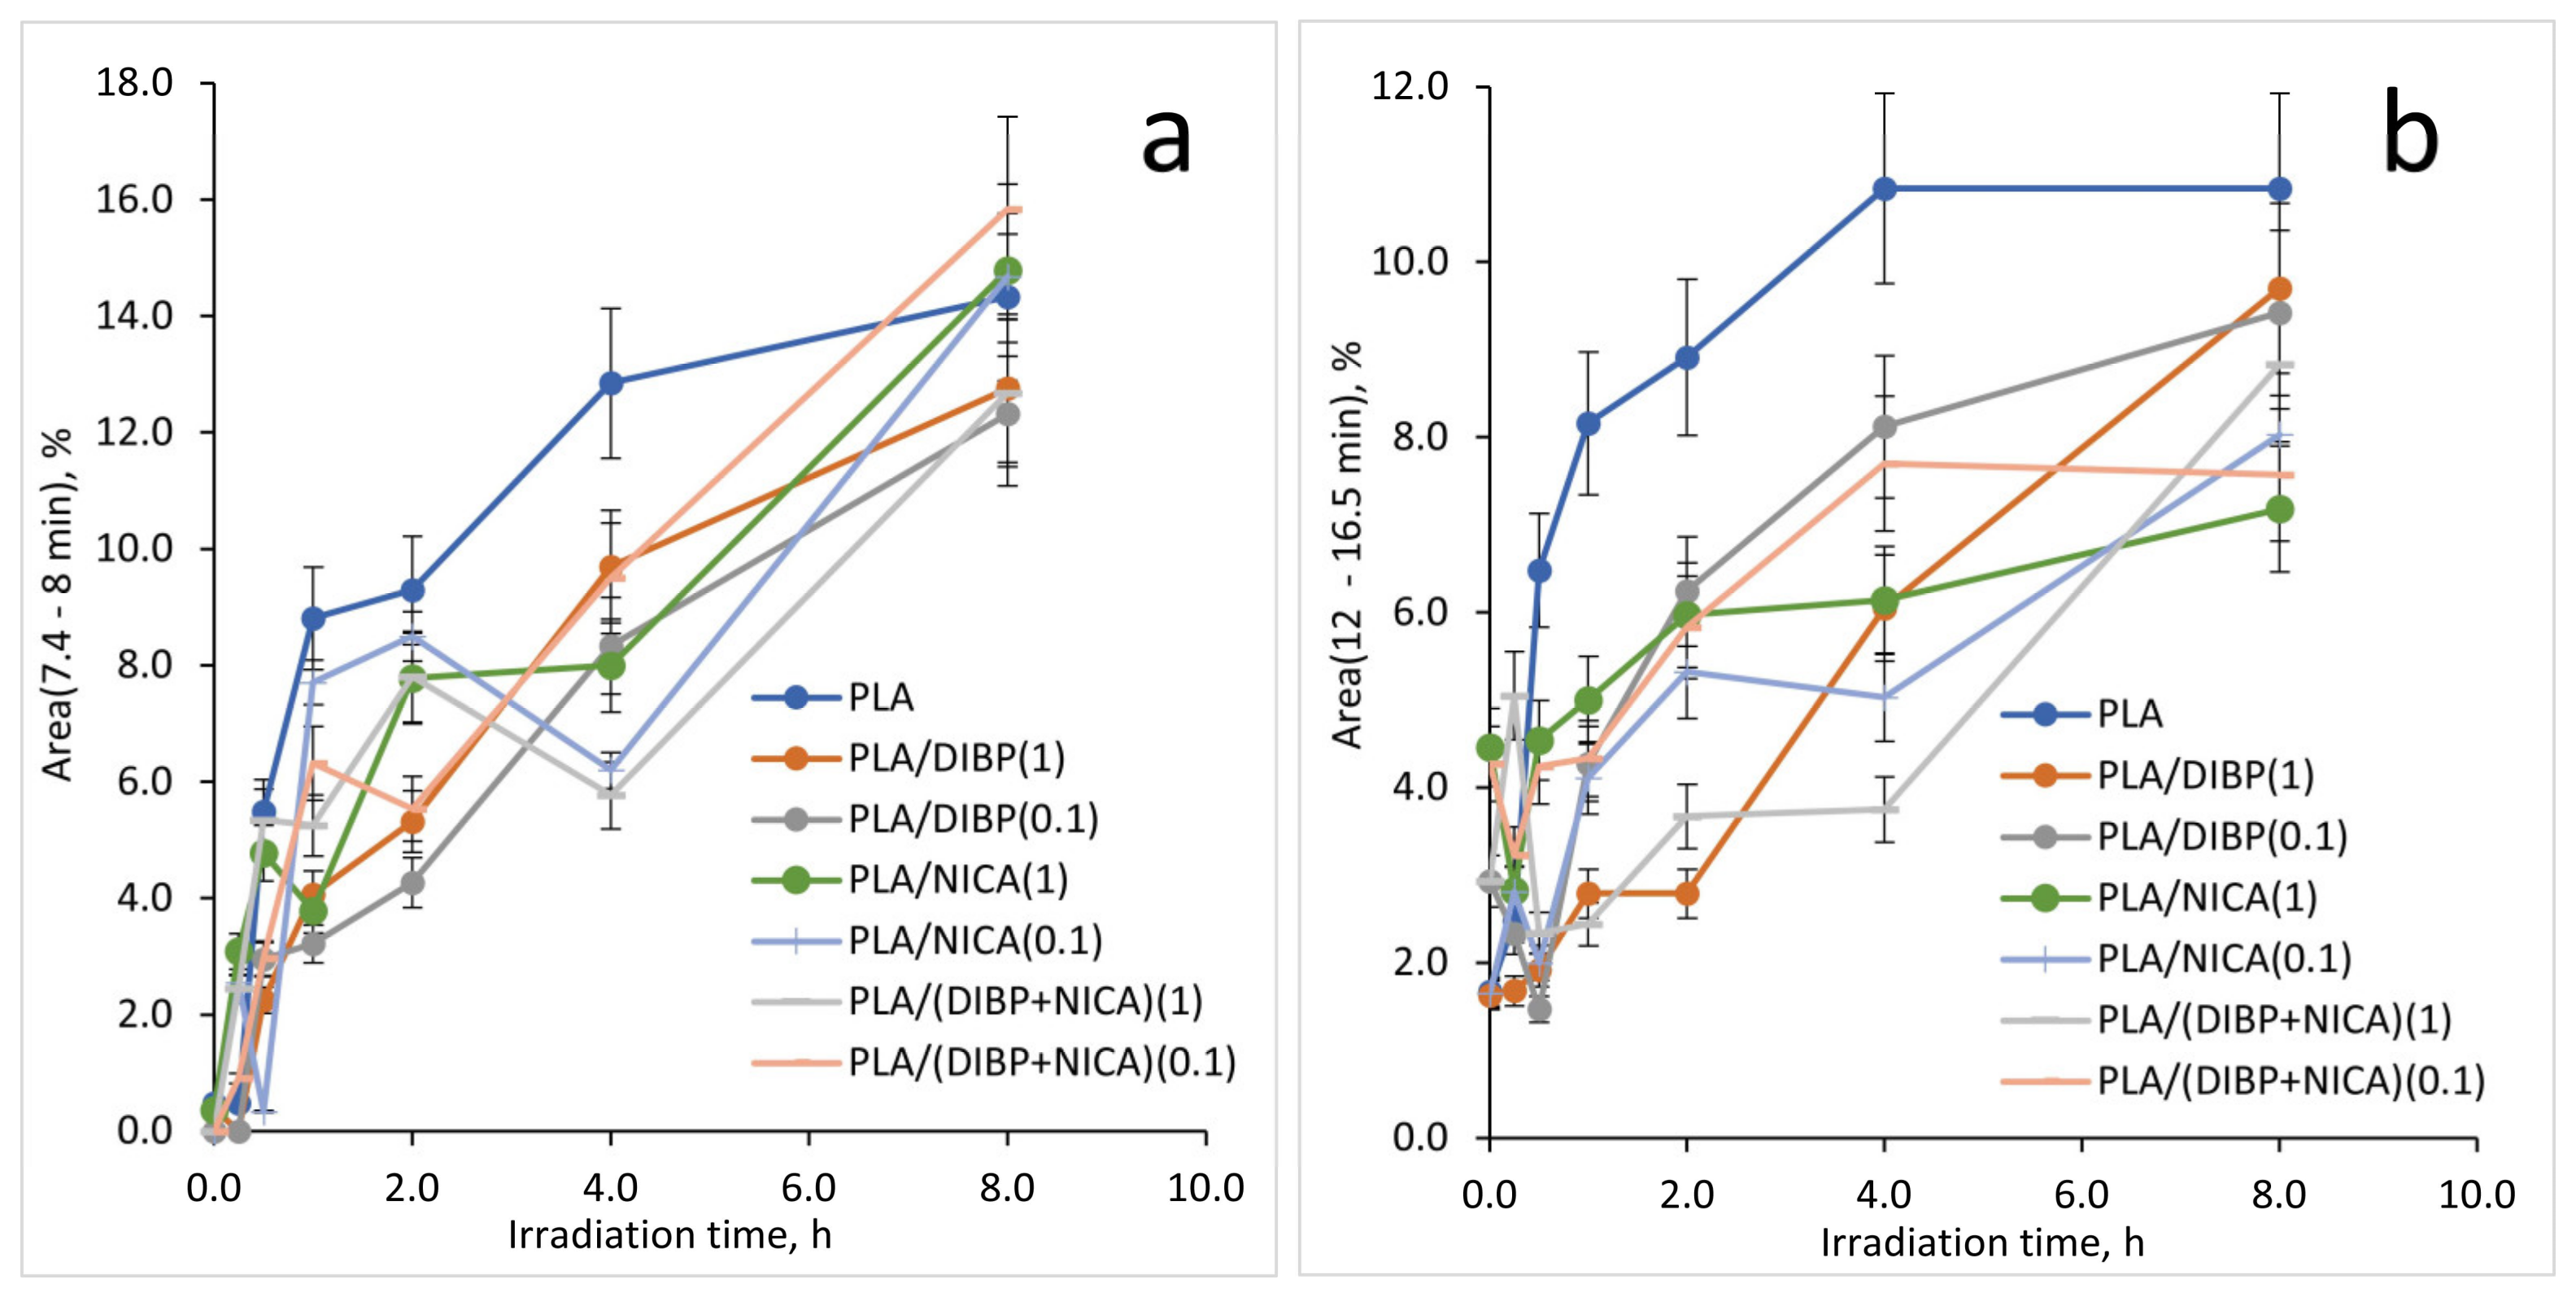
3.4. Py–GC/MS Analysis
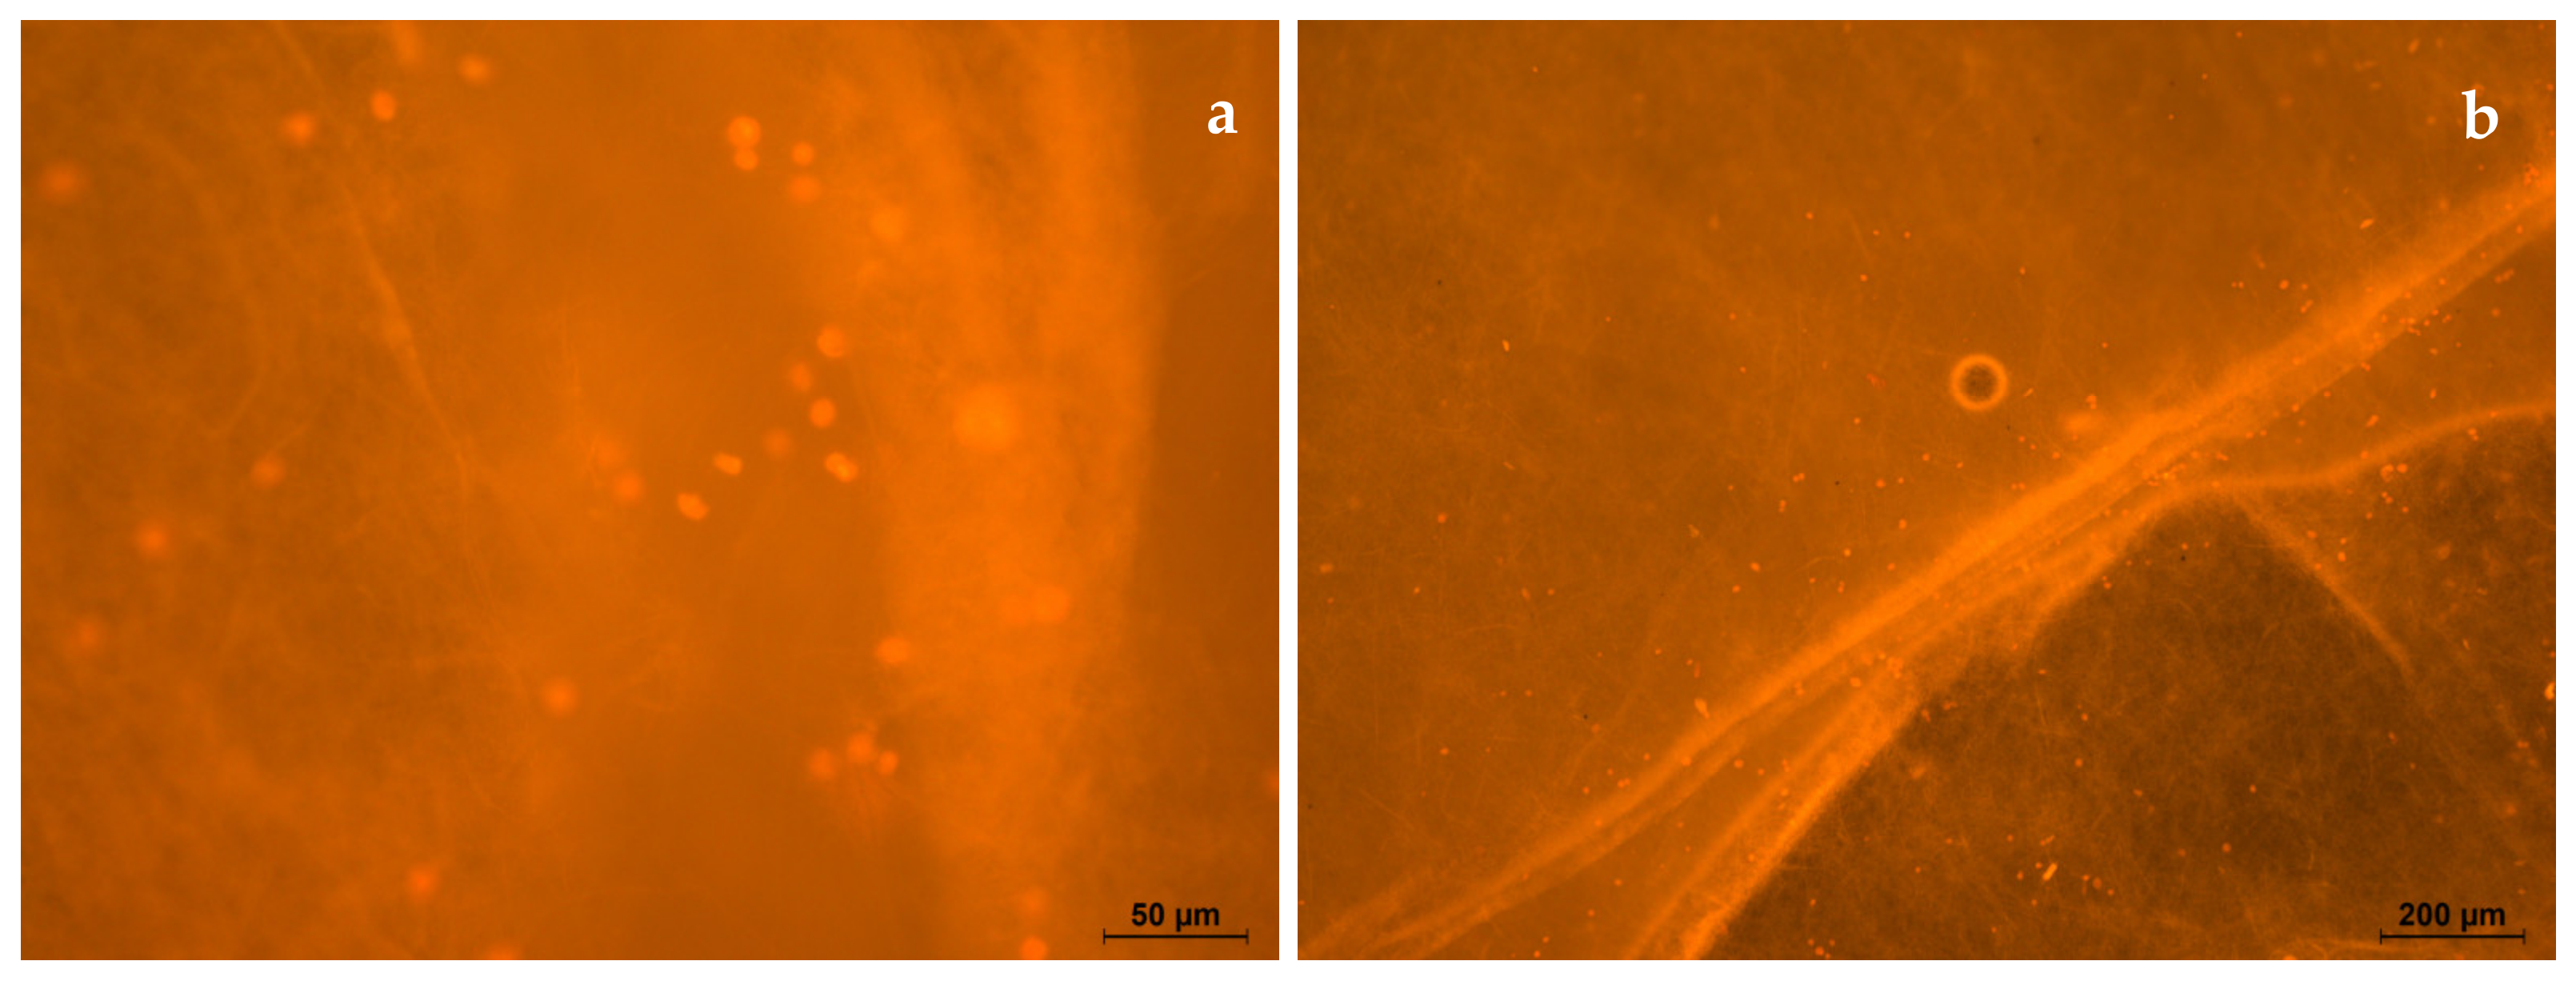
3.5. Cell Morphology
4. Conclusions
Author Contributions
Funding
Institutional Review Board Statement
Data Availability Statement
Acknowledgments
Conflicts of Interest
References
- Andrady, A.L.; Pandey, K.K.; Heikkilä, A.M. Interactive effects of solar UV radiation and climate change on material damage. Photochem. Photobiol. Sci. 2019, 18, 804–825. [Google Scholar] [CrossRef] [PubMed]
- Stefaniak, K.; Masek, A. Green Copolymers Based on Poly(Lactic Acid)—Short Review. Materials 2021, 14, 5254. [Google Scholar] [CrossRef]
- Zaaba, N.F.; Jaafar, M. A review on degradation mechanisms of polylactic acid: Hydrolytic, photodegradative, microbial, and enzymatic degradation. Polym. Eng. Sci. 2020, 60, 2061–2075. [Google Scholar] [CrossRef]
- Bozarova, G.K.; Khachaturov, A.E. The place of biodegradable polymers in the total volume of plastics production. Theor. Appl. Ecol. 2020, 4, 93–99. [Google Scholar] [CrossRef]
- Daassi, R.; Durand, K.; Rodrigue, D.; Stevanovic, T. Optimization of the Electrospray Process to Produce Lignin Nanoparticles for PLA-Based Food Packaging. Polymers 2023, 15, 2973. [Google Scholar] [CrossRef] [PubMed]
- Krawczyk-Walach, M.; Gzyra-Jagieła, K.; Milczarek, A.; Józwik-Pruska, J. Characterization of Potential Pollutants from Poly(lactic acid) after the Degradation Process in Soil under Simulated Environmental Conditions. AppliedChem 2021, 1, 156–172. [Google Scholar] [CrossRef]
- Tertyshnaya, Y.; Podzorova, M.; Moskovskiy, M. Impact of Water and UV Irradiation on Nonwoven Polylactide/Natural Rubber Fiber. Polymers 2021, 13, 461. [Google Scholar] [CrossRef]
- Nim, B.; Sreearunothai, P.; Petchsuk, A.; Opaprakasit, P. Preparation of TiO2-loaded electrospun fibers of polylactide/poly(vinylpyrrolidone) blends for use as catalysts in epoxidation of unsaturated oils. J. Nanoparticle Res. 2018, 20, 100. [Google Scholar] [CrossRef]
- Janorkar, A.V.; Metters, A.T.; Hirt, D.E. Degradation of poly (L-lactide) films under ultraviolet-induced photografting and sterilization conditions. J. Appl. Polym. Sci. 2007, 106, 1042–1047. [Google Scholar] [CrossRef]
- Xie, Z.; Zhang, Y.; Liu, L.; Weng, H.; Mason, R.P.; Tang, L.; Nguyen, K.T.; Hsieh, J.T.; Yang, J. Development of intrinsically photoluminescent and photostable polylactones. Adv. Mater. 2014, 26, 4491–4496. [Google Scholar] [CrossRef]
- Amza, C.G.; Zapciu, A.; Baciu, F.; Vasile, M.I.; Popescu, D. Aging of 3D Printed Polymers under Sterilizing UV-C Radiation. Polymers 2021, 13, 4467. [Google Scholar] [CrossRef] [PubMed]
- Rupiasih, N.N.; Suyanto, H.; Sumadiyasa, M.; Wendri, N. Study of effects of low doses UV radiation on microporous polysulfone membranes in sterilization process. Open J. Org. Polym. Mater. 2013, 3, 12–18. [Google Scholar] [CrossRef]
- Jeon, H.J.; Kim, M.N. Biodegradation of poly (l-lactide)(PLA) exposed to UV irradiation by a mesophilic bacterium. Int. Biodeterior. Biodegrad. 2013, 85, 289–293. [Google Scholar] [CrossRef]
- Valente, T.A.M.; Silva, D.M.; Gomes, P.S.; Fernandes, M.H.; Santos, J.D.; Sencadas, V. Effect of Sterilization Methods on Electrospun Poly(lactic acid) (PLA) Fiber Alignment for Biomedical Applications. ACS Appl. Mater. Interfaces 2016, 8, 3241–3249. [Google Scholar] [CrossRef] [PubMed]
- Torlopov, M.A.; Udoratina, E.V.; Belyaev, V.Y. Synthesis of hydroxyethyl starch derivatives with phenylpropanoid fragments attached through ester or sulfide bonds. Russ. Chem. Bull. Int. Ed. 2014, 63, 2130–2135. [Google Scholar] [CrossRef]
- Torlopov, M.A.; Chukicheva, I.Y.; Kuchin, A.V. Synthesis of inulin and starch derivatives with a 2,6-diisobornyl-4-methylphenol (DibornolTM) fragment. Chem. Nat. Compd. 2012, 47, 867–869. [Google Scholar] [CrossRef]
- Chukicheva, I.Y.; Torlopov, M.A.; Buravlev, E.V.; Shevchenko, O.G.; Kuchin, A.V. Antioxidant properties of conjugates of polyethylene glycols containing terpenophenolic fragments. Russ. J. Bioorg. Chem. 2014, 40, 76–81. [Google Scholar] [CrossRef]
- Belyi, V.A.; Kuzivanov, I.M.; Fedorova, I.V.; Shumova, O.A.; Tropnikov, E.M.; Istomina, E.I.; Chukicheva, I.Y.; Kuchin, A.V. Tailoring Photoprotection of Polylactide with New Isobornyl Derivatives of Phenol and Aniline. Polymers 2023, 15, 2141. [Google Scholar] [CrossRef]
- Chukicheva, I.Y.; Spirikhin, L.V.; Kuchin, A.V. Tandem molecular rearrangement in the alkylation of phenol with camphene. Russ. J. Org. Chem. Engl. Transl. 2008, 44, 62–66. [Google Scholar] [CrossRef]
- Chukicheva, I.Y.; Shumova, O.A.; Kuchin, A.V. 05.12.2022. Bull. № 34. Patent RU 2785185, 28 July 2022. Available online: https://findpatent.ru/patent/278/2785185.html (accessed on 6 July 2023).
- Olewnik-Kruszkowska, E.; Koter, I.; Skopińska-Wiśniewska, J.; Richert, J. Degradation of polylactide composites under UV irradiation at 254 nm. J. Photochem. Photobiol. A Chem. 2015, 311, 144–153. [Google Scholar] [CrossRef]
- Mathew, S.; Abraham, T.E.; Zakaria, Z.A. Reactivity of phenolic compounds towards free radicals under in vitro conditions. J. Food Sci. Technol. 2015, 52, 5790–5798. [Google Scholar] [CrossRef] [PubMed]
- Sabaa, M.W.; Sanad, M.A.; El-Ghaffar, M.A.A.; Abdelwahab, N.A.; Sayed, S.M.A.; Soliman, S.M.A. Synthesis, characterization, and application of polyanisidines as efficient photostabilizers for poly(vinyl chloride) films. J. Elastomers Plast. 2020, 52, 537–547. [Google Scholar] [CrossRef]
- Chrysafi, I.; Pavlidou, E.; Christodoulou, E.; Vourlias, G.; Klonos, P.A.; Kyritsis, A.; Bikiaris, D.N. Effects of poly(hexylene succinate) amount on the crystallization and molecular mobility of poly(lactic acid) copolymers. Thermochim. Acta 2021, 698, 178883. [Google Scholar] [CrossRef]
- Araujo, S.; Sainlaud, C.; Delpouve, N.; Richaud, E.; Delbreilh, L.; Dargent, E. Segmental Relaxation Dynamics in Amorphous Polylactide Exposed to UV Light. Macromol. Chem. Phys. 2022, 223, 2200085. [Google Scholar] [CrossRef]
- Fukui, T.; Niikura, T.; Oda, T.; Kumabe, Y.; Ohashi, H.; Sasaki, M.; Igarashi, T.; Kunisada, M.; Yamano, N.; Oe, K.; et al. Exploratory clinical trial on the safety and bactericidal effect of 222-nm ultraviolet C irradiation in healthy humans. PLoS ONE 2020, 15, e0235948. [Google Scholar] [CrossRef]
- Mucha, M.; Bialas, S.; Kaczmarek, H. Effect of Nanosilver on the Photodegradation of Poly(lactic acid). J. Appl. Polym. Sci. 2014, 131, 40144. [Google Scholar] [CrossRef]
- Olewnik-Kruszkowska, E. Effect of UV irradiation on thermal properties of nanocomposites based on polylactide. J. Therm. Anal. Calorim. 2015, 119, 219–228. [Google Scholar] [CrossRef]
- Kosowska, K.; Szatkowski, P. Influence of ZnO, SiO2 and TiO2 on the aging process of PLA fibers produced by electrospinning method. J. Therm. Anal. Calorim. 2020, 140, 1769–1778. [Google Scholar] [CrossRef] [PubMed]
- Podzorova, M.V.; Selezneva, L.D.; Tertyshnaya, Y.V. Photodegradation of composites based on polylactide and polybutylene adipate terephthalate. Russ. Chem. Bull. 2023, 72, 1414–1421. [Google Scholar] [CrossRef]
- Valero, L.; Gainche, M.; Esparcieux, C.; Delor-Jestin, F.; Askanian, H. Vegetal Polyphenol Extracts as Antioxidants for the Stabilization of PLA: Toward Fully Biobased Polymer Formulation. ACS Omega 2024, 9, 7725–7736. [Google Scholar] [CrossRef]
- Ge, F.; Ding, Y.; Yang, L.; Huang, Y.; Jiang, L.; Dan, Y. Effect of content and distribution of ultraviolet absorbing group on uv protection and degradation of polylactide films. RSC Adv. 2015, 5, 70473–70481. [Google Scholar] [CrossRef]


| Sample | Additive Concentration, mmol/g | Mass Fraction of Additive, % w/w |
|---|---|---|
| PLA/DIBP(1) | 26.3 × 10⁻³ | 1% |
| PLA/DIBP(0.1) | 2.6 × 10⁻³ | 0.1% |
| PLA/NICA(1) | 26.3 × 10⁻³ | 0.6% |
| PLA/NICA(0.1) | 2.6 × 10⁻³ | 0.06% |
| PLA/(DIBP + NICA)(1) | 13.15 × 10⁻³ (DIBP) + 13.15 × 10⁻³ (NICA) | 0.5 (DIBP); 0.3 (NICA) |
| PLA/(DIBP + NICA)(0.1) | 1.31 × 10⁻³ (DIBP) + 1.31 × 10⁻³ (NICA) | 0.05 (DIBP); 0.03 (NICA) |
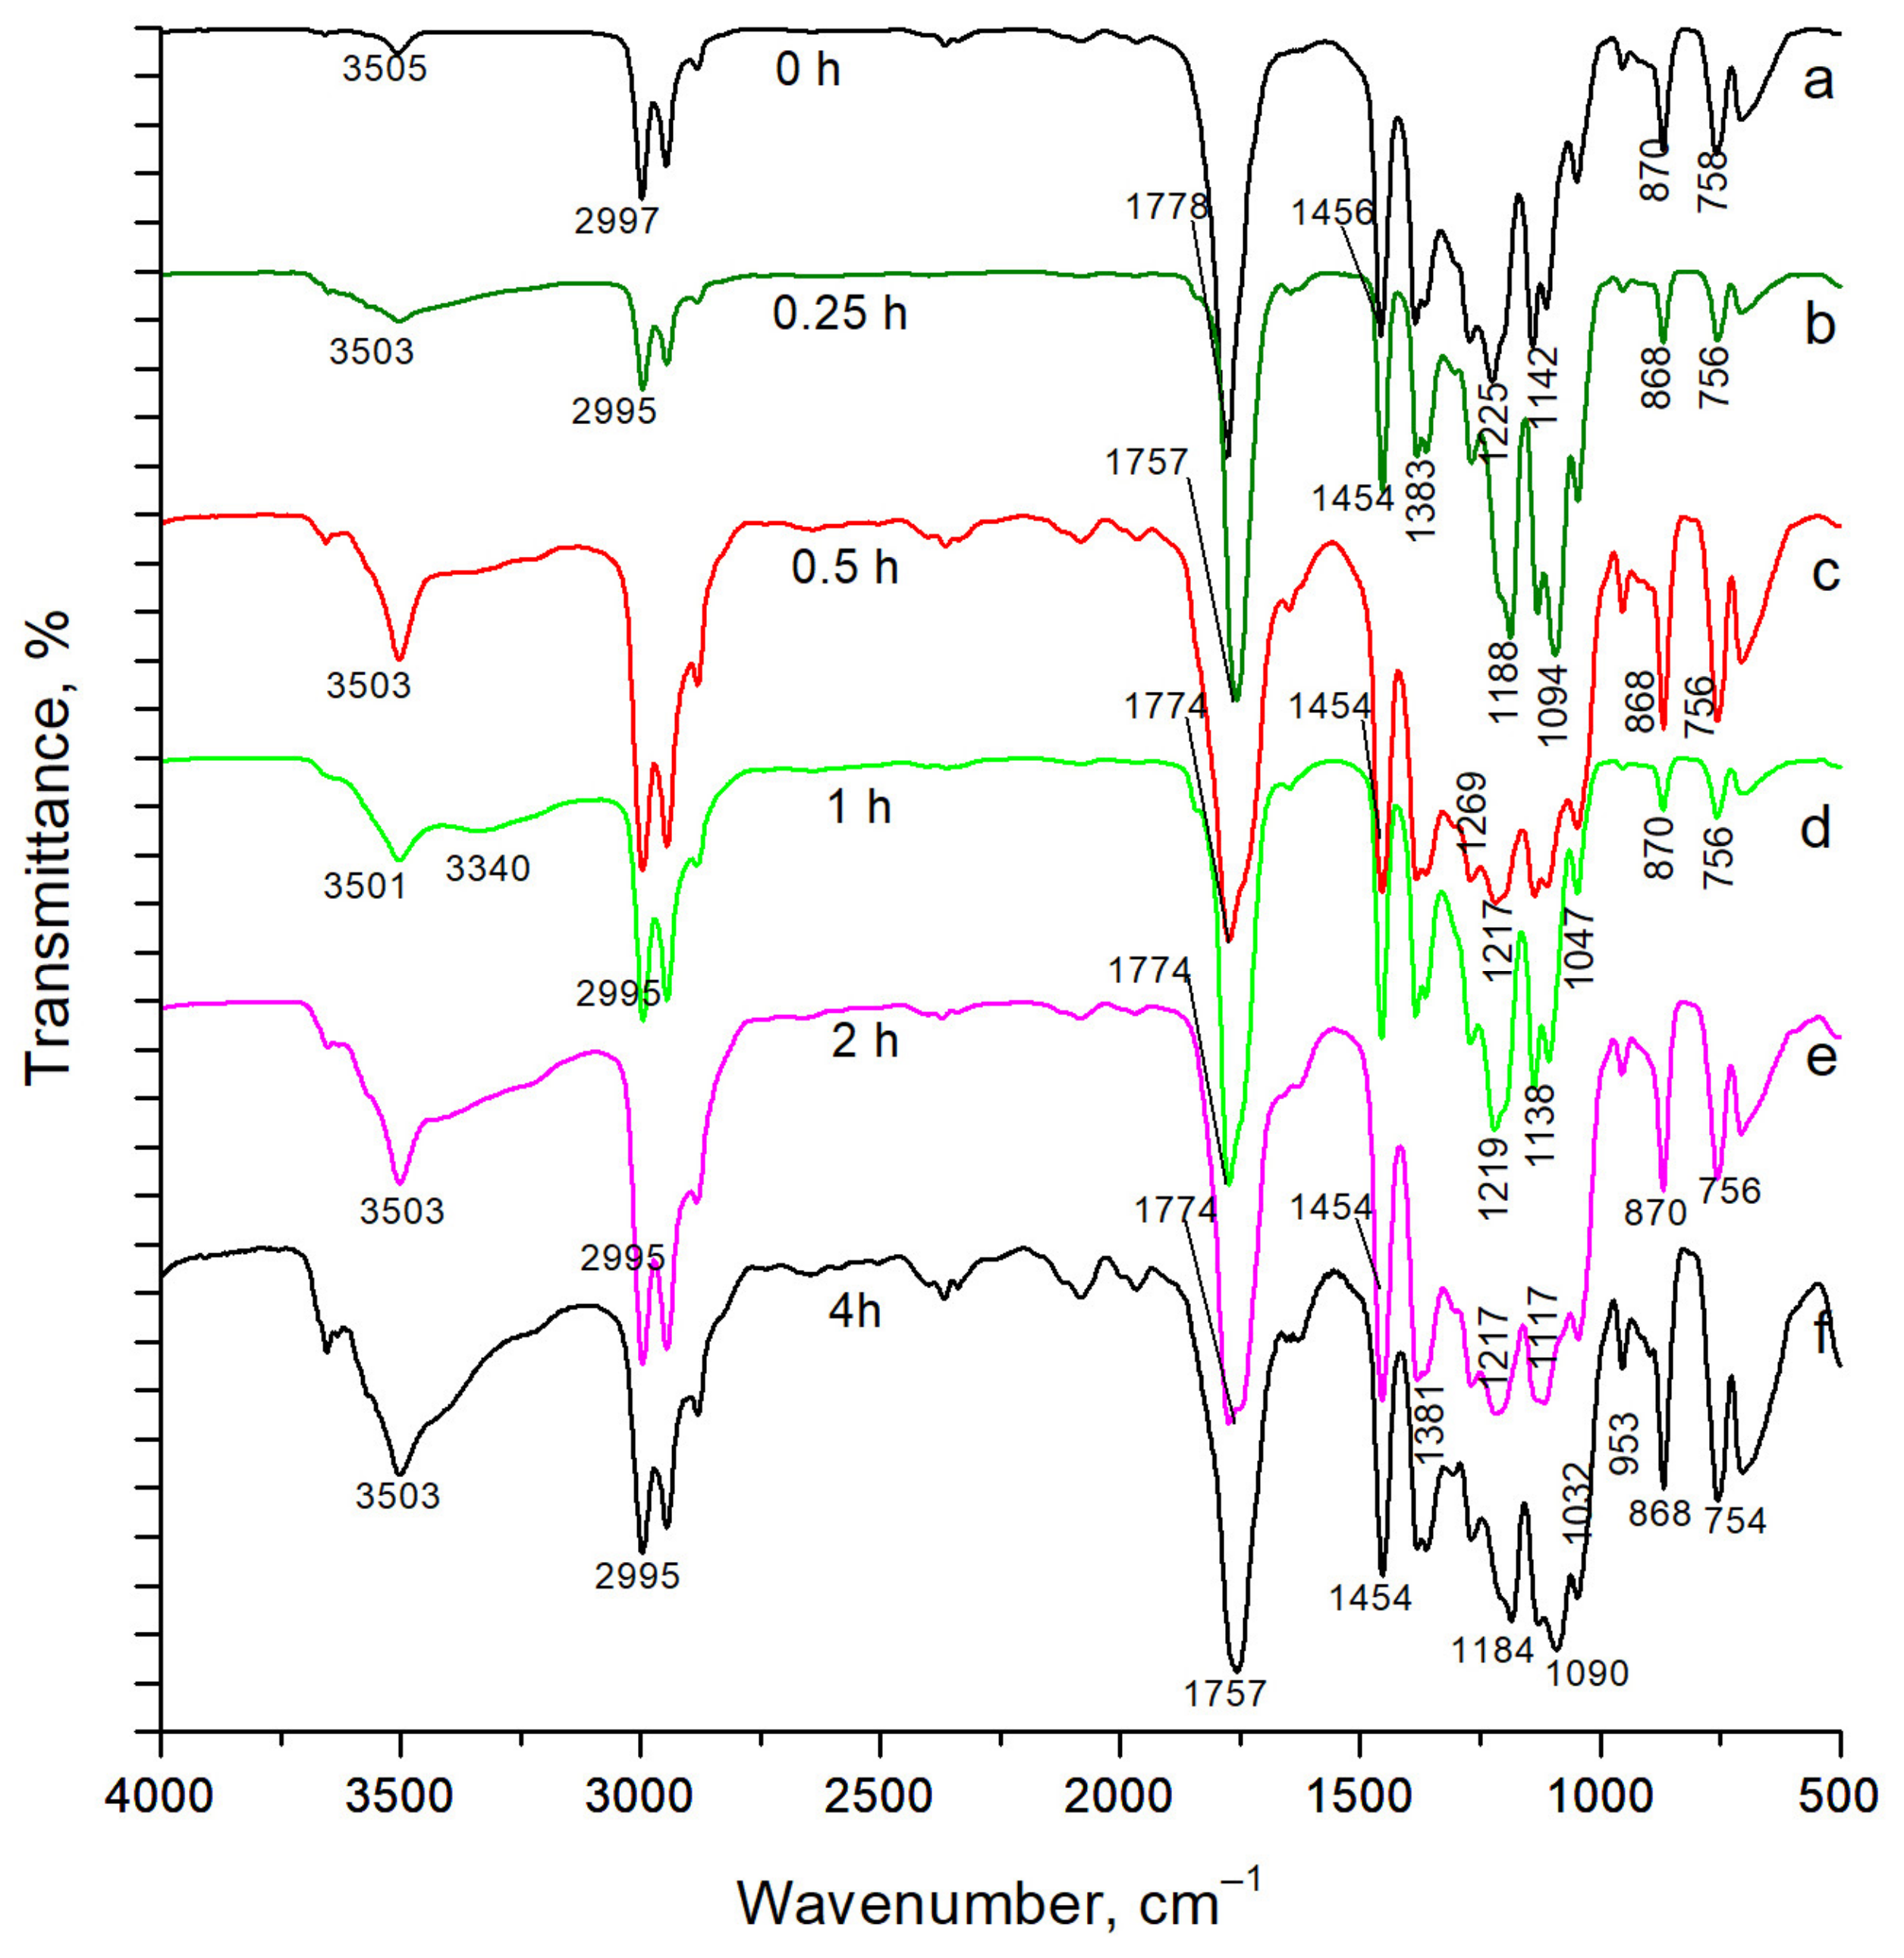
| Wave Number, cm−1 | Band Assignment |
|---|---|
| 3600–3100 | stretch vibrations –OH |
| 2943; 2995 | stretch vibrations –CH– |
| 1774 | stretch vibrations –C=O |
| 1454 | deformation –CH3 |
| 1381; 1361 | deformation –CH– |
| 1219 | deformation –C=O |
| 1200–1100 | stretch vibrations –C–O– |
| 1047 | deformation –OH |
| 953; 868 | stretch vibrations –C–C– |
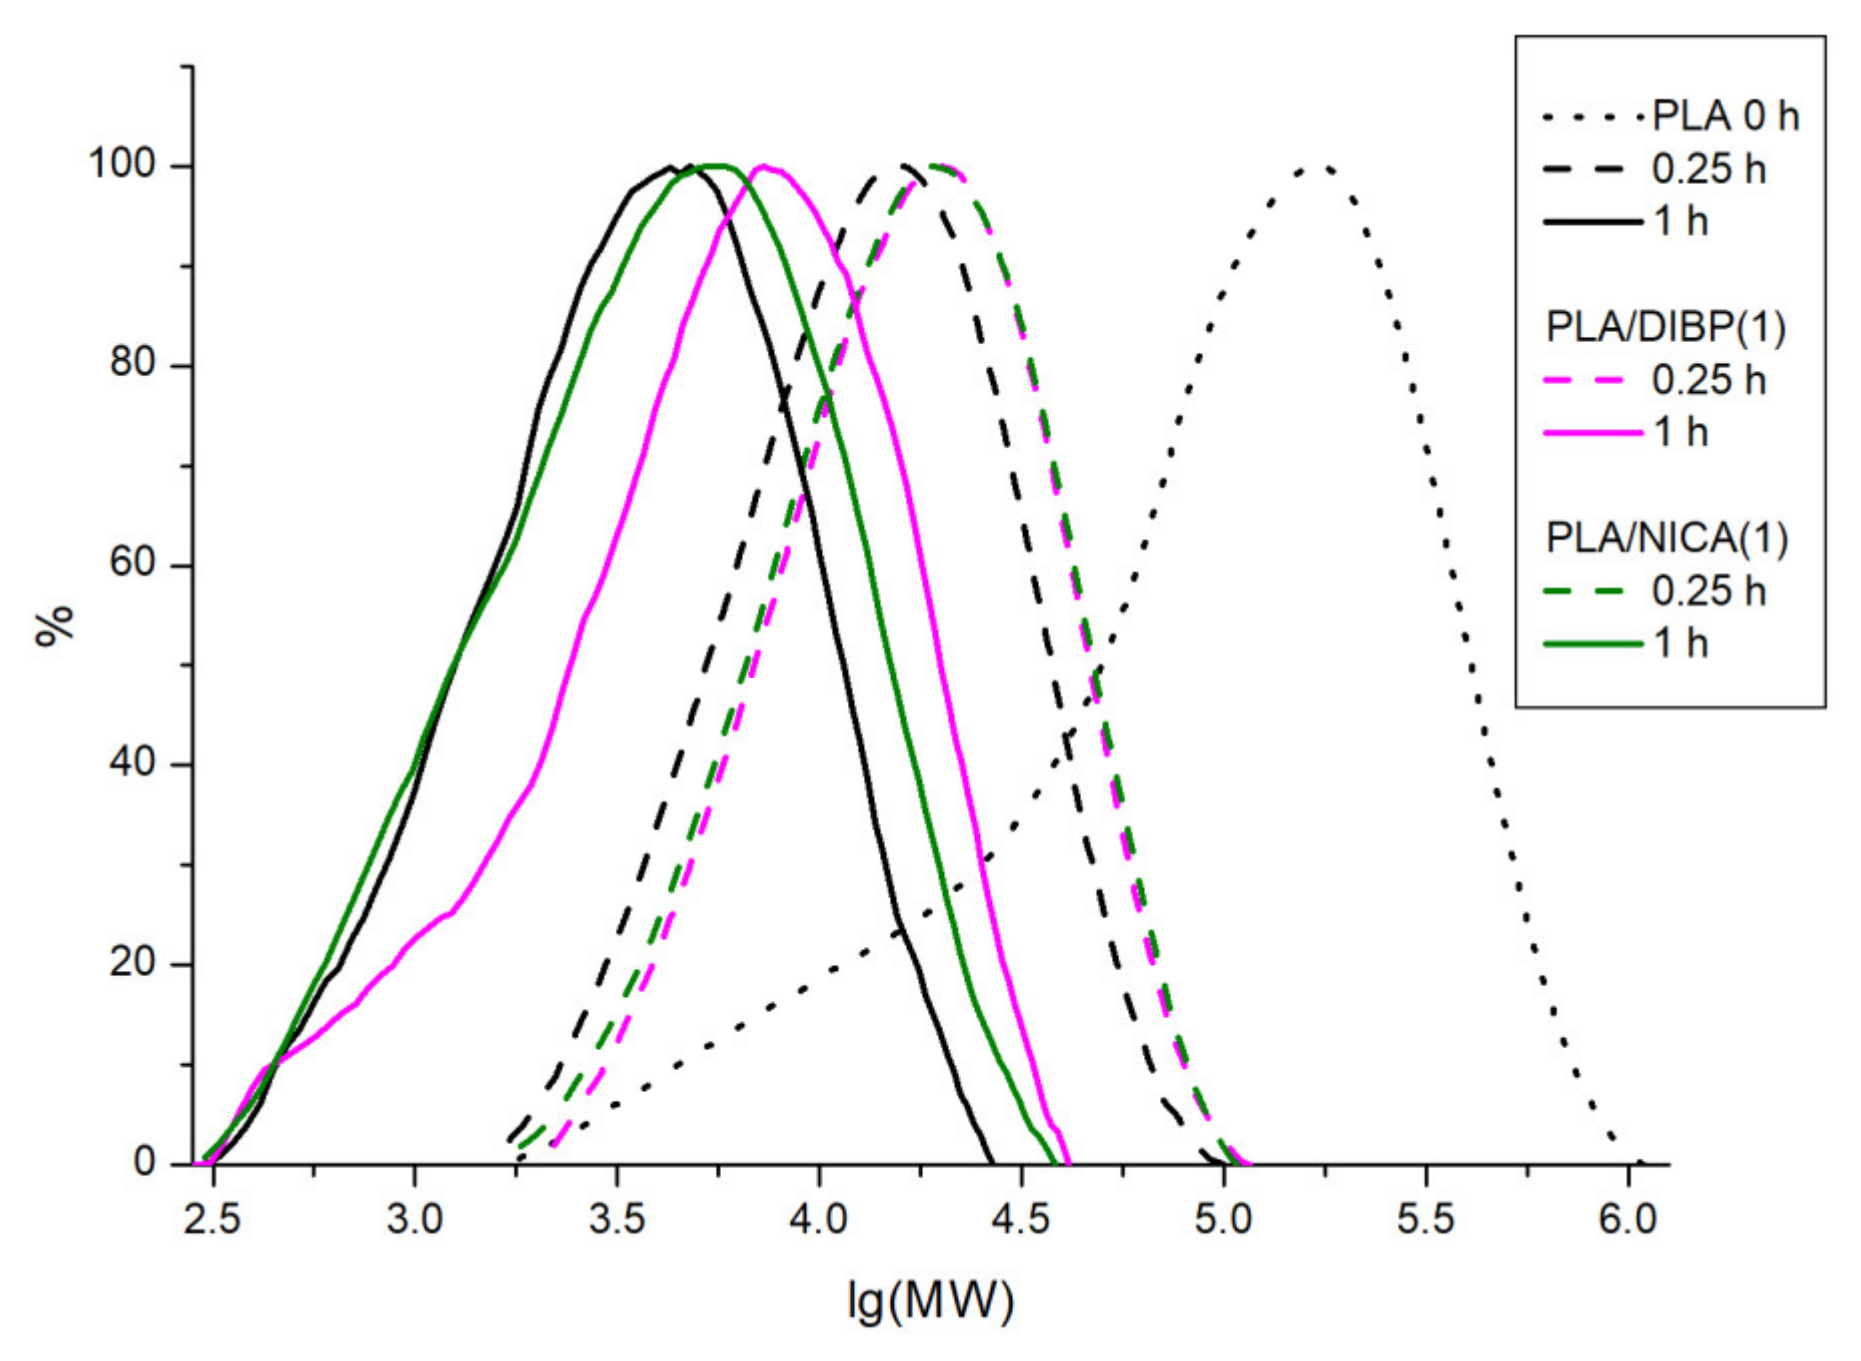
| Sample | Time of UV-C Irradiation, min | Mn, Da | Mw, Da | D |
|---|---|---|---|---|
| PLA | 0 | 51,000 | 168,000 | 3.3 |
| PLA | 15 | 11,000 | 20,000 | 1.7 |
| PLA/DIBP(1) | 15 | 14,000 | 24,000 | 1.7 |
| PLA/NICA(1) | 15 | 14,000 | 24,000 | 1.7 |
| PLA | 60 | 2700 | 5500 | 2.0 |
| PLA/DIBP(1) | 60 | 3900 | 9200 | 2.3 |
| PLA/NICA(1) | 60 | 3000 | 6900 | 2.3 |
| Irradiation Time | Tg, °C | ΔCp*, J/(g·K) | Tcc, °C | Hcc, J/g | Tmelt, °C | Hmelt, J/g | Tdegr, °C |
|---|---|---|---|---|---|---|---|
| 0 h | 60.2 ± 0.5 | 0.50 ± 0.06 | 73.7 ± 1.1 | 12.5 ± 2.2 | 136.3 ± 0.5 | −32.7 ± 2.7 | 319.5 ± 0.6 |
| 0.25 h | 55.7 ± 1.6 | 0.52 ± 0.10 | 69.1 ± 1.4 | 11.0 ± 2.4 | 134.0 ± 1.3 | −16.0 ± 4.6 | 316.0 ± 0.9 |
| 0.5 h | 53.5 ± 1.3 | 0.60 ± 0.04 | 73.3 ± 0.3 | 11.2 ± 3.4 | 119.9 ± 1.1 | −18.4 ± 1.0 | 310.5 ± 0.8 |
| 1 h | 43.3 ± 1.0 | 0.12 ± 0.05 | 53.2 ± 1.6 | 8.8 ± 2.9 | 110.3 ± 0.6 | −8.0 ± 1.1 | 304.2 ± 1.1 |
| 2 h | - | - | 57.3 ± 0.6 | 5.6 ± 2.1 | 104.5 ± 1.8 | −6.2 ± 2.5 | 286.9 ± 7.6 |
| 4 h | - | - | - | - | - | - | 266.9 ± 2.4 |
| 8 h | - | - | - | - | - | - | 260.3 ± 1.7 |
| № | Substance | Retention Time (RT), min | 0 h, % | 1 h, % | 8 h, % |
|---|---|---|---|---|---|
| 1 | Carbon dioxide | 5.45 | 8.95 | 4.35 | 6.9 |
| 2 | Acetaldehyde | 5.539 | 44.31 | 35.71 | 35.39 |
| 3 | Propanoic acid, 2-oxo-, ethyl ester | 5.674 | 2.45 | ||
| 4 | Acetic acid | 5.836 | 1.03 | ||
| 5 | 2-Butanone | 5.948 | 0.7 | ||
| 6 | Propanoic acid | 6.265 | 3.81 | ||
| 7 | Butanedioic acid | 6.319 | 3.82 | ||
| 8 | 2,3-Pentanedione | 6.357 | 2.11 | 6.99 | |
| 9 | 3-Hexanone | 7.103 | 0.88 | ||
| 10 | 1-Butene-3-ethoxy | 7.302 | 0.92 | ||
| 11 | Methyltartronic acid | 7.484 | 4.48 | 10.59 | |
| 12 | 2-methyl-2-butenoic acid | 7.665 | 1.08 | 1.56 | |
| 13 | 2-methyl-2-butenoic acid | 7.996 | 0.46 | 3.25 | 2.18 |
| 14 | 2,5-Furandione, 3,4-dimethyl- | 9.002 | 0.33 | ||
| 15 | Ethene, ethoxy- | 9.101 | 0.85 | 1.7 | 1.74 |
| 16 | Ethene, ethoxy- | 9.114 | 1.39 | ||
| 17 | Propiolactone | 9.231 | 0.74 | 0.87 | 1.06 |
| 18 | 1,4-Dioxane-2,5-dione, 3,6-dimethyl-, (3S-cis)-(Meso-lactide) | 9.665 | 7.14 | 6.66 | 5.51 |
| 19 | 1,4-Dioxane-2,5-dione, 3,6-dimethyl-, (3S-cis)- | 9.842 | 0.58 | ||
| 20 | 1,4-Dioxane-2,5-dione, 3,6-dimethyl-, (3S-cis)-(L-lactide) | 9.933 | 25.08 | 23.41 | 20.43 |
| 21 | Propanoic acid, 2-(methoxymethoxy)- | 10.049 | 0.57 | 1.13 | |
| 22 | Succinic anhydride | 10.298 | 1.04 | ||
| 23 | Propanoic acid, 2-hydroxy-, butyl ester | 12.378 | 1.82 | ||
| 24 | 2-Oxopentanedioic acid | 12.885 | 0.95 | ||
| 25 | Succinic acid, 2-butoxyethyl ethyl ester | 13.668 | 0.8 | ||
| 26 | Propanoic acid, 2-methyl-, 2-ethyl-3-hydroxyhexyl ester | 14.256 | 0.9 | 1.81 | |
| 27 | Succinic acid, 2-butoxyethyl ethyl ester | 14.682 | 1.29 | ||
| 28 | Succinic acid, 2-butoxyethyl ethyl ester | 15.401 | 0.57 | 0.84 | |
| 29 | Propanoic acid, 2-methyl-, 2-ethyl-3-hydroxyhexyl ester | 16.035 | 0.49 | 1.09 | |
| 30 | 1,1,2-Ethanetricarboxylic acid, triethyl ester | 16.48 | 1.11 |
Disclaimer/Publisher’s Note: The statements, opinions and data contained in all publications are solely those of the individual author(s) and contributor(s) and not of MDPI and/or the editor(s). MDPI and/or the editor(s) disclaim responsibility for any injury to people or property resulting from any ideas, methods, instructions or products referred to in the content. |
© 2024 by the authors. Licensee MDPI, Basel, Switzerland. This article is an open access article distributed under the terms and conditions of the Creative Commons Attribution (CC BY) license (https://creativecommons.org/licenses/by/4.0/).
Share and Cite
Belyi, V.; Kuzivanov, I.M.; Fedorova, I.; Shumova, O.A.; Paderin, N.; Markov, P.A.; Pikovskoi, I.I.; Chukicheva, I.Y.; Kutchin, A.V. Isobornyl and Isocamphyl Photostabilizers in Poly(lactic acid)-Based Electrospun Fibers. Polymers 2024, 16, 855. https://doi.org/10.3390/polym16060855
Belyi V, Kuzivanov IM, Fedorova I, Shumova OA, Paderin N, Markov PA, Pikovskoi II, Chukicheva IY, Kutchin AV. Isobornyl and Isocamphyl Photostabilizers in Poly(lactic acid)-Based Electrospun Fibers. Polymers. 2024; 16(6):855. https://doi.org/10.3390/polym16060855
Chicago/Turabian StyleBelyi, Vladimir, Ivan M. Kuzivanov, Irina Fedorova, Olga A. Shumova, Nikita Paderin, Pavel A. Markov, Ilya I. Pikovskoi, Irina Yu. Chukicheva, and Alexander V. Kutchin. 2024. "Isobornyl and Isocamphyl Photostabilizers in Poly(lactic acid)-Based Electrospun Fibers" Polymers 16, no. 6: 855. https://doi.org/10.3390/polym16060855