Article

On the Relation between Natural and Enforced Syneresis of Acidic Precipitated Silica

Institute of Thermal Process Engineering, Karlsruhe Institute of Technology (KIT), Kaiserstraße 12, 76131 Karlsruhe, Germany
*
Author to whom correspondence should be addressed.
Polymers 2014, 6(12), 2896-2911; https://doi.org/10.3390/polym6122896
Submission received: 11 September 2014 / Revised: 12 November 2014 / Accepted: 19 November 2014 / Published: 26 November 2014
(This article belongs to the Special Issue Polymer Colloids)

Abstract

:
Silica in industrial production processes is precipitated by mixing an acid and an inorganic precursor. In this aqueous solution, silica particles form due to a polymerization reaction and agglomeration and, finally, build a gel. Thereafter, the reaction continues, and the gel network shrinks with the expulsion of the enclosed pore liquid. This slow process is known as “natural syneresis” and strongly affects the product properties, such as the agglomerate size, specific surface or porosity of the silica produced. In order to investigate the influence of process parameters, such as temperature, pH or ionic strength, on the shrinkage in shorter time-scales, we propose an acceleration of this process and define it as “enforced syneresis”. The acceleration is performed by applying a mechanical external force to the gel by means of a plunger and measuring the shrinkage behavior under these conditions. Thereby, the conceptual idea is the prediction of the shrinkage due to natural syneresis based on the results of enforced syneresis. We are now able to predict the natural syneresis behavior from enforced syneresis data by the development of a correlative model. Using this prediction model, we can show the influence of temperature on the maximum shrinkage and on its rate in a significantly shorter time of about 12 h instead of several days.

Graphical Abstract

1. Introduction

Precipitated silica has a wide range of applications. It is used as an inexpensive and inert filling material in the pharmaceutical and rubber industry, as well as a pigment in the color industry. The industrial production of silica is usually carried out in a stirred semi-batch process; see Figure 1. Monomeric silicic acid is formed by mixing aqueous sodium silicate and sulfuric acid, which polymerizes and, eventually, precipitates as solid silica. A particulate gel network forms during this process. That gel network is fragmented continuously by a stirrer, resulting in gel fragments. These fragments restructure due to the continuing polymerization. As a direct consequence of the restructuring, the gel fragments shrink, and the liquid contained is expulsed. This process is known as syneresis [1].
Figure 1. Precipitation process of silica (after [2]).
Polymers 06 02896 g001
Syneresis of precipitated silica is observed even in unstirred and unfragmented gel samples and is known to be a very slow process. Relative volume changes in the order of 15%–18% after five days have been measured [3]. Thus, the analysis of the influences of process parameters, such as temperature, pH and ionic strength, on syneresis takes a lot of time. Syneresis can be accelerated by applying a mechanical external force continuously to the gel sample [4]. This force induces a pressure difference between the gel sample and its environment. As a result, the liquid enclosed drains out of the sample more rapidly. This leads to a decreased demand of time for analysis. We define this process as “enforced syneresis” in contrast to the “natural syneresis” described earlier.
Hence, a method is desirable that correlates natural and enforced syneresis data. For its development, several measurements of enforced syneresis are needed at different temperatures. On the basis of these data, we can predict the rate and the maximum shrinkage of slow natural syneresis. Natural syneresis is measured with an adapted pycnometer device for the validation of this method.
In the first section, we describe the state-of-the-art in the theory of precipitation of silica. This not only includes the theory of polymerization and syneresis, but also, the influence of temperature. Subsequently, an experimental set-up is proposed that permits the measurement of natural and enforced syneresis. Following this part, the results obtained for both types of syneresis are presented and the prediction model is derived.

2. State-of-the-Art

2.1. Precipitation Process of Silica

Liquid routes of producing silica exist, in addition to a gaseous reaction of silicon tetrachloride. Figure 1 shows one of these routes. One possibility is the mixing of solutions of sodium silicate (Na2O·3.3SiO2) and sulfuric acid (H2SO4), resulting in monomeric silicic acid (Si(OH)4) and sodium sulfate (Na2SO4). At typical process conditions, the monomeric silicic acid solution has a concentration of about c Si ( OH ) 4 = 10 5  mg/L . By comparison, its solubility is low ( c Si ( OH ) 4 * = 192 mg/L at pH < 7 and ϑ = 25 °C [1]). Hence, a high supersaturation S = C Si ( OH ) 4 C Si ( OH ) 4 * 500 is induced. In the course of the precipitation process, the supersaturation S is depleted by polymerization of silanol groups (Si–OH) to siloxane bonds (Si–O–Si) with water as a byproduct. Thus, the polymerization of monomeric silicic acid leads to di-, tri- and, finally, larger oligomers [2,5]. These first polymeric clusters are assumed to be stabilized by solvation [5]. They grow and form colloidal solid particles due to further polymerization of monomeric silicic acid. Both the aggregation of clusters and continuing growth contribute to larger solid particles. A gel is finally formed because of their high number density. Typically, the solid content is about of 5% by weight. It is appropriate to define the time that elapses from mixing the reactants to gel formation as gel-time. Further on in the process, this gel is fragmented by mechanical force (e.g., by a stirrer). As the process continues, the fragments shrink, while expelling the liquid enclosed. Typically, the solid particles are separated from the liquid to obtain the silica powder.

2.2. Theory of Polymerization

Three stages can be identified for the polymerization of silica. Firstly, the polymerization of monomeric silicic acid to form solid particles is covered. Secondly, the growth of these particles is reviewed. The third stage comprises the linking together of these particles into branched chains and, eventually, a gel network [6]. In each of these steps, the formation of new siloxane bonds (–Si–O–Si–) by polymerization of two silanol groups (–Si–OH) takes place. A solution, supersaturated with monomeric silicic acid ( c Si ( OH ) 4 > c Si ( OH ) 4 * ) polymerizes to types of silicic acid with higher molecular weights. In general, silicic acid tends towards a maximum number of siloxane bonds and a minimum number of uncondensed silanol groups [6]. As a result, early polymerization leads to ring structures that, subsequently, develop into cyclic polymers. A further addition of monomer and the linking together of cyclic polymers cause the final larger three-dimensional solid particles. These particles condense internally to a compact state, while their surfaces exhibit uncondensed silanol groups [6].
Only strong acidic gels (pH < 2) are examined in the scope of this work. At this pH range, particle growth becomes negligible after a particle size of about 2–4 nm is reached, because polymerization and dissolution of particles are slow [6]. That can be explained by the essential irreversibility of the polymerization [1]. In return, the silica particles do not repel each other due to a very small ionic charge, so that they can collide and aggregate. Finally, this leads to the gel network that consists of a continuous skeleton, made of solid colloidal particles, and of an immobilized and enclosed liquid [7].
However, the polymerization involves an ionic mechanism that depends on pH. For pH > 2, the polymerization rate is proportional to the concentration of OH ions, while for pH < 2, it is proportional to the concentration of H+ ions [6,8]. At pH ≈ 2, that is, the isoelectric point [1,8], the polymerization rate is at a minimum, resulting in long gel-times [3]. Since only strong acidic gels (pH < 2) are considered in this work, the ionic mechanism for the acid-catalyzed polymerization is explained in more detail.

2.3. Acid-Catalyzed Polymerization and Syneresis

An equilibrium condition between temporarily positively-charged and neutral species of monomeric silicic acid has been proposed [9]. Here, the cationic monomeric silicic acid (–Si–OH2+) is formed by the addition of an H+ ion to a neutral monomeric silicic acid. The cationic monomer polymerizes with a silanol group and forms a new siloxane bond. These two reaction steps are shown in Figure 2. The additional H+ ion of the intermediate is removed by another monomeric silicic acid or water [8].
Figure 2. Formation of cationic monomeric silicic acid and polymerization to a siloxane bond (after [8]).
Polymers 06 02896 g002
After the gel network has formed, the polymerization continues long beyond the gel-point because of a large number of uncondensed silanol groups [1]. In order to minimize the latter, they must come into contact to form new siloxane bonds. However, now, as these silanol groups are attached to the surface of the solid skeleton, their mobility is restricted, resulting in polymerization between neighboring silanol groups. Figure 3 shows schematically the process of syneresis for two solid particles.
Figure 3. Schematic illustration of syneresis.
Polymers 06 02896 g003
Two silanol groups require more space than one siloxane bond. Thus, a newly formed siloxane bond puts stress on the solid skeleton. As long as the solid skeleton remains flexible, the stress is reduced by contraction. This contraction leads to draining of the liquid enclosed. These two mechanisms, the contraction of the solid phase and the resulting expulsion of pore liquid, are known as syneresis [1]. In a further development of syneresis, the solid phase becomes less flexible due to a higher number of stiffening siloxane bonds. As a consequence, the rate of syneresis decelerates. The structural changes during syneresis are believed to be driven by attractive van der Waals forces. Finally, cessation of syneresis is caused by the remaining repulsive forces, i.e., steric hindrance [1].

2.4. Influence of Temperature

Since both processes of solid and gel formation, as well as syneresis are caused by the same polymerization reaction, they are affected in the same way by parameters, such as the temperature, pH and composition of solution [1]. For the purpose of this work, only the effect of temperature is explained. The influence of other process parameters (pH, composition) on the polymerization mechanism can be found in the literature referenced.
The rate of syneresis increases with temperature [10]. Since syneresis involves a kinetic phenomenon, this may be expected. However, the maximum amount of shrinkage decreases [10]. The enclosed pore liquid must move through the solid skeleton to obtain shrinkage. This movement depends on the viscosity of the pore liquid and the reaction rate of the polymerization. The latter affects the permeability and, thus, the compliance of the solid skeleton [1]. The viscosity of the pore liquid decreases with increasing temperature, but the reaction rate increases disproportionately. The drainage of the pore liquid becomes the rate-limiting process. It is assumed that the stress produced by the formation of siloxane bonds is lowered by shear deformation rather than volume decrease [1]. Thus, for a given number of siloxane bonds, the shrinkage is lower at higher temperatures.
The precipitation process of silica involving the catalytic polymerization of monomeric silicic acid to solid particles and to a gel, as well as the syneresis, is reviewed. In particular, the influence of a pH < 2 and temperature on the syneresis is pointed out. An experimental set-up is suggested for transferring and extending these influences to the “natural” and “enforced” syneresis. They are explained in detail in the next section. In addition, the preparation of the reactants used and their mixing, leading to the gel, is presented.

3. Experimental Set-Up

3.1. Gel Preparation

The silica gel is produced by mixing sodium silicate solution and sulfuric acid in a similar way to the industrial process. The mixing is performed with a Y-mixing nozzle [11] with a volumetric mixing ratio of 1:1 [2,5] at Re = 2300. The use of an electrically-driven syringe pump (Nexus 6000, Chemyx, Stafford, TX, USA) is appropriate to assure constant volumetric flow rates of the reactants during the mixing. Both reactants are thermostated at ϑ = 20 °C. The sulfuric acid used (50% by weight) is prepared by diluting pure sulfuric acid (purity of 96% H2SO4 by weight, Roth GmbH, Karlsruhe, Germany) with deionized water (pH = 5.5, electrical conductivity κ = 2 µS/cm at ϑ = 20 °C). The sodium silicate solution used consists of 40% by weight of sodium water glass. The sodium water glass itself is characterized by a purity of 35.5% Na2O·3.3SiO2 (sodium silicate) by weight (Roth GmbH, Karlsruhe, Germany). The resulting acidic gel is chosen because of its short gel-time (about tgel = 12 min at ϑ = 20 °C), and its theoretical pH (−0.97) is far away from the isoelectric point [4].

3.2. Measurement of Natural Syneresis

Extensive studies exist on the natural syneresis of silica gel made by mixing sulfuric acid and sodium silicate solutions [1,6,7,8]. The shrinkage can be measured with a cathetometer that records only vertical changes in position [3]. The change in the vertical dimension can be converted into a corresponding volume decrease due to the assumption of an isotropic shrinkage.
Here, a different approach is followed to account for the measurement of changes of all geometrical dimensions and their impact on the volume decrease. It is based on the principle of displacement and pycnometry; see Figure 4.
Figure 4. Cross-section of the adapted pycnometer device.
Polymers 06 02896 g004
The pipette tip with a small opening at its top will guarantee that the same volume is always filled in the pycnometer device. Firstly, the maximum filling volume Vfill,max of the pycnometer flask is determined by measuring the maximum filling mass mfill,max and, subsequently, dividing by the temperature-dependent density ρfill of the measurement liquid. After drying the pycnometer, the gel sample, with its volume Vgel, is put into it and its mass mgel is noted. The measurement liquid is poured in, by means of the filling hole, to the maximum filling level (Vfill,max), and the mass mfill is weighed. The volume Vfill can be calculated. Following this, the volume of the gel sample Vgel is computed by a simple subtraction.
In this work, cylindrical gel samples (dgel = 18 mm and Vgel ≈ 6 mL) are prepared at ϑ = 20 °C. Each gel sample is put into one pycnometer flask (dflask = 28 mm and Vfill,max = 25 mL) and sealed with its own stopper, so that the process of syneresis occurs directly in the flask. Liquid enclosed in the gel is drained during the syneresis. It must be removed from the flask before the measurement liquid (deionized water) is filled in, which allows for the calculation of the gel volume Vgel. Because the gel comes into contact with deionized water and, thus, its chemical composition may change, it cannot be used for further analysis. A series of gel samples is prepared to record the time-dependent volume changes (ΔV/V0). In this case, 36 (12 × 3) samples are used. Three samples are analyzed to obtain a measurement point, and their volume changes are averaged in order to compensate for inaccuracies. Hence, 12 measuring points can be observed. The temperature-dependent density of the measurement liquid, i.e., deionized water, affects the determination of the maximum filling volume Vfill,max and gel volume Vgel. Tabulated values for densities are taken from the literature [12]. The temperature of the measurement liquid is noted at each measuring point and accounted for. All pycnometer flasks are immersed in the same thermostated water bath at measuring temperatures of 20, 40 and 60 °C.

3.3. Measurement of Enforced Syneresis

The idea of enforced syneresis is to accelerate the natural syneresis by applying an external force F to the gel sample. Consequently, a pressure difference Δp between the gel sample and the environment is induced in order to drain out the liquid enclosed. For that purpose, a material testing machine in combination with a measuring cell (see Figure 5) is used [4]. The material testing machine (ProLine Z010, Zwick/Roell, Ulm, Germany) puts a specified force F (in this work, 100 N ≤ F ≤ 1950 N, corresponding to a pressure difference of 0.8 bar ≤ Δp ≤ 15.5 bar) on the gel sample and records the resulting change in sample height that can be converted to a corresponding volume decrease ΔV/V0. The gel sample investigated is prepared as described previously. Its volume is about Vsample = 20 mL, corresponding to a sample height of Ssample = 16 mm. The liquid enclosed has to cover half of this distance at the maximum before it is poured out of the gel sample. In the case of natural syneresis, that distance corresponds to the radius of the gel samples (dgel = 2rgel = 18 mm). Thus, the characteristic distances that must be flowed through by the liquid enclosed are similar.
Figure 5. The setup of the measuring cell for enforced syneresis (after [4]).
Polymers 06 02896 g005
The head-plate, cylinder and base‑plate are made of stainless steel. Porous sintered filter plates (Tridelta Siperm R) are employed for the support of the nanofiltration membranes (Filmtec NF270, Dow, Terneuzen, The Netherlands), which are necessary for retention of the gel. The force F is applied to the gel sample by means of the plunger. Liquid contained in the gel sample may pass through the membranes and is picked up by a lower collecting device or pushed upwards through the head-plate. As with the pycnometer flasks, the measuring cell is immersed in a thermostated water-bath to ensure a constant temperature during the experiment.

4. Syneresis of Silica Gel

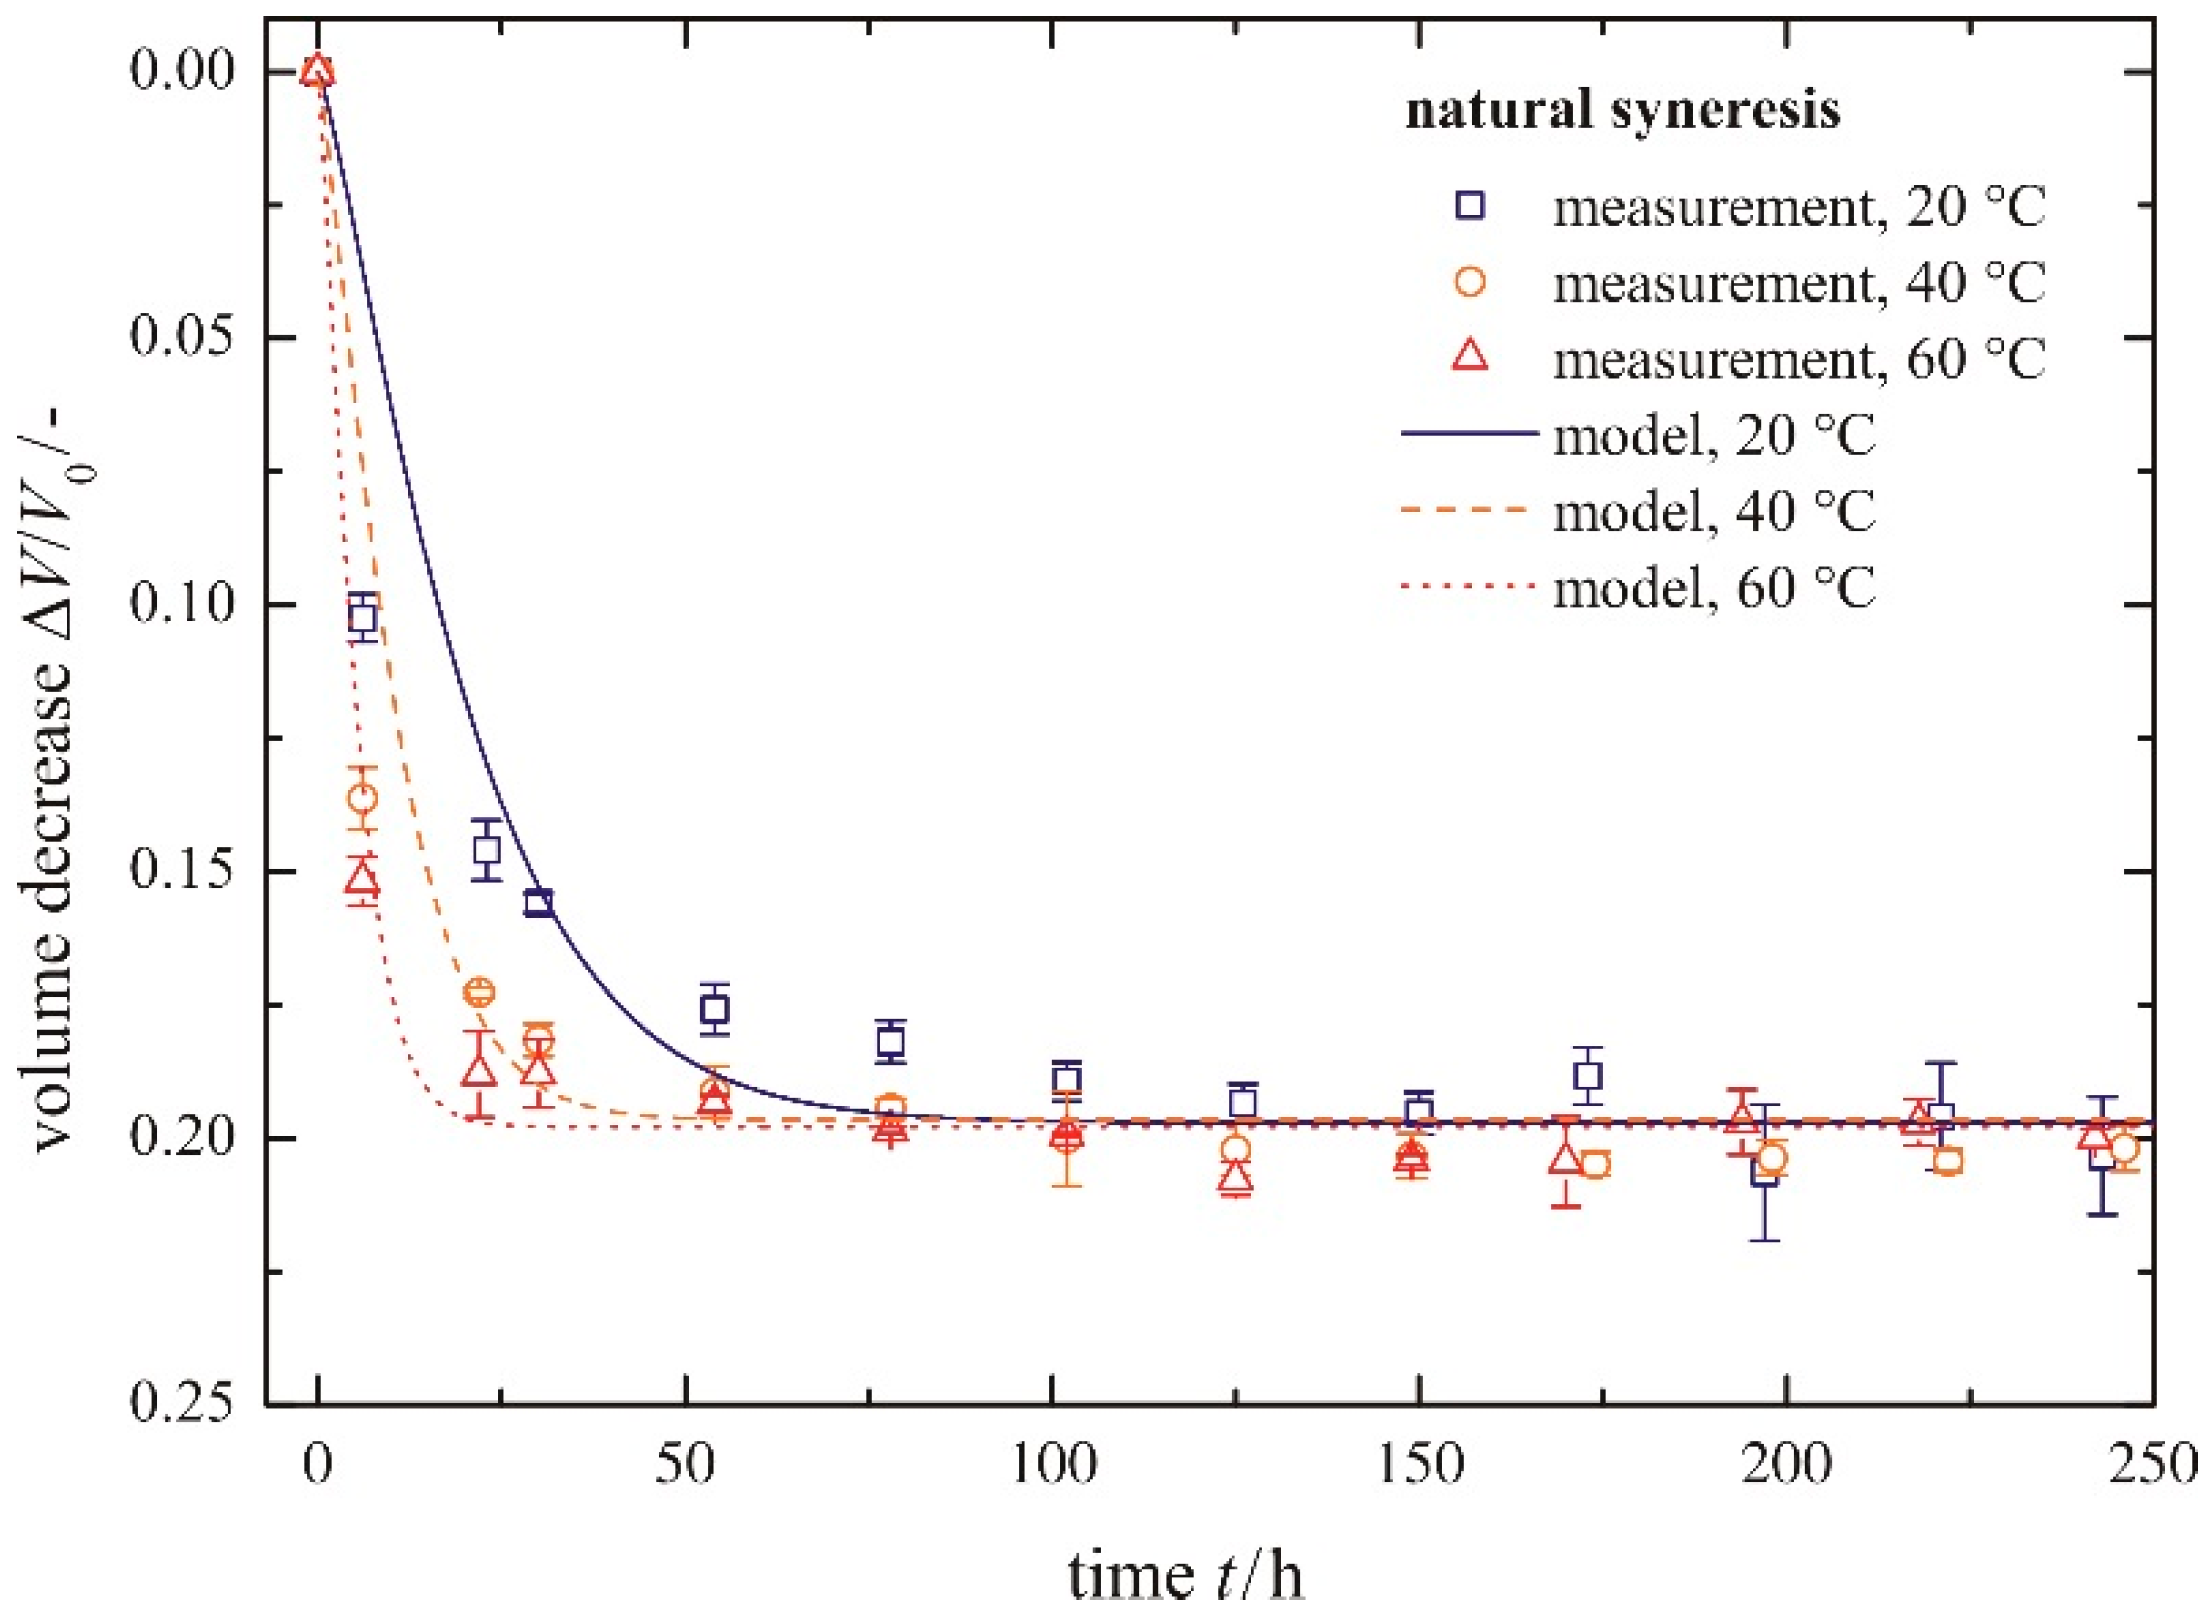
4.1. Natural Syneresis

The time-dependent development of the volume decrease ΔV/V0 for three different temperatures is presented in Figure 6. Each symbol represents the averaged value of three measured gel samples. The scale of the Y-axis is inverted, so that gel samples with smaller volumes (i.e., higher values for a volume decrease ΔV/V0) are shown in the lower part of the diagram. This figure can be split into two sections, independent of temperature. The first section is for t ≤ 50 h and the second one for t > 50 h. In the first section, the gel shrinks quickly, because it remains flexible due to uncondensed hydroxyl groups. With time, these uncondensed groups polymerize, causing a continuously stiffening solid skeleton that can resist further shrinkage. This is expressed in a rate reduction of volume decrease ΔV/V0 in the second section. For longer times, the volume decrease approaches a maximum value (ΔV/V0)max asymptotically. An increase in temperature leads to faster shrinkage of the gel, because of a higher movement of the pore liquid through the gel network and a higher polymerization rate. By contrast, the total amount of shrinkage remains unchanged. This is contrary to the phenomenon of a slightly smaller volume decrease with increasing temperature, determined by [10]. When regarding the error bars plotted in Figure 6, this statement can be neither proven nor disproven.
Figure 6. Volume decrease for different temperatures, natural syneresis.
Polymers 06 02896 g006
For the description of the course of volume decrease with time and its maximum value at t→∞ by means of a mathematical model, each curve may be fitted via an empirical model that is based upon a kinetic rate equation:
Δ V V 0 ( t ) = ( Δ V V 0 ) max [ 1 exp ( ( t τ ) n ) ]
while the first fit parameter (ΔV/V0)max accounts for the maximum volume decrease, the second parameter τ represents a characteristic time constant affecting the rate of volume decrease. An exponent n is added to ensure a good agreement between the measured and modeled rates. Table 1 lists the values of these fitting parameters.
Table 1. Fitting parameters and fitting errors of the empirical equation for natural syneresis.
Temperature ϑ/°CMaximum Volume Decrease (ΔV/V0)maxTime Constant τ/hExponent nFitting Error R2
200.19721.71.230.868
400.19711.11.230.867
600.1985.61.230.988
The curves of the empirical model are shown in Figure 6. A higher temperature leads to a reduced time constant τ. It turns out that the exponent n varies between 1.21 and 1.25, depending on the temperature. In order to minimize the number of fitting parameters, a constant value of 1.23 is chosen without changing the residuum sum of squares to any appreciable extent. Even in the case of n = 1, the measured rates are reproduced correctly within the error bars, but with a larger residuum sum of squares compared to n = 1.23. We have decided to use n = 1.23 in order to compare the rates at different temperatures.

4.2. Enforced Syneresis

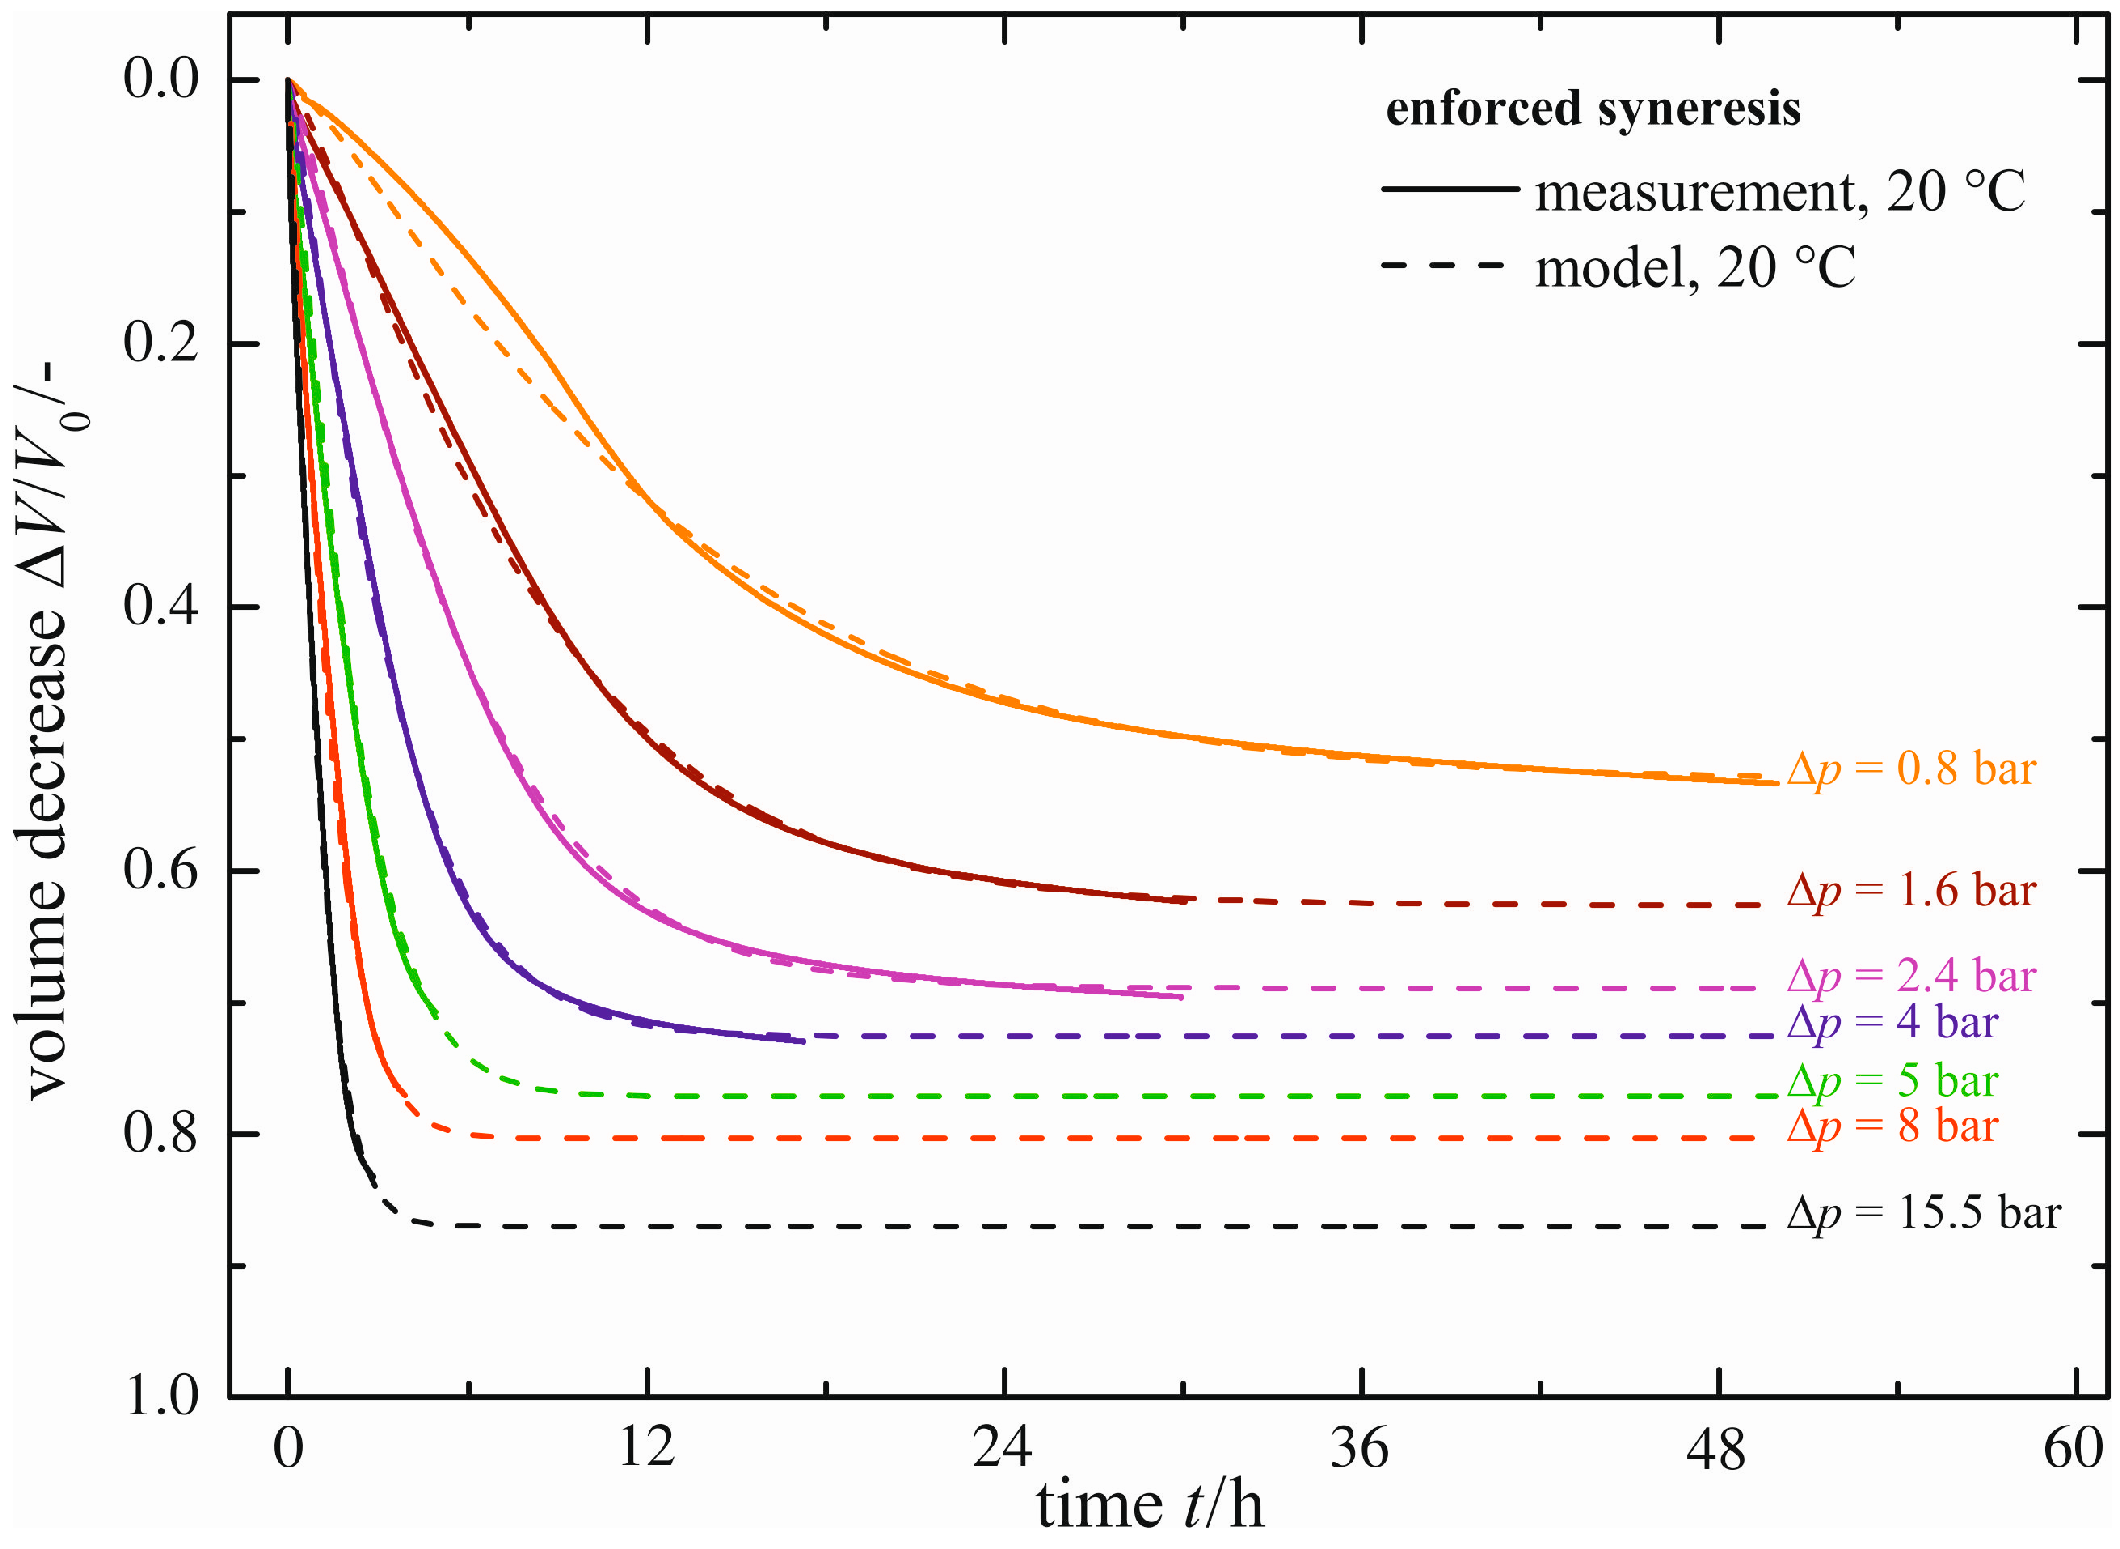
Natural syneresis is a slow and time-consuming shrinkage process; see the previous section. With enforced syneresis, investigations can be made in a significantly shorter time. In Figure 7, the volume decrease ΔV/V0 measured (solid line) is plotted for a constant temperature of ϑ = 20 °C as a function of time t and the pressure difference Δp applied caused by the external force F. As expected, higher pressure differences Δp result in faster gel shrinkage. Similarly, the maximum volume decrease (ΔV/V0)max exhibits larger values. Each curve for the volume decrease ΔV/V0 measured is fitted using the same empirical model (Equation (1)), as already proposed for natural syneresis. The empirical model (dashed lines in Figure 7) is in good accordance with the curves measured. There are small deviations merely for t < 12 h and Δp = 0.8 bar, caused by the empirical model itself.
Figure 7. Enforced syneresis for ϑ = 20 °C.
Polymers 06 02896 g007
Table 2 lists the values of the fitting parameters (ΔV/V0)max and τ, depending on the applied pressure difference Δp for a temperature of ϑ = 20 °C. For reasons of simplicity, the curves for Δp = 3.2 bar and Δp = 6.5 bar are not shown in Figure 7. They lie between the curves of Δp = 2.4 bar and Δp = 4 bar, respectively Δp = 5 bar and Δp = 8 bar. All values reflect quantitatively the conclusion of a larger maximum volume decrease and faster shrinkage due to a larger pressure difference. As for the natural syneresis, we set the exponent n to a constant value of 1.23.
Table 2. Fitting parameters and fitting errors of the empirical equation for enforced syneresis, ϑ = 20 °C.
Pressure Difference Δp/barMaximum Volume Decrease (ΔV/V0)maxTime Constant τ/hExponent nFitting Error R2
0.80.5313.01.230.983
1.60.638.41.230.999
2.40.695.91.230.997
3.20.714.11.230.996
40.733.51.230.996
50.772.31.230.998
6.50.792.01.230.998
80.801.51.230.997
15.50.871.11.230.994
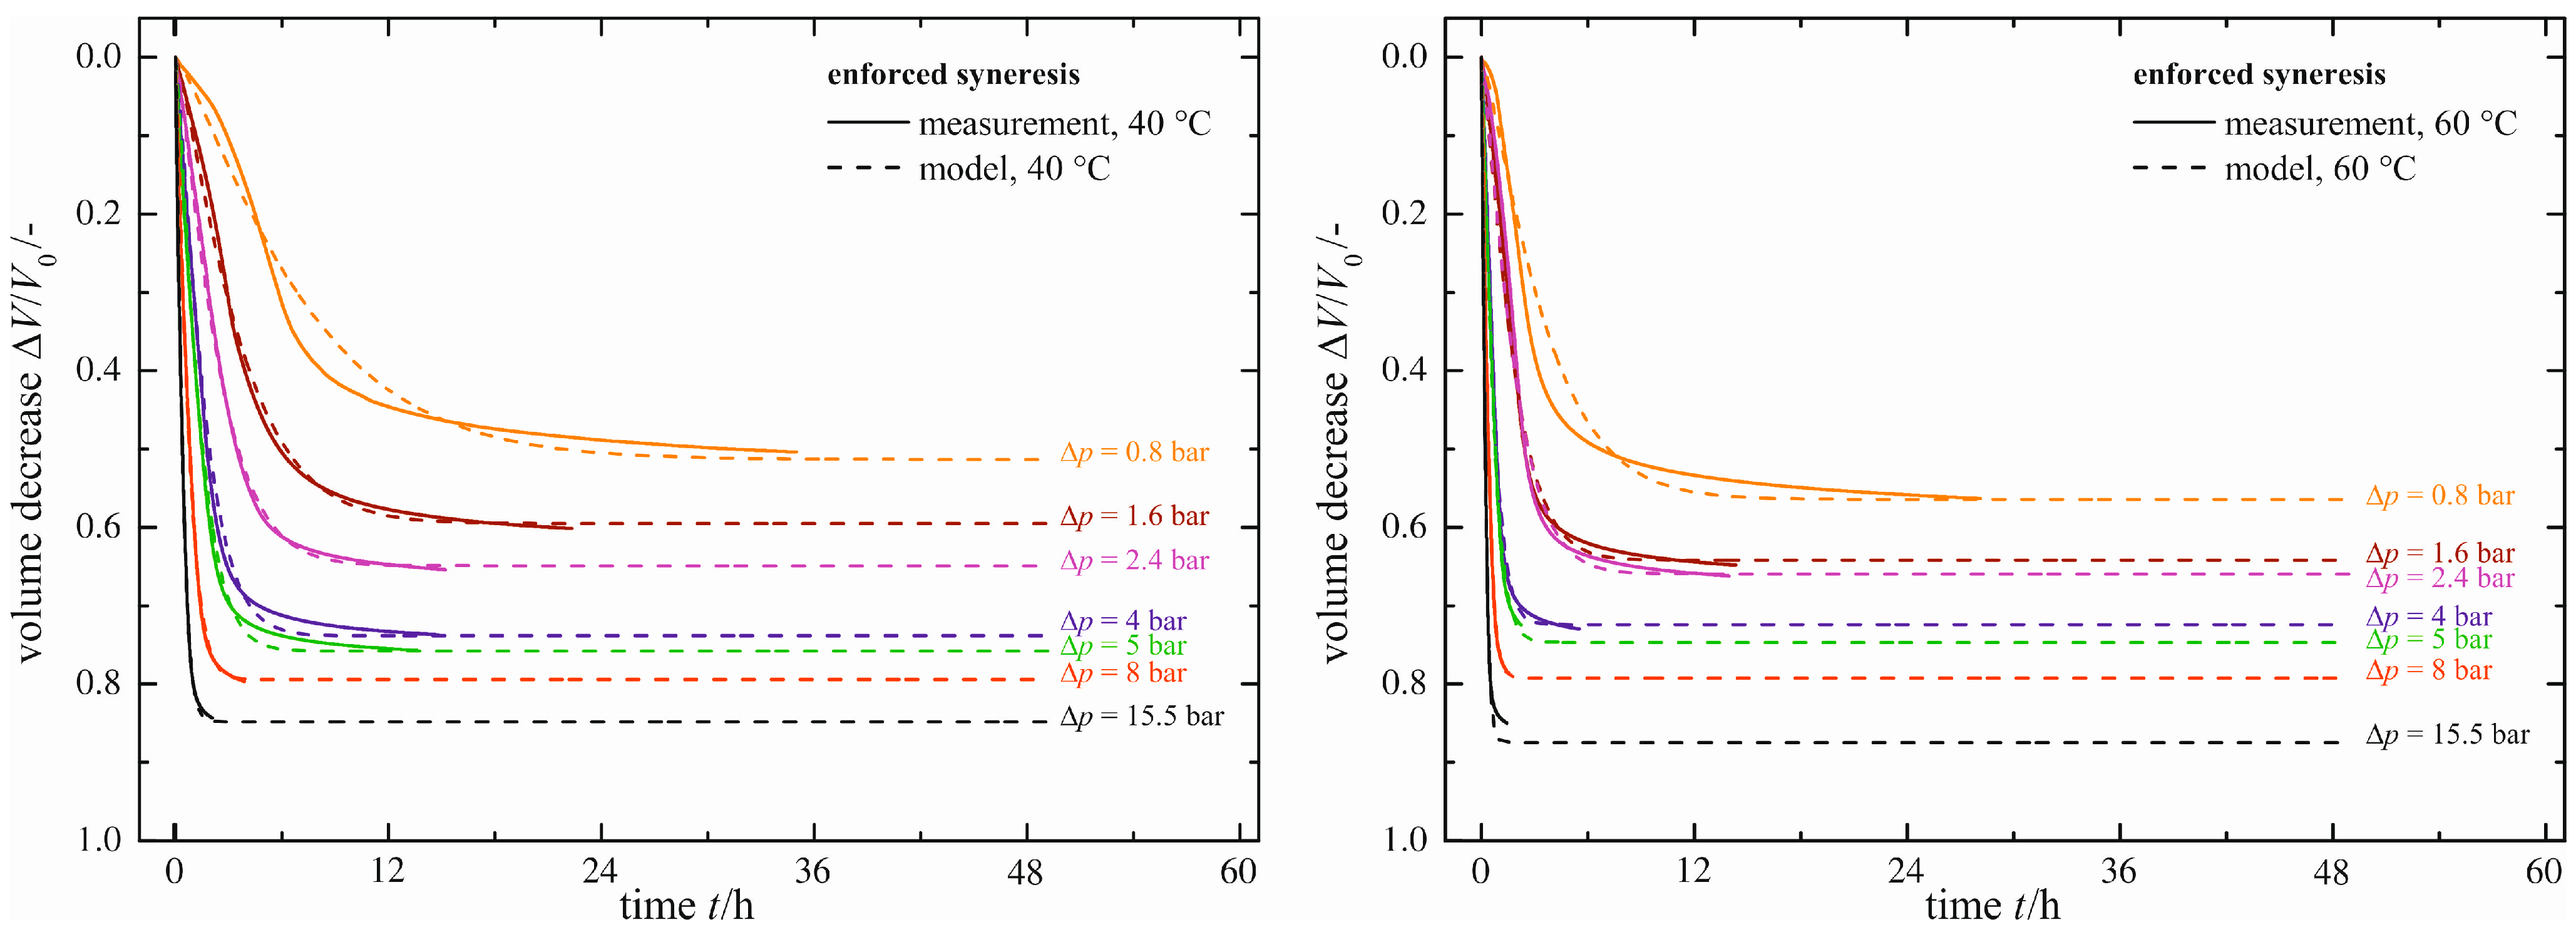
The temperature dependency of enforced syneresis is investigated by raising the temperature to ϑ = 40 °C and ϑ = 60 °C. Figure 8 shows the measurement results (solid lines). In direct comparison with Figure 7, each curve of Δp is shifted to shorter times, but to negligibly different values for the maximum volume decrease (ΔV/V0)max. A temperature change affects only the rate of volume decrease. Thus, enforced syneresis behaves in exactly the same way as natural syneresis with respect to temperature dependency.
Figure 8. Enforced syneresis for ϑ = 40 °C and ϑ = 60 °C.
Polymers 06 02896 g008
The values for the fitting parameters of the empirical model confirm these results. They are listed in Table S1. An increased temperature results in smaller characteristic time constants τ, but the maximum volume decreases (ΔV/V0)max are unaffected.

4.3. Correlation between Natural and Enforced Syneresis

The method for a correlation between natural and enforced syneresis is based upon correlations for the maximum volume decrease (ΔV/V0)max and for the characteristic time constant τ as a function of the pressure difference Δp and temperature ϑ. Firstly, this dependency for the maximum volume decrease (ΔV/V0)max is modeled; see Figure 9. Here, natural syneresis is in accordance with Δp = 0 bar, and the values measured are represented by the filled symbols. The blank symbols correspond to the values of enforced syneresis, listed in Table 2 and Table S1. All of the measured points of enforced syneresis may be fitted with an equation of the form:
ln ( Δ V V 0 ) max = A + B C + Δ p
Table 3 lists the values of the fitting parameters for the three different temperatures of ϑ = 20, 40, 60 °C. The function reflects the progression of enforced syneresis sufficiently. Small deviations occur only for a pressure difference of Δp = 15.5 bar. These can be neglected, because the region of low pressure differences is more relevant for the correlation between natural and enforced syneresis.
Figure 9. Maximum volume decrease (ΔV/V0)max as a function of pressure difference Δp.
Polymers 06 02896 g009
Table 3. Fitting parameters and fitting errors for maximum volume decrease (ΔV/V0)max.
Temperature ϑ/°CParameter AParameter B/barParameter C/barFitting Error R2
20−0.14−0.720.570.979
40−0.14−0.810.570.992
60−0.18−0.610.570.965
In addition to the reflection of enforced syneresis, this model allows for extrapolation to natural syneresis (dotted lines shown in Figure 9). Their logarithmic, extrapolated values correspond to A + B/Cp = 0 bar in Equation (2)) and reach values of ln ( Δ V / V 0 ) max , extra = 1.4 , ln ( Δ V / V 0 ) max , extra = 1.56 and ln ( Δ V / V 0 ) max , extra = 1.25 with increasing temperature. Thus, the maximum volume decreases correspond to ( Δ V / V 0 ) max , extra = 0.25 , ( Δ V / V 0 ) max , extra = 0.21 and ( Δ V / V 0 ) max , extra = 0.29 . By comparison, we measured ( Δ V / V 0 ) max , nat = 0.20 independent of the temperature for natural syneresis. Thus, we are able to predict the maximum volume change qualitatively with a relative error of 25% in the case of ϑ = 20 °C. For ϑ = 60 °C, the error is about 45%. We assume that the errors can be minimized with experiments at even lower pressure differences than Δp = 0.8 bar.
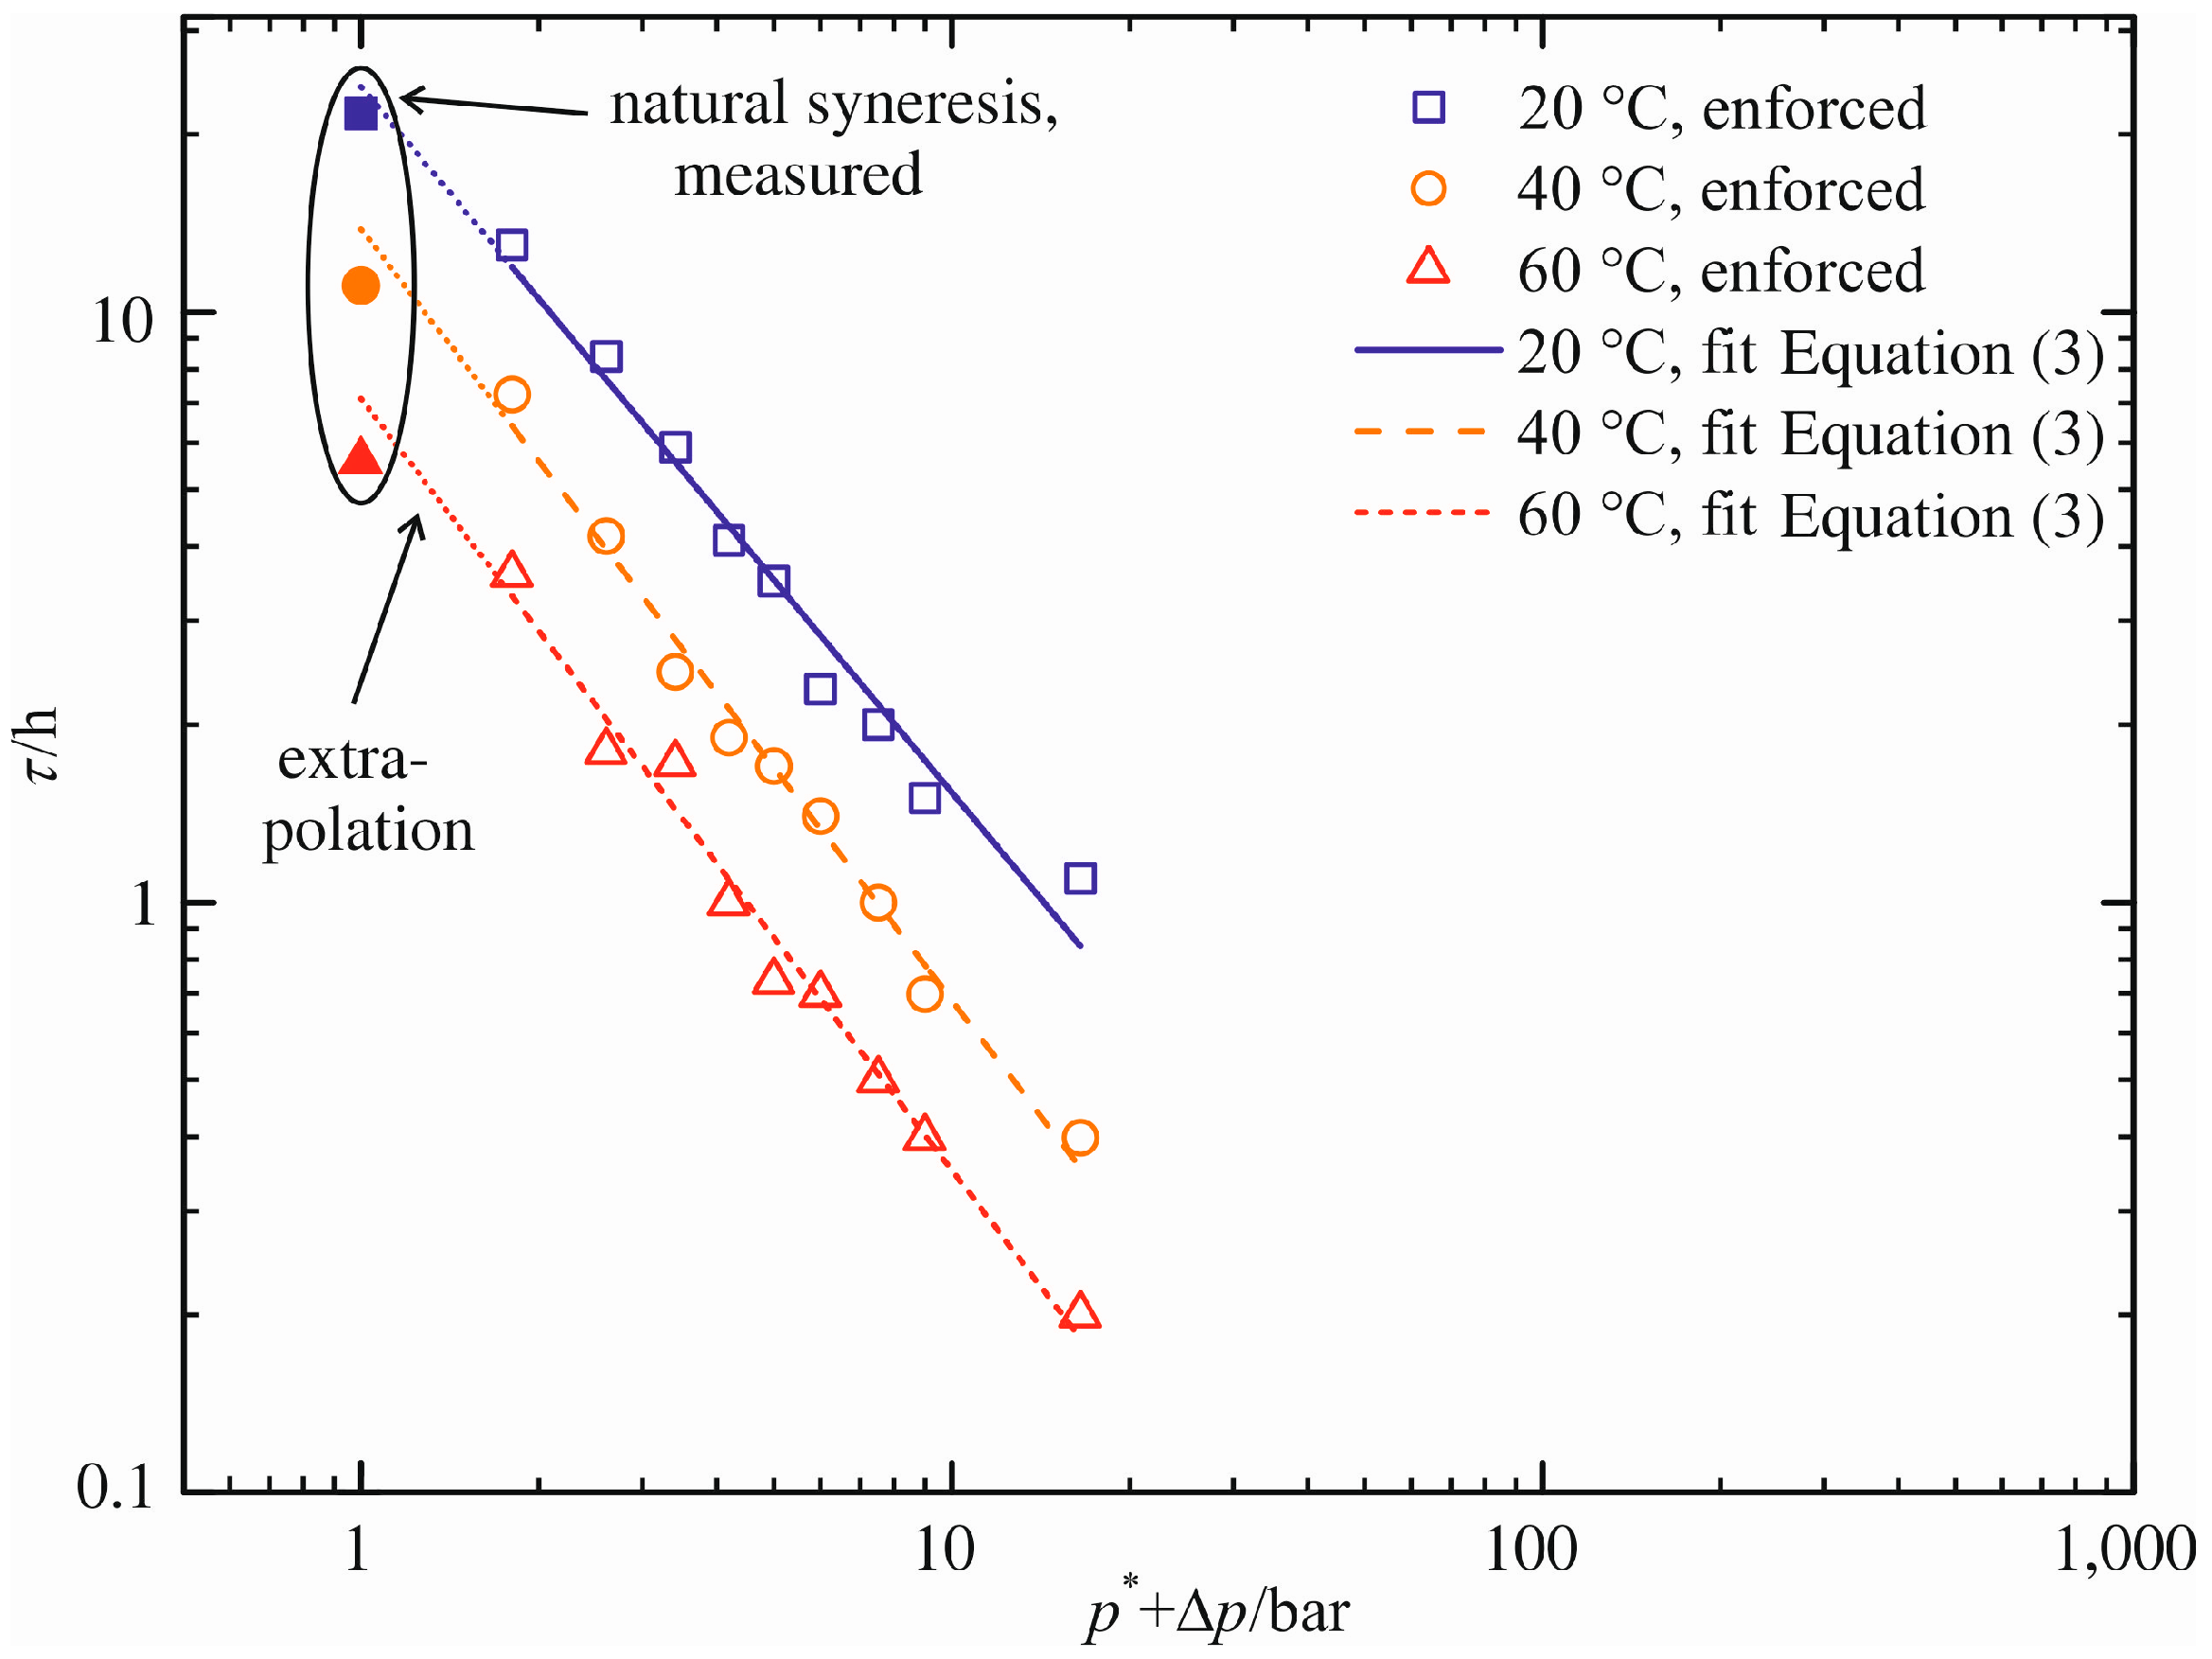
In analogy to the approach for the maximum volume decrease (ΔV/V0)max, the pressure difference dependency of the characteristic time constant τ is correlated. The graphical presentation in a log–log graph is appropriate due to the very different orders of magnitude for τ (0.2 h ≤ τ ≤ 22 h). For that purpose, the pressure difference Δp is unsuitable for the abscissa because of its zero-value for natural syneresis. To compensate for that, an artificial pressure p* = 1 bar is added to the pressure difference Δp. Figure 10 shows this diagram. Similar to the previous figure, the blank symbols represent the measured characteristic time constants τ for enforced syneresis, while the filled symbols mark the measured time constants for natural syneresis. They are listed in Table 1, Table 2 and Table S1.
A linear function of the form:
log ( τ ) = D E log ( p * + Δ p )
is used for the calculation of τ depending on the pressure difference Δp applied. The fitting parameter D represents the extrapolated characteristic time constant τ for natural syneresis. Time constants of enforced syneresis are calculated using the slope E and the pressure difference Δp. Table 4 specifies these two parameters. Their graphical representations are given in Figure 10 (solid, dashed and dotted line). Each linear equation reflects the values of τ determined for enforced syneresis. Natural syneresis is accounted for via an extrapolation to Δp = 0 bar, i.e., D = log(τextra/h).
Figure 10. Characteristic time constant τ as a function of pressure difference Δp.
Polymers 06 02896 g010
In comparison to the measurements (see Table 1), the model overestimates the characteristic time constants. Their extrapolated values are τextra = 24.0 h, τextra = 13.8 h and τextra = 7.1 h for increasing temperature. Thus, the maximum relative error is 24%. As in the case of maximum volume decrease, we assume a minimization of this error through experimental results at lower pressure differences than Δp = 0.8 bar.
Through the combination of Equations (2) and (3), we developed a predictive model that permits the evaluation of both natural and enforced syneresis. In particular, the maximum volume decrease (ΔV/V0)max and the characteristic time constant τ are calculated as a function of the pressure difference Δp applied for the process of syneresis. A comparison between the measured and predicted progress of enforced syneresis for ϑ = 20 °C is shown in
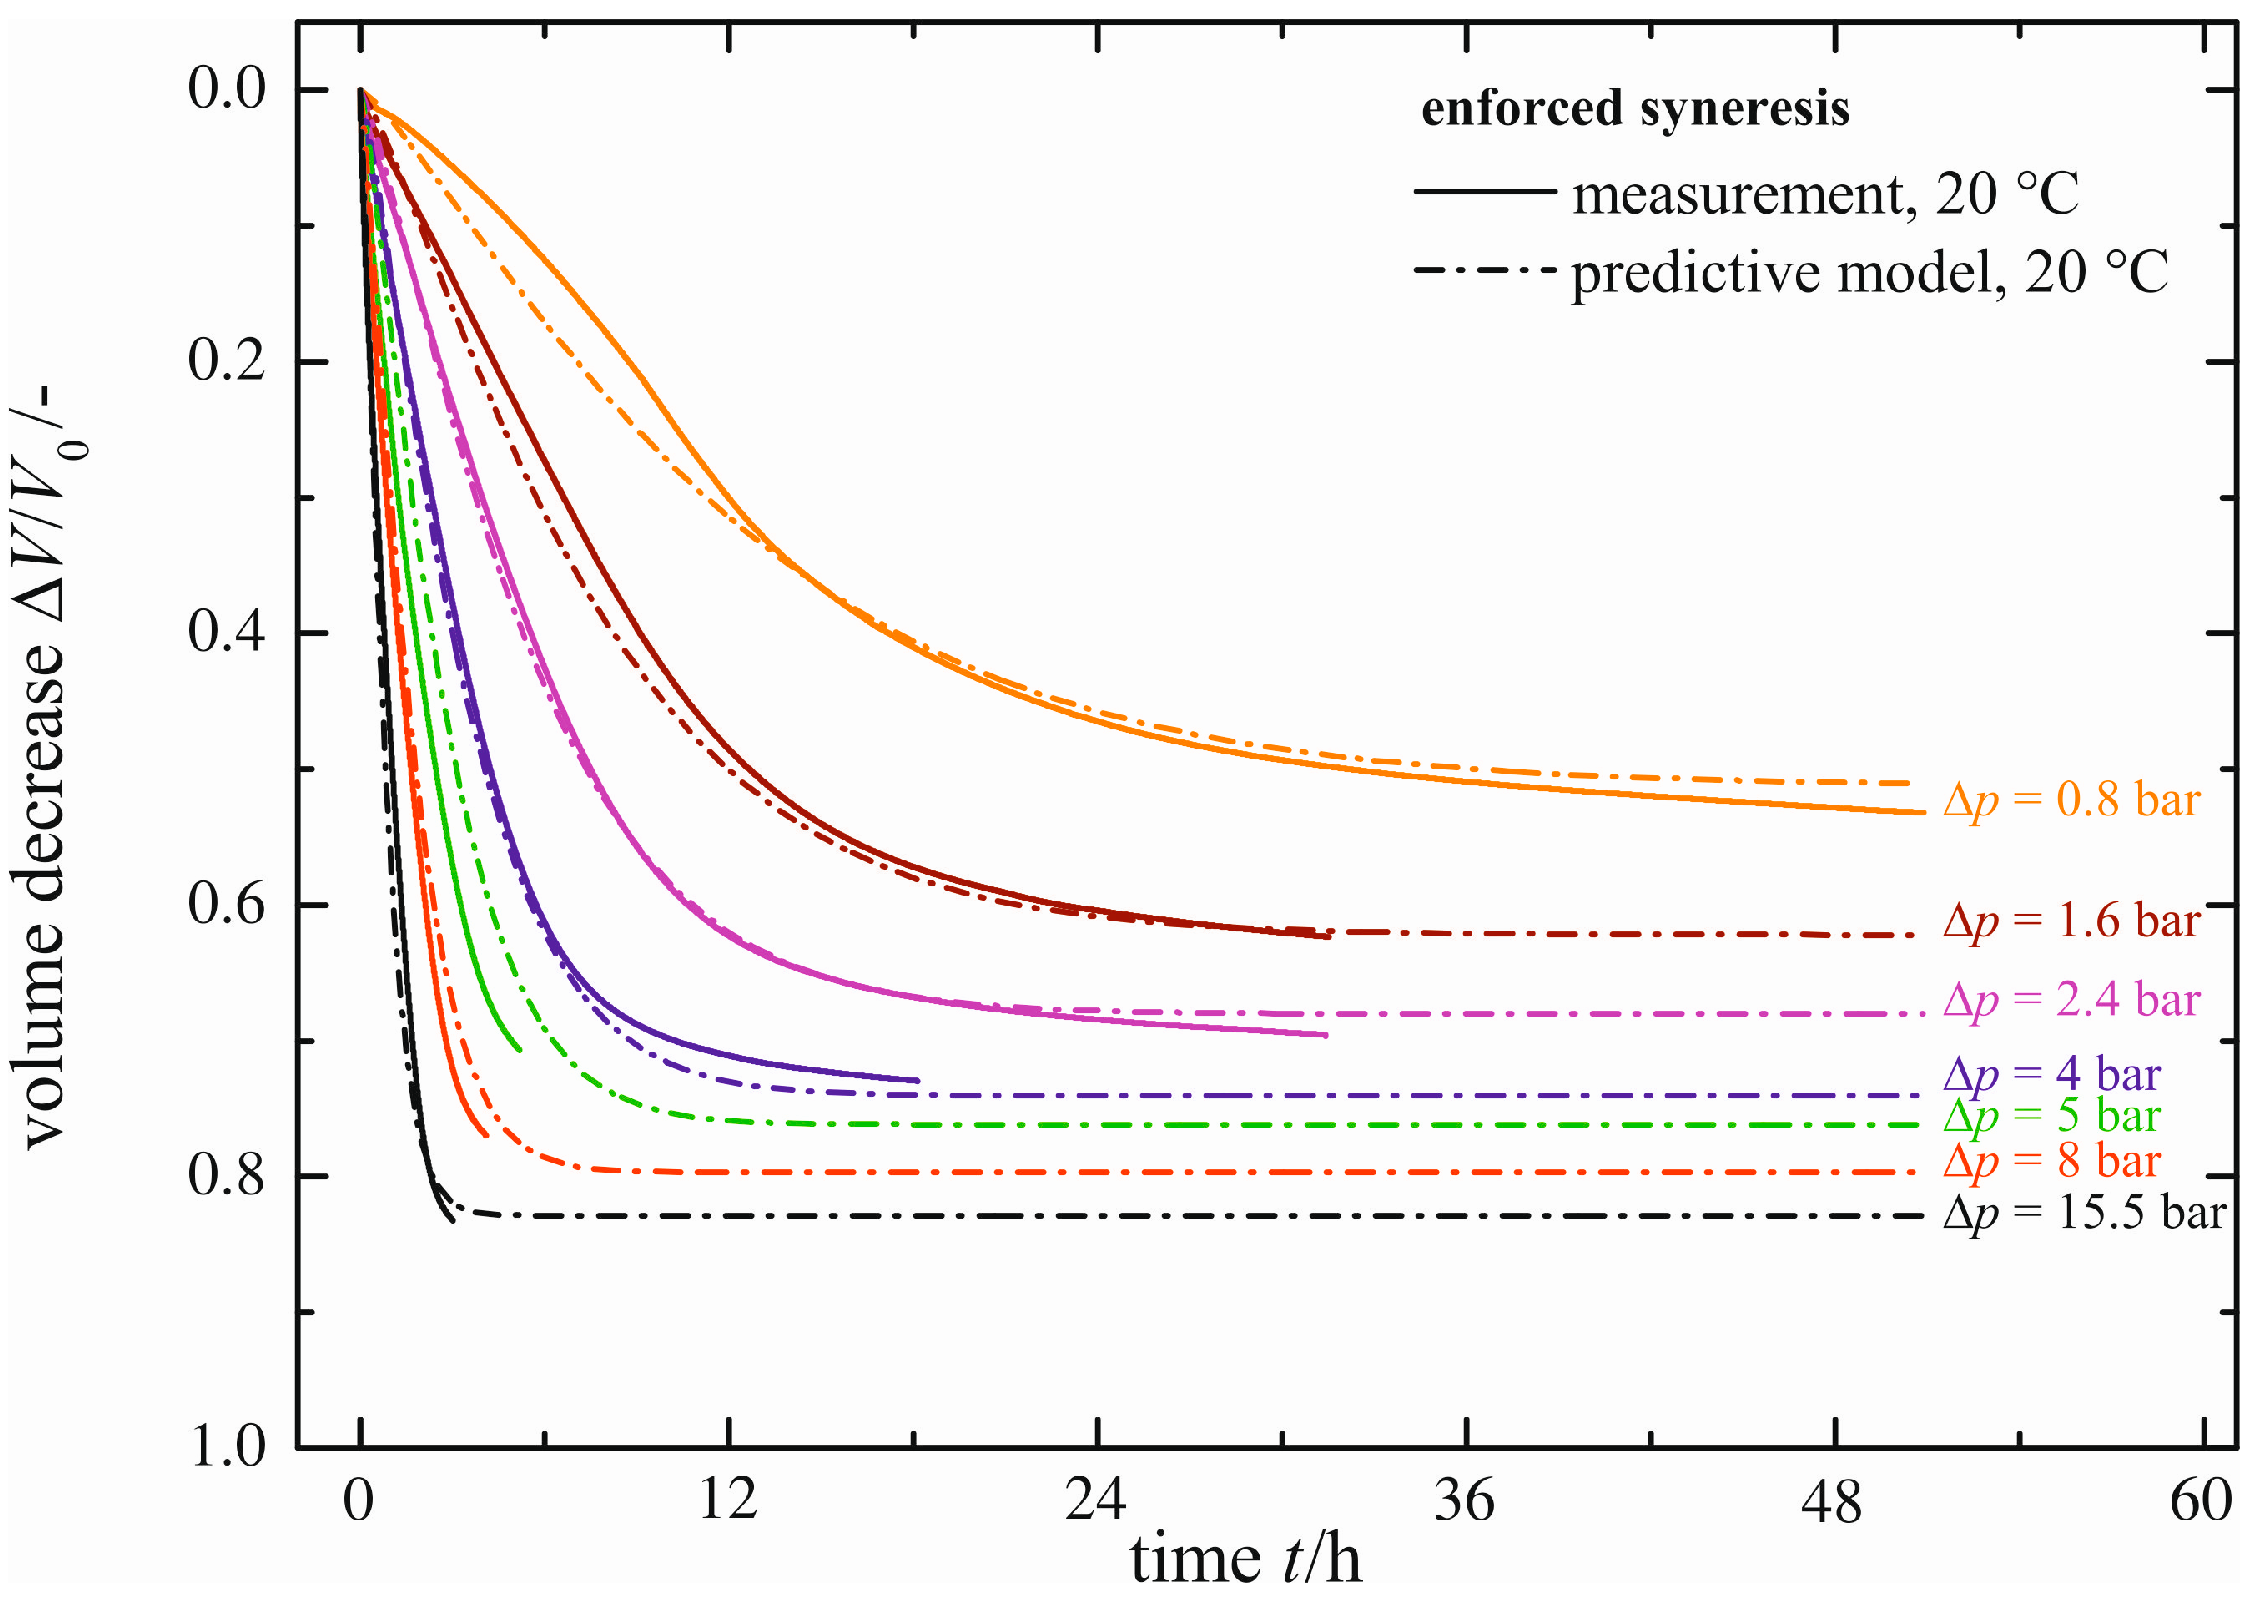
 Figure 11.
Table 4. Fitting parameters and fitting errors for characteristic time constant τ.
Temperature ϑ/°CParameter DParameter EFitting Error R2
201.38−1.200.965
401.14−1.310.986
600.85−1.310.971
Figure 11. Comparison between measured and predicted progress of enforced syneresis for ϑ = 20 °C.
Polymers 06 02896 g011
There is good agreement between measured and predicted syneresis. Though, in the case of Δp = 0.8 bar and Δp = 2.4 bar, the prediction model underestimates minimally the maximum volume decrease (ΔV/V0)max. This is due to the fit of the maximum volume decrease, as shown in Figure 9. The characteristic time constant τ is calculated with adequate precision, resulting in negligible differences of the rate between measured and predicted syneresis. For the comparison at higher temperatures of ϑ = 40 and ϑ = 60 °C, we refer to Figure S1. The maximum volume decrease (ΔV/V0)max calculated is in good accordance with the measured values, but the course of syneresis is not predicted correctly for every pressure difference Δp. This is due to the disagreement between measured and fitted data, shown in Figure 10. In summary, the enforced syneresis, depending on temperature ϑ and on the pressure difference Δp, can be predicted with minor deviations.
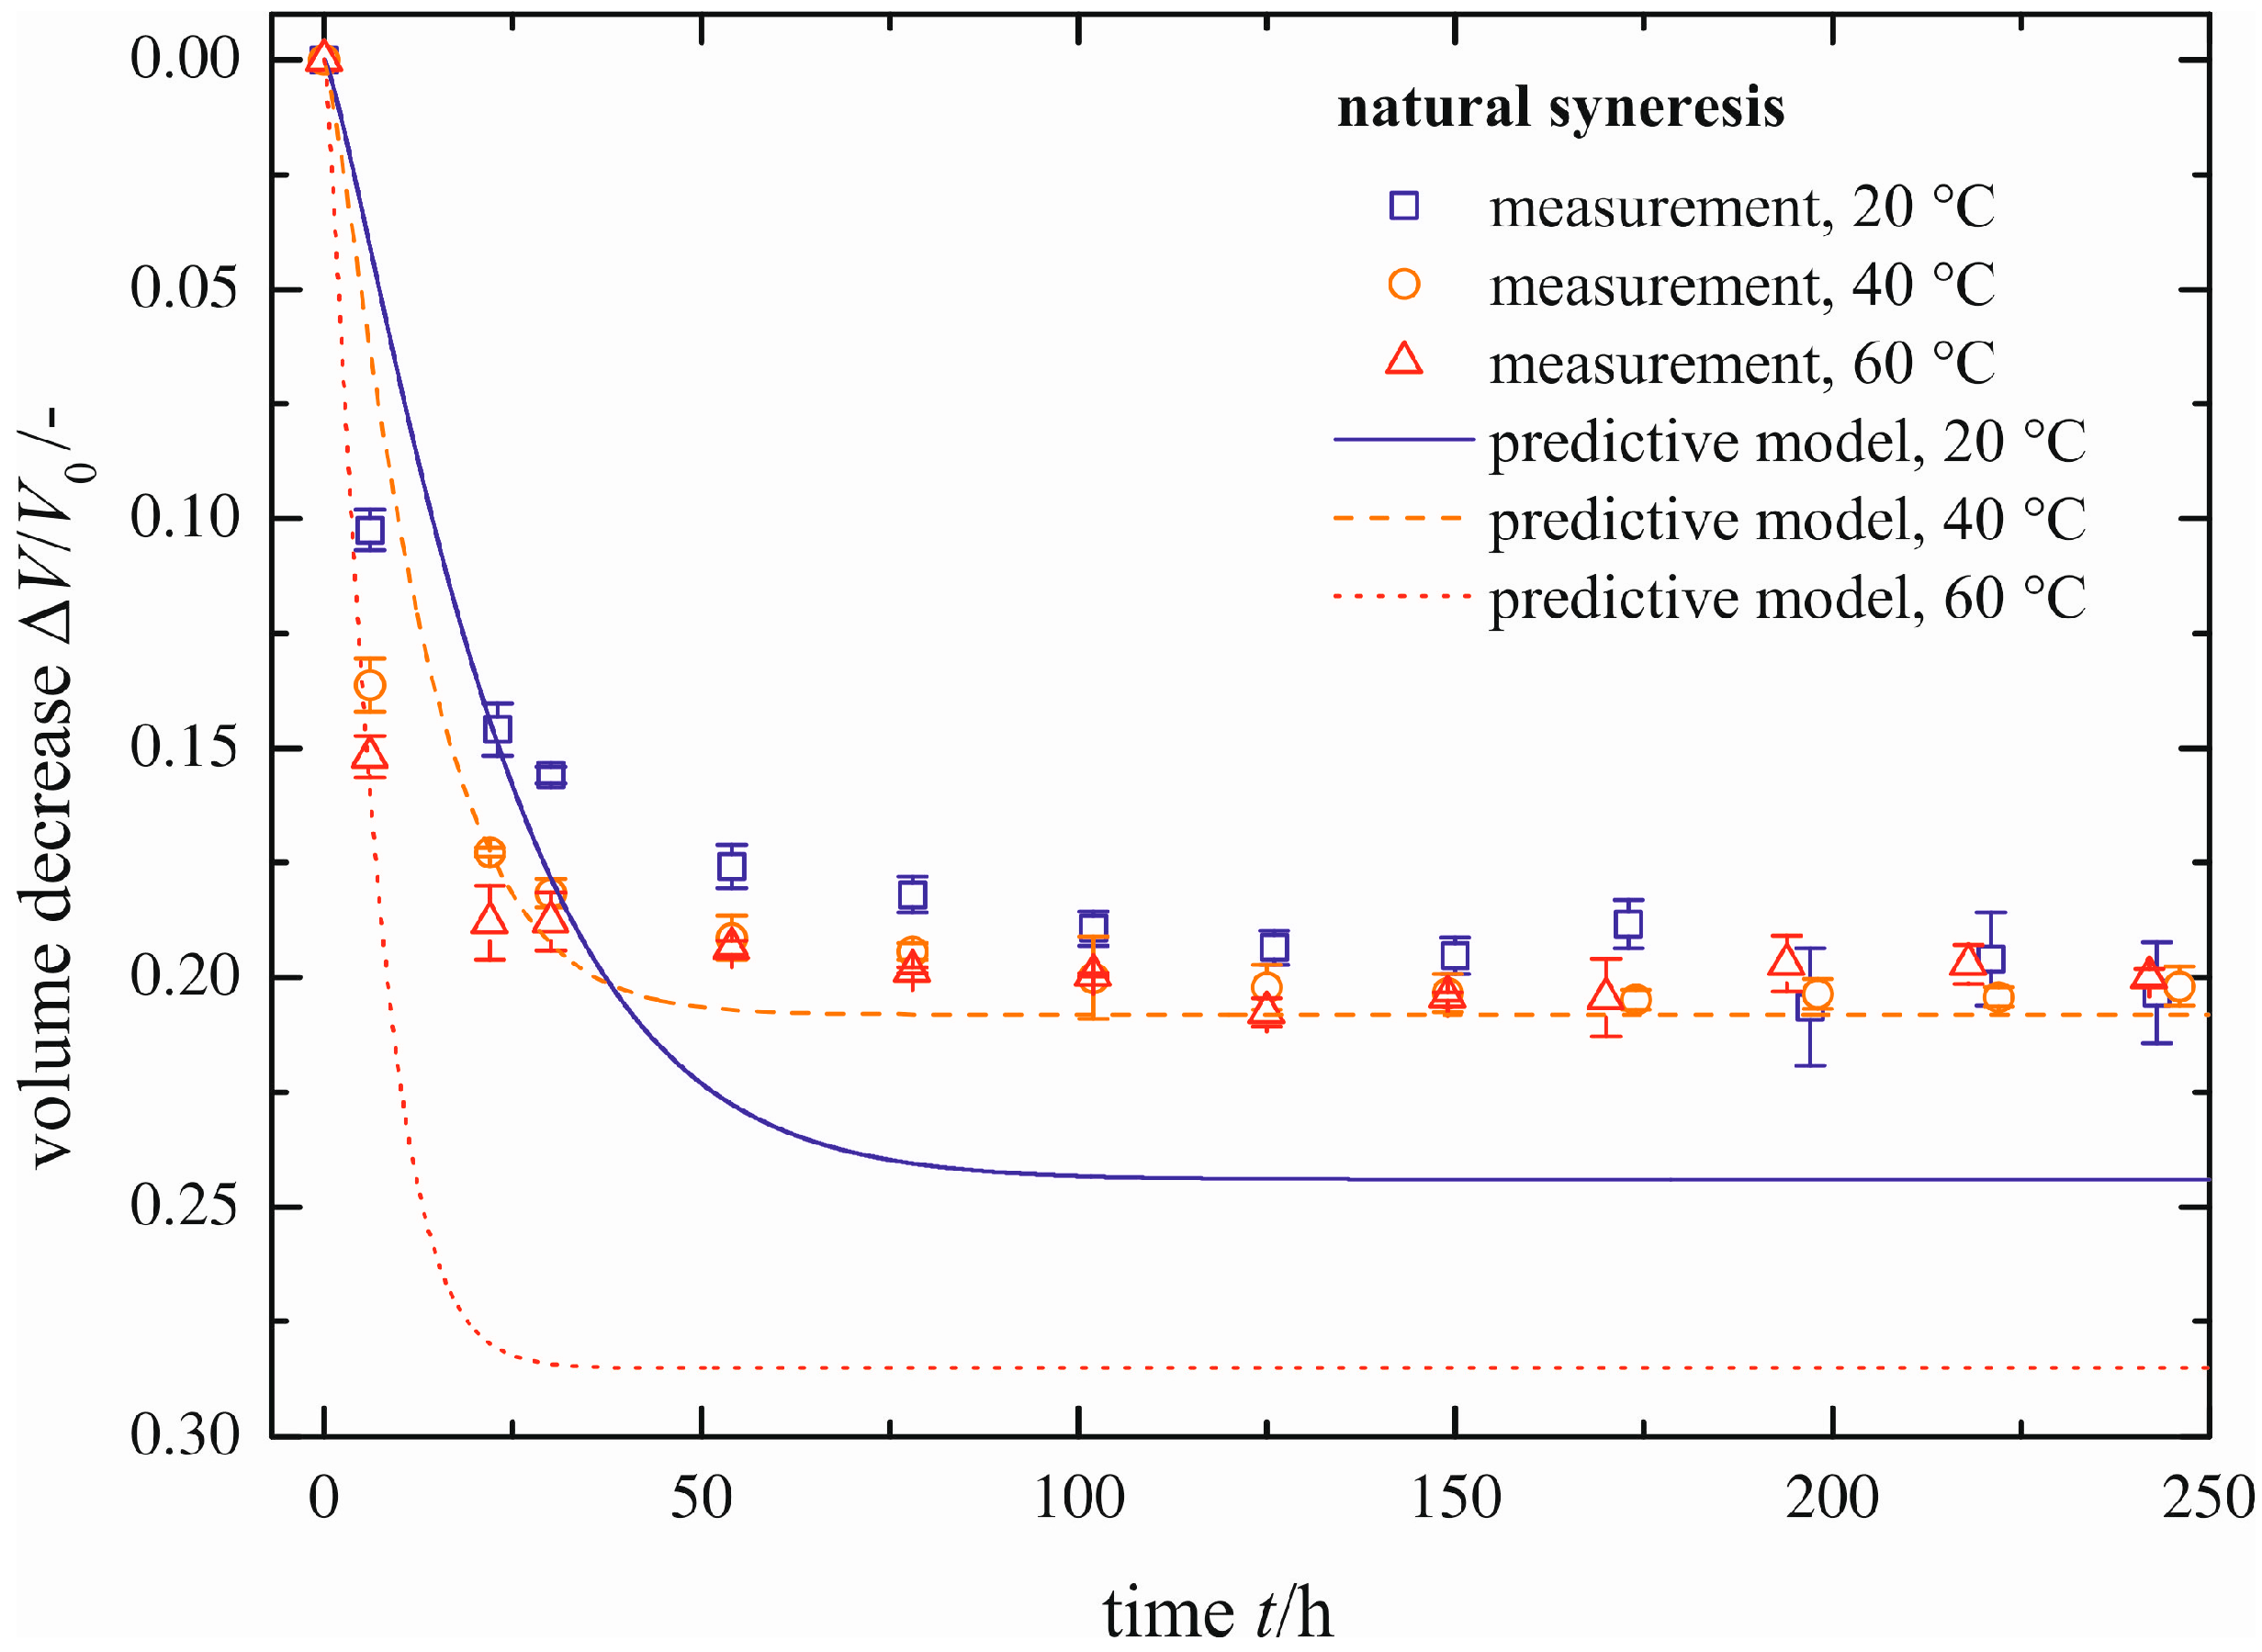
In addition to the determination of enforced syneresis, the predictive model developed is used to calculate the process of natural syneresis with respect to the maximum volume decrease (ΔV/V0)max and the rate (represented by τ). The comparison between measured and predicted natural syneresis is given in Figure 12. The rate is predicted with good agreement with the measurements (represented by the blank symbols, already shown in Figure 6). With increasing temperature ϑ, the predicted rate of syneresis increases. The maximum volume decrease (ΔV/V0)max cannot be calculated correctly for all temperatures, as may have been already concluded from Figure 9. The relative errors of 25% and 45% are caused by these deviations. This is expressed in the differences to the measured values of volume decrease for ϑ = 20 and ϑ = 60 °C. To compensate for that, more data in the important region of low pressure differences Δp are necessary.
Figure 12. Comparison between measured and predicted progress of natural syneresis.
Polymers 06 02896 g012

5. Summary and Conclusions

Precipitated silica is produced by mixing sodium silicate and sulfuric acid. The monomeric silicic acid formed polymerizes to solid silica particles. These particles restructure result in, for instance, a volume decrease, due to the continuing polymerization, even after they have formed. This slow process is known as “natural” syneresis. An adapted pycnometer device is proposed for the measurement of the maximum volume decrease and its rate in order to investigate the influence of process parameters. Here, the temperature dependency of natural syneresis is investigated (ϑ = 20, 40, 60 °C). It is found that the rate of natural syneresis increases with temperature due to a higher reaction rate of the polymerization. Contrarily, the maximum volume decrease is almost unaffected ((ΔV/V0)max ≈ 0.2). A long measuring time in the order of days is required to obtain these data.
The slow process of natural syneresis can be accelerated (“enforced” syneresis) by applying an external force to the gel, resulting in an induced pressure difference Δp between the gel sample and the environment. The maximum volume decrease and its rate are raised strongly, because the pressure difference Δp superimposes the forces of natural syneresis inside the sample. As a direct consequence of the increased rate, the demand of time for investigations is reduced considerably. However, a maximum volume decrease of (ΔV/V0)max ≈ 0.87 for Δp = 15.5 bar is achieved after a few hours. An increasing temperature results in higher syneresis rates, but in unchanged maximum volume decreases, as already determined for natural syneresis. A reduced pressure difference Δp leads to smaller maximum volume decreases (ΔV/V0)max ≈ 0.53 for Δp = 0.8 bar) and rates of syneresis.
An empirical predictive model is proposed to connect the two processes of natural and enforced syneresis of silica. That model consists of two model parameters. The first parameter accounts for the maximum volume decrease (ΔV/V0)max, while the rate of syneresis is considered by modeling the second parameter, which is a characteristic time constant τ. These two parameters of the prediction model are determined with the data acquired previously. In particular, the parameters are modeled as a function of the pressure difference Δp applied for the temperatures investigated. The enforced syneresis is reproduced with good agreement with the experiments. The process of natural syneresis is predicted by setting the pressure difference Δp applied to zero. Thereby, the characteristic time constant τ is calculated suitably, so that the predicted rates of syneresis correspond to the measured ones. However, the maximum volume decrease (ΔV/V0)max cannot be calculated correctly for all temperatures investigated. Maximum relative errors of about 45% occur. To account for that, future measurements of enforced syneresis at even lower pressure differences than Δp = 0.8 bar appear appropriate.
In order to produce precipitated silica with stable product properties, it is necessary to influence the polymerization reaction. By stopping it, for instance, due to a substitution of uncondensed hydroxyl groups with methylene groups, silica particles could be produced whose volumes would not decrease with time anymore. The concept of enforced syneresis and the predictive model presented are useful tools for a faster analysis of the syneresis processes and an identification of suitable substituents. It will also be applied to basic precipitated silica to account for different pH values. Furthermore, the model may help to understand the kinetics of syneresis based on first principles.

Symbols

A, B, C, D, E
model parameter, various
cSi(OH)4
concentration of Si(OH)4, mg/L
c Si ( OH ) 4 *
saturation concentration of Si(OH)4, mg/L
d
diameter, mm
F
force, N
κ
electrical conductivity, µS/cm
m
mass, g
n
model parameter, exponent
p*
auxiliary pressure (p* = 1 bar)
Δp
pressure difference, bar
t
time, h
τ
model parameter, characteristic time constant, h
V
volume, mL
ΔV
volume change, mL
ϑ
temperature, °C

Indices 

extra
extrapolated
gel
gel
fill
filling
max
maximum
0
initial

Supplementary Materials

Supplementary materials can be accessed at: https://www.mdpi.com/2073-4360/6/12/2896/s1.

Acknowledgments

This research project is financially supported by the German Research Foundation, DFG (Deutsche Forschungsgemeinschaft), within the priority program “Schwerpunktsprogramm 1273 Kolloidverfahrenstechnik” (number KI 709/22-3, colloid process engineering). We would like to thank the assisting students who performed parts of the measurements and our colleagues for advice. We acknowledge support by Open Access Publishing Fund of Karlsruhe Institute of Technology.

Author Contributions

Sebastian Wilhelm and Matthias Kind conceived of and designed the experiments and wrote the paper. Sebastian Wilhelm performed the experiments, assisted by students, and analyzed the data.

Conflicts of Interest

The founding sponsors had no role in the design of the study, in the collection, analyses or interpretation of data, in the writing of the manuscript and in the decision to publish the results.

References

  1. Brinker, C.J.; Scherer, G.W. Sol-Gel Science—The Physics and Chemistry of Sol-Gel Processing; Academic Press, Inc.: San Diego, CA, USA, 1990. [Google Scholar]
  2. Quarch, K. Produktgestaltung an kolloidalen Agglomeraten und Gelen—Gelierung und Fragmentierung Anorganisch Gefällten Siliciumdioxids; KIT Scientific Publishing: Karlsruhe, Germany, 2010. (In German) [Google Scholar]
  3. Vysotskii, Z.Z.; Strazhesko, D.N. Isoelectric state of disperse silicas and ion exchange in acid solutions. Adsorpt. Adsorbents 1973, 1, 55–71. [Google Scholar]
  4. Sahabi, H.; Kind, M. Consolidation of inorganic precipitated silica gel. Polymers 2011, 3, 1423–1432. [Google Scholar] [CrossRef]
  5. Schlomach, J. Feststoffbildung bei Technischen Fällprozessen—Untersuchungen zur Industriellen Fällung von Siliziumdioxid und Calciumcarbonat; Universitätsverlag Karlsruhe: Karlsruhe, Germany, 2006. (In German) [Google Scholar]
  6. Iler, R.K. The Chemistry of Silica—Solubility, Polymerization, Colloid and Surface Properties, and Biochemistry; John Wiley & Sons: New York, NY, USA, 1978. [Google Scholar]
  7. Bergna, H.E. The Colloid Chemistry of Silica; American Chemical Society: Washington, DC, USA, 1994. [Google Scholar]
  8. Zerda, T.W.; Artaki, I.; Jonas, J. Study of polymerization processes in acid and base catalyzed silica sol-gels. J. Non-Cryst. Solids 1986, 81, 365–379. [Google Scholar]
  9. Okkerse, C. Physical and Chemical Aspects of Adsorbents and Catalysts; Linsen, B.G., Fortuin, J.M.H., Okkerse, C., Steggerda, J.J., Eds.; Academic Press: New York, NY, USA, 1970. [Google Scholar]
  10. Ponomareva, T.P.; Kontorovich, S.I.; Chekanov, M.I.; Shchukin, E.D. Kinetics of shrinkage during formation of polysilicic acid hydrogel structures. Colloid J. USSR 1984, 46, 118–120. [Google Scholar]
  11. Haselhuhn, F.; Kind, M. Pseudo-polymorphic behavior of precipitated calcium oxalate. Chem. Eng. Technol. 2003, 26, 347–353. [Google Scholar]
  12. VDI-Heat Atlas; Springer-Verlag: Berlin, Germany, 2010.

